Article

Simultaneous Determination of PMS, PDS, and H2O2 Concentrations with Multi-Step Iodometry

School of Water Conservancy and Civil Engineering, Northeast Agricultural University, Harbin 150030, China
*
Authors to whom correspondence should be addressed.
Water 2023, 15(12), 2190; https://doi.org/10.3390/w15122190
Submission received: 4 May 2023 / Revised: 7 June 2023 / Accepted: 8 June 2023 / Published: 10 June 2023

Abstract

:
Peroxodisulfate (PDS), peroxymonosulfate (PMS), and hydrogen peroxide (H2O2) might coexist in a persulfate system. It leads to the mutual interference in concentration determination due to their similar structures. Simultaneous detection of the three peroxides involves limited reporting. Herein, a multi-step iodometry was established to simultaneously determine the concentrations of PDS, PMS, and H2O2 coexisting in a solution. Firstly, molybdate–NaHCO3-buffered iodometry was proposed to uplift the overall detection of peroxides since the recovery rate of H2O2 was unexpectedly lower in the peroxide mixture than in the single H2O2 solution with reported NaHCO3-buffered iodometry. Then, multi-step iodometry was proposed based on the established molybdate–NaHCO3-buffered iodometry using the combination with catalase and revised acetate-buffered iodometry (pH 3). The multi-step iodometry determined the coexisting PMS, PDS, and H2O2 with the recovery rate of 95–105% and a standard deviation of ≤7% of two replicates at the individual centration of 13–500 μmol∙L−1. The recovery rates of peroxides were within 95–105% at pH 3–11 and within 90–110% in the presence of Cl (0–150 mg∙L−1), F (0–1.5 mg∙L−1), SO42− (0–150 mg∙L−1), or NO3 (0–20 mg∙L−1). The recovery rate of H2O2 was lowered down to 91% or 87% in the sample containing 100 mg/L Ca2+ or Mg2+, respectively, but was lifted up to 100% or 93% once pretreated by adding 0.11–1.06 g∙L−1 Na2CO3. In the background of tap water, surface water, and ground water, peroxides were all detected in 90–110%, which indicates the applicability of multi-step iodometry in real waters.

Graphical Abstract

1. Introduction

Peroxodisulfate (PDS)- and peroxymonosulfate (PMS)-based advanced oxidation processes (AOPs) have attracted great interest due to the production of highly reactive radicals (SO4•− and HO) and their effectiveness in degrading various pollutants [1,2]. Accompanying the increasing use of persulfate (PMS and PDS) for remediation of contaminated soil and water, the on-site/off-site detection of persulfate concentration is inevitable and necessary in the theoretical analysis on decontamination mechanisms or oxidant efficiency assessment in applications.
In persulfate-based systems, SO4•− and HO usually coexist [3]. Mutual quenching of the radicals would produce PDS, PMS, and H2O2 in a single solution. In the case of PMS-based AOPs, PDS could also be formed from the decay of the peroxymonosulfate radical (SO5•−), which was produced from PMS by the attack of radicals (including SO4•−, HO, the chlorine atom (Cl), and the dichloride radical (Cl2•−)) [4]. Meanwhile, PDS was hydrolyzed to PMS and subsequent H2O2 under alkaline or strong acidic conditions [5,6]. Therefore, during PMS- or PDS-related decontamination processes, it is possible that the three peroxides, H2O2, HSO5, and S2O82−, are present in a solution simultaneously. Recently, the coupling of peroxides was used as a way to produce reactive oxidants in decontamination. The combination of PDS and H2O2 was investigated for the in situ remediation of ortho-nitrochlorobenzene in soil with SO4•− and HO as reactive species [7]. The mixing of PMS and H2O2 mutually accelerated their decomposition and produced the oxidative species singlet oxygen [8]. PMS, PDS, and H2O2 have a similar structure to the -O-O- bond, which leads to the mutual interference in concentration determination when coexisting. Additionally, the development of methods to simultaneously determine the concentrations of peroxides in their mixture deserves attention.
Previous studies mainly focused on the detection of a single oxidant. A single PMS solution was determined with acetate-buffered iodometry [9], the ABTS method [10], ion chromatography [6], liquid chromatography [11], and BA fluorometry [12]. PDS was measured with NaHCO3-buffered iodometry [13] and sulfate acid iodometry [5]. Hydrogen peroxide (H2O2), a similar peroxide, was measured with molyadate–iodide spectrophotometry [14], KMnO4 titration [14], the titanate complex method [15], and DPD spectrometry [16].
For the determination of mixed peroxides, research has touched upon the determination of the mixture containing two peroxides. In the solution containing PDS and H2O2, H2O2 concentration was quantified photometrically using the complexation with titanium sulfate while the concentration of PDS was obtained with subtracting the H2O2 concentration from the total concentration, which was determined by iodometric titration [6]. Similarly, the detection of PMS and H2O2 in their mixture was realized with the combination of the ABTS method and horseradish peroxidase. The PMS concentration was measured with the ABTS method alone while H2O2 was determined with the difference between the two measurements using the ABTS method in the presence and absence of horseradish peroxidase [8]. For the mixture of PMS, PDS, and H2O2, ion chromatography [6] and BA fluorometry [12] were used to measure the concentration of PMS in the mixture without the determination of PDS and H2O2. The available method for simultaneous determination of the concentrations of PMS, PDS, and H2O2 was established by Boudeville (1983) based on thermometric titrimetry [17]. PMS, PDS, and H2O2 concentrations were measured within the range of 100–1000 μmol∙L−1. The titration was operated under strongly acidic conditions (4–5 mol∙L−1 H2SO4). Under the conditions, PDS would hydrolyze to PMS [5], which should be considered during the determination.
In this work, a method based on iodometric titration was developed for the simultaneous determination of PMS, PDS, and H2O2 coexisting in a solution. Firstly, the unexpectedly low overall detection of peroxides in the mixture was observed with reported NaHCO3 buffered iodometry, and was further uplifted by increasing the KI dosage or adding molybdate. Additionally, molybdate–NaHCO3-buffered iodometry was further proposed by optimizing the reaction time, KI, and molybdate dosages. Secondly, the multi-step iodometric titration was proposed based on the established molybdate–NaHCO3-buffered iodometry using the combination with catalase (from a bovine liver) and revised acetate-buffered iodometry. Additionally, the detection ranges and detection limits were further determined. Finally, the detection of peroxides (PMS, PDS, and H2O2) simultaneously existing in a single solution with the multi-step iodometry was performed in the presence of common ions, under various pH conditions, or in the background of real waters.

2. Materials and Methods

2.1. Chemicals and Reagents

Peroxymonosulfate (KHSO5·0.5 KHSO4·0.5 K2SO4, PMS), peroxodisulfate (K2S2O8, PDS), sodium bicarbonate, catalase (from bovine liver), sodium dihydrogen phosphate anhydrous, sodium phosphate dibasic, and potassium hydroxide were purchased from Sigma-Aldrich (Shanghai, China). Hydrogen peroxide (H2O2, 35% w/w) was purchased from Alfa Aesar (Haverhill, MA, USA). Calcium chloride anhydrous, magnesium sulfate anhydrous, ammonium molybdate tetrahydrate ((NH4)6Mo7O24·4H2O), and starch were purchased from Tianjin Tianli Chemical Reagent Co., Ltd. (Tianjin, China). Acetic acid was purchased from Tianjin Kemeo Chemical Reagent Co., Ltd. (Tianjin, China). Other chemicals were purchased from Shanghai Sinopharm Chemical Reagent Co., Ltd. (Shanghai, China). All chemicals and reagents were of analytical grade and used without any further purification. Solutions were prepared in Milli-Q water produced by the Milli-Q® Biocel (Millipore, Billerica, MA, USA) water system unless otherwise stated.

2.2. Experimental Procedures

All experiments were carried out in a 250 mL conical flask with a total solution volume of 100 mL at 25 ± 2 °C. Predetermined volume of 0.1 mol∙L−1 H2SO4 or NaOH solution was added to imitate the scenarios of different pH samples of the mixed peroxide (PMS, PDS, and H2O2) solution if needed. The mixture of PMS, PDS, and H2O2 was simulated by the sequential addition of PMS, PDS, and H2O2 stock solutions. Generally, the multi-step iodometric determination of PMS, PDS, and H2O2 concentrations in the peroxide mixture included 3 steps. Sample was divided into 3 equivalent parts. In Step I, the first part was treated with NaHCO3 (with or without molybdate)-buffered iodometry to obtain the total concentration of the three peroxides. In Step II, the second part of sample was treated with catalase and NaHCO3 (with or without molybdate)-buffered iodometry to obtain the sum of PMS and PDS concentrations. In Step III, the third part of sample was treated with catalase and revised acetate-buffered iodometry to obtain PMS concentration. Experiments were performed at least in duplicate and error bar represents the standard deviation of replicates. For details, see Supplementary Text S1.

2.3. Analytical Methods

Concentration of PMS stock solution was standardized with acetate-buffered iodometric titration with reaction time of 5 min for KI and PMS [9]. For revised acetate-buffered iodometry used in Step III of multi-step iodometry, everything was kept unchanged except that the reaction time was set as 2 min. For detailed experimental procedure, see Supplementary Text S2. PDS stock solution was quantified with NaHCO3-buffered iodometry with 132 g∙L−1 KI [13]. For details, see Supplementary Text S3. Molybdate–NaHCO3-buffered iodometry used in Steps I and II of multi-step iodometry was established in the current work based on NaHCO3-buffered iodometry with introduction of molybdate as described in Section 3.3.1. Concentration of H2O2 stock solution was standardized based on spectrophotometric iodometry with ε(I3) = 25,800 M−1∙cm−1 at λ = 351 nm [14]. The concentrations of anions in real waters were determined with ion chromatography (Metrohm 930, Metrohm, Herisau, Switzerland) with the eluent composed of 3.2 mmol∙L−1 Na2CO3 and 1.0 mmol∙L−1 NaHCO3. Dissolved organic carbon (DOC) was measured with a Vario TOC analyzer (Elementar, Langenselbold, Germany). Tap water was collected from the laboratory in Northeast Agricultural University. Surface water was obtained from Songhua River in Harbin City (45°48′13.59″ N, 126°32′5.88″ E) and ground water was collected from a ground water well in Harbin City (45°37′20.9″ N, 126°32′59.8″ E).

3. Results and Discussion

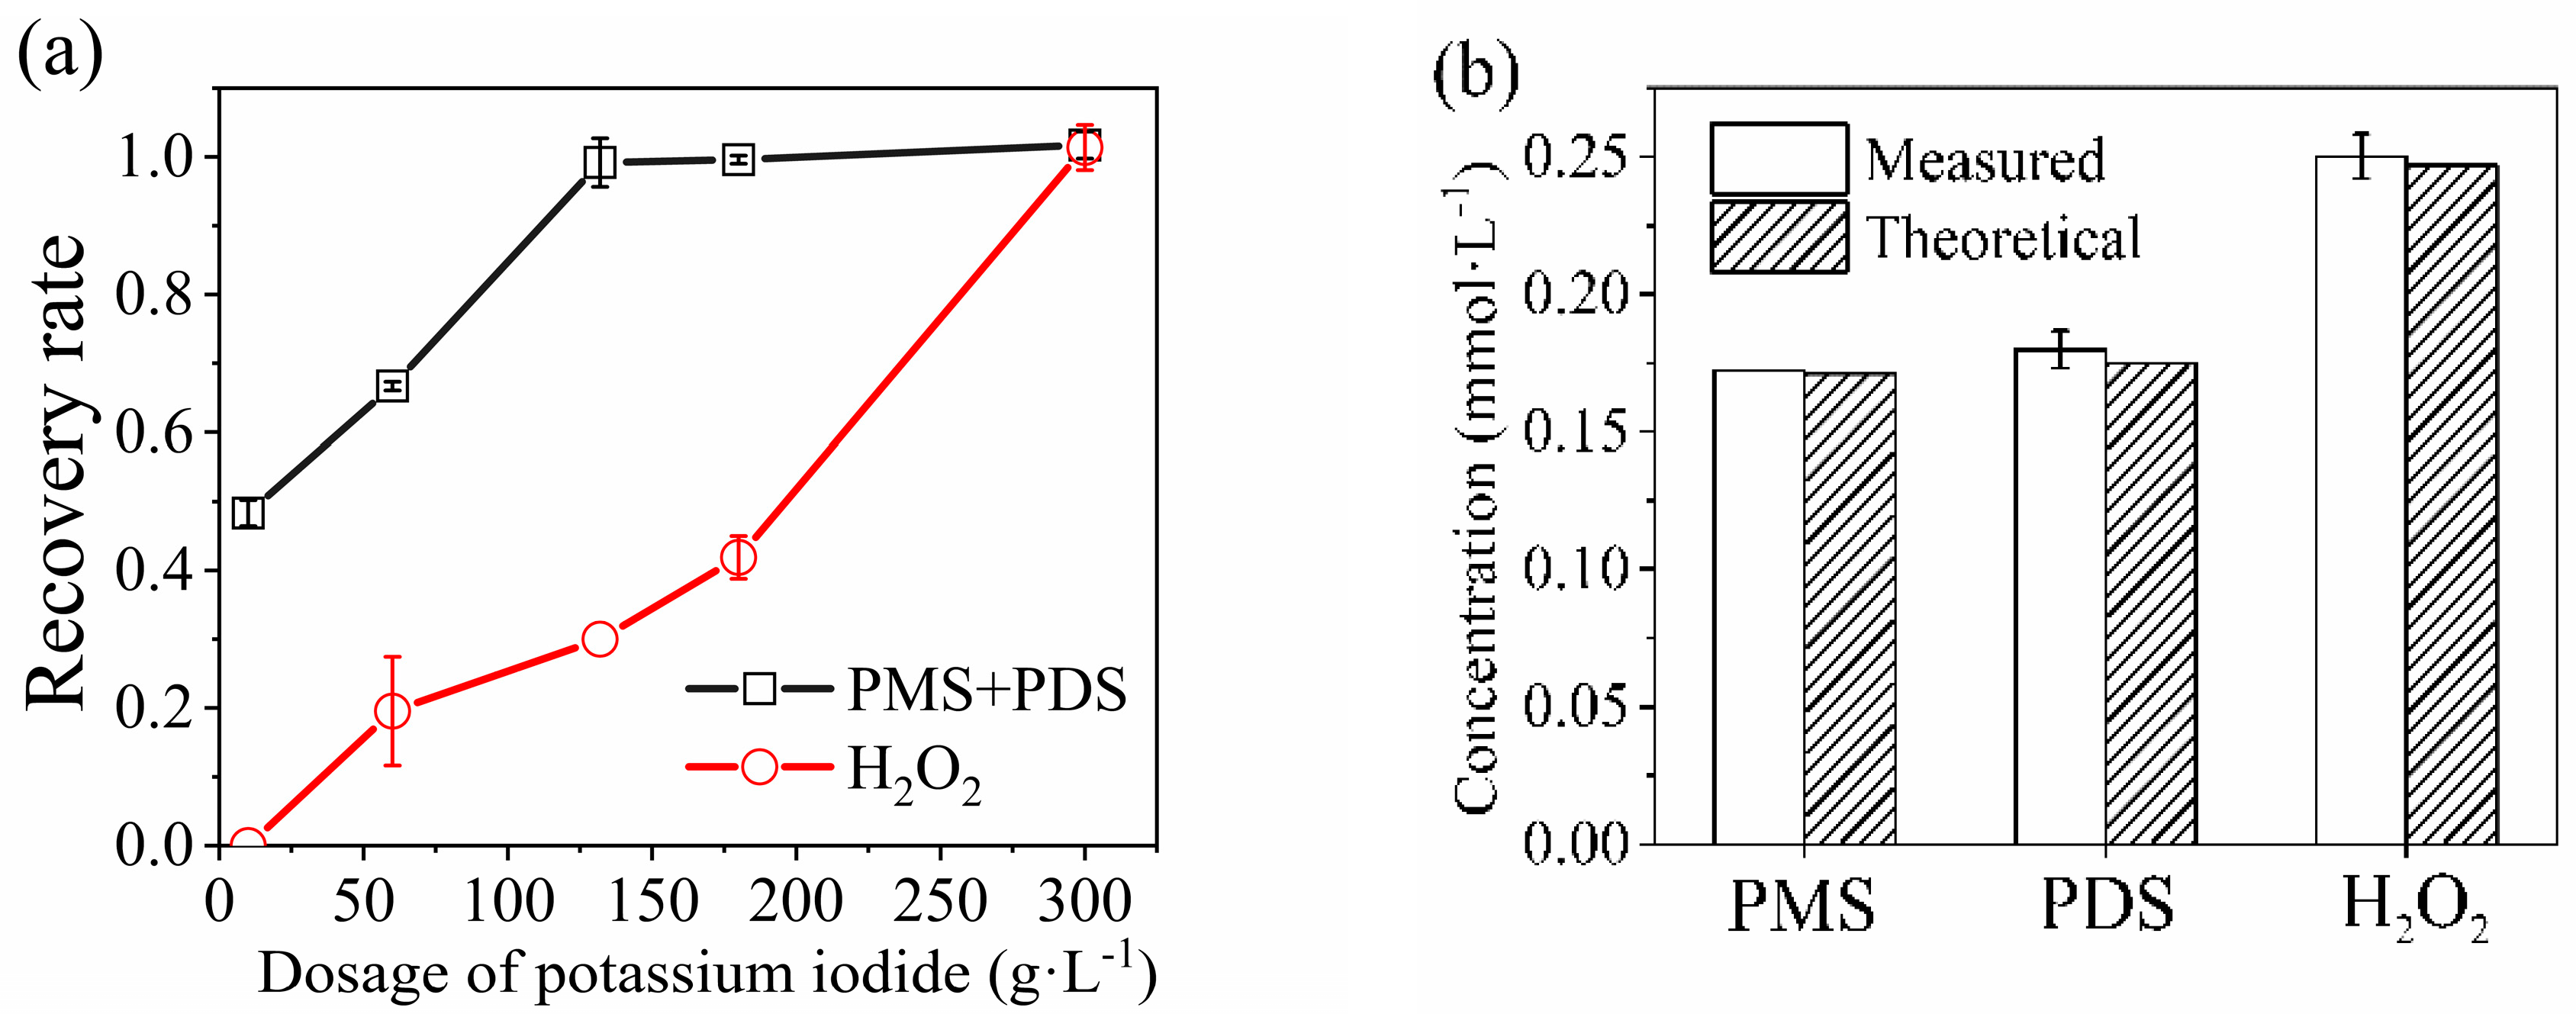
3.1. Unexpected Low Recovery Rate of H2O2 in Peroxide Mixture

The recovery rates of H2O2, PDS, and PMS in their separate solution with NaHCO3-buffered iodometry (132 g∙L−1 KI) were 87.03 ± 3.66%, 100.00 ± 0%, and 102.38 ± 0%, respectively (Table S1). Meanwhile, PDS and PMS were detected at 1.34 ± 0.09% and 99.44 ± 0%, respectively, with revised acetate-buffered iodometry in their solo solutions. The concentration of H2O2 could not be accurately determined with the revised acetate-buffered iodometry due to the indistinguishable end point of titration. This may be due to the low reaction rate of H2O2 with KI and the slow release of I2/I3 under the condition of the acetic acid solution.
The almost complete detection of peroxides with NaHCO3-buffered iodometry in their individual solutions and rare detection of PDS with revised acetate-buffered iodometry indicated that the feasibility of H2O2, PDS, and PMS in their mixed solution could be determined with the combination of revised acetate-buffered iodometry and NaHCO3 buffered-iodometry with catalase (from a bovine liver) as the process of the multi-step iodometric determination described in Experimental Procedures. H2O2, in the mixed solution, was decomposed by catalase in Steps II and III. It was expected that the H2O2 concentration would be quantified by the difference of the peroxide concentrations titrated in Step I and Step II. The PDS concentration was the concentration difference between Step II and Step III. The PMS concentration was the value of the peroxide concentration determined in Step III.
The recovery rate of H2O2 was just 27.43 ± 0.34% in the mixture of 0.634 mmol∙L−1 H2O2, 0.500 mmol∙L−1 PDS, and 0.630 mmol∙L−1 PMS (Scenario 1, Table S2). It was much lower than 87.03 ± 3.66% in the single H2O2 solution (Table S1). When the total peroxide concentration (0.559 mmol∙L−1) in the mixture was lowered down to less than the concentration of the single H2O2 solution (0.62 mmol∙L−1), the recovery rate of H2O2 in the mixed solution was still 30.00 ± 0% (Scenario 2, Table S2). Under the two conditions, PDS and PMS were well detected in the range of 98–100% (Table S2). It excluded the possibility that the depletion or insufficiency of KI led to the low detection of H2O2 in the mixture. Huang et al. (2018) also observed that the addition of H2O2, whether alone or together with PDS, eliminated the absorbance of the PMS solution at 352 nm in KI spectrophotometry, making the analytical method inoperable [12]. Furman et al. (2010) reported that PDS could react with H2O2 to generate SO4•− [6]. Meanwhile, Yang et al. (2018) found that PMS could react with H2O2 to generate O2 [8]. In addition, the self-decomposition of PMS proceeded through a transition state of the intermediate complexes from its monovalent anion (HSO5) and divalent anion (SO52−), and then generated O2 [18]. It is inferred that the low detection of H2O2 in the peroxide mixture may be due to the complexation of H2O2 with PDS and PMS in the mixture. Additionally, the complexation might slow down the reaction between peroxides and KI, resulting in the low overall conversion of peroxides into I2/I3 in the mixture in Step I.

3.2. Elevating the Recovery Rate of H2O2 in Peroxide Mixture

3.2.1. Increasing KI Dosage

The effect of the KI dosage in NaHCO3-buffered iodometry (Step I and Step II) on the detection of peroxides in the mixture was further studied. The overall recovery rate of PDS and PMS was 99–102% at KI dosage ≥ 132 g∙L−1 (Figure 1a). The recovery rate of H2O2 increased with the KI dosage and reached 101.37 ± 3.29% at 300 g∙L−1 KI. The increase in the KI dosage might accelerate the reaction between free peroxides and I, and consequently promote the dissociation of PDS/PMS and H2O2 complexes, thereby facilitating the reactions between peroxides and I to form I2/I3 in the mixed solution. The high recovery rates of peroxides at 300 g∙L−1 KI indicate the almost complete conversion of peroxides into I2/I3. Furthermore, the recovery rates of PMS and PDS were measured as 100.53 ± 0% and 102.89 ± 3.86%, respectively, with combing the NaHCO3-buffered iodometry (300 g∙L−1 KI) and catalase with revised acetate-buffered iodometry (Figure 1b).

3.2.2. Adding Molybdate

Molybdate was used as a catalyst in H2O2 determination with molybdate–iodide spectrophotometry [14]. Additionally, it might enhance the conversion of peroxides into I2/I3 by accelerating the reaction between I and H2O2 and consequent dissociation of PDS/PMS and H2O2 complexes. Therefore, ammonium molybdate was added in the measurements of peroxides with NaHCO3-buffered iodometry (molybdate–NaHCO3-buffered iodometry). An orthogonal experimental design with three factors and three levels was used to determine the optimal parameters of molybdate–NaHCO3-buffered iodometry with the H2O2 recovery rate in the mixture as the objective. The factors and levels are given in Table S3. The addition of molybdate increased the H2O2 recovery rate from 30.00 ± 0% with NaHCO3-buffered iodometry (132 g∙L−1 KI and t1 = 15 min) (Table S2) to 94.76 ± 0.04% with molybdate–NaHCO3-buffered iodometry (132 g∙L−1 KI, 46 mg∙L−1 (NH4)6Mo7O24∙4H2O, and t1 = 15 min) (Table S4). The R value in Table S4 indicates that H2O2 detection was affected by the factors in the sequence of KI dosage > molybdate concentration > reaction time. The optimal recovery rate of H2O2 in the peroxide mixture was obtained at the condition of 132 g∙L−1 KI, 26 mg∙L−1 (NH4)6Mo7O24∙4H2O, and t1 = 5 min with molybdate–NaHCO3-buffered iodometry. Under the suggested conditions, the recovery rate of H2O2 was 92.36%.

3.3. Establishment of Multi-Step Iodometric Titration

3.3.1. Optimization of Operation Parameters in Molybdate–NaHCO3-Buffered Iodometry

PDS and PMS were simultaneously detected with molybdate–NaHCO3-buffered iodometry along with H2O2 in Step I or alone in Step II of multi-step iodometric titration. Therefore, the operation parameters in molybdate–NaHCO3-buffered iodometry were further investigated, considering both H2O2 detection and the overall detection of PMS and PDS. The reaction time barely changed the recovery rates of peroxides at t1 ≥ 15 min (Figure 2a). The optimal dosages of KI were obtained at KI ≥ 132 g∙L−1 (Figure 2b). The recovery rate of H2O2 stayed in the range of 94–98% at 18–46 mg∙L−1 (NH4)6Mo7O24·4H2O, with the highest value corresponding to 97.64% obtained at 26 mg∙L−1 (NH4)6Mo7O24·4H2O. Meanwhile, the addition of molybdate had almost no effect on the overall recovery rate of PDS and PMS at 0–46 mg∙L−1 (NH4)6Mo7O24·4H2O, which was stable around 100% (Figure 2c). Figures S1 and S2 also show that molybdate had little effect on the detection of the PMS or PDS single solution with molybdate–NaHCO3-buffered iodometry. Thus, 132 g∙L−1 KI and 26 mg∙L−1 (NH4)6Mo7O24·4H2O were added into the determination of peroxides with molybdate–NaHCO3-buffered iodometry with t1 = 15 min.

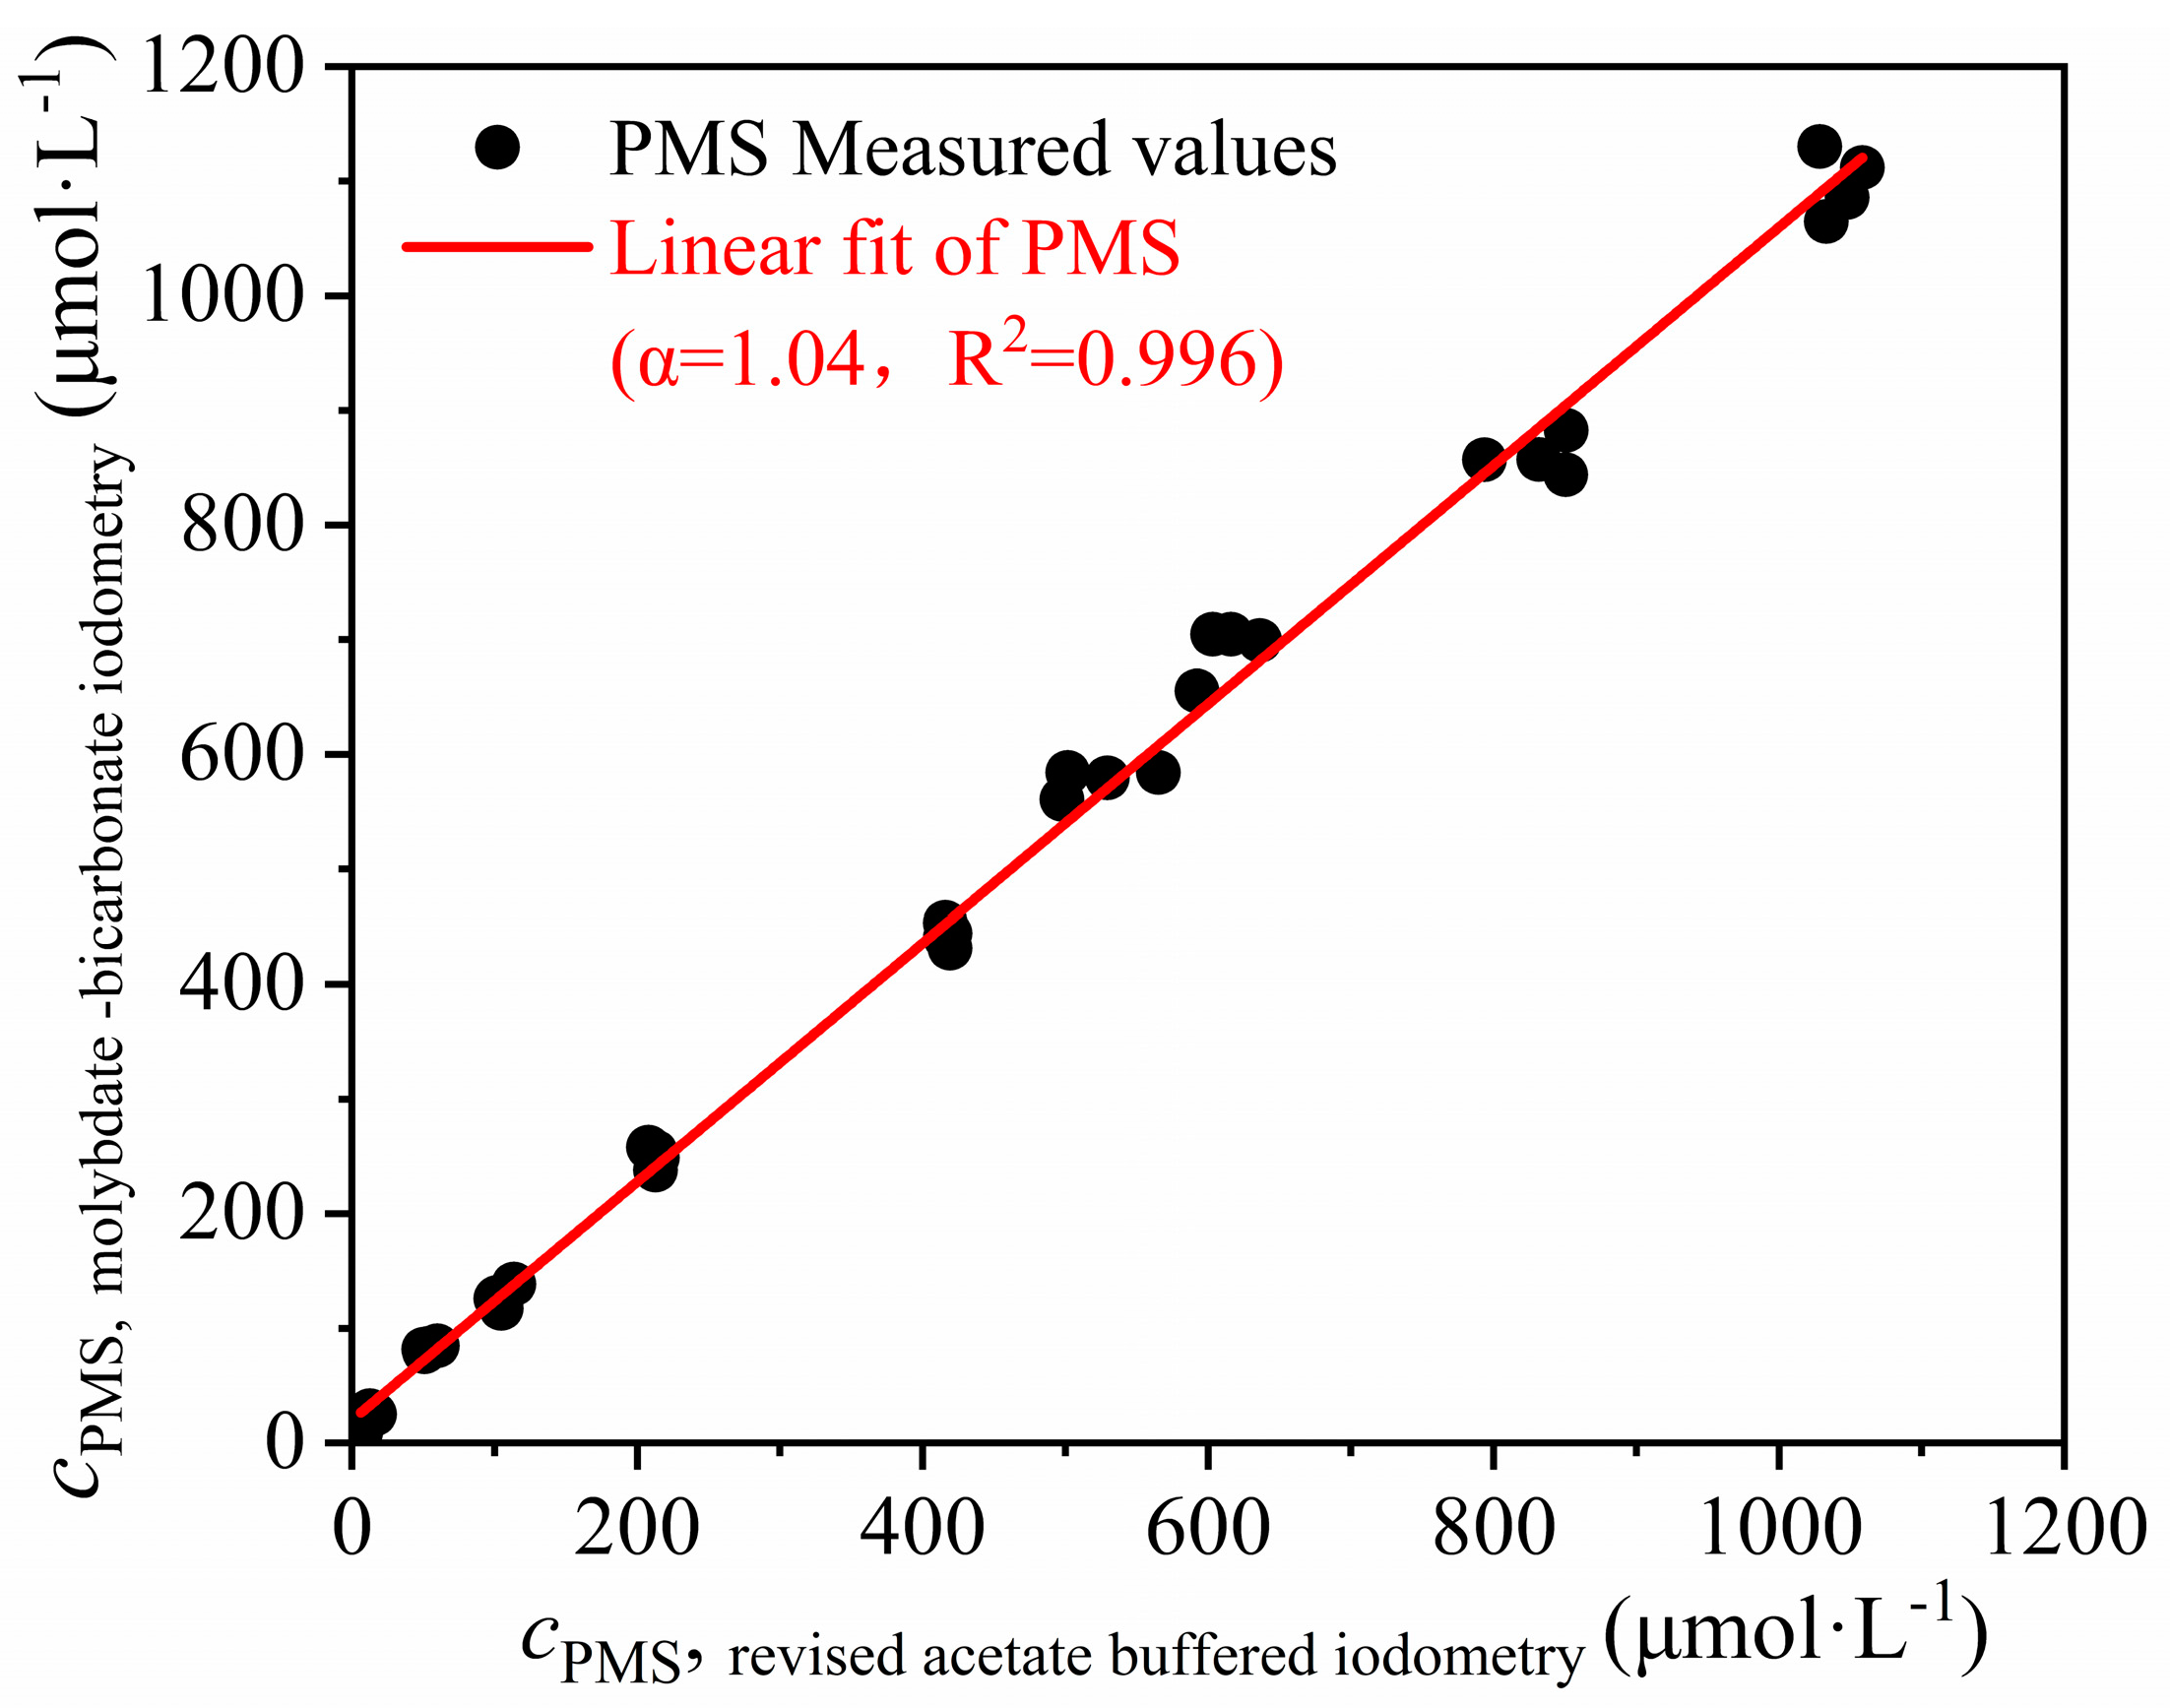
3.3.2. Calibration Coefficient for PMS Concentration Determination with Molybdate–NaHCO3-Buffered Iodometry Referring to Revised Acetate-Buffered Iodometry

There existed a slight deviation in the PMS concentration measured with molybdate–NaHCO3-buffered iodometry from that measured with revised acetate-buffered iodometry. Agreement between the two methods required a calibration coefficient. Additionally, the calibration coefficient was determined to be α = 1.04 via the linear regression analysis of PMS concentrations measured with molybdate–NaHCO3-buffered iodometry versus those with revised acetate-buffered iodometry in the PMS theoretical concentration range of 5–1000 μmol∙L−1 (Figure 3).

3.3.3. Procedure of Multi-Step Iodometric Titration

Based on the above results, multi-step iodometry was established by combining catalase with molybdate–NaHCO3-buffered iodometry and revised acetate-buffered iodometry. It was also checked that the phosphate buffer and catalase had little effect on the determination of PDS and PMS with molybdate–NaHCO3-buffered iodometry or revised acetate-buffered iodometry (Figures S3–S5).
The multi-step iodometric determination of PMS, PDS, and H2O2 concentrations included three steps. Accordingly, the titrated sample (3Vsample) was divided into three equivalent parts (Vsample). Blank titration was performed by substituting Milli-Q water for the sample during each step. In Step I, the first part was treated with molybdate–NaHCO3-buffered iodometry to obtain the total value of the three peroxide concentrations. In total, 13.2 g KI, 0.66 g NaHCO3, and 15 mL 0.17 g∙L−1 (NH4)6Mo7O24∙4H2O stock solutions were added to the samples (Vsample = 100 mL) so that their concentrations in the solutions were 132 g∙L−1, 6.6 g∙L−1, and 26 mg∙L−1, respectively. The solutions were allowed to stand for 15 min, and then titrated with Na2S2O3 (0.01 mol∙L−1) after adding 3.3 % (v/v) acetic acid until the yellow color of the liberated iodine was almost discharged. We added 1 mL of a 0.5% (w/v) starch indicator solution and titrated until the blue color was discharged. We denoted the consumed Na2S2O3 volume after correction by blank titration as V1. In Step II, the second part of the sample was treated with catalase and molybdate–NaHCO3-buffered iodometry to obtain the sum of PMS and PDS concentrations. We added 1 mL of a phosphate buffer (composed of 0.039 mol∙L−1 HPO42− and 0.070 mol∙L−1 H2PO4) and 0.2 mL 5 g∙L−1 catalase to the sample. The solution was allowed to remain for 5 min. Then, solid KI, NaHCO3, and (NH4)6Mo7O24·4H2O stock solutions were added. Additionally, the following titration process is similar to Step I. We denoted the consumed Na2S2O3 volume after correction by blank titration as V2. In Step III, the third part of the sample was treated with catalase and revised acetate-buffered iodometry to obtain the PMS concentration. A phosphate buffer and catalase were added to the sample, and the solution was left for 5 min as Step II. Then, 10 g∙L−1 KI and 5 mL acetate buffer (0.98 mol∙L−1 acetic acid and 0.017 mol∙L−1 sodium acetate) were added. We let the solution stand for 2 min before titrating with Na2S2O3. We denoted the consumed Na2S2O3 volume after correction by blank titration as V3. The concentrations of PMS, PDS, and H2O2 could be calculated as Equations (1)–(3).
c PMS = c Na 2 S 2 O 3 × V 3 2 × V sample
c PDS = c Na 2 S 2 O 3 × ( V 2 α V 3 ) 2 × V sample
c H 2 O 2 = c Na 2 S 2 O 3 × ( V 1 V 2 ) 2 × V sample
where c Na 2 S 2 O 3 is the concentration of the Na2S2O3 titrant, Vsample is the sample volume in each step (100 mL), α is the calibration coefficient for PMS concentration determination with molybdate–NaHCO3-buffered iodometry referring to revised acetate-buffered iodometry (1.04). cPMS, cPDS, and c H 2 O 2 are the concentrations of PMS, PDS, and H2O2 in the sample, respectively.

3.4. Detection Limits and Detection Range of Multi-Step Iodometric Titration

The method detection level (MDL) was determined according to Equation (4) [19]. The MDLs of PMS, PDS, and H2O2 were 6.45 μmol∙L−1, 12.90 μmol∙L−1, and 10.60 μmol∙L−1, respectively, based on the determination of seven replicates containing 20.28 μmol∙L−1 PMS, 20.20 μmol∙L−1 PDS, and 29.64 μmol∙L−1 H2O2. The concentrations of PMS, PDS, and H2O2 in the replicates were one to five times those of the respective MDLs, meeting the requirement of MDL determination.
MDL = 3.14δ
where δ is the standard deviation of seven replicates.
The detection range of multi-step iodometry was further evaluated under 15 scenarios of different individual peroxide concentrations covering 10–720 μmol∙L−1. The recovery rates of peroxides were in the range of 95–105% with standard deviation (SD) ≤ 7% at the individual peroxide concentration of 13–500 μmol∙L−1 (Table 1). It indicates the measured concentrations are statistically close to the theoretical values. It should also be noted that the sample with PMS concentration <10 μmol∙L−1 was not titratable although the single PMS solution was still detectable even at 5 μmol∙L−1 (Figure 3). The higher threshold of the detectable PMS concentration in the peroxide mixture (about 10 μmol∙L−1) than in the single PMS solution might indicate the interference between peroxides.

3.5. Influence of Water Matrix on the Determination of Peroxides Coexisting in Sample with Multi-Step Iodometric Titration

3.5.1. Influence of pH

Detection of PMS, PDS, and H2O2 in the scenarios of a different sample pH was performed to explore the applicable pH range of multi-step iodometry. Figure 4 shows that the recovery rates of the three peroxides were all in the range of 95–105% at pH 3–11. There is no obvious deviation between theoretical and experimental values. It indicates that the multi-step iodometry is applicable in simultaneous determination of PMS, PDS, and H2O2 concentrations in the sample pH range of 3–11.

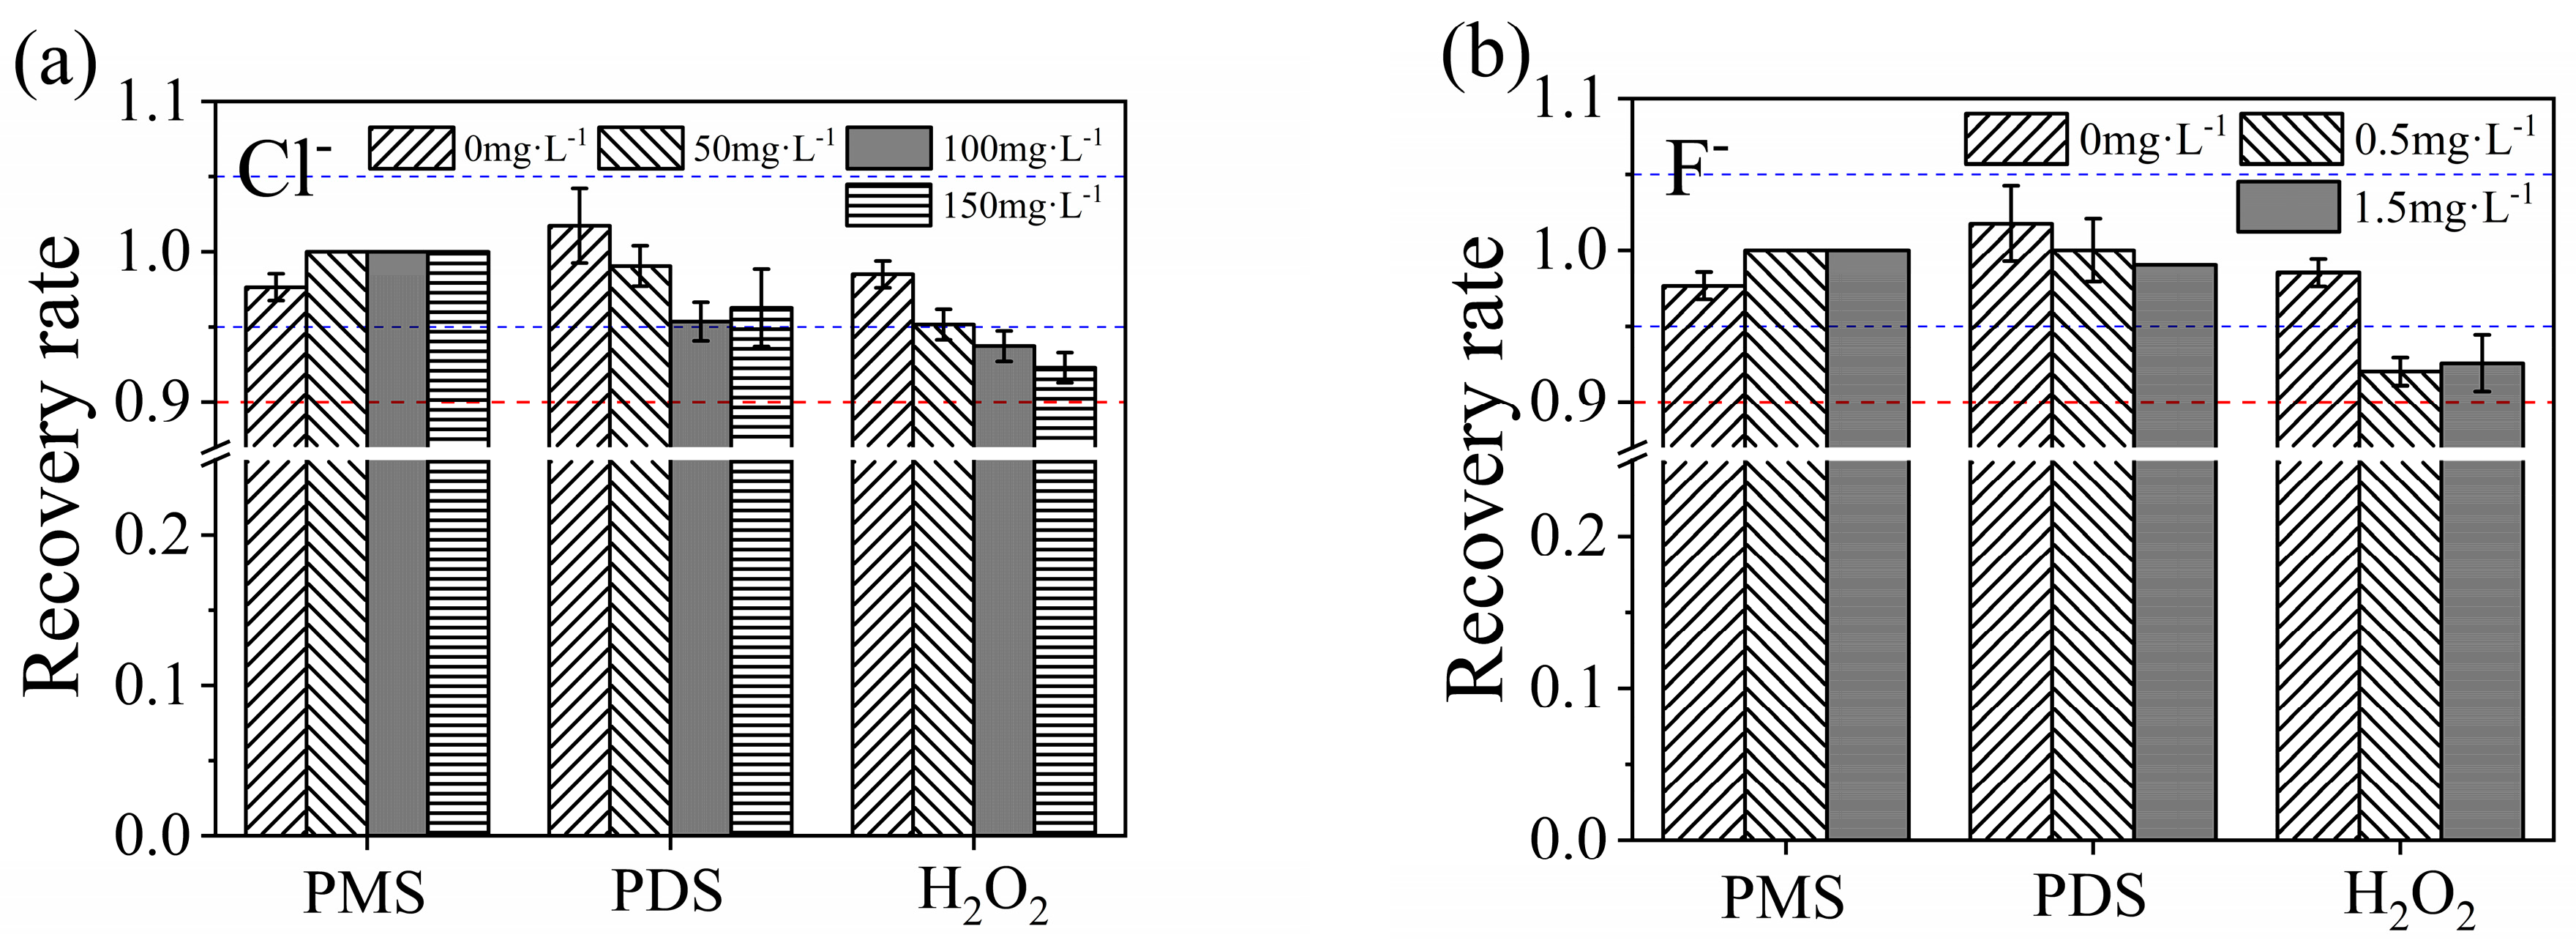
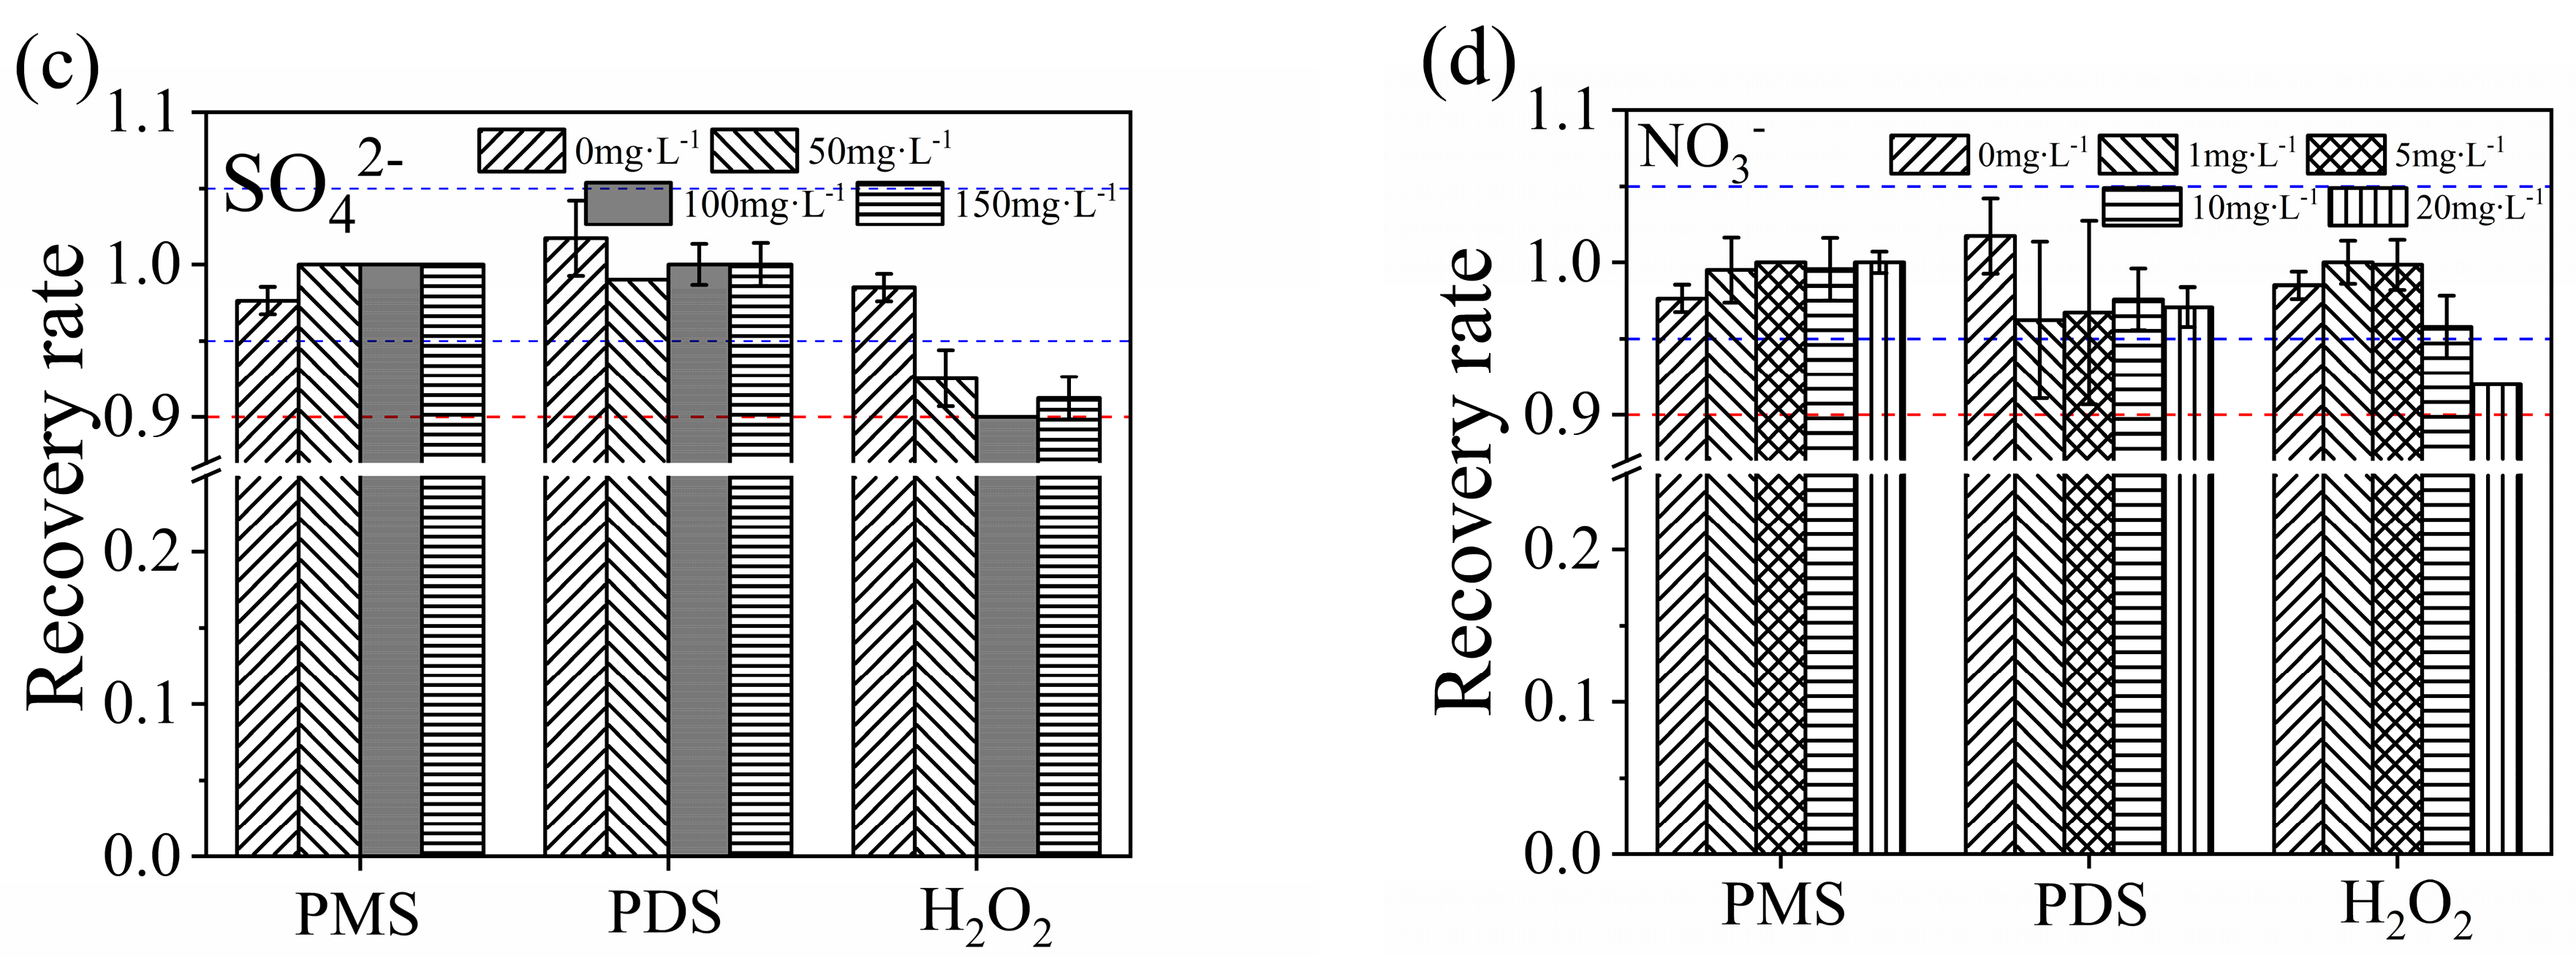
3.5.2. Influences of Anions

The interferences of the anions and cations, commonly found in practical water bodies, were also investigated in determining peroxide concentrations with multi-step iodometry. This was assessed by the recovery rates of peroxides in the mixture by adding individual anions or cations at various regular concentrations. NO3, Cl, F, and SO42− showed a negligible effect on PMS and PDS determination that the recovery rates of PMS and PDS were in the respective ranges of 97–102% and 95–102% at the investigated anionic concentrations. The four anions all showed a negative effect on H2O2 determination. Recovery rates of H2O2 fell down to 92.16%, 92.29%, 92.54%, and 91.24% at the individual concentrations of 20 mg∙L−1 NO3, 150 mg∙L−1 Cl, 1.5 mg∙L−1 F, and 150 mg∙L−1 SO42−, respectively (Figure 5a–d). However, the recovery rates of H2O2 were all above 90%.
Bicarbonate, a major constituent of alkalinity in practical water, is not discussed here. The quantity of NaHCO3 (6.6 g∙L−1, 78 mmol∙L−1) added in the measurement process (Steps I and II) of multi-step iodometry was much larger than the concentrations in real waters (10–500 mg∙L−1 as CaCO3) [20,21,22]. Additionally, the influence of bicarbonate was therefore not considered.

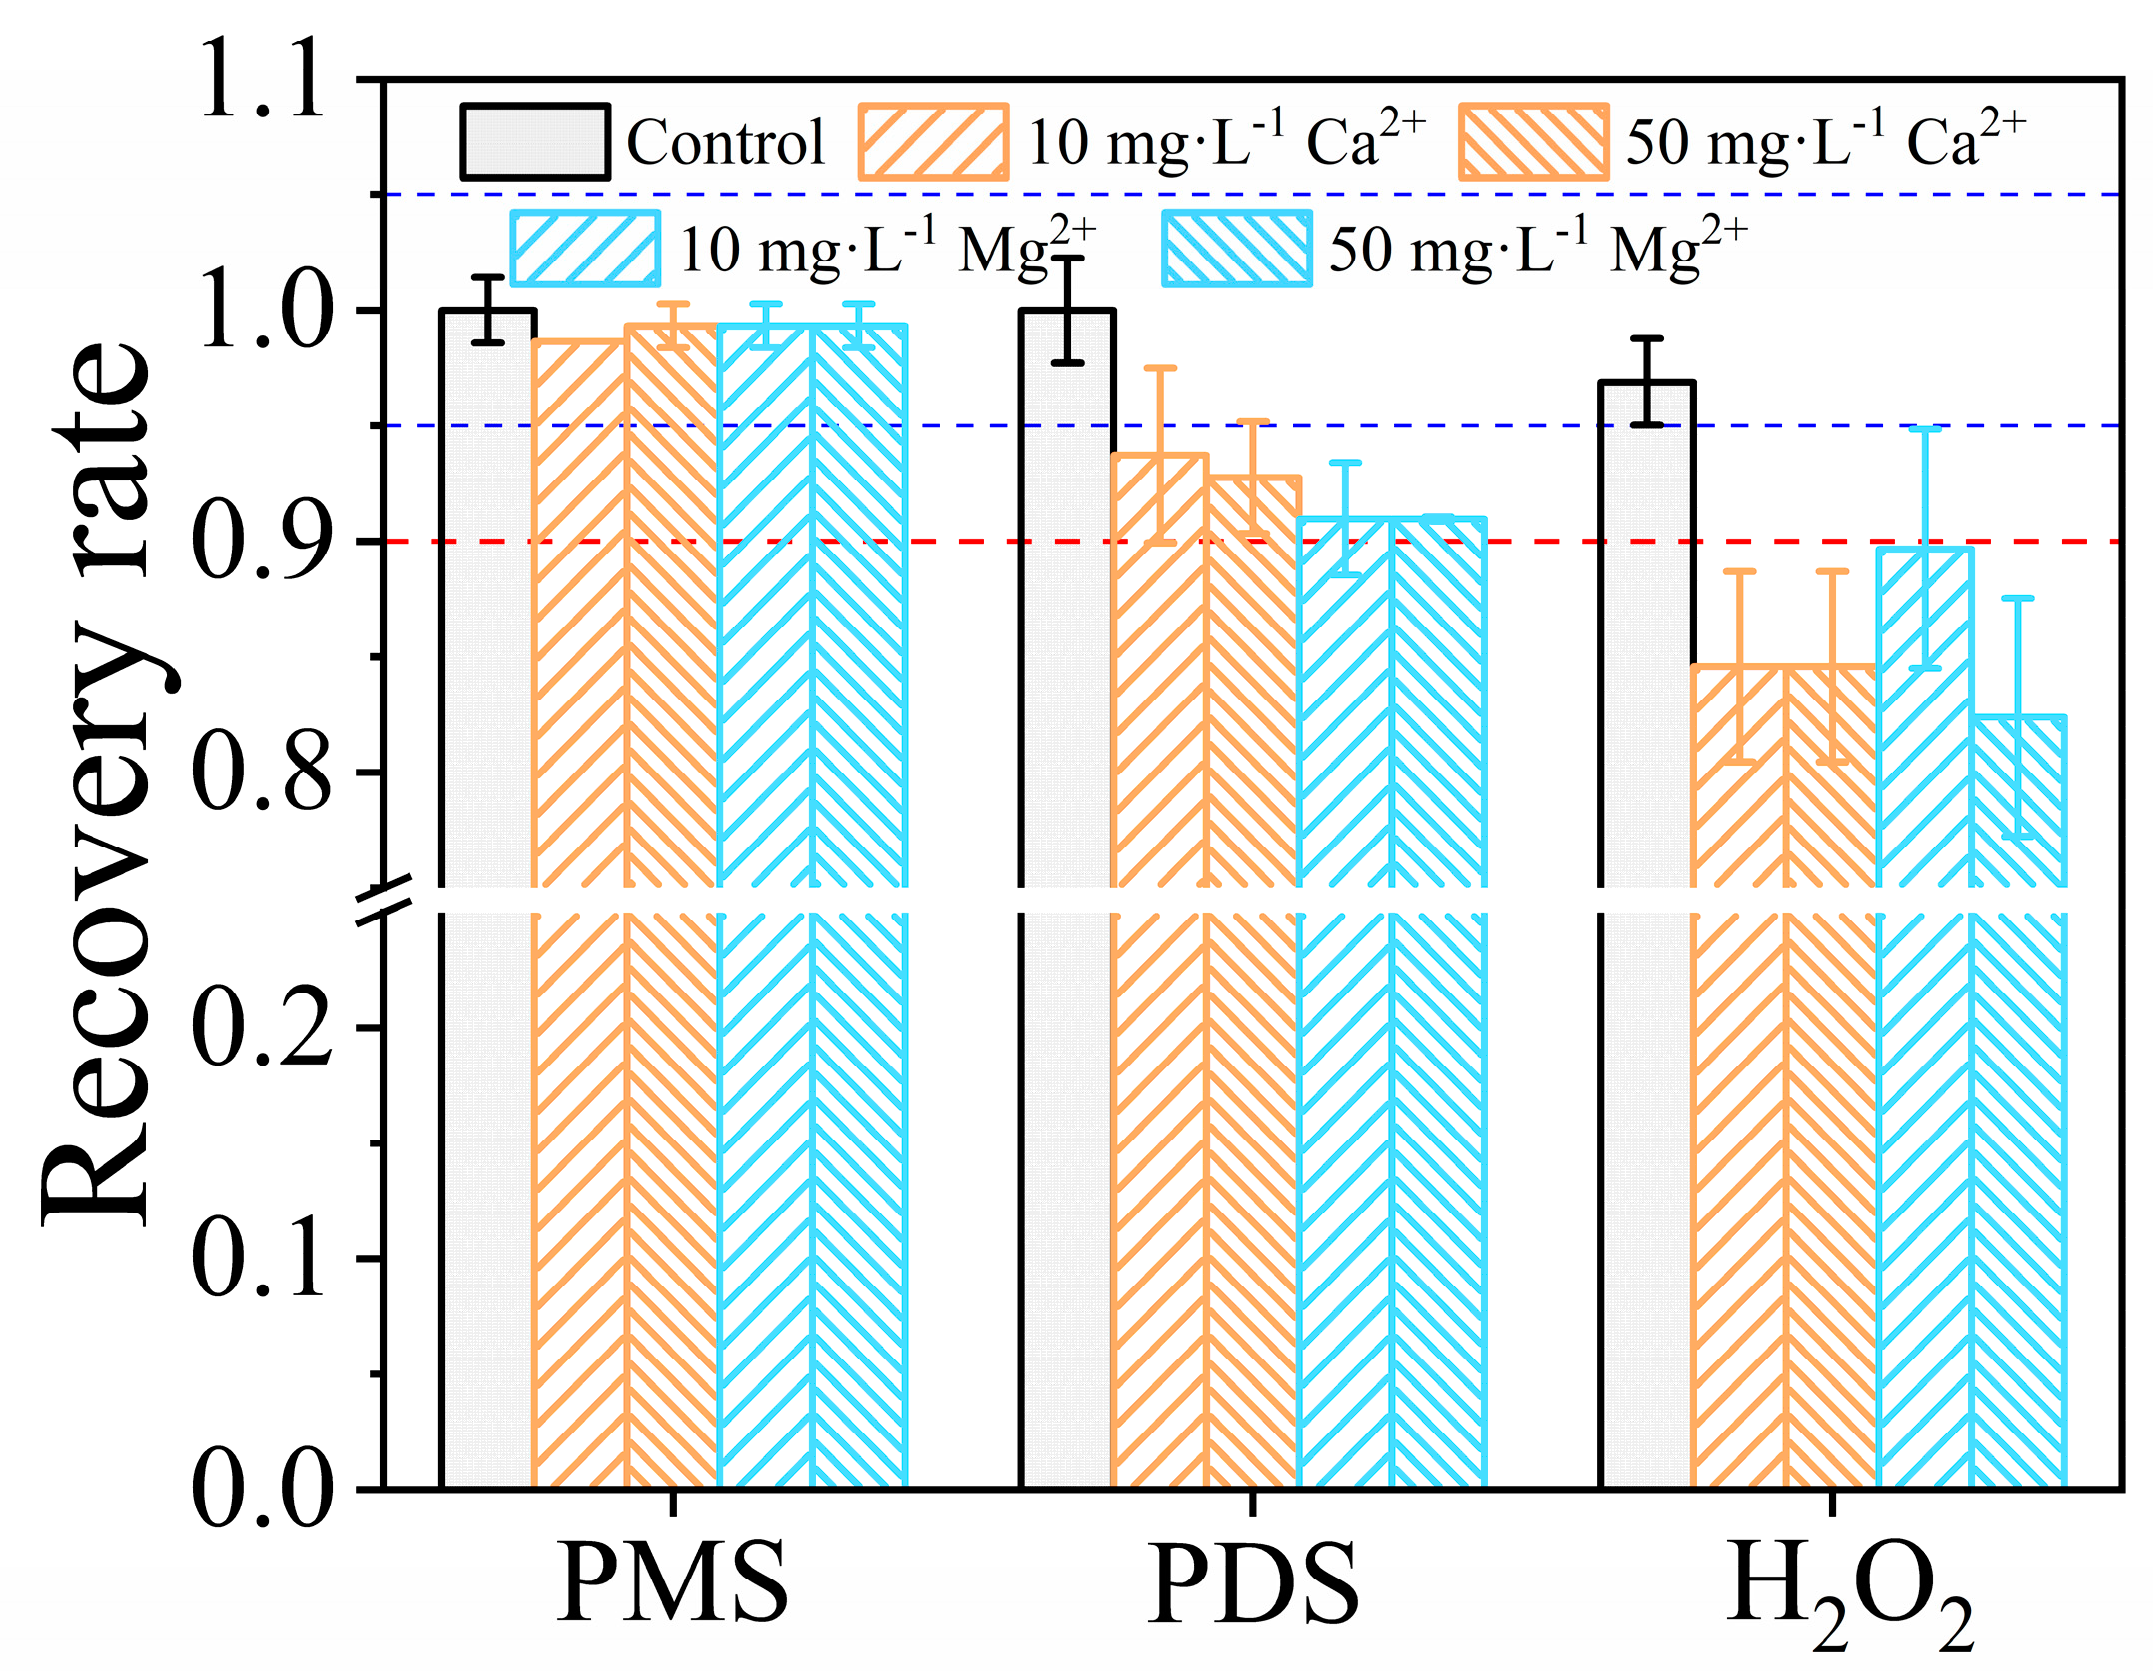
3.5.3. Influences of Ca2+ and Mg2+

Ca2+ and Mg2+ had a negligible effect on PMS and PDS determination but an obvious adverse effect on the detection of H2O2 (Figure 6a,b). The recovery rate of H2O2 decreased to 91.97 ± 1.78% at 1 mg∙L−1 Ca2+, and remained decreased to 90.71 ± 3.56% at 100 mg∙L−1 Ca2+. In the presence of Mg2+, the recovery rate of H2O2 went down below 90% at 20 mg∙L−1 Mg2+, and was 86.93 ± 1.78% at 100 mg∙L−1 Mg2+. The addition of 100 mg∙L−1 Ca2+ or 100 mg∙L−1 Mg2+ lowered the pH value of the NaHCO3-buffered sample to 8.03 and 8.22 (Table S5), respectively, from the original value of 8.35 in the presence of peroxides (cPMS = 166 μmol∙L−1, cPDS = 177 μmol∙L−1, and c H 2 O 2 = 222 μmol∙L−1). As discussed above in the scenarios of a different sample pH, the pH values of NaHCO3-buffered solutions were in the range of 8.2–8.4, corresponding to samples containing peroxides at pH 3–11. It indicates that the slight pH decrease induced by Mg2+ addition would not be the origin for low H2O2 determination while the obvious decrease in pH induced by Ca2+ addition might be sound for the decreased recovery rate of H2O2 in the presence of Ca2+. Ca2+ complexed or reacted with molybdate to form an insoluble precipitate [23]. Mg2+ might also complex with molybdate since it has a similar electronic structure with Ca2+. This would lower the concentration of free molybdate and diminish the catalysis on the reaction between H2O2 and KI, resulting in the decreased conversion of peroxides into I2/I3. Furthermore, Ca2+ might react with H2O2 under alkaline conditions to form CaO2 [24], reducing the formation of I2/I3.
Na2CO3, a common precipitant, was added to the sample (in Step I) as pre-treatment to precipitate Ca2+ and Mg2+. The recovery rate of H2O2 was then lifted to 99.80 ± 1.09% by adding 1.06 g∙L−1 Na2CO3 to the sample containing 100 mg∙L−1 Ca2+. It was stable within 95–105% even at the low Na2CO3 concentration of 0.11 g∙L−1 (Figure 6c). The recovery rate of H2O2 was increased to around 93% by adding 0.11–1.06 g∙L−1 Na2CO3 to the sample containing 100 mg∙L−1 Mg2+ (Figure 6d). The addition of Na2CO3 led to an increase in pH in the NaHCO3-buffered sample. The pH value was elevated to 8.59 or 8.83 by adding 1.06 g∙L−1 Na2CO3 to the sample containing 100 mg∙L−1 Ca2+ or Mg2+, respectively (Table S5). The amelioration of H2O2 determination by adding Na2CO3 might be due to the increased pH of the titrated sample and the reduced free Ca2+ or Mg2+ to react with peroxides or occupy molybdate, which functioned as a catalyst for the reaction between H2O2 and I. At the Na2CO3 dosage of 0.11–1.06 g∙L−1, the recovery rates of PMS and PDS were all in the range of 95–105% (Figure 6c,d). The addition of Na2CO3 did not adversely obviously affect the determination of PMS and PDS concentrations. It can be seen that the multi-step iodometric titration, coupled with Na2CO3, could determine the peroxide concentrations with error ≤ 7% at the cationic concentration as high as 100 mg∙L−1 for Ca2+ (equivalent to 250 mg∙L−1 CaCO3) or Mg2+ (equivalent to 417 mg∙L−1 CaCO3).

3.6. Choice of Buffer

NaHCO3, in molybdate–NaHCO3-buffered iodometry (Steps I and II in multi-step iodometry), was used to keep the solution under a neutral pH condition. When it was substituted by a 0.1 mol∙L−1 phosphate buffer, PMS, PDS, and H2O2 were still well detected in the background Milli-Q water that the recovery rates of PMS, PDS, and H2O2 were 100.00 ± 1.41%, 100.00 ± 2.28%, and 96.90 ± 1.87%, respectively (Figure 7). However, in the sample containing 50 mg∙L−1 Ca2+ or Mg2+, the recovery rate of H2O2 decreased to 84.58 ± 4.12% or 82.39 ± 5.15% while PDS was detected as 92.76 ± 2.43% or 90.97 ± 0.10% (Figure 7). Ca2+ and Mg2+ might have precipitated with phosphate [25], and then decreased the pH of the titrated sample. Meanwhile, the two cations would also complex with molybdate and lower the effective molybdate concentration as discussed above. These factors might be the main reasons for the poor determination of peroxides. Thus, a phosphate buffer could be used as a substituent for NaHCO3 in the background of Milli-Q water but not for samples containing Ca2+ or Mg2+ in molybdate–NaHCO3-buffered iodometry (Steps I and II in multi-step iodometry).

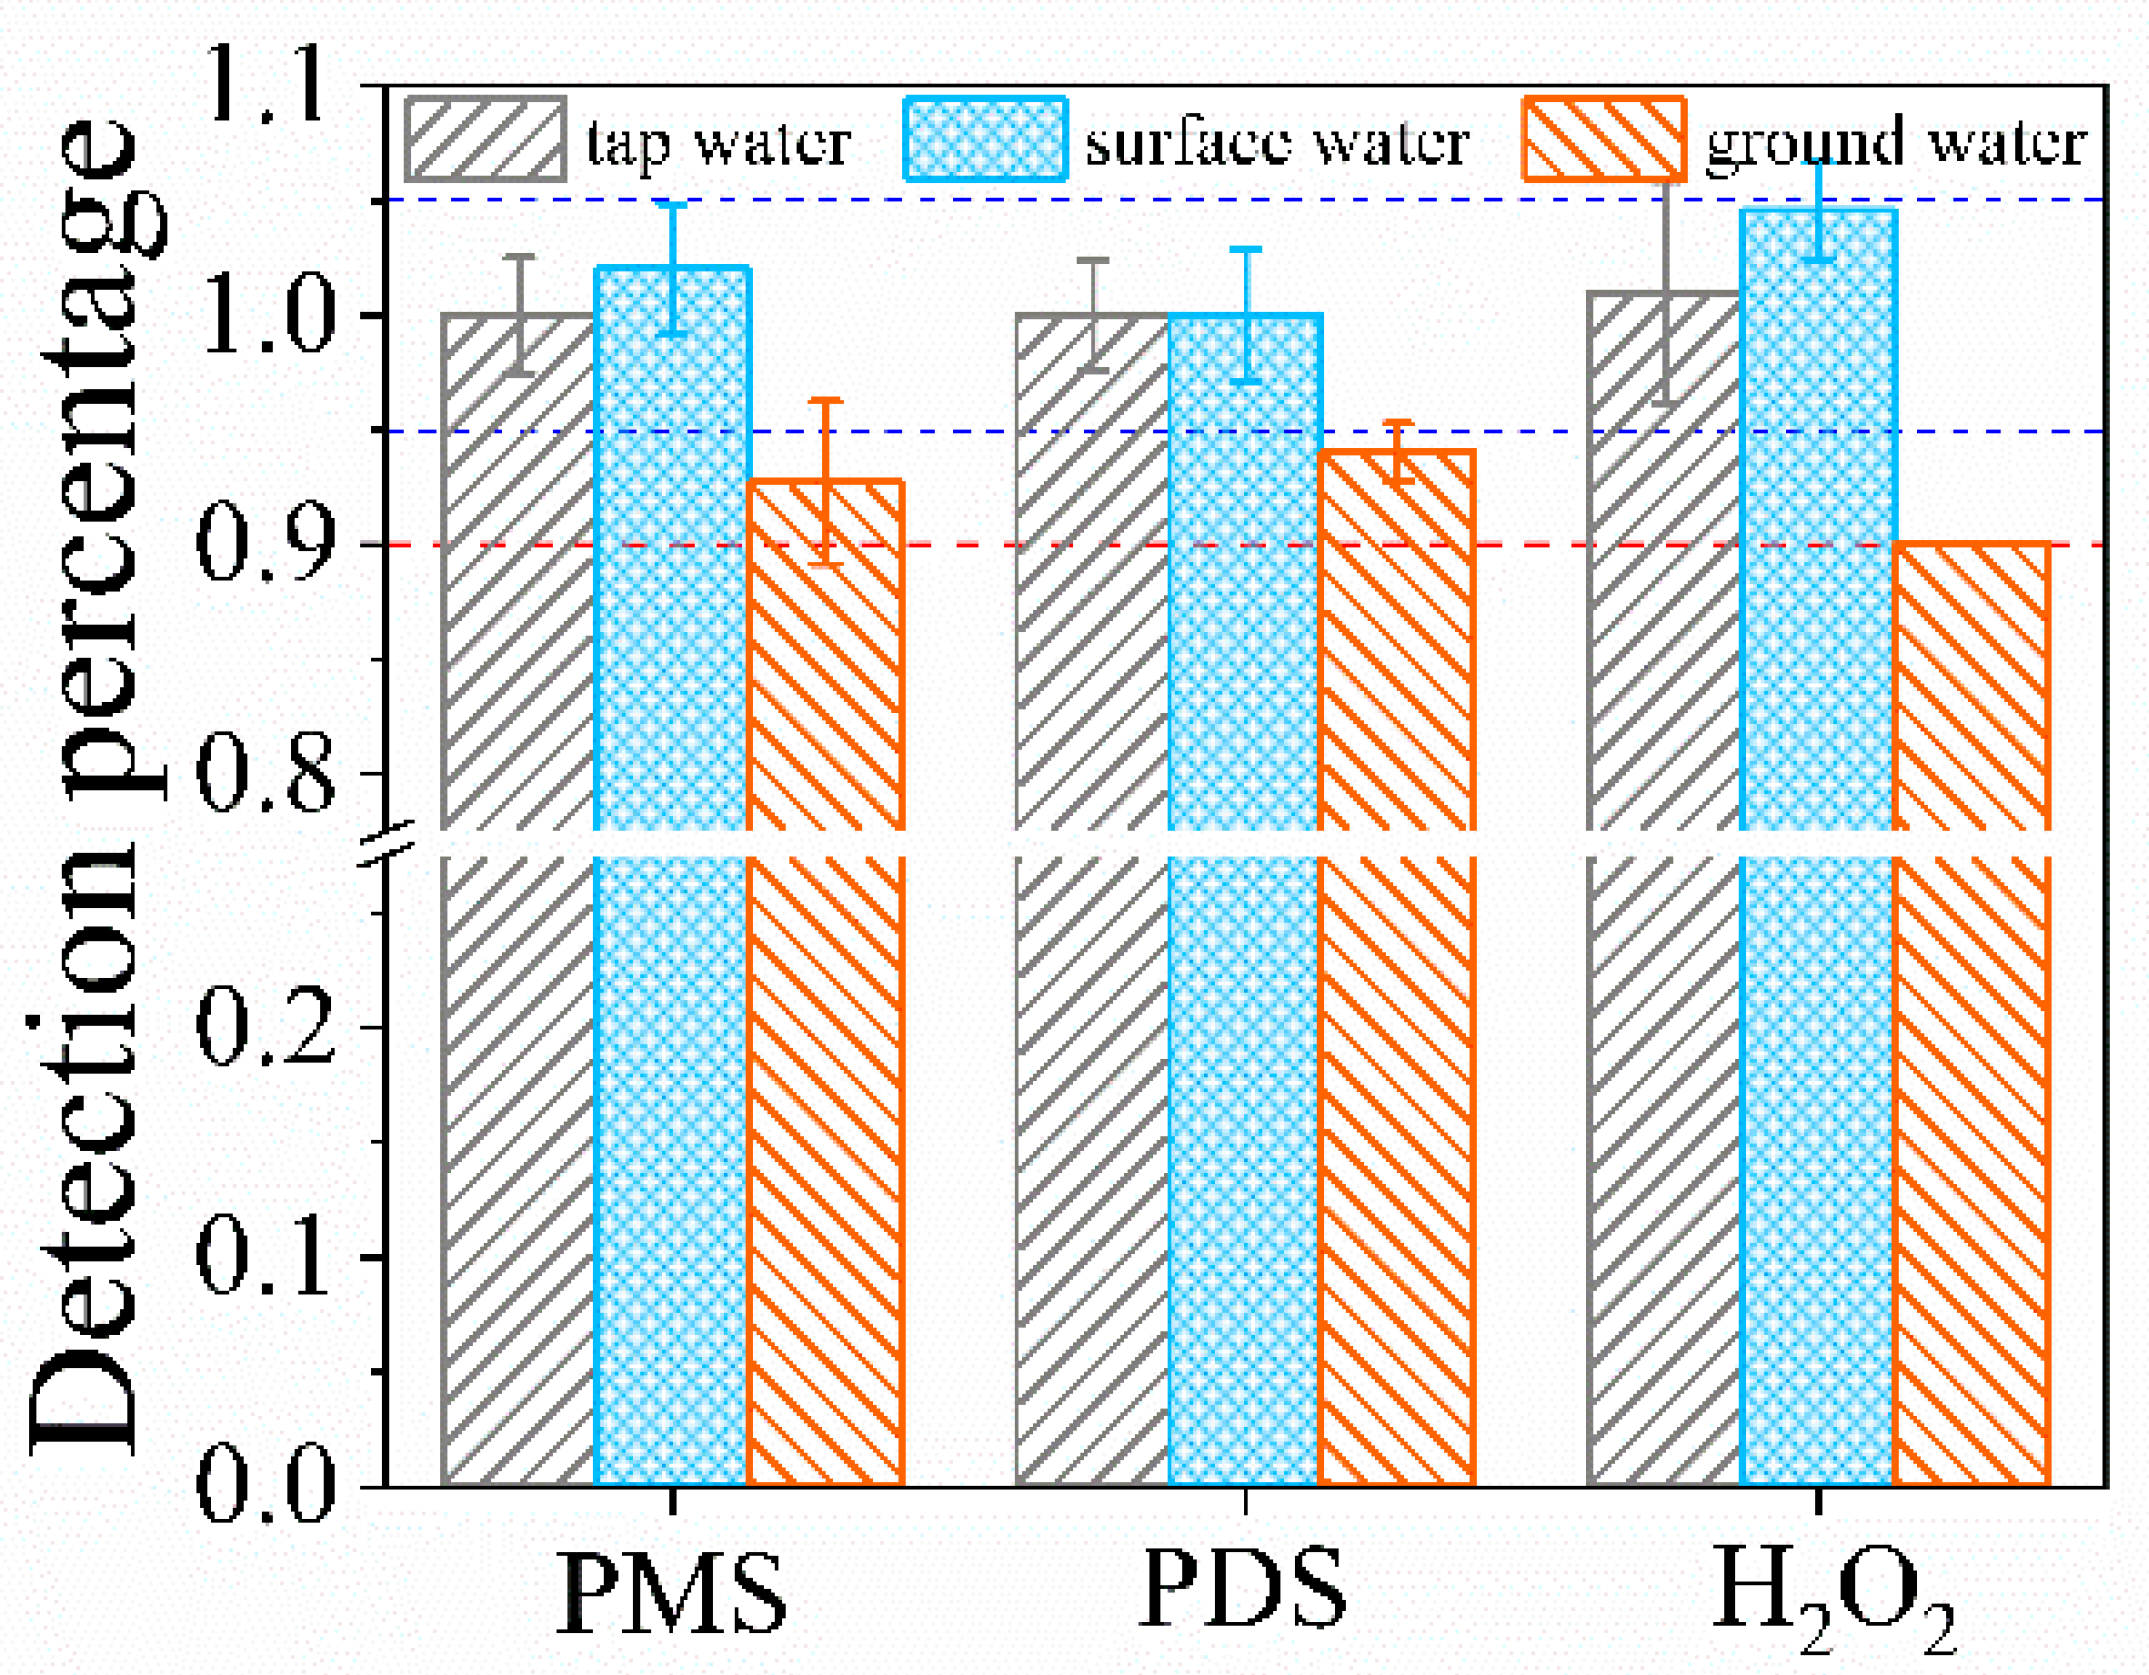
3.7. Applicability in Real Waters

To assess the applicability of multi-step iodometry in real water samples, determination of PMS, PDS, and H2O2 concentrations was performed in the background of tap water, surface water, and ground water. Figure 8 shows that the recovery rates of PMS, PDS, and H2O2 were 100.48 ± 2.53%, 100.56 ± 2.37%, and 101.66 ± 4.84% in tap water; 102.01 ± 2.82%, 99.95 ± 2.88%, and 104.56 ± 2.12% in surface water; and 92.67 ± 3.54%, 94.00 ± 1.27%, and 89.89 ± 0% in ground water, respectively. The recovery rates of the three peroxides in ground water were all lower than those in surface water and tap water. By comparing the water quality parameters of real waters (Table S6), the high hardness might be sound for the low detection of H2O2 in ground water while the low anion concentrations and near neutral pH would not be the original reason for the low detection of peroxides. It might be ascribed to the presence of reduced chemicals (such as Fe2+) in ground water, which can consume peroxides. The recovery rates of the peroxides in the real waters were all around or above 90%, indicating the applicability of multi-step iodometry to determine the concentrations of PMS, PDS, and H2O2 simultaneously existing in natural water.

4. Conclusions

A simple multi-step iodometry was established to determine the concentrations of PMS, PDS, and H2O2 simultaneously existing in water. The recovery rate of H2O2 in the peroxide mixture was found to be unexpectedly low with the combination of NaHCO3-buffered iodometry and catalase. Additionally, the low formation of I2/I3 from the reaction between overall peroxides and I in the mixture could be enhanced by increasing the KI dosage (300 g∙L−1) or adding molybdate (26 mg∙L−1 (NH4)6Mo7O24·4H2O)). Molybdate–NaHCO3-buffered iodometry was then proposed with the optimized parameters as the reaction time of t1 = 15 min, 130 g∙L−1 KI, and 26 mg∙L−1 (NH4)6Mo7O24·4H2O. Furthermore, multi-step iodometry was established by combining molybdate–NaHCO3-buffered iodometry and revised acetate-buffered iodometry with catalase. The multi-step iodometric titration could determine the concentrations of PMS, PDS, and H2O2 coexisting in the sample in the individual peroxide centration range of 13–500 μmol∙L−1 with various ratios of peroxides, obtaining the recovery rates of 95–105% and a precision of SD ≤ 7% of two replicates. The recovery rates of PMS, PDS, and H2O2 were within 95–105% in the sample pH range of 3–11 and within 90–110% in the presence of Cl (0–150 mg∙L−1), F (0–1.5 mg∙L−1), SO42− (0–150 mg∙L−1), or NO3 (0–20 mg∙L−1). The presence of 100 mg∙L−1 Ca2+ and Mg2+ lowered the recovery rate of H2O2. The addition of Na2CO3 (0.11–1.06 g∙L−1) obviously alleviated the adverse effect of Ca2+ and Mg2+ and increased the recovery rate of H2O2. In the background of tap water, surface water, and ground water, the recovery rates of PMS, PDS, and H2O2 were all within 90–110%. It indicates multi-step iodometry would be applicable to the determination of peroxides coexisting in actual water bodies. Meanwhile, the multi-step iodometric titration is theoretically simple and easy to operate, with no special requirements on equipment.

Supplementary Materials

The following supporting information can be downloaded at: https://www.mdpi.com/article/10.3390/w15122190/s1, Text S1: Detailed statements on the procedures of multi-step iodometric determination. Text S2: General principle and detailed experimental procedure of revised acetate-buffered iodometry. Text S3: General principle and detailed experimental procedure of NaHCO3-buffered iodometry. Figure S1: PDS concentrations titrated with NaHCO3-buffered iodometry and molybdate–NaHCO3-buffered iodometry. Figure S2: PMS concentrations titrated with NaHCO3-buffered iodometry and molybdate–NaHCO3-buffered iodometry. Figure S3: Influence of phosphate buffer and catalase on the detection of PDS with molybdate–NaHCO3–buffered iodometry. Figure S4: Influence of phosphate buffer and catalase on the detection of PMS with molybdate–NaHCO3-buffered iodometry. Figure S5: Influence of phosphate buffer and catalase on the detection of PMS with revised acetate-buffered iodometry. Table S1: Recovery rates of peroxides in separate solutions with iodometric titration. Table S2: Determination of peroxide concentrations in the three peroxide mixtures by the coupling of revised acetate-buffered iodometry and NaHCO3-buffered iodometry with catalase. Table S3: Levels of factors in orthogonal experiments of molybdate–NaHCO3-buffered iodometry. Table S4: Results of orthogonal experiments. Table S5: The pH values of NaHCO3-buffered samples to be titrated by molybdate–NaHCO3-buffered iodometry in Step I of multi-step iodometric titration. Table S6: Water quality parameters of the real water samples. (References [5,13] are cited in the Supplementary Materials).

Author Contributions

M.W.: Data curation; Formal analysis; Investigation; Methodology; Writing—original draft. Y.Z.: Investigation; Formal analysis; Validation. S.Y.: Investigation; Validation. X.J. (Xinxin Jiang): Writing—review and editing; Validation. X.J. (Xue Jiang): Writing—review and editing. Z.X.: Writing—review and editing. Y.G.: Conceptualization; Data curation; Resources; Supervision; Writing—review and editing. All authors have read and agreed to the published version of the manuscript.

Funding

This work was supported by the National Natural Science Foundation of China (Grant No. 51408107, 42107072, 51979038), the Natural Science Foundation of Heilongjiang Province (Grant No. LH2019E013), and the Young Talents Project of Northeast Agricultural University (Grant No. 17QC09).

Data Availability Statement

Data will be made available on request.

Conflicts of Interest

The authors declare no conflict of interest.

References

  1. Anipsitakis, G.P.; Dionysiou, D.D. Transition metal/UV-based advanced oxidation technologies for water decontamination. Appl. Catal. B. 2004, 54, 155–163. [Google Scholar] [CrossRef]
  2. Wacławek, S.; Lutze, H.V.; Grübel, K.; Padil, V.V.T.; Černík, M.; Dionysiou, D.D. Chemistry of persulfates in water and wastewater treatment: A review. Chem. Eng. J. 2017, 330, 44–62. [Google Scholar] [CrossRef]
  3. Guan, Y.-H.; Ma, J.; Li, X.-C.; Fang, J.-Y.; Chen, L.-W. Influence of pH on the formation of sulfate and hydroxyl radicals in the UV/Peroxymonosulfate system. Environ. Sci. Technol. 2011, 45, 9308–9314. [Google Scholar] [CrossRef] [PubMed]
  4. Guan, Y.-H.; Ma, J.; Liu, D.-K.; Ou Z-f Zhang, W.; Gong, X.-L.; Fu, Q.; Crittenden, J.C. Insight into chloride effect on the UV/peroxymonosulfate process. Chem. Eng. J. 2018, 352, 477–489. [Google Scholar] [CrossRef]
  5. Güpta, Y.K. Iodometric determination of persulphate in sulphuric acid solution. Fresen. J. Anal. Chem. 1961, 180, 260–265. [Google Scholar] [CrossRef]
  6. Furman, O.S.; Teel, A.L.; Watts, R.J. Mechanism of base activation of persulfate. Environ. Sci. Technol. 2010, 44, 6423–6428. [Google Scholar] [CrossRef]
  7. Liu, Z.H.; Guo, W.L.; Han, X.M.; Li, X.H.; Zhang, K.; Qiao, Z.M. In situ remediation of ortho-nitrochlorobenzene in soil by dual oxidants (hydrogen peroxide/persulfate). Environ. Sci. Pollut. R. 2016, 23, 19707–19712. [Google Scholar] [CrossRef]
  8. Yang, Y.; Banerjee, G.; Brudvig, G.W.; Kim, J.H.; Pignatello, J.J. Oxidation of organic compounds in water by unactivated peroxymonosulfate. Environ. Sci. Technol. 2018, 52, 5911–5919. [Google Scholar] [CrossRef]
  9. Ball, R.E.; Edwards, J.O.; Haggett, M.L.; Jones, P. A kinetic and isotopic study of the decomposition of monoperoxyphthalic acid. J. Am. Chem. Soc. 1967, 89, 2331–2333. [Google Scholar] [CrossRef]
  10. Yang, Y.; Jiang, J.; Lu, X.; Ma, J.; Liu, Y. Production of sulfate radical and hydroxyl radical by reaction of ozone with peroxymonosulfate: A novel advanced oxidation process. Environ. Sci. Technol. 2015, 49, 7330–7339. [Google Scholar] [CrossRef]
  11. Zhang, T.; Zhu, H.; Croué, J.-P. Production of sulfate radical from peroxymonosulfate induced by a magnetically separable CuFe2O4 spinel in water: Efficiency, stability, and mechanism. Environ. Sci. Technol. 2013, 47, 2784–2791. [Google Scholar] [CrossRef]
  12. Huang, G.X.; Si, J.Y.; Qian, C.; Wang, W.K.; Mei, S.C.; Wang, C.Y.; Yu, H.Q. Ultrasensitive fluorescence detection of peroxymonosulfate based on a sulfate radical-mediated aromatic hydroxylation. Anal. Chem. 2018, 90, 14439–14446. [Google Scholar] [CrossRef] [PubMed]
  13. Liang, C.; Huang, C.-F.; Mohanty, N.; Kurakalva, R.M. A rapid spectrophotometric determination of persulfate anion in ISCO. Chemosphere 2008, 73, 1540–1543. [Google Scholar] [CrossRef] [PubMed]
  14. Klassen, N.V.; Marchington, D.; McGowan, H.C.E. H2O2 determination by the I3 method and by KMnO4 titration. Anal. Chem. 1994, 66, 2921–2925. [Google Scholar] [CrossRef]
  15. Gallard, H.; De Laat, J. Kinetic modelling of Fe(III)/H2O2 oxidation reactions in dilute aqueous solution using atrazine as a model organic compound. Water Res. 2000, 34, 3107–3116. [Google Scholar] [CrossRef]
  16. Bader, H.; Sturzenegger, V.; Hoigne, J. Photometric method for the determination of low concentrations of hydrogen peroxide by the peroxidase catalyzed oxidation of N,N-diethyl-p-phenylenediamine (DPD). Water Res. 1988, 22, 1109–1115. [Google Scholar] [CrossRef]
  17. Boudeville, P.E.A. Simultaneous determination of hydrogen peroxide, peroxymonosulfuric acid, and peroxydisulfuric acid by thermometric titrimetry. Anal. Chem. 1983, 55, 612–615. [Google Scholar] [CrossRef]
  18. Ball, D.L.; Edwards, J.O. The Kinetics and Mechanism of the Decomposition of Caro's Acid. J. Am. Chem. Soc. 1956, 78, 1125–1129. [Google Scholar] [CrossRef]
  19. Clesceri, L.S.; Greenberg, A.E.; Eaton, A.D. Standard Methods for the Examination of Water and Wastewater, 20th ed.; American Public Health Association: Washington, DC, USA; American Water Works Association: Washington, DC, USA; Water Environment Federation: Washington, DC, USA, 1999. [Google Scholar]
  20. Guan, Y.H.; Ma, J.; Ren, Y.M.; Liu, Y.L.; Xiao, J.Y.; Lin, L.Q.; Zhang, C. Efficient degradation of atrazine by magnetic porous copper ferrite catalyzed peroxymonosulfate oxidation via the formation of hydroxyl and sulfate radicals. Water Res. 2013, 47, 5431–5438. [Google Scholar] [CrossRef]
  21. Ji, Y.; Fan, Y.; Liu, K.; Kong, D.; Lu, J. Thermo activated persulfate oxidation of antibiotic sulfamethoxazole and structurally related compounds. Water Res. 2015, 87, 1–9. [Google Scholar] [CrossRef]
  22. Li, W.; Orozco, R.; Camargos, N.; Liu, H.Z. Mechanisms on the impacts of alkalinity, pH, and chloride on persulfate-based groundwater remediation. Environ. Sci. Technol. 2017, 51, 3948–3959. [Google Scholar] [CrossRef] [PubMed]
  23. Yamasaki, S.; Kurita, S.; Ochiai, A.; Sueki, K.; Utsunomiya, S. Nano-scaled calcium molybdate particle formation on egg phosphatidylcholine liposome surface. Chem. Lett. 2019, 48, 1480–1483. [Google Scholar]
  24. Ge, F.; Li, Q.; Liu, H.-N.; Wu, Z.-J. Progress in preparation and application of calcium peroxide. Inorganic Chem. Ind. 2010, 42, 1–4. [Google Scholar]
  25. Crutchik, D.; Garrido, J.M. Struvite crystallization versus amorphous magnesium and calcium phosphate precipitation during the treatment of a saline industrial wastewater. Water Sci. Technol. 2011, 64, 2460–2467. [Google Scholar] [CrossRef]
Figure 1. Determination of peroxides in their mixture with the combination of NaHCO3-buffered iodometry and catalase at various KI dosages (a). Determination of PMS, PDS, and H2O2 with the combination of NaHCO3-buffered iodometry (300 g∙L−1 KI) and catalase with revised acetate-buffered iodometry (b). Conditions: [PMS] = 171 μmol∙L−1, [PDS] = 175 μmol∙L−1, and [H2O2] = 247 μmol∙L−1.
Water 15 02190 g001
Figure 2. Recovery rate of H2O2 and overall recovery rate of PDS and PMS in peroxide mixture versus reaction time (a), KI dosage (b), and (NH4)6Mo7O24·4H2O dosage (c). Conditions: [PDS] = 185 μmol∙L−1, [PMS] = 185 μmol∙L−1, [H2O2] = 225 μmol∙L−1, [(NH4)6Mo7O24·4H2O] = 26 mg∙L−1, [KI] = 132 g∙L−1, and t1 = 15 min, unless otherwise stated in figures.
Water 15 02190 g002
Figure 3. PMS concentrations measured with molybdate–NaHCO3–buffered iodometry versus those with revised acetate-buffered iodometry.
Water 15 02190 g003
Figure 4. Influence of solution pH on the recovery rates of peroxides in mixture. Conditions: [PMS] = 155 μmol∙L−1, [PDS] = 159 μmol∙L−1, and [H2O2] = 324 μmol∙L−1.
Water 15 02190 g004
Figure 5. Influence of Cl (a), F (b), SO42− (c), and NO3 (d) on the recovery rates of peroxides in mixture. Conditions: [PMS] = 160 μmol∙L−1, [PDS] = 167 μmol∙L−1, and [H2O2] = 243 μmol∙L−1.
Water 15 02190 g005aWater 15 02190 g005b
Figure 6. Influences of Ca2+ (a) and Mg2+ (b) on the detection of peroxides coexisting in sample. Effect of Na2CO3 addition on the detection of peroxides in the sample containing 100 mg⸱L−1 Ca2+ (c) or Mg2+ (d). Conditions: [PMS] = 163 μmol∙L−1, [PDS] = 185 μmol∙L−1, and [H2O2] = 253 μmol∙L−1 for (a,b); [PMS] = 160 μmol∙L−1, [PDS] = 163 μmol∙L−1, and [H2O2] = 206 μmol∙L−1 for (c,d).
Water 15 02190 g006
Figure 7. Recovery rates of peroxides in the sample with/without Ca2+ and Mg2+ with bicarbonate buffer substituted by phosphate buffer in molybdate–NaHCO3-buffered iodometry. Conditions: [PMS] = 160 μmol∙L−1, [PDS] = 174 μmol∙L−1, and [H2O2] = 240 μmol∙L−1.
Water 15 02190 g007
Figure 8. Detection of peroxides in real waters with multi-step iodometry. Conditions: [PMS] = 155 μmol∙L−1, [PDS] = 174 μmol∙L−1, and [H2O2] = 181 μmol∙L−1.
Water 15 02190 g008
Table 1. Recovery rates of peroxides in the mixture under various concentration scenarios measured in duplicate.
H2O2PDSPMS
ScenariosTheoretical Concentration (μmol∙L−1)Recovery Rate (%)Standard Deviation (%)Theoretical Concentration (μmol∙L−1)Recovery Rate (%)Standard Deviation (%)Theoretical Concentration (μmol∙L−1)Recovery Rate (%)Standard Deviation (%)
113.4097.833.3710.49102.544.3110.78100.000.00
217.0097.815.3213.93101.75<0.0114.1799.280.00
320.10104.994.5015.74101.605.7416.1798.870.00
428.20100.403.2320.54103.764.9921.88101.472.08
570.50103.601.4451.35100.422.0454.7098.821.66
6137.0599.311.77101.3698.021.65103.59102.471.31
7252.7197.640.89184.88101.551.76162.56100.711.38
8320.9398.821.57255.00101.001.78253.40100.630.00
9718.5799.850.31545.65105.000.47503.6099.530.45
10507.0099.650.6352.33103.444.3247.9699.990.00
1155.8697.315.7252.3396.006.22527.59100.300.42
1255.86103.03<0.01549.9798.220.4347.9696.664.71
130.000.000.0052.3397.334.3247.9699.990.00
1455.86100.174.0452.3397.760.000.000.000.00
1555.8697.314.050.000.000.0047.9696.674.71
Disclaimer/Publisher’s Note: The statements, opinions and data contained in all publications are solely those of the individual author(s) and contributor(s) and not of MDPI and/or the editor(s). MDPI and/or the editor(s) disclaim responsibility for any injury to people or property resulting from any ideas, methods, instructions or products referred to in the content.

