1. Introduction
The Tibet Plateau, known as the “Third Pole” and the “Asia Water Tower,” is the critical source of many major rivers in the Asia [
1,
2,
3]. The region is characterized by a vast expanse of glaciers of which the meltwater provides crucial supplies for many rivers [
4]. The hydrological processes of these rivers are strongly linked to the water source supplies within the basin under climate change [
5,
6], which in turn can have significant impacts on the lives of residents in the basin [
7]. Over the past several decades, the Tibet Plateau has undergone significant climate warming that has outpaced the global average [
8]. As a result, the glaciers in the region have not only showed accelerated retreat features, but the related hydrological processes also exhibited heterogeneous characteristics due to the differences in meltwater contributions [
9,
10,
11,
12,
13,
14,
15,
16,
17].
The Ranwu Lake, situated in the southeastern part of the Tibet Plateau, is a river channel type outflow lake and the source of the Parlung Zangbo River, a major tributary of the Yarlung Tsangpo-Brahmaputra River. The high mountains around the lake basin detain monsoon moisture from the Bay of Bengal, resulting in the development of numerous marine glaciers of which the meltwater of the glaciers and snow is therefore a critical component of lake water supplies. On the one hand, recent studies have shown that glaciers in the southeastern Tibet Plateau have undergone severe retreat in the past few decades [
15,
18,
19,
20,
21]. The impact of glacier retreat on the runoff within the basin is largely dependent on the area of the glaciers and the proportion of glacial meltwater within the runoff components [
21,
22]. On the other hand, precipitation in southeastern Tibet has exhibited an increasing trend from 1961 to 2012, particularly in the spring [
23,
24]. However, due to the complex terrain of the region, the trend of precipitation changes exhibits significant spatiotemporal heterogeneity. Other studies have indicated a decreasing trend in precipitation in the eastern and southern parts of the plateau, leading to a decrease in runoff in these areas [
25].
Different runoff components respond differently to climate change [
26]. Numerous studies have been conducted in the Ranwu Lake basin, with some utilizing isotope tracing to demonstrate that glacial meltwater accounts for over half of the total runoff [
27]. Previous hydrological studies have shown that the dominant runoff components in the basin vary in different seasons [
28], while climate change on the Tibet Plateau exhibits seasonal differences [
29]. Therefore, it is necessary to systematically understand the proportion of different runoff components in different periods within the basin and to further clarify the changes in these components under the background of climate change.
The SPHY (Spatial Processes in Hydrology) model is able to distinguish different runoff components and has been applied in many cases in the Tibet Plateau and high Asia regions [
6,
30,
31]. These model applications have demonstrated that the model has good adaptability in cold regions and can meet the requirements of various applications. To make clear how the runoff components vary with climate change and how they will evolve in the future, this study (1) analyzed the characteristics of climate change in the Ranwu basin based on past meteorological data, (2) explored the applicability of the SPHY model in high mountain basins with glacier supply, (3) quantitatively analyzed the runoff composition and its changes in the Ranwu basin, and (4) predicted the hydrological response in the Ranwu Lake basin under future climatic scenarios. The findings of this study will help to improve our understanding of the hydrological processes in the region and better predict the impacts of climate change on water resources in the basin.
2. Study Area and Dataset
2.1. Study Area
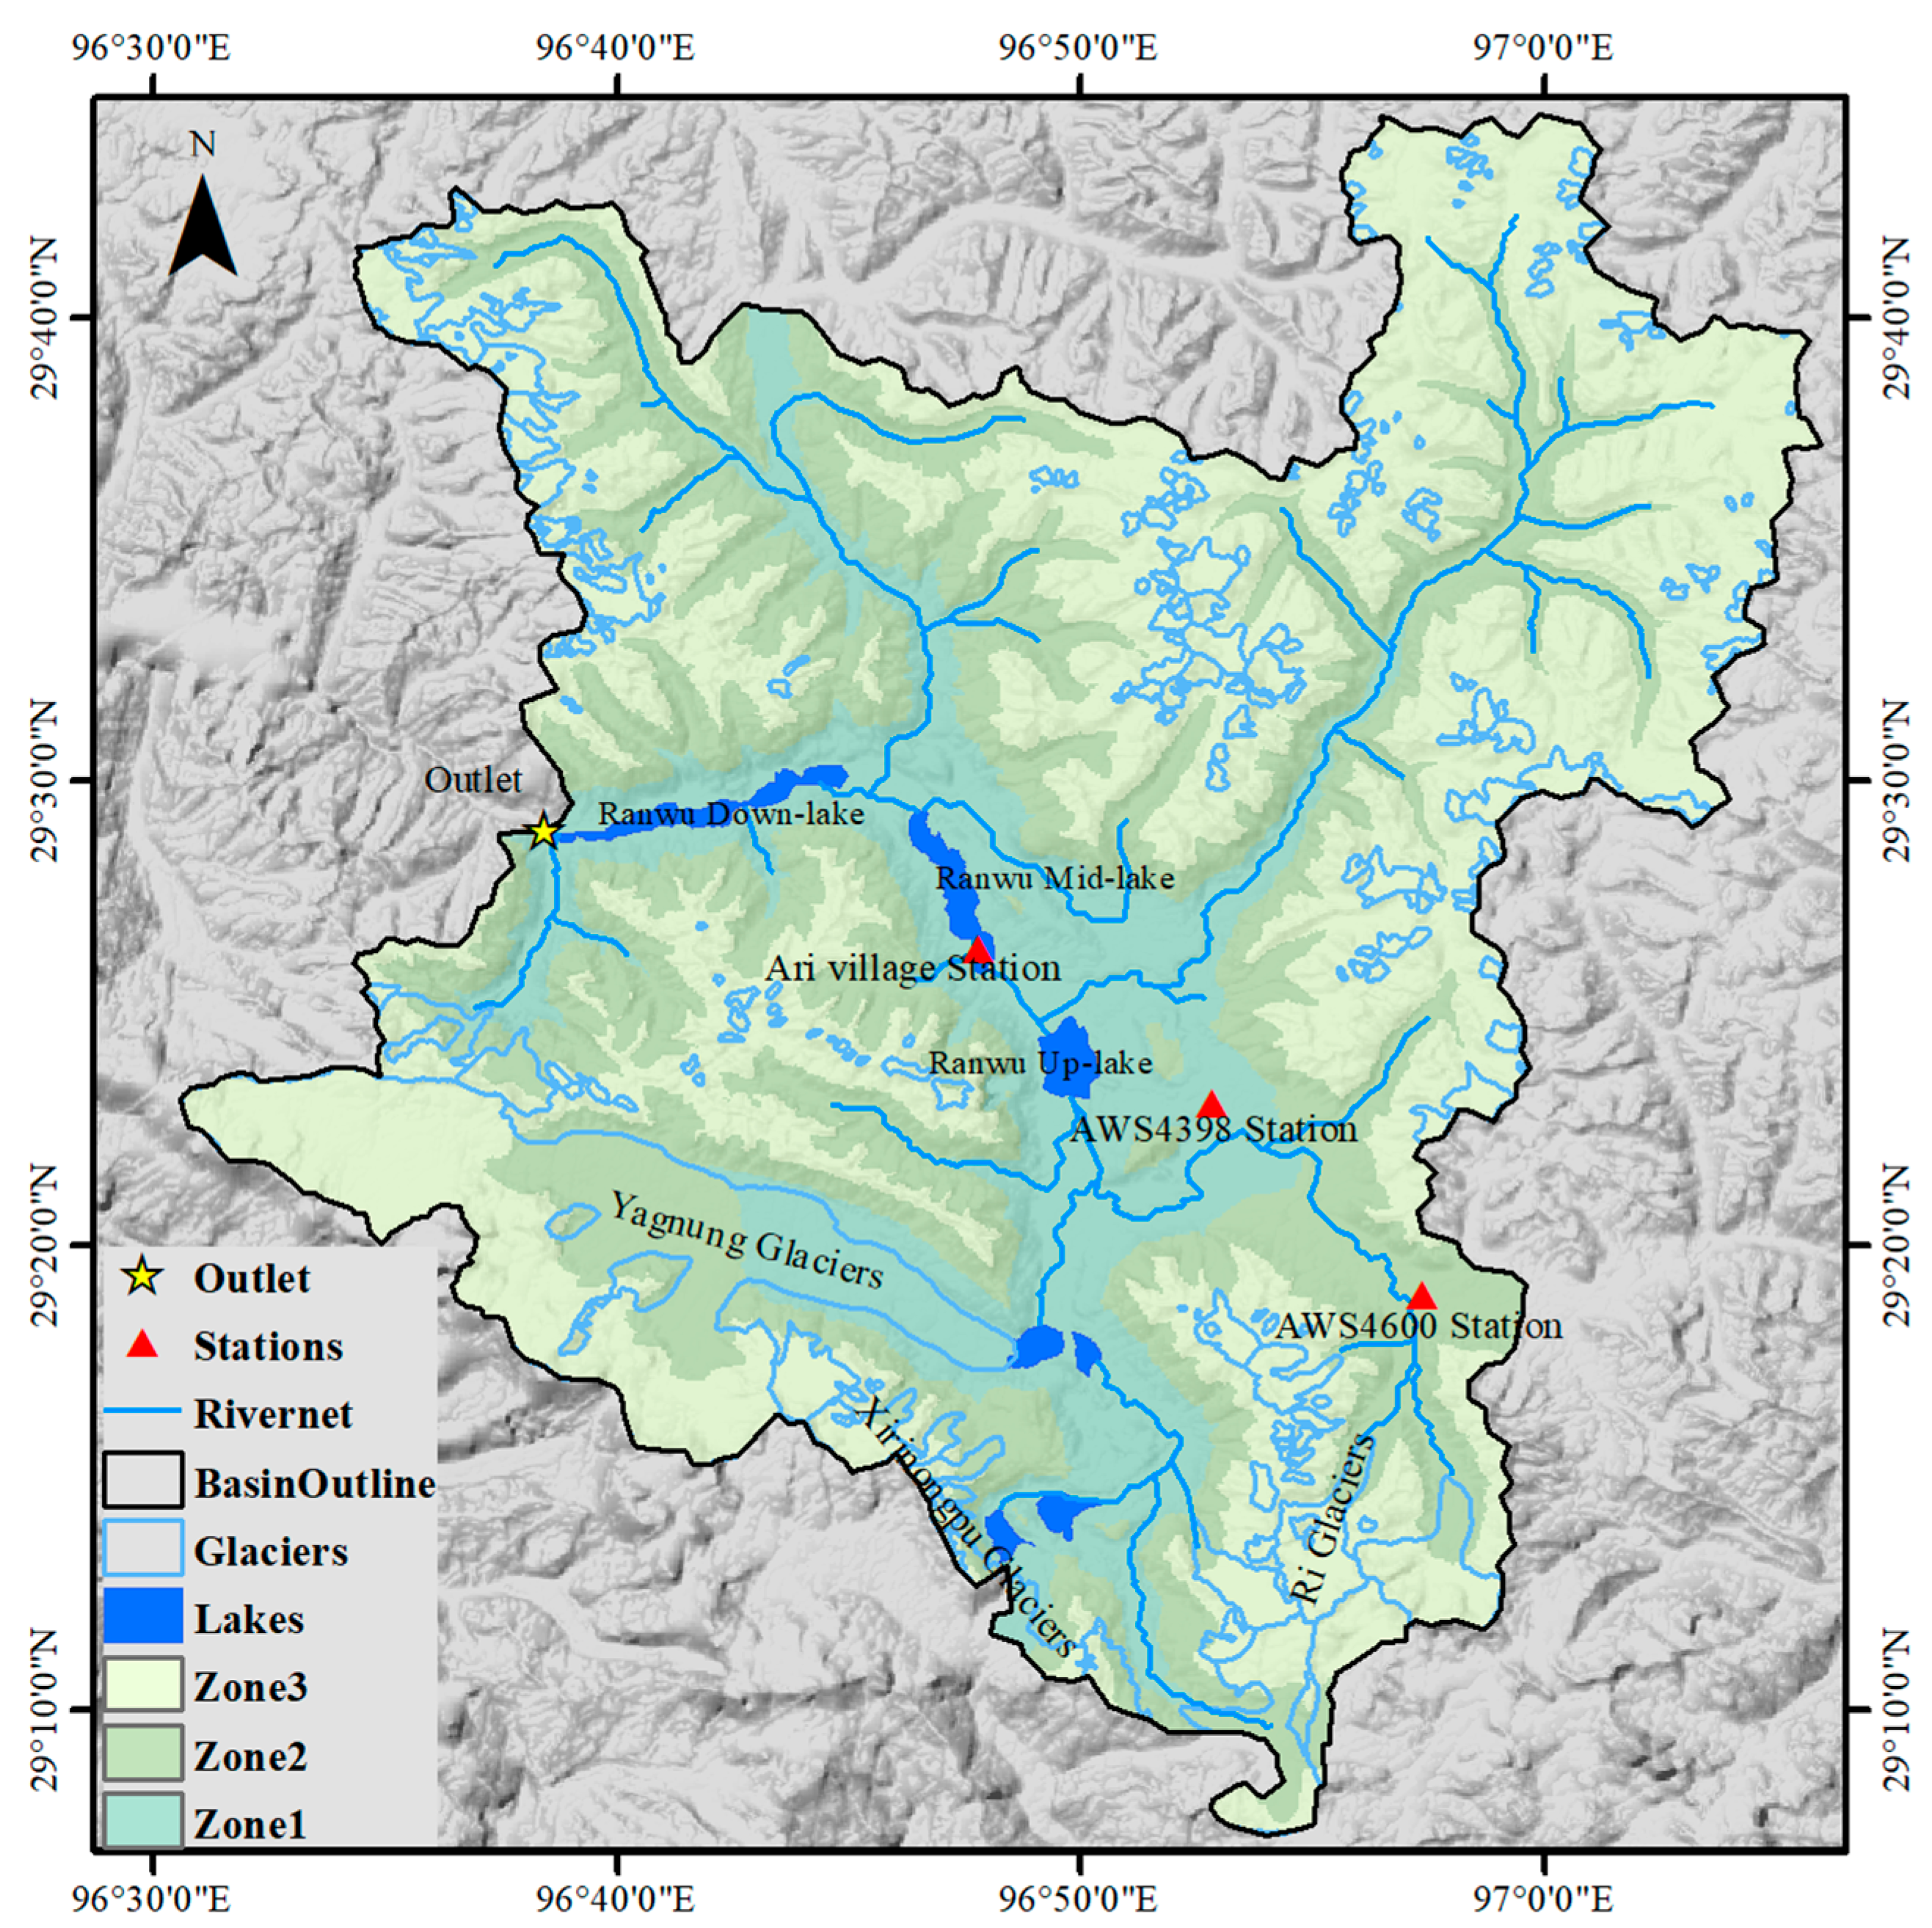
The Ranwu Lake basin, situated in the southeastern Tibet Plateau, is the source of the Parlung Zangbo River, the largest tributary of the Yarlung Tsangpo-Brahmaputra River. The basin comprises high mountains and valleys with elevations ranging from 3920 m to 6250 m asl. A significant number of marine glaciers are present in this region, and their meltwater constitutes a major source of runoff into the lake [
27,
28]. The watershed area of this lake basin is approximately 1979.25 km
2, out of which glacier area accounts for about 16.5%, i.e., 326.22 km
2 [
32]. Several lakes developed due to glaciation are scattered throughout the basin, among which the largest—Ranwu Lake (29°25′ N, 96°45′ E, 3920 m asl)—formed when a mountain collapsed into the original river channel, resulting in three interconnected lakes. The water entering these lakes eventually flows out through an outlet located on its northwest end into the Parlong Zangbo River (
Figure 1).
In order to clarify the spatial and temporal differences in climate change characteristics, we divided the Ranwu Lake basin into three zones according to altitude difference: zone 1 (lower than 4500 m asl), zone 2 (4500 to 5000 m asl), and zone 3 (higher than 5000 m asl) (
Figure 1). The areas of zone 1, zone 2, and zone 3 are 383.97 km², 641.28 km
2, and 954 km
2, respectively; accounting for 19.4%, 32.4%, and 48.2% of the total basin area.
The largest glacier group is in the Laigu valley of the Ranwu Lake basin, in which the Yagnung Glacier, with a length of approximately 32.5 km and a width ranging from 2–5 km, is the biggest glacier [
33]. On the one hand, water moisture brought by the India summer monsoon from the Bay of Bengal is able to be transported to this region via the Yarlung Zangbo River’s water moisture channel, resulting in relatively high rainfall and humidity levels in summer. On the other hand, from March of every year, the south branch of the westerlies in spring frequently disturb this area, which can also bring a large amount of moisture from the Bay of Bengal and form heavy precipitation. Therefore, there are two precipitation peaks during spring and summer seasons [
29,
34]. Additionally, numerous glaciers situated in southern parts often create local near-surface glacial winds during afternoons [
35].
2.2. Data Source
2.2.1. Meteorological Data
The meteorological data used in this research are from the China Meteorological Forcing Dataset (CMFD) (
http://data.tpdc.ac.cn, (accessed 11 October 2022)) [
36]. The CMFD combines Princeton Reanalysis Data, the GLDAS (Global Land Data Assimilation System), and GEWEX-SRB (Global Energy and Water Cycle Experiment-Surface Radiation Budget) radiation data, uses TRMM (Tropical Rainfall Measuring Mission) as precipitation-based data, and incorporates observed data from China Meteorological Administration ground stations as measured information [
37,
38]. The original spatial resolution of this dataset is 0.1°, and it covers the period from 1979 to 2018, which has been widely applied in lake hydrology and meteorology studies on the Tibet Plateau with reliable performance [
11,
19,
36,
39,
40]. The CMFD data were downscaled and compared with the in situ weather station data to improve the data accuracy for small-scale watersheds. One weather station was set in 2014 in Ari Village (29.47° N, 96.78° E, 3928 m) nearby the middle of Ranwu Lake. The other two weather stations were set at 4398 m asl (AWS4398 Station) and 4600 m asl (AWS4600 Station) on the mountain slope in 2011 (
Figure 1).
To explore the trends of meteorological variables in different seasons, the following section will discuss them in four seasons. The standard for seasonal division is that December of the previous year and January and February of each year are considered winter (DJF); March, April, and May are spring (MAM); June, July, and August are summer (JJA); while September to November are autumn (SON).
2.2.2. Future Climate Scenarios
Data from CanESM5, a dataset within CMIP6 (
https://www.canada.ca/, (accessed on 2 November 2022)), were used to simulate the potential effects of climate change on glacier and hydrological processes in the Ranwu Lake Basin. Previous research has demonstrated that CanESM5 accurately simulates temperature and precipitation patterns on the Tibet Plateau [
41,
42,
43]. To explore various future scenarios, we selected three scenario models—SSP1-2.6 (low-forcing), SSP2-4.5 (medium-forcing), and SSP3-7.0 (high-forcing)—to predict how glacier and hydrological processes may be impacted in the Ranwu Lake Basin under each respective scenario.
2.2.3. Other Data
The SPHY model needs specific data to operate, such as digital elevation model (DEM) data, glacier coverage maps, land use maps, and soil maps within the watershed. The DEM data are from the Shuttle Radar Topography Mission (SRTM) DEM with a resolution of 90 m sourced from the Geospatial Data Cloud (
https://www.gscloud.cn/, (accessed on 11 October 2022)). The glacier coverage map is derived from the RGI 6.0 dataset (
https://www.glims.org/RGI/, (accessed on 15 October 2022)), while land use information comes from the GlobCover Landuse dataset released by the European Space Agency in 2009 based on the 300 m MERIS sensor on board the ENVISAT satellite mission (
https://www.esa.int, (accessed on 15 October 2022)). Soil data for the watershed originate from the HiHydroSoil V2.0 dataset (
https://www.futurewater.eu/projects/hihydrosoil/, (accessed on 15 October 2022)) developed by the Future Water research team with an original resolution of 1000 m that includes physical characteristics of both topsoil and subsoil layers.
To calibrate and validate the hydrological model, runoff observations at the Ranwu Lake outlet are required. A water level–runoff curve was established using continuous water level observations and runoff volume between 2014 to 2018 to reconstruct out-flow runoff volume [
44]. Model calibration used data collected between years 2014–2016, while validation utilized those gathered in both years of 2017 and 2018.
3. Methodology
3.1. Basin Grid Downscaling of CMFD Data
According to Ding’s proposed temperature downscaling method [
45], the original CMFD data with spatial resolution of 0.1° was resampled according to a vertical temperature gradient to match the SPHY model’s target resolution of 270 m. The vertical temperature gradient within the basin was established by using weather station data of Ari village: AWS4398 and AWS4600 [
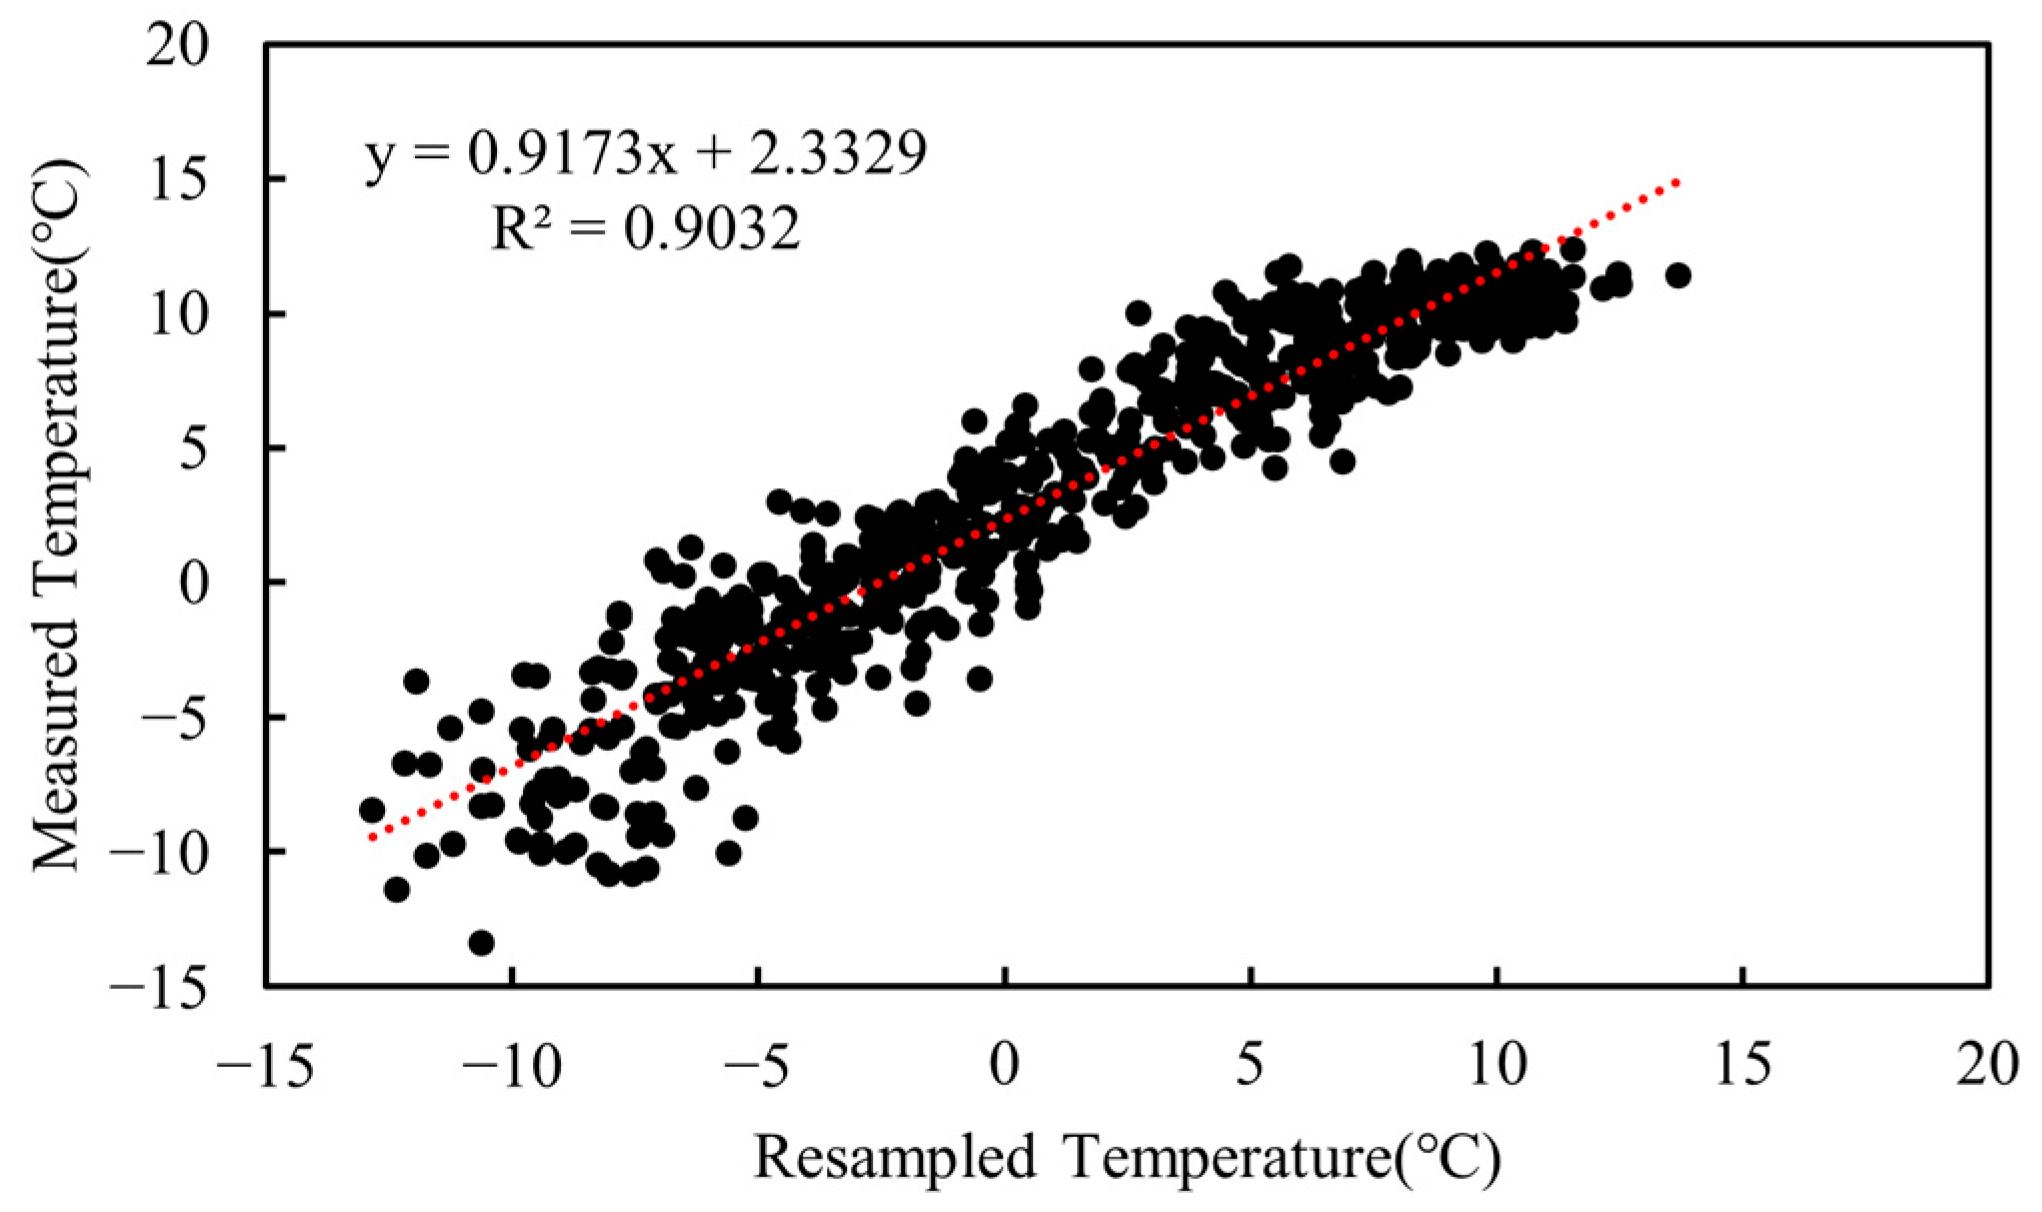
28]. The comparison between the downscaled CMFD data in the grid where the Ari village weather station is located and the actual measured meteorological station data during 2016 showed they were fitted very well (
Figure 2).
Yang et al. (2013) discovered that the CMFD dataset’s precipitation data can accurately capture actual precipitation events in glacier basins [
9], which has a proportionality factor of 0.7 to measured data. This study used CMFD precipitation data from the grid where the Ari village meteorological station (elevation 3928 m) is located as baseline data, calibrated it using a proportionality factor of 0.7, and calculated precipitation data for different elevations based on a consistent vertical gradient of approximately 0.17 mm·d
−1·100m
−1, which is consistent with other research on nearby areas’ rainfall gradients [
10,
46]. Comparison between calibrated total rainfall and observed rainfall at Ari Village showed that calibrated total rainfall amount and occurrence could represent actual rainfall (
Figure 3).
3.2. Mann–Kendall Trend Test and Sen’s Slope Estimator
The Mann–Kendall test is a non-parametric test method that does not require the tested sequence to follow a specific distribution [
47]. It is often used in trend and abrupt change analysis in hydrology and meteorology [
48,
49,
50]. The specific testing method assumes a set of time series variables (
, …,
) and defines the statistic
as
where
and
represent the measurement values corresponding to the
j-th and
k-th time, respectively, where
k > j. Afterwards, the variance of statistic
(
VAR(
S)) is calculated, and
S and its variance are used to define statistic
Z:The value of the statistical quantity Z in the above formula represents the trend of data changing over time. If Z is a positive number, it indicates an upward trend in the sequence to be tested; if Z is a negative value, it indicates a downward trend in the sequence to be tested.
The Mann–Kendall test can further identify the change points of trends beyond trend determination.
Building a set of time series
:
Defining statistical variables
:
where
;
.
According to the above method, the time series X is reversed to construct another set of statistical variables UBk. If the UFk value is greater than 0, it indicates an upward trend in sequence; if it is less than 0, it indicates a downward trend. When they exceed critical values, it means that changes have significant trends. The point where UFk and UBk intersect within the 95% confidence interval represents the occurrence of a mutation.
Sen’s slope is a non-parametric method that does not assume any specific distribution for the data and is robust to outliers [
51]. It estimates the median slope trend of all length segments, thus removing the influence of larger outliers on the data. It is used to express the degree of significant change in long time series and has been widely used in hydro-meteorological time series [
52,
53,
54].
where
and
are the data values at time
j and
k (
j >
k), respectively.
3.3. Spatial Processes in Hydrology (SPHY) Model and Calibration
The SPHY model is a hydrological model that uses the PCRaster dynamic modeling framework and is written in Python. It is cell-based, spatially distributed, and simulated at a daily time step, consisting of six modules: glaciers, snow cover, groundwater, dynamic vegetation, simple routing mode, and lake/reservoir module. The model integrates key components of commonly used models such as SWAT, SWAP, HimSim etc., making it useful for evaluating the impact of climate change on basin water supply from ice and snow sources at different scales. Users can select required modules according to their needs by closing unnecessary hydrological process modules to reduce running time and input data volume. Many studies on the Tibet Plateau have shown that the model can simulate high-altitude glacier-fed river hydrological processes very well [
6,
30,
31,
55].
The SPHY model can distinguish different runoff components and generate rainfall runoff, snowmelt runoff, glacial melt runoff, and baseflow based on different production processes, while total runoff is calculated as the sum of these components. The calculation formula for total runoff is as follows:
where
QTR,
QBF,
QRR,
QSR, and
QGR are the total runoff, baseflow, rainfall runoff, snowmelt runoff, and glacial melt runoff, respectively.
In this study, we focused on the whole catchment hydrological processes rather than the water balance of Ranwu Lake. Due to the annual and inter-annual variations in lake water storage only accounting for a small proportion compared to the total basin runoff [
28], the lake module was not chosen, and the lake was treated as a wide river channel for hydrological calculations.
The accuracy of the SPHY model is evaluated using the Nash–Sutcliffe coefficient (NSE) and Bias, which is a commonly accepted criterion to indicate how well a model is able to simulate observations [
56].
where
is the mean of observed discharges,
and
are observed and modeled discharge at time
t, respectively.
The Bias is defined as
where
and
are observed and modeled discharge at time
t, as mentioned above.
The model parameters were adjusted using Parameter Estimation (PEST) in this study. It has the advantages of the inverse Hessian method and steepest descent method and can obtain optimal parameter results with fewer model runs [
57]. Through continuous adjustments, the simulated output of the model approaches the measured value used for correction and obtains the optimal parameters for the model’s simulation effect.
The input data information required for SPHY model simulation is shown in
Table 1. In this study, the measured runoff data of the Ranwu Outlet from 2014 to 2016 were used to calibrate the SPHY mode, and the runoff data of this location from 2017 and 2018 were used to verify the simulation results.
3.4. Statistical Down Scaling Model (SDSM)
The Statistical Down Scaling Model (SDSM) can quickly generate multiple low-cost scenarios for daily surface weather variables at individual sites under current and future climate conditions. The basic idea of the SDSM model is to establish a statistical relationship between the meteorological variables output by the atmospheric circulation model and the meteorological observations at local stations [
58]. This statistical relationship includes two parts: one is the relationship between the meteorological variables output by the circulation model and the meteorological observations at local stations; the other is the relationship between the meteorological variables output by the circulation model and the circulation model itself. By modeling these two relationships, the SDSM model can downscale meteorological variables from the output of atmospheric circulation models to local stations, providing high-resolution meteorological forecasts.
The SDSM model usually needs to establish a statistical relationship between the historical data of site data and prediction datasets to build the model structure and calibrate the model. Then, the weather generator module in the SDSM model will use methods such as probability distribution, autoregressive models, and Markov chains to generate future daily weather series that are similar to historical meteorological data. The scenario generator will generate corresponding daily weather series based on different future climate scenarios.
After its release, the SDSM has been widely applied globally, especially in water resource management and natural disaster prediction analysis [
59]. Its application on the Qinghai-Tibet Plateau indicates that the model can provide good predictions of future climate scenarios in areas such as temperature, precipitation, and evapotranspiration [
55,
60,
61].
However, because there was no in situ observation data in the Ranwu Lake basin before 2014 and nearby meteorological stations could not represent the basin conditions, we use the calibrated CMFD data as the station data from 1979 to 2014 to establish and calibrate the SDSM model.
Figure 4 shows that the basin-average temperature and precipitation output from the established SDSM have good relationships with the CMFD data. Using the established SDSM, we generated future climate forcing data in basin scale for three different scenarios: SSP1-2.6, SSP2-4.5, and SSP3-7.0. Further, we used the basin grid downscaling method shown in
Section 3.1 to generate the full-basin grid forcing data required for SPHY model simulation.
4. Results and Discussion
4.1. Trends of Past Climatic Variables
4.1.1. Trends of Temperature Change
The hydrological process of the Ranwu Lake basin is dominated by glacial meltwater and snow meltwater, and the glaciers in the basin are highly sensitive to temperature changes [
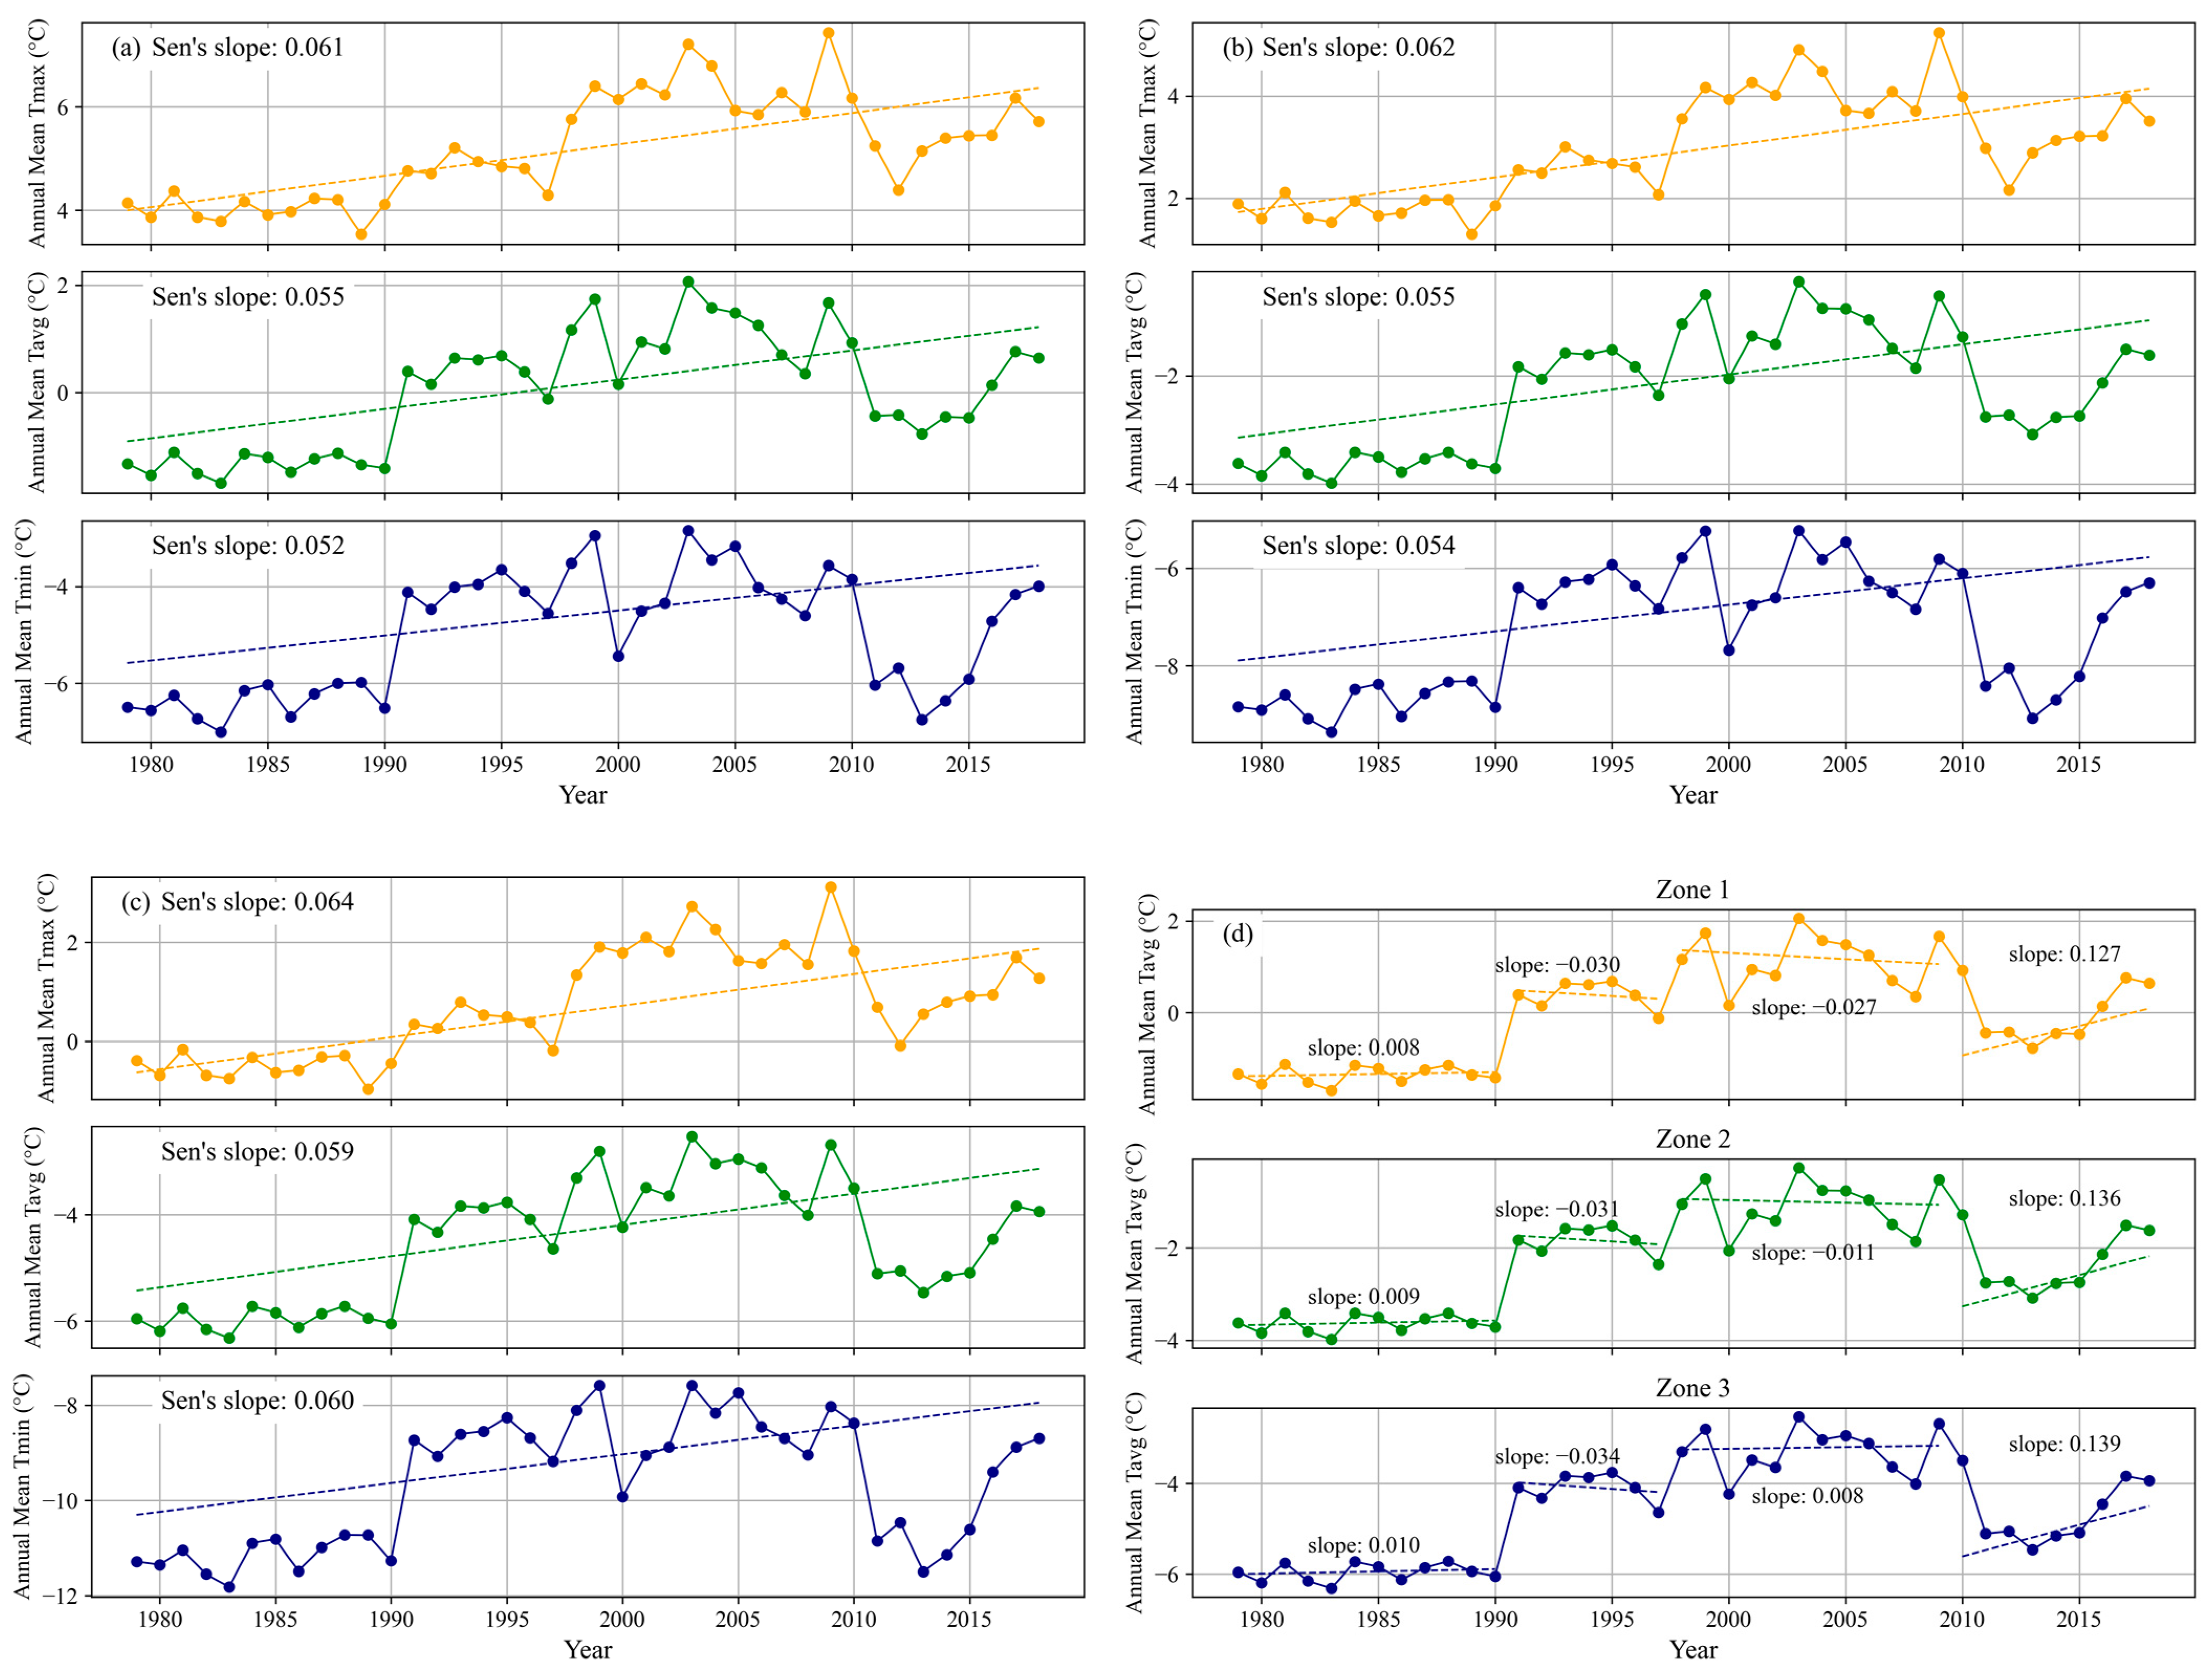
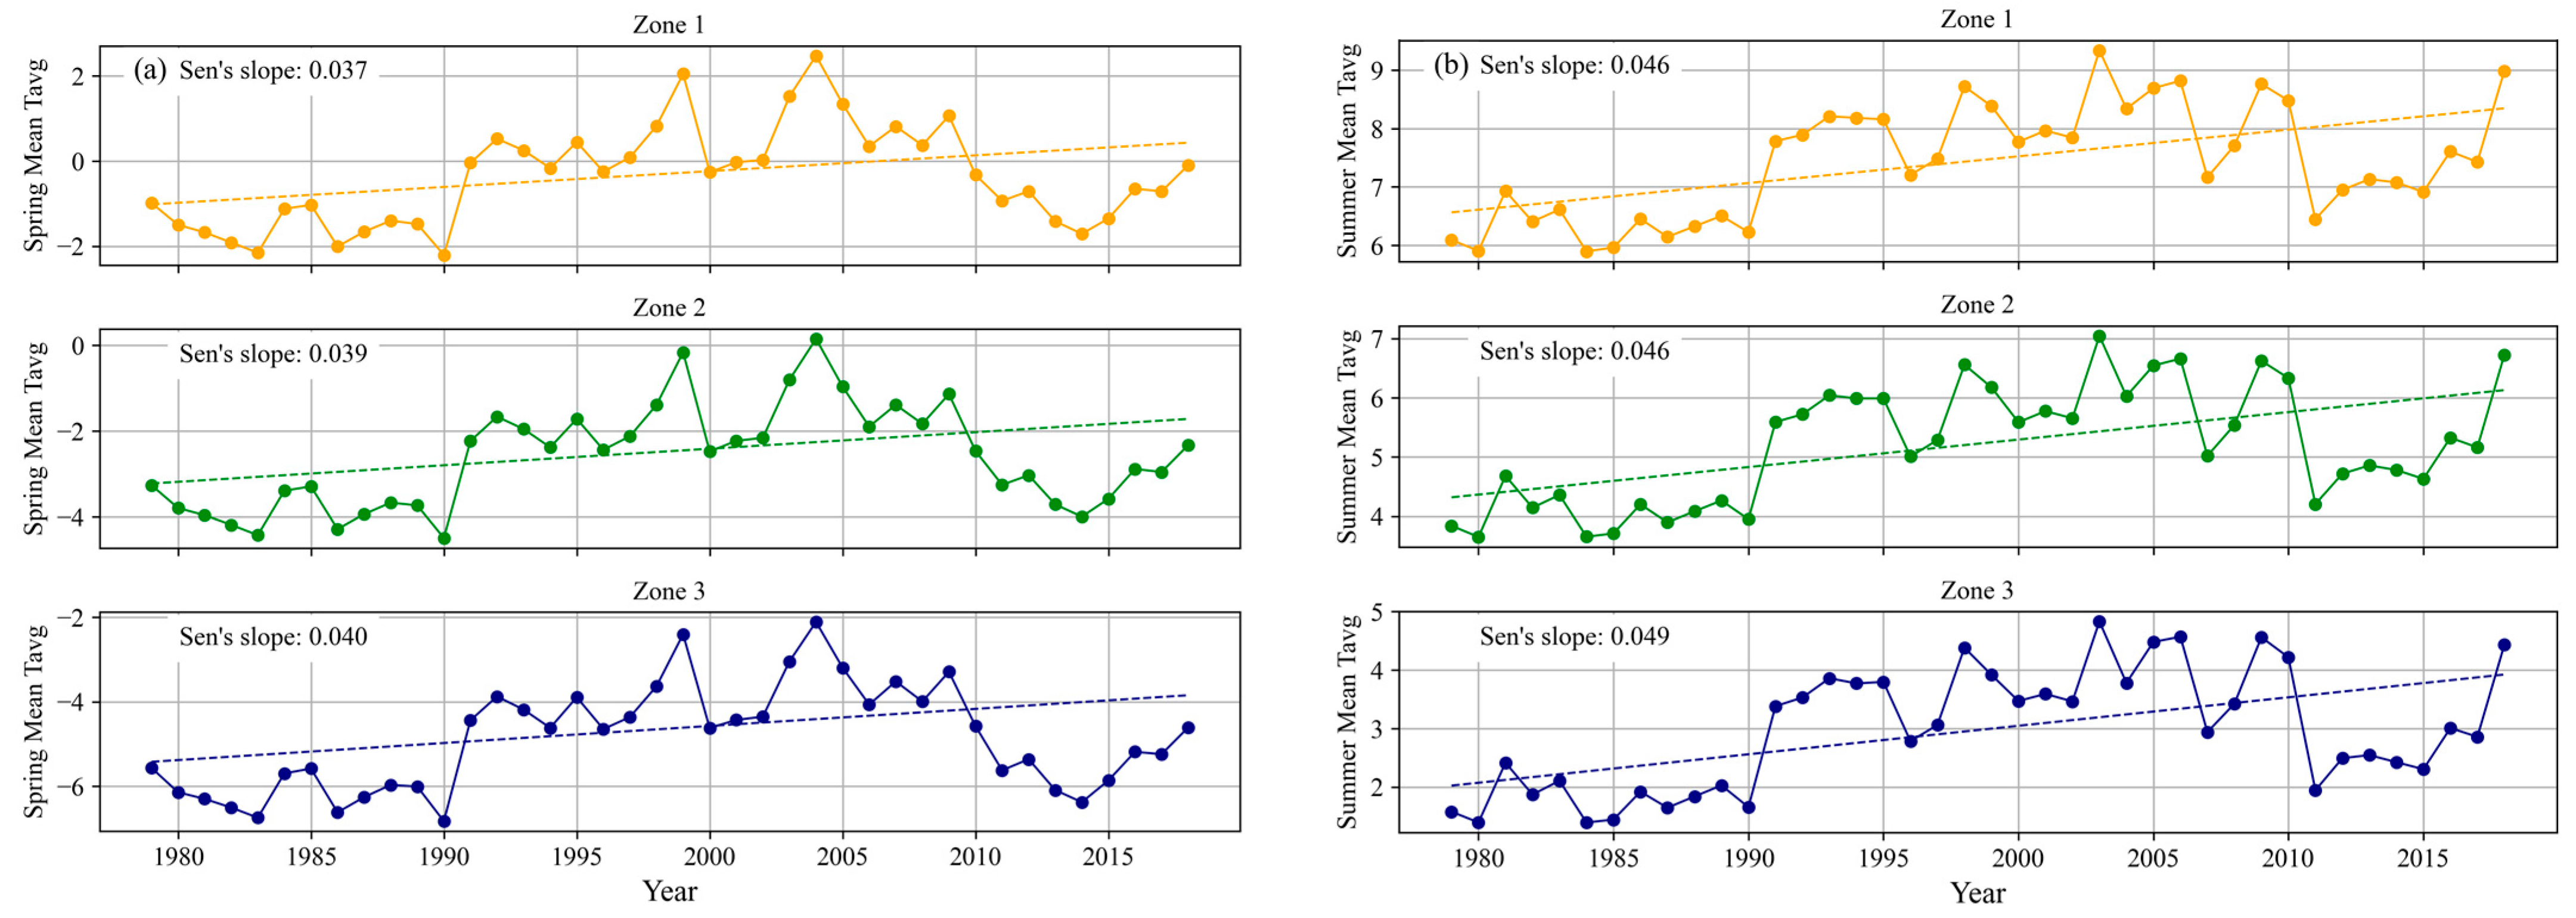
19]. Temperature also indirectly influences hydrological processes by affecting the form of precipitation. The Mann–Kendall test results indicate a significant upward trend in annual mean daily average, maximum, and minimum temperatures at different elevations of the Ranwu Lake basin. The daily maximum temperature shows a greater upward trend than the daily average temperature and minimum temperature in middle- and low-elevation areas. Among these three variables, high-elevation areas have the smallest upward trend for daily average temperature. All three variables show an obvious upward trend in high-elevation areas followed by middle-elevation areas, while low-elevation areas have the smallest upward trend (
Figure 5).
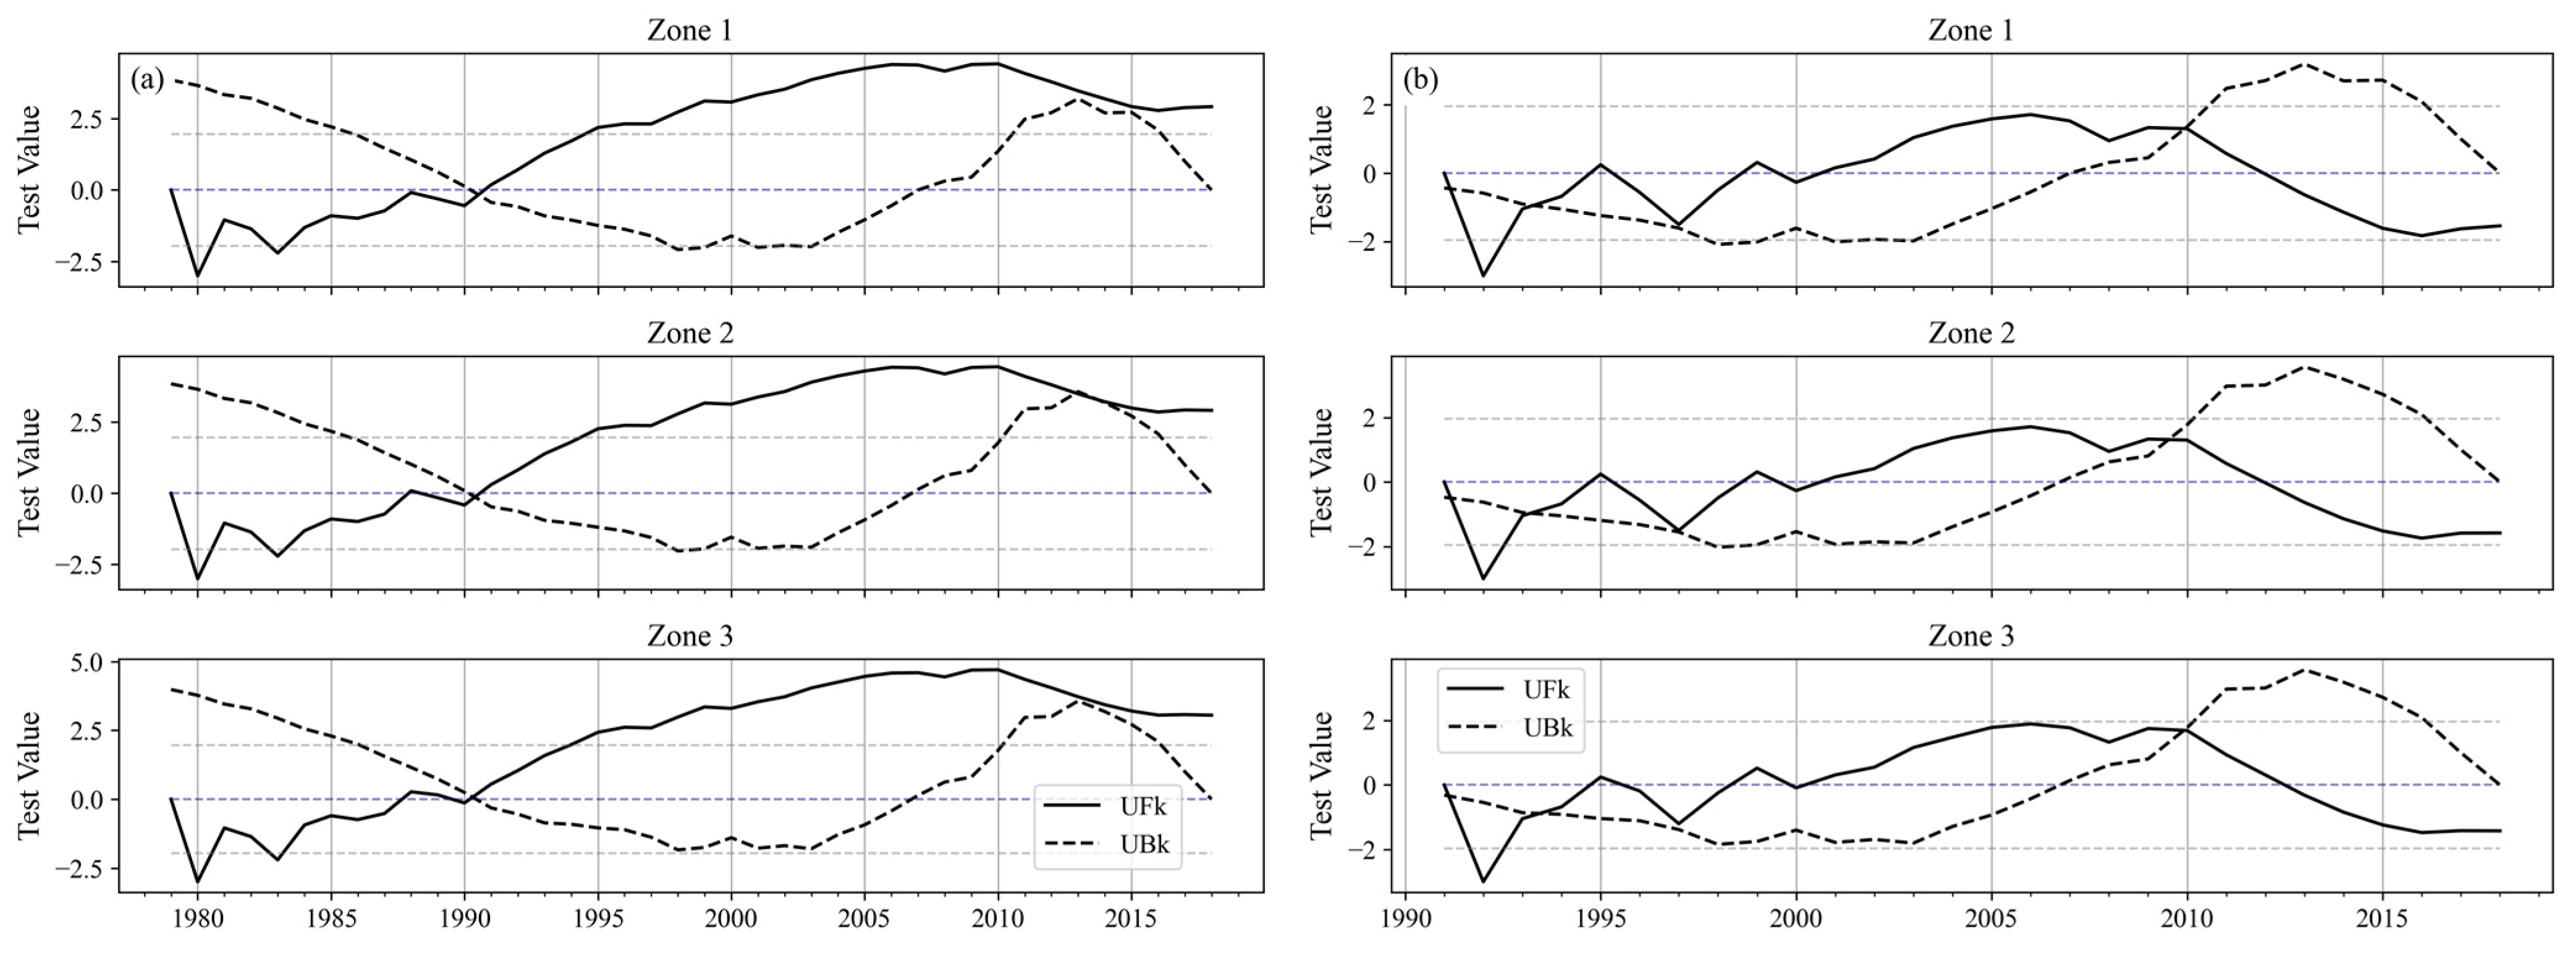
Figure 6 shows the change points of temperature in the watershed obtained by the Mann–Kendall method. The results indicate that, at three different elevations, the trend change point of annual average temperature over a period of 40 years was in 1991. Further Mann–Kendall tests were conducted on temperature data from 1991 to 2018, and the results show that there is also heterogeneity in the changing trend of temperature during this period. Significant changes occurred between 1997–1998 and 2009–2010.
Overall, the annual average temperature variations in the Ranwu Lake basin can be divided into four stages over the past 40 years. From 1979 to 1990, temperatures were generally low and had small fluctuations, showing a slow upward trend. From 1990 to 1991, temperatures exhibited a sudden change. From 1991 to 1997, temperatures increased significantly compared to the previous stage but still had little interannual fluctuation and showed an overall slow downward trend. In the decade from 1998 to 2009, temperatures rose significantly compared to the previous stage, with larger fluctuations. From 2009 until now (2021), there has been an increasing trend in temperature with more significant warming than before (
Figure 7).
During the two warming periods of 1991–1997 and 1998–2009, there were differences between altitude zones regarding changes in temperature trends: during the former interval (1991–1997), temperatures decreased slowly overall while high-altitude regions cooled more than low-altitude regions; whereas during the latter interval (1998–2009), although low-altitude regions showed slightly decreasing temperatures, high-altitude regions did not show any signs of cooling down, which may be due to differences caused by El Niño events after 1998 even though these differences are not significant on a scale of forty years.
The temperature changes in different seasons in the Ranwu Lake basin also showed different characteristics. All altitude gradients in the basin show the most obvious warming trend in winter, followed by autumn; and the smallest warming trend in spring (
Figure 7).
4.1.2. Trends of Precipitation Change
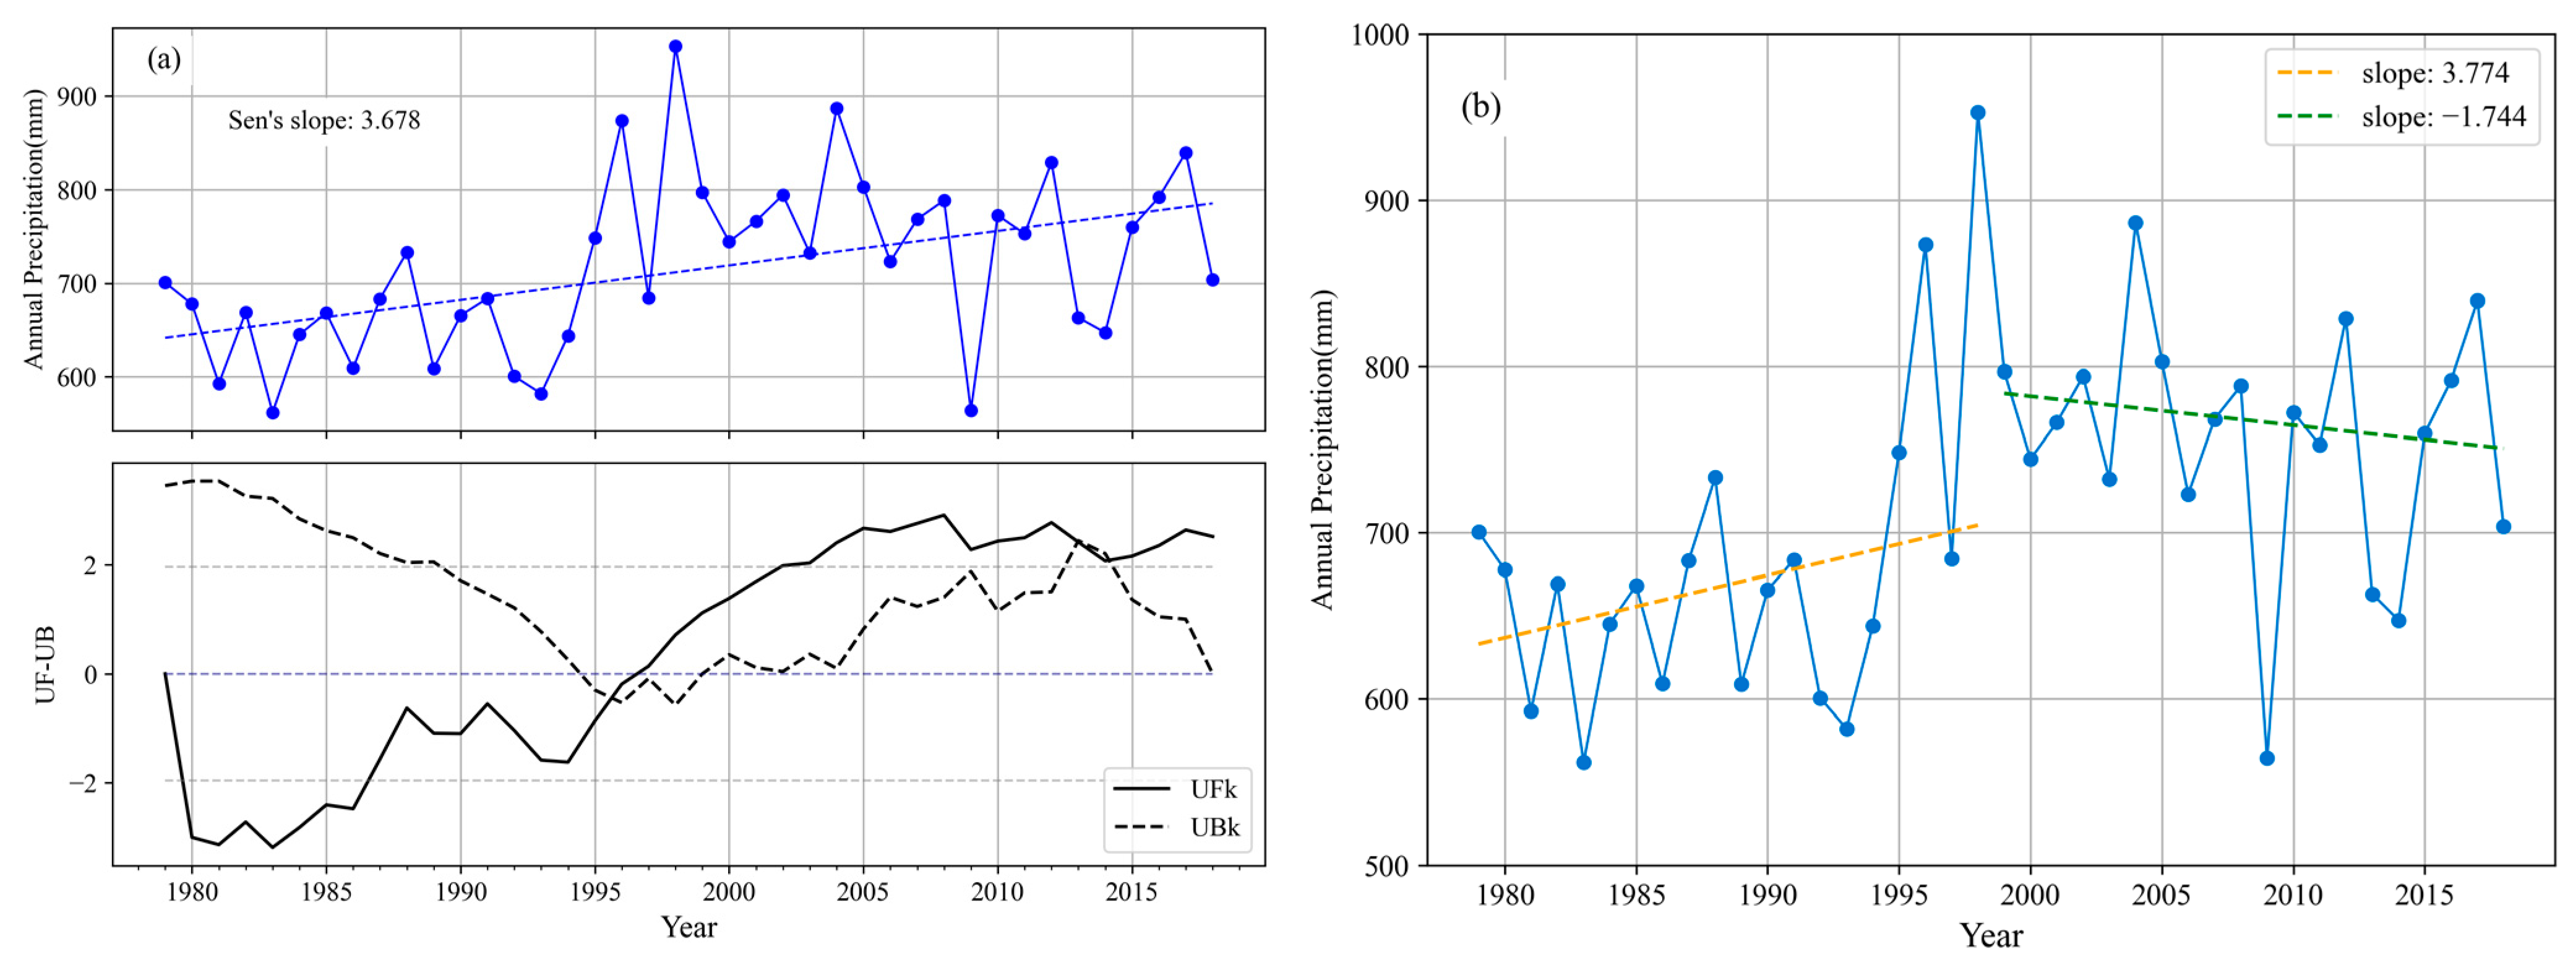
From 1979 to 2018, the average annual precipitation in the Ranwu Lake basin was approximately 711 mm/y. The fluctuations were significant and displayed a notable increasing trend of 36.78 mm/10 y (
Figure 8). According to the Mann–Kendall test, it is known that the change point of precipitation in the past 40 years was in 1995–1996. After the change point, there was an increase in monthly precipitation compared to before. The average annual precipitation from 1979 to 1996 was 663.74 mm, while from 1997 to 2018 it was 759.36 mm. During the strong El Niño phenomenon in 1997 and 1998, the precipitation was abnormal in these two years. Therefore, the El Niño event in 1998 is usually regarded as a turning point for precipitation. The greatest increase in precipitation occurred during spring, especially in May. Before 1998, overall precipitation was low with a slight fluctuating increasing trend with a rate of 37.74 mm/10y. Due to the strong El Niño event, there was a peak in precipitation levels for 1998, which were the highest seen over the last forty years. Since then, UF values for precipitation have been greater than zero, indicating a significant increase after this change point as compared to previous periods. However, the overall basin-wide rainfall has shown a fluctuating decreasing trend between the years of 1998 and 2018 with a rate of −17.44 mm/10y (
Figure 8). The average precipitation on the Tibet Plateau as a whole also showed a significant increase in May and August around 1998, and the increase in May precipitation was significantly correlated with the South Asian monsoon index [
23,
24].
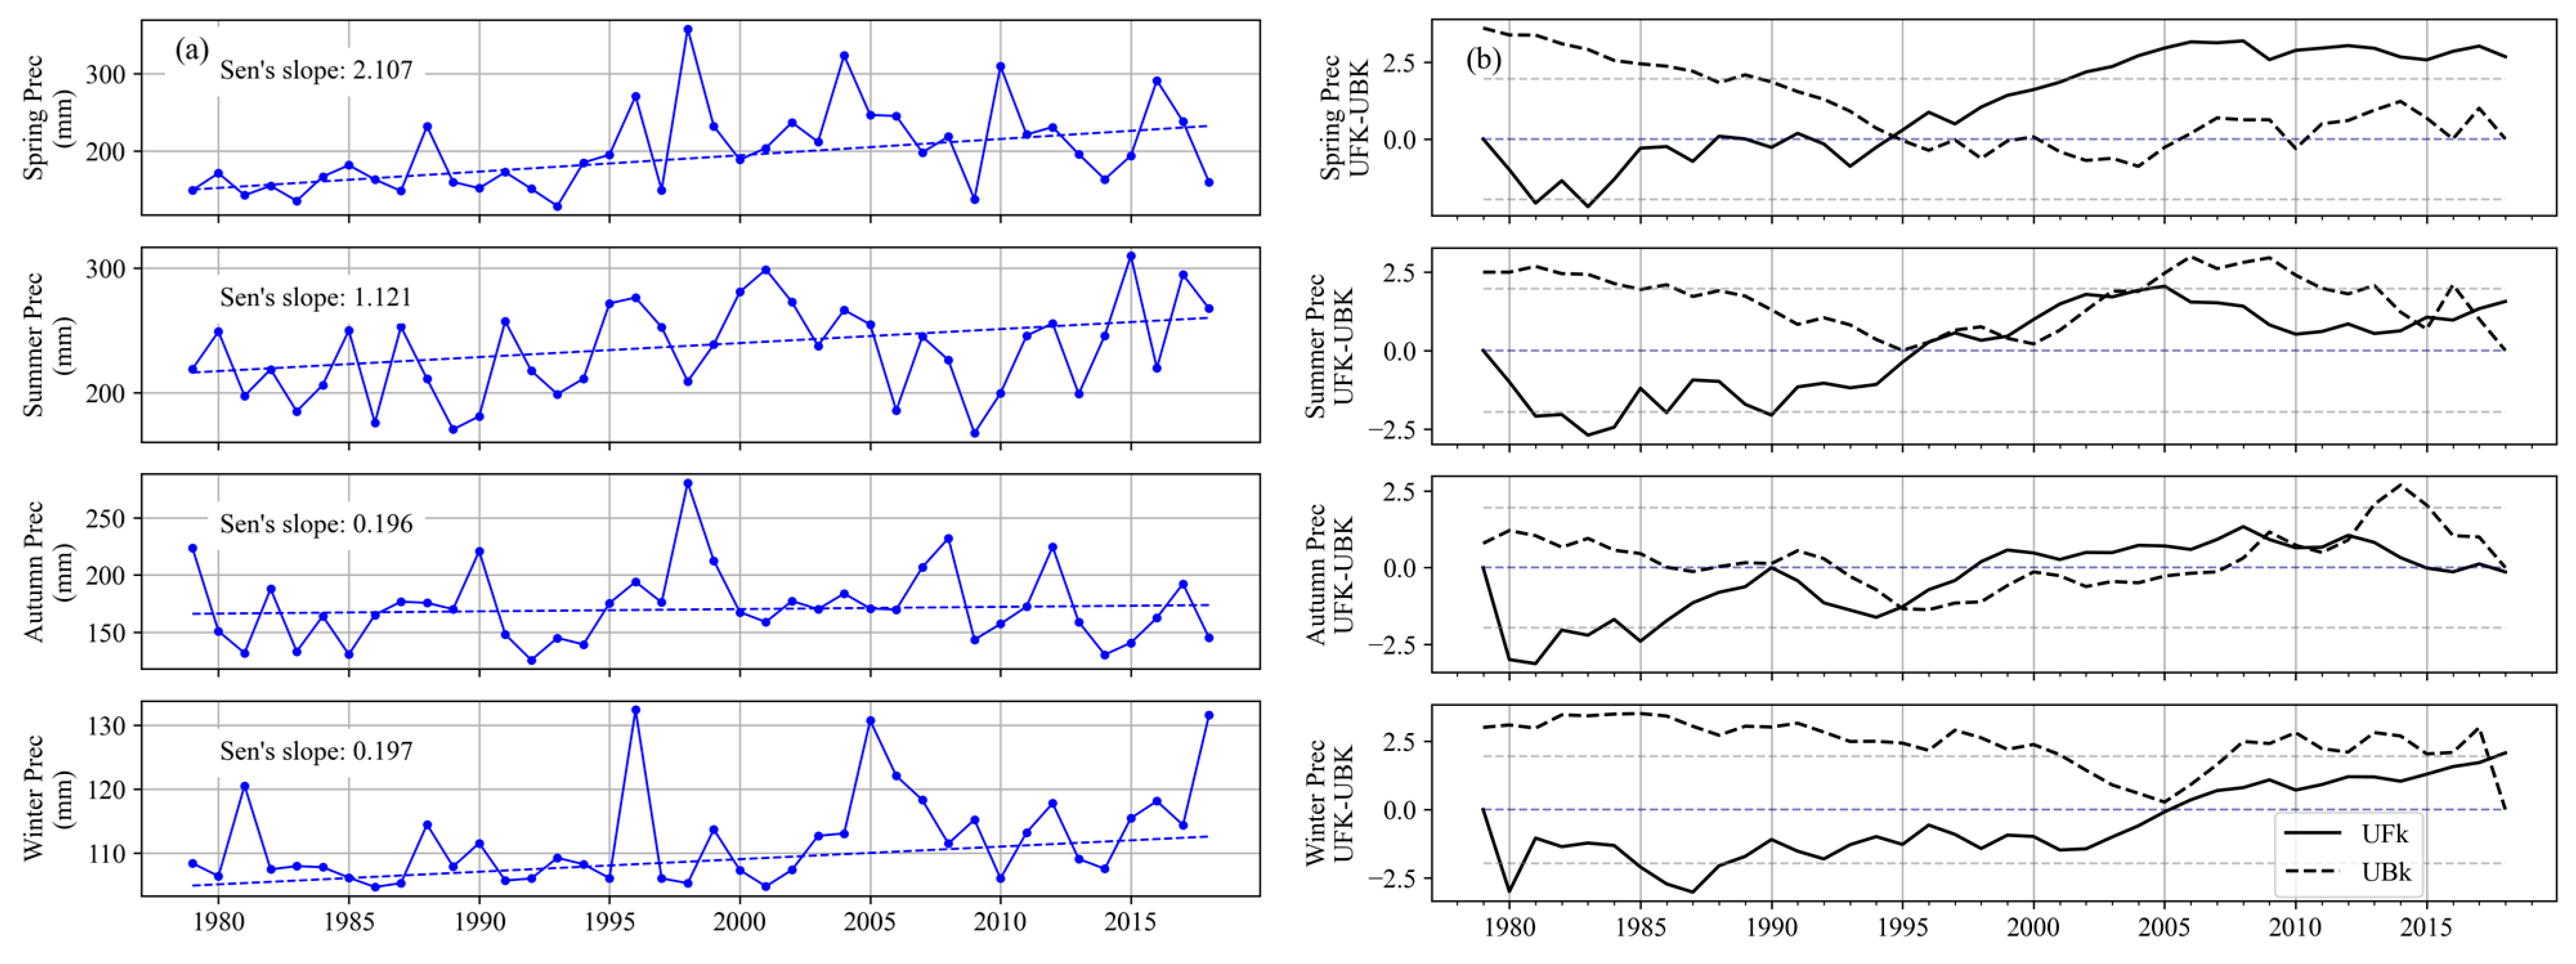
Precipitation is unevenly distributed throughout the seasons, with spring and summer being the primary concentration periods. In spring, the south branch of the westerlies brings water moisture from the Bay of Bengal that mainly influences spring precipitation, which is mostly solid and an essential source of glacier accumulation within the basin. In summer, the India summer monsoon transports more water moisture and forms liquid precipitation. Between 1979 and 2018, the average precipitation for spring, summer, autumn, and winter was 200.48 mm, 233.1 mm, 172.27 mm, and 111.91 mm, respectively. Winter precipitation accounts for only 15% of total annual precipitation while spring accounts for about 27%, summer around 32%, and autumn roughly 24%.
The Mann–Kendall test revealed an increasing trend in all four seasons with the highest increase observed during spring followed by summer, specifically an increase of 21.07 mm/10y for spring and 11.21 mm/10y for summer, while autumn and winter had smaller increases of only 2.76 mm/10y and 2.79 mm/10y, respectively (
Figure 9). The trend change point in spring occurred around the year 1995, after which UF values have been greater than zero, indicating a clear upward trend since year 2000. The change point of summer precipitation occurred around 1998 with UF values exceeding zero, showing more significant upward trends. The data also shows two additional changes occurring around years 2006 and 2015. For autumn rainfall, there are multiple changes occurring at various points including years 1990, 1995, and approximately 2010. The winter season experienced its latest change point among all four seasons, which happened around 2004, indicating substantial alterations in precipitation levels compared to before. UF values have remained above zero from year 2003 onwards, signifying a noteworthy rise in winter rainfall amounts over time when compared to previous periods.
4.2. Calibration and Validation of SPHY Model
The SPHY model parameters for the basin were optimized using the PEST calibration software, and the calibration period was from 14 April 2014 to 31 December 2016. The optimized results are shown in
Table 2.
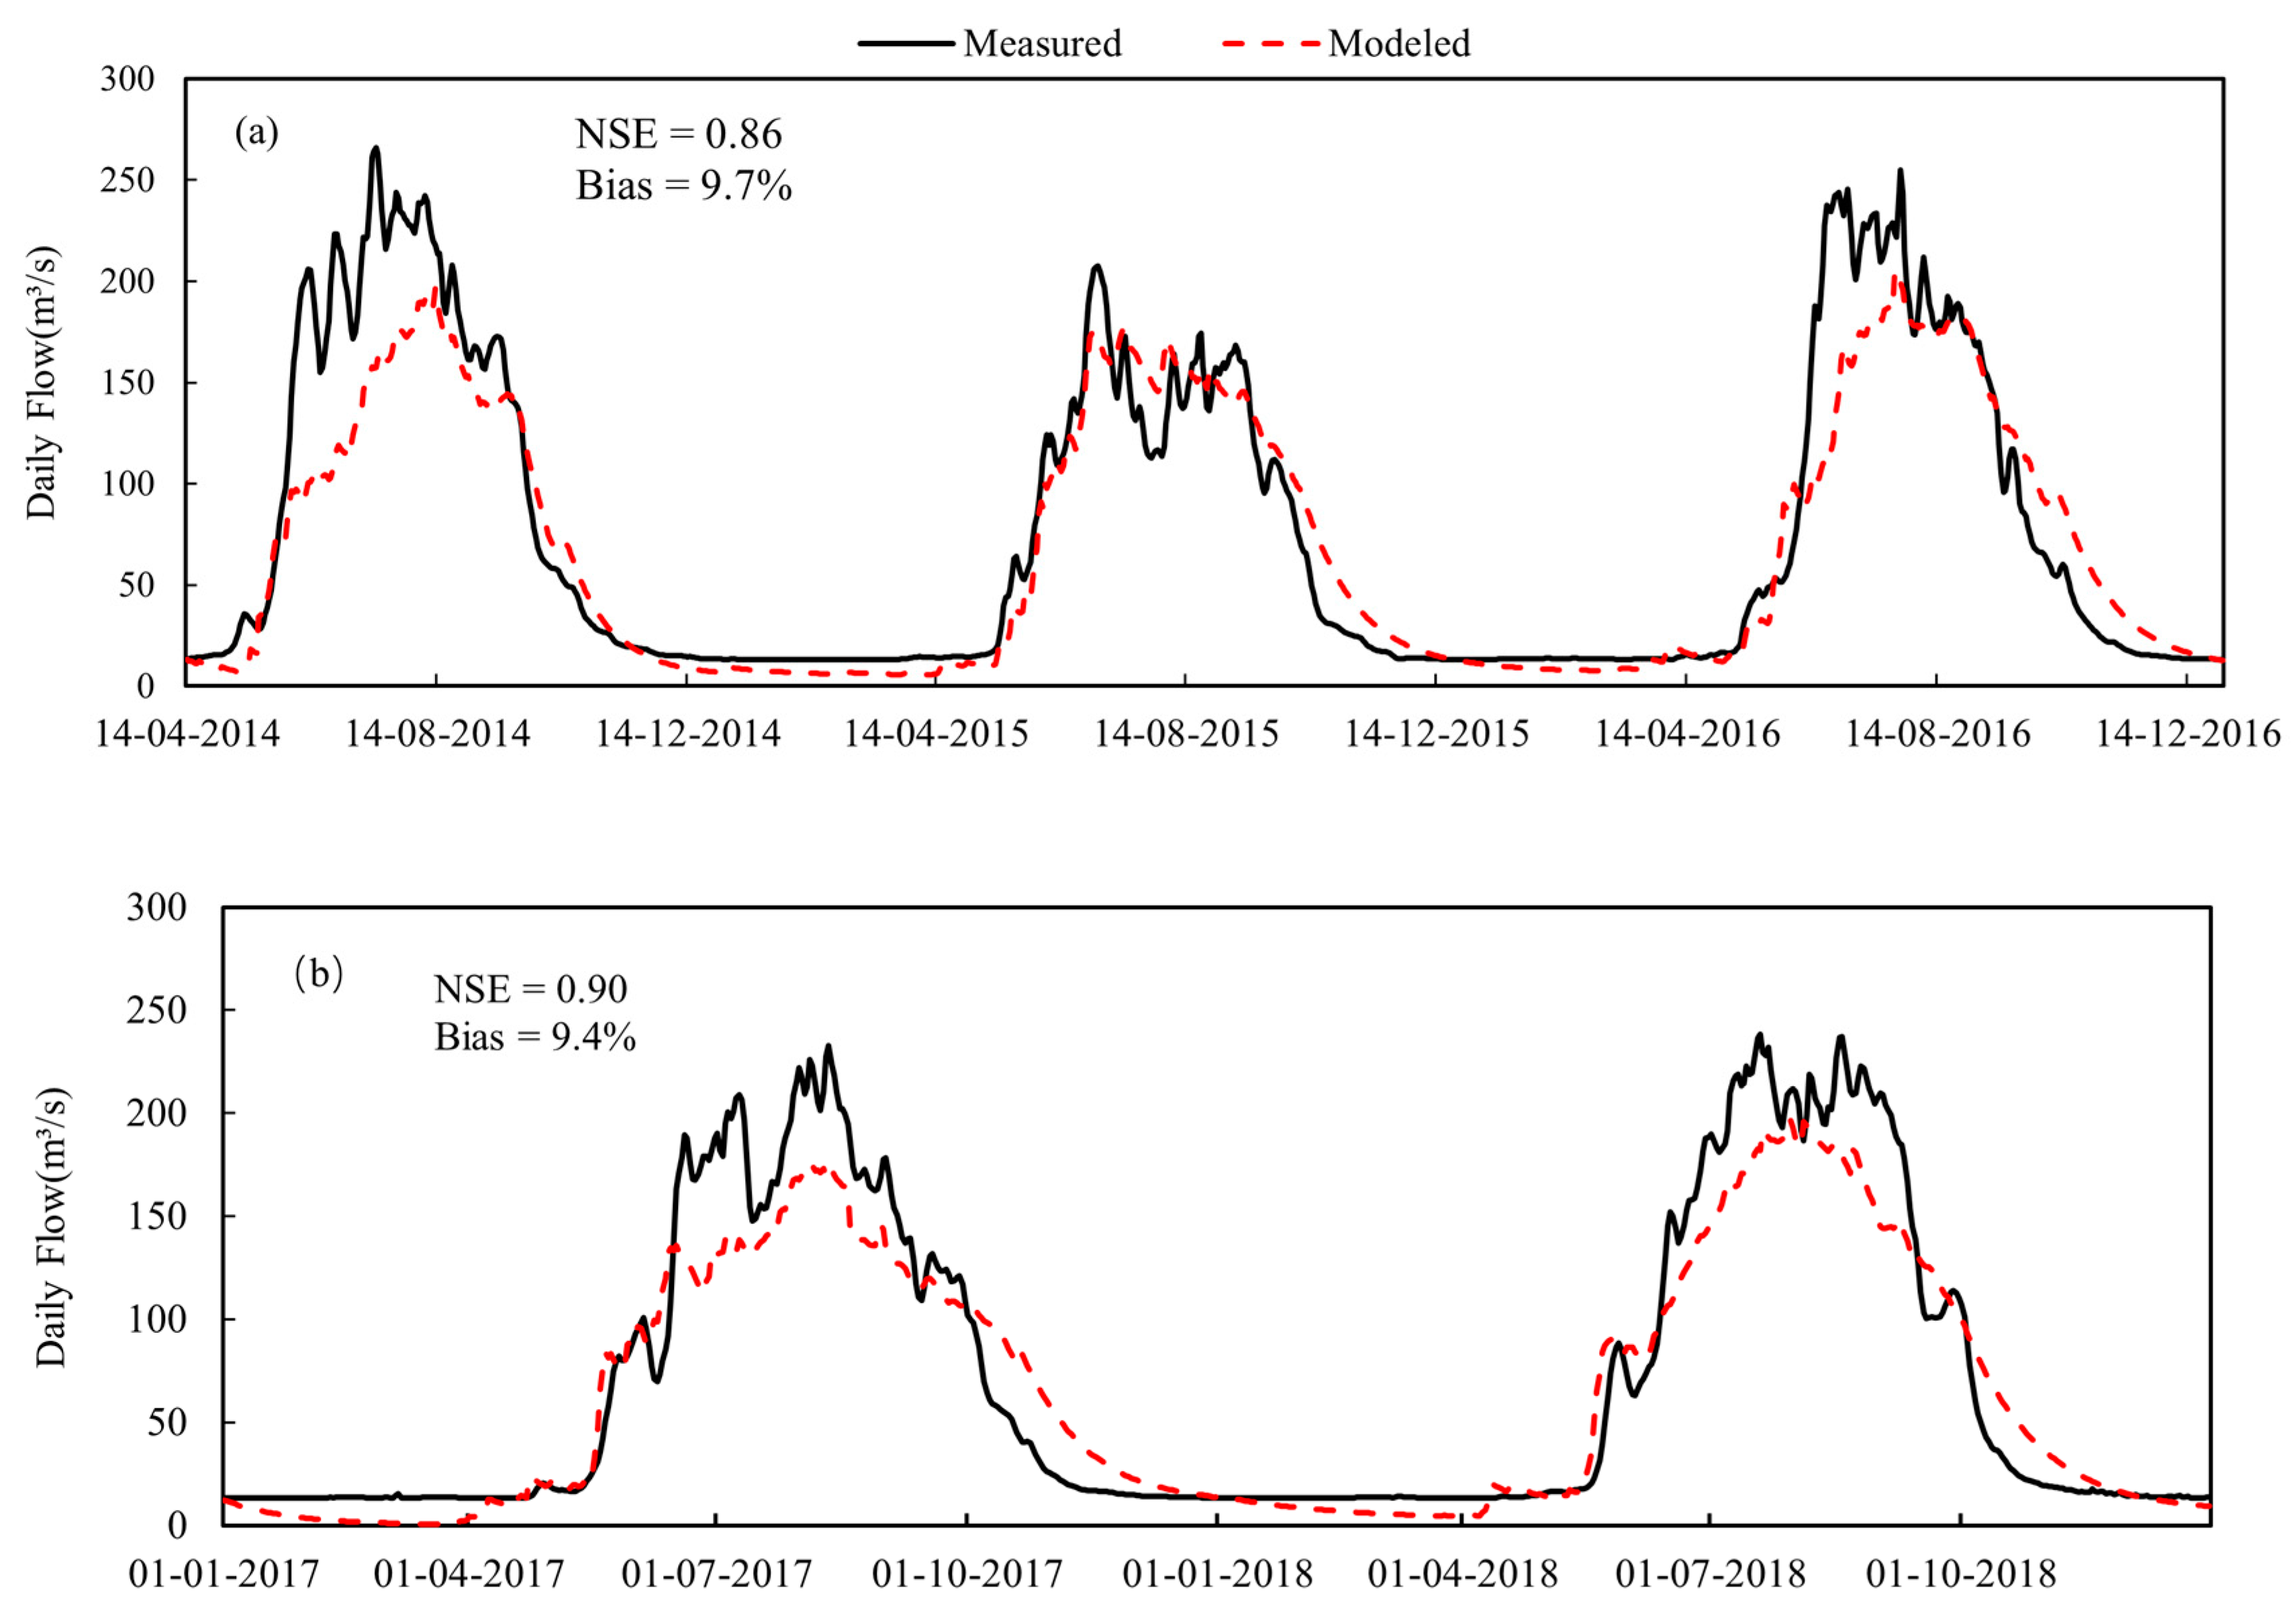
The comparison results between measured runoff and simulated runoff at the outlet of the Ranwu Lake during the model calibration period are shown in
Figure 10a, with NSE and Bias values of 0.86% and 9.7%, respectively. To further verify the reliability of the simulated parameters, we used measured runoff data from 2017 and 2018 to validate the calibrated results. The results show that the NSE and Bias between the measured and simulated runoff are 0.9% and 9.4%, respectively (
Figure 10b). The model has a good simulation effect on peak flow and base flow processes. Therefore, the model is applicable in the Ranwu Lake basin and can be used to simulate future changes in runoff.
4.3. Runoff Components Output from SPHY Model
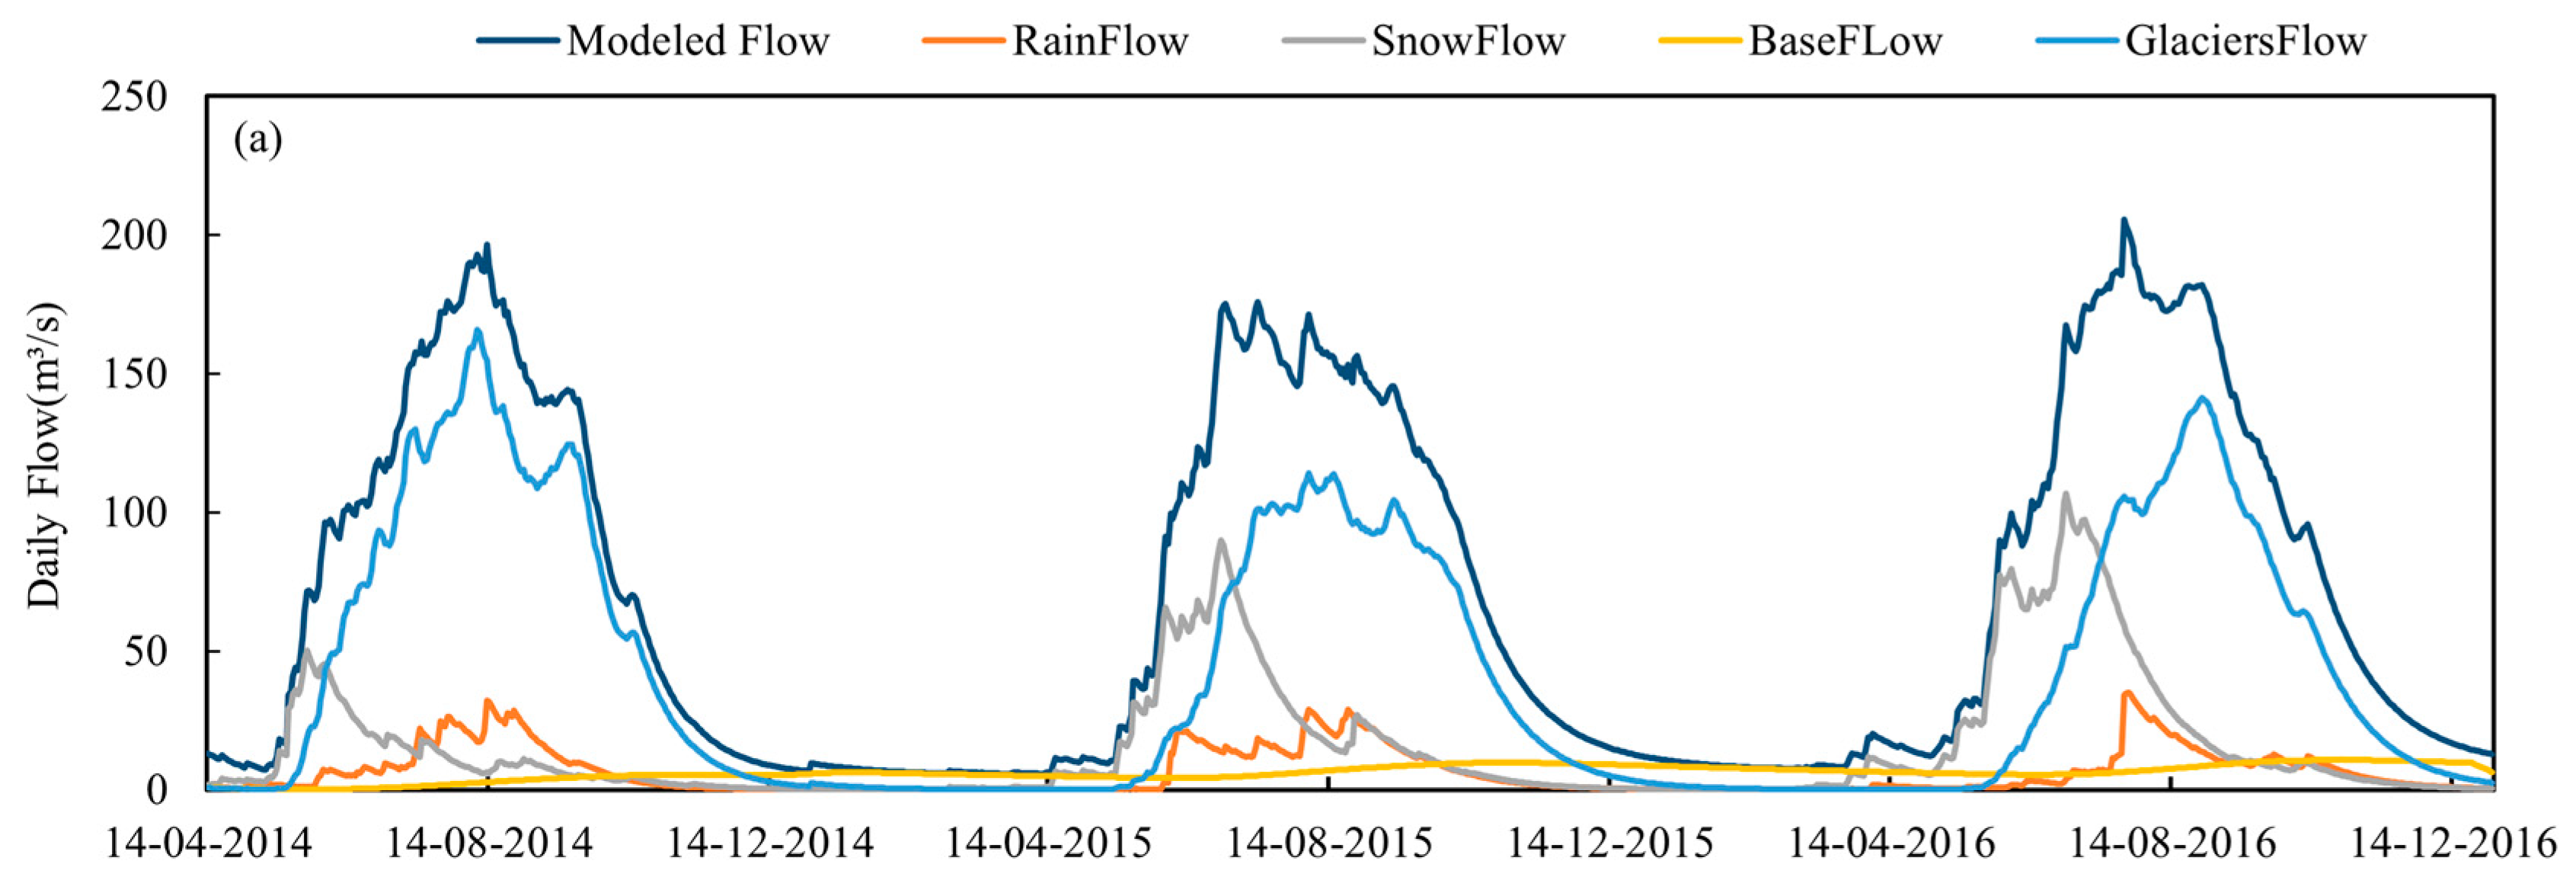
Figure 11 shows the variations of different runoff components in the Ranwu Lake basin from 14 April 2014 to 31 December 2018, calculated by the SPHY model, including rainfall runoff, snowmelt runoff, glacial meltwater runoff, and baseflow.
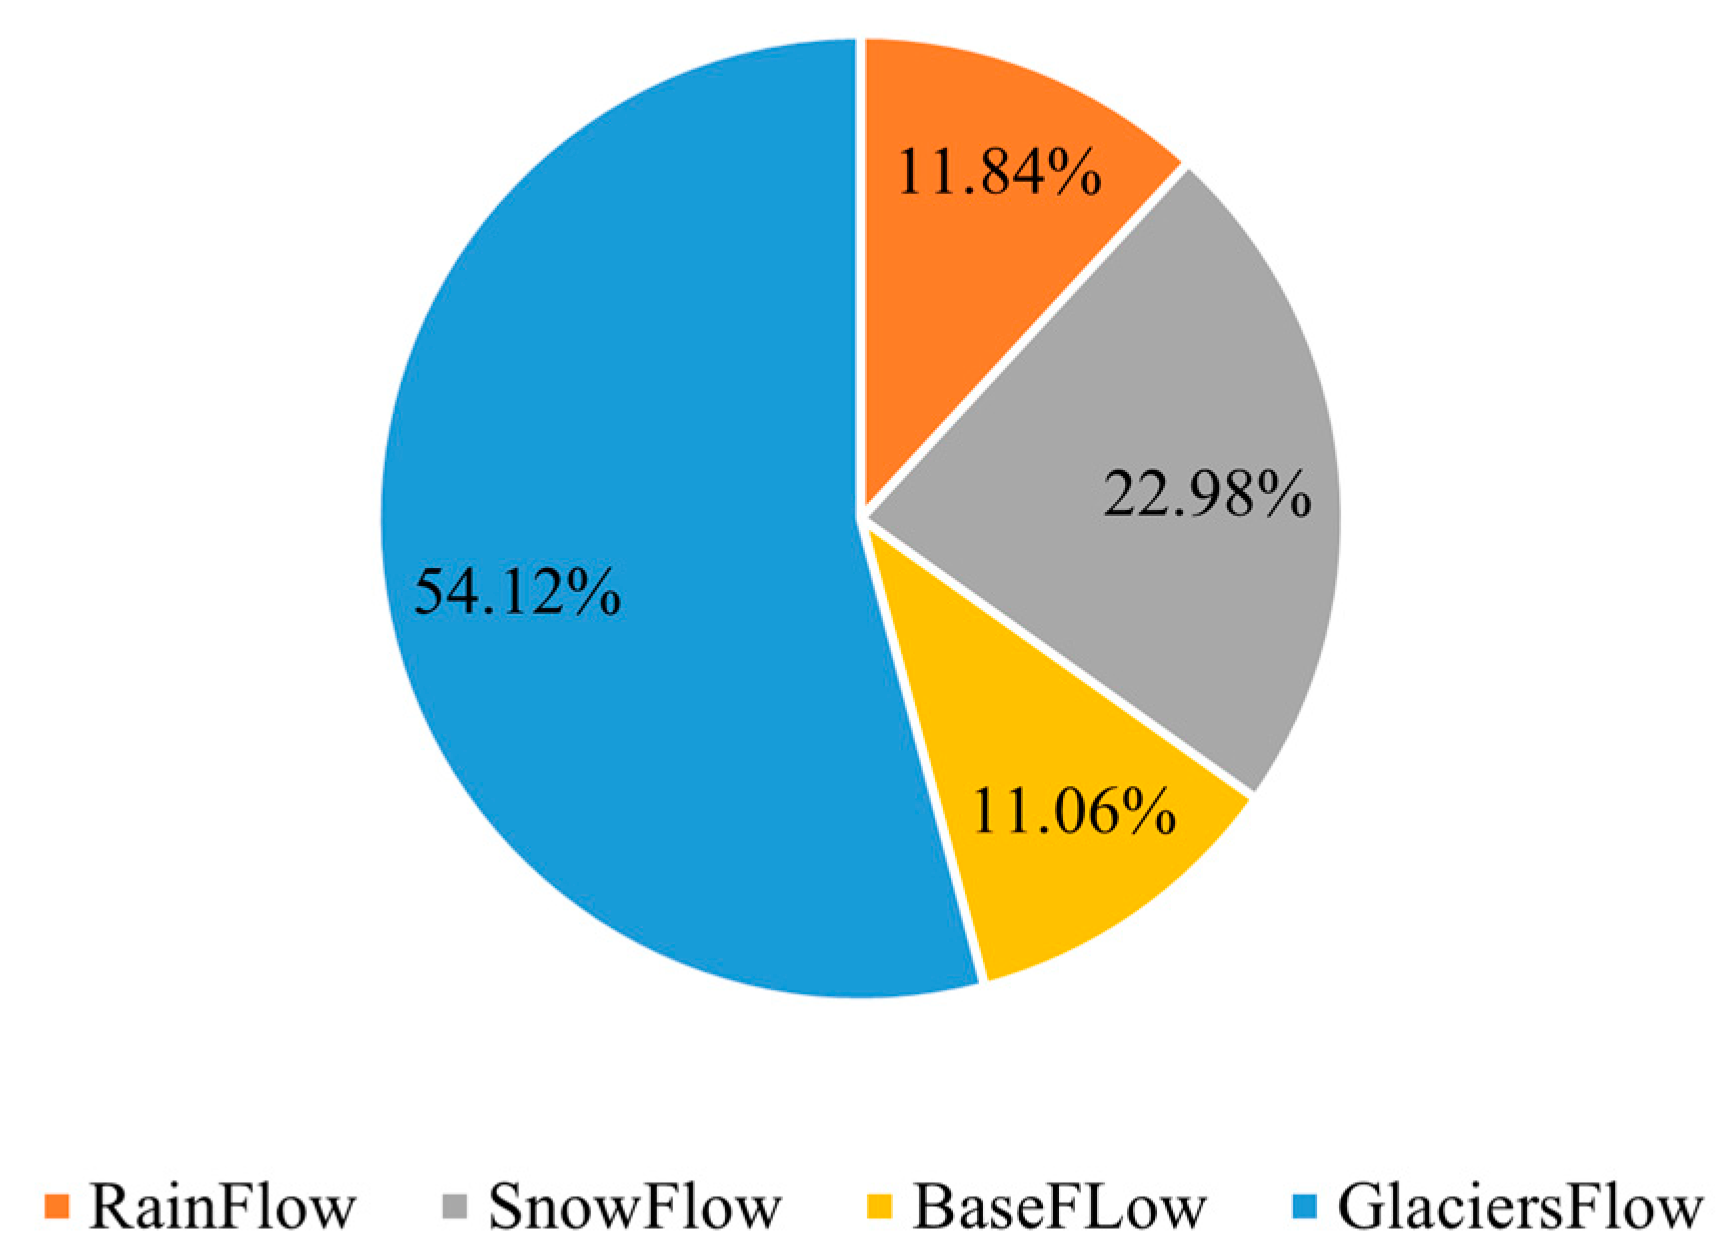
As indicated by previous isotopic studies [
27], the Ranwu Lake is primarily influenced by glacial and snow meltwater. From 2015 to 2018, the simulation results showed that the average proportion of glacial meltwater to total runoff was approximately 54.13%, while snow meltwater contributed around 20.7%. Rainfall and baseflow made up about 11.2% and 9.5%, respectively. Snow meltwater occurred earliest among these four components of runoff, while baseflow remained relatively stable throughout the year. After temperatures rose following late April, melting snow started and reached peak values in late May or early June. After July, less area was covered by snow, resulting in decreased snow-melt flow, and glacial meltwater became dominant instead. Glacial meltwater followed slightly later than snow-melt flow with a rapid increase in mid to late May due to rising temperatures.
Rainfall mostly occurred from July through September during months when liquid precipitation was concentrated.
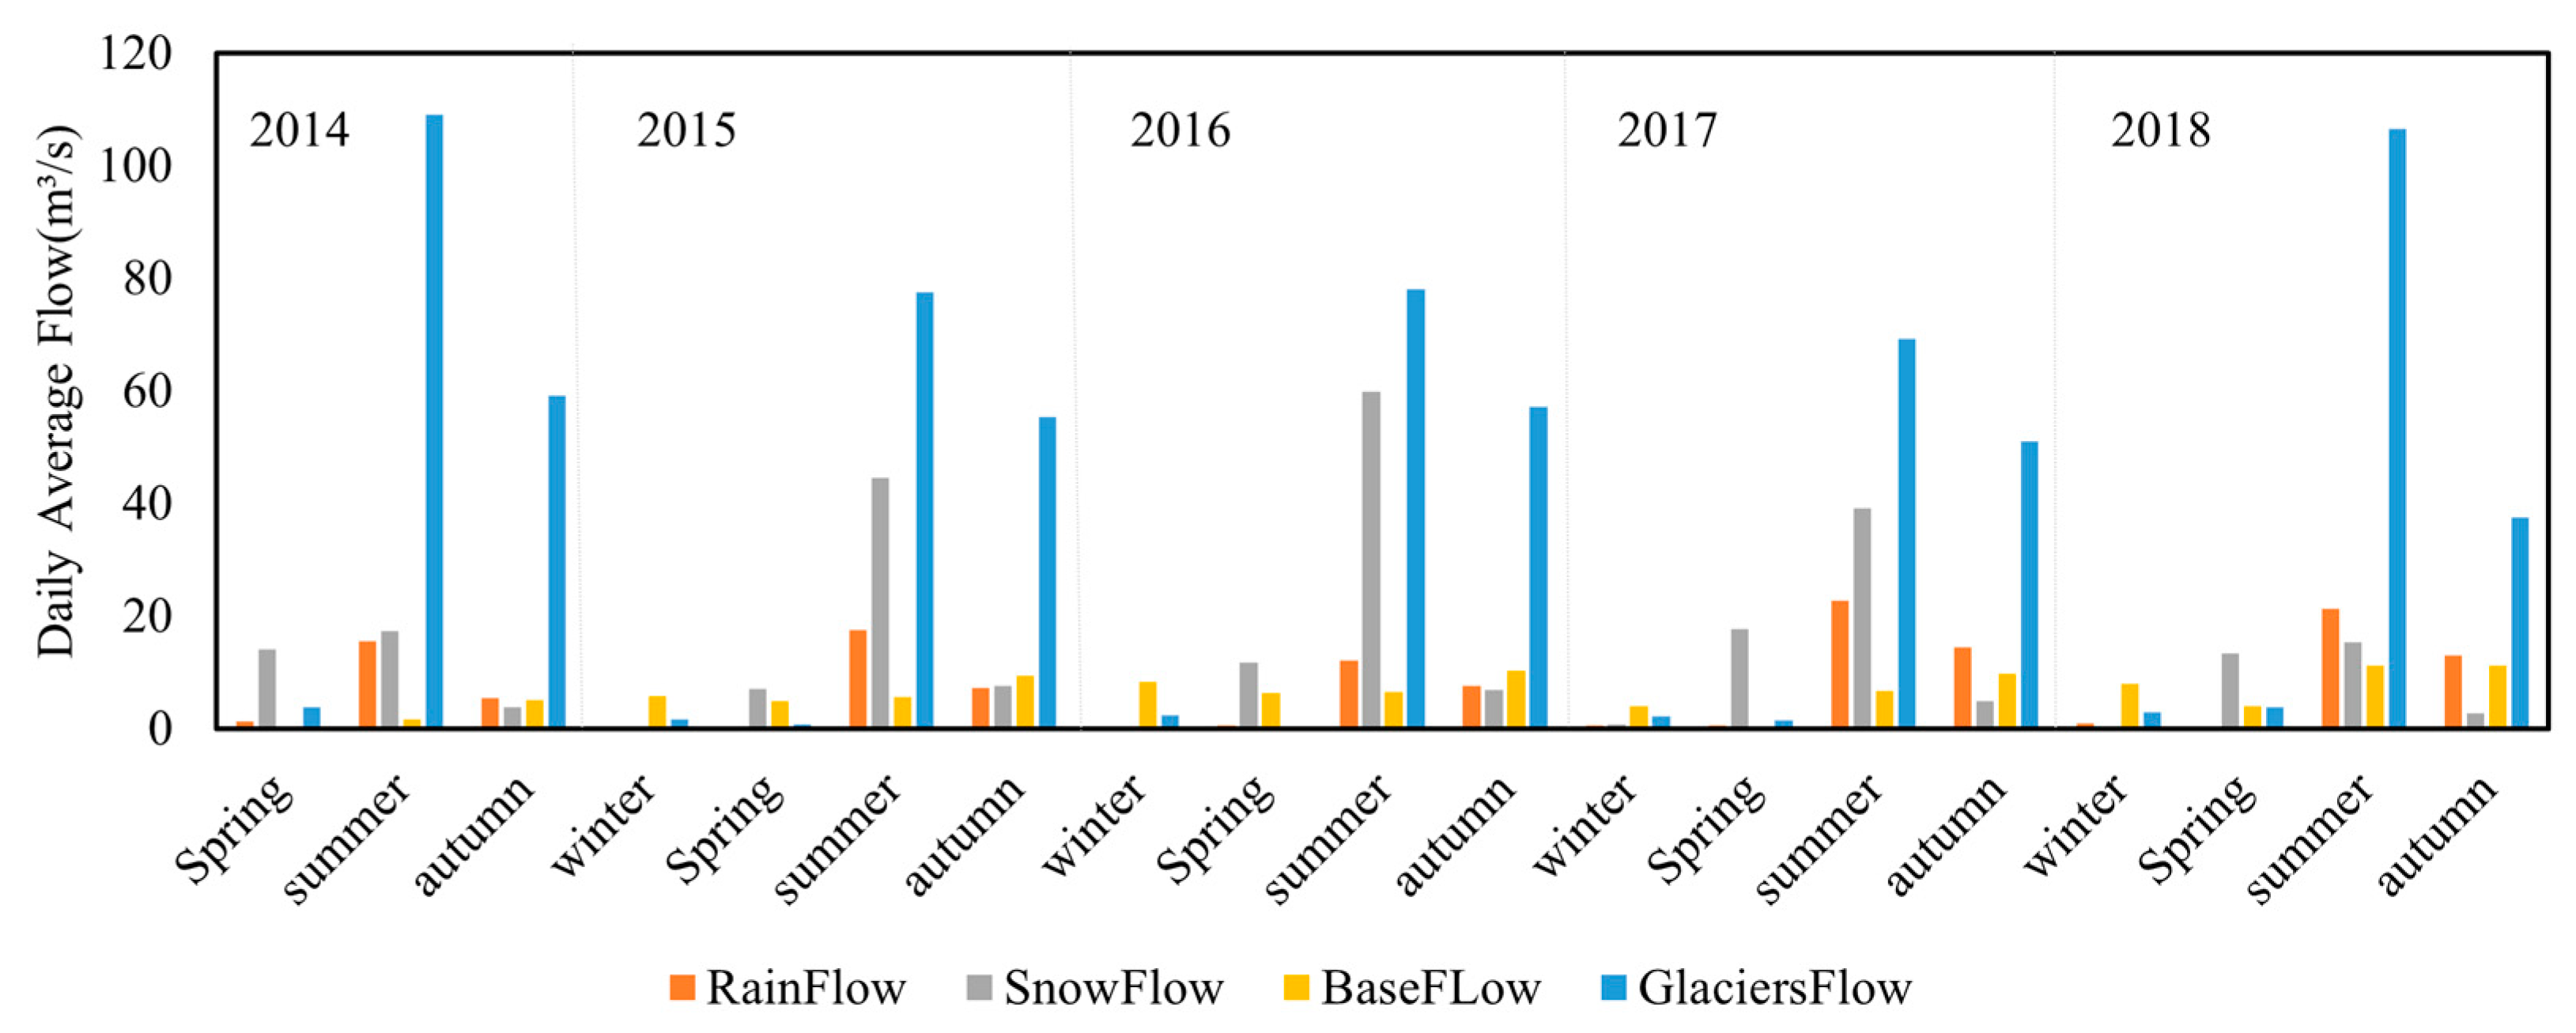
Figure 12 shows daily average discharge rates for different seasons and years across various components. Flow rate was dominated by melted snow during spring season whereas it was dominated by melted glacier during summer and autumn seasons. Baseflow dominated the winter season.
Figure 13 shows annual percentage contributions made by different components towards overall streamflow between years 2015–2018.
4.4. Future Climatic Variables from SDSM
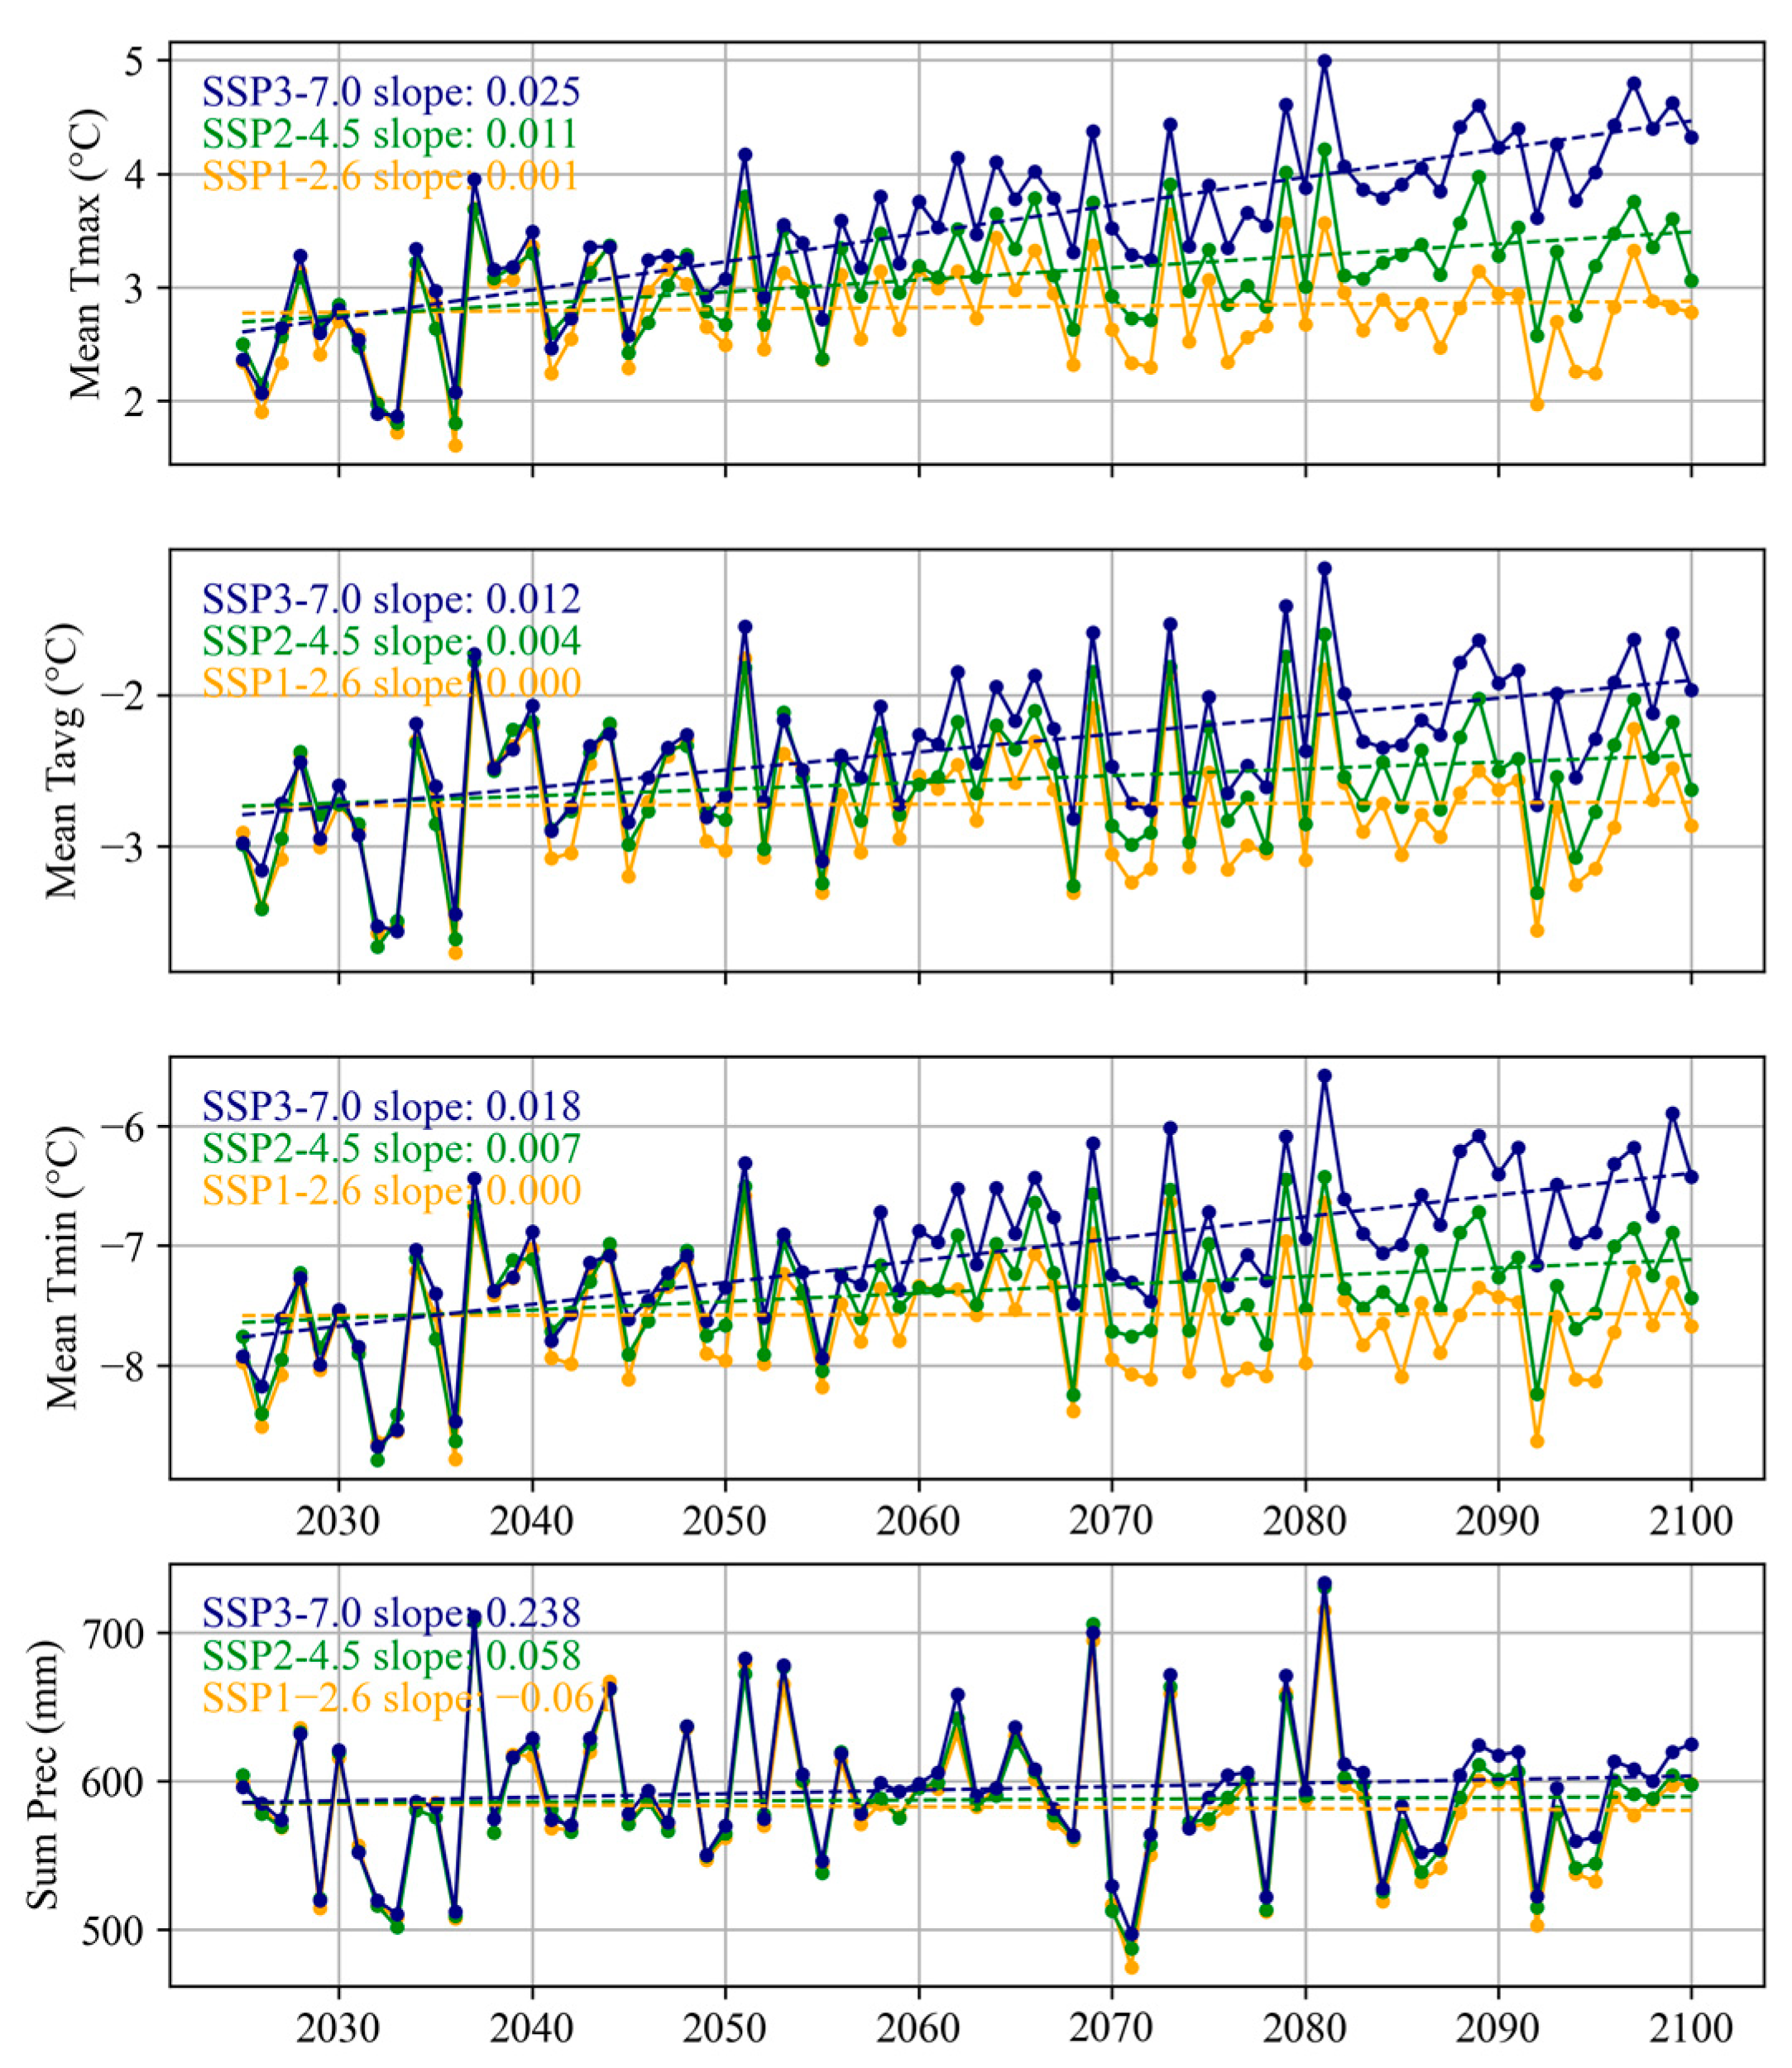
Figure 14 shows the trends of downscaled temperature and precipitation in the future in the Ranwu Lake basin. The data indicate there are upward trends in daily average, maximum, and minimum temperatures in the basin. Among these three scenarios, the annual average daily temperature and minimum temperature of SSP1-2.6 did not show an upward trend, while annual average daily maximum temperature showed a slight upward trend with Sen’s Slope of only 0.001. However, under both the SSP2-4.5 and SSP3-7.0 scenarios all three temperature variables showed an increasing trend with their respective Sen’s Slopes. Among them, daily average temperature has the smallest increase rate, while daily maximum temperature has the largest increase rate.
The precipitation trends differ among these three scenarios: precipitation under SSP1-2.6 shows a decreasing trend with a rate of 0.61 mm/10y, while annual precipitation under the other two scenarios show a slight increasing tendency with increasing tendency of precipitation at rates of 0.58 mm/10y and 2.38 mm/10y for SSP2-4.5 and SSP3-7.0, respectively.
In future climate scenarios, SSP1-2.6 retains the slight downward trend in precipitation, while the precipitation in SSP2-4.5 and SSP3-7.0 shows a slight increase. Although the temperature in the basin shows an increasing trend under all the three future scenarios, the magnitude of warming is smaller than in the past. The warming magnitude predicted by SSP3-7.0 is only one-third of that in the past 40 years. The differences among the scenarios are also not significant with highly homogenized downscaled data. This may be because the original resolution of CanESM5 is 2.5°, much larger than our study area, which only occupies one point of CanESM5 data. Similar situations have also occurred in the Huashan Basin [
62].
4.5. Hydrological Process under Future Climate Scenarios
In order to obtain the hydrological responses to future climate scenarios in the Ranwu Lake basin, we conducted simulations using the calibrated and validated SHPY model and the daily meteorological data from the aforementioned climate model as forcing data.
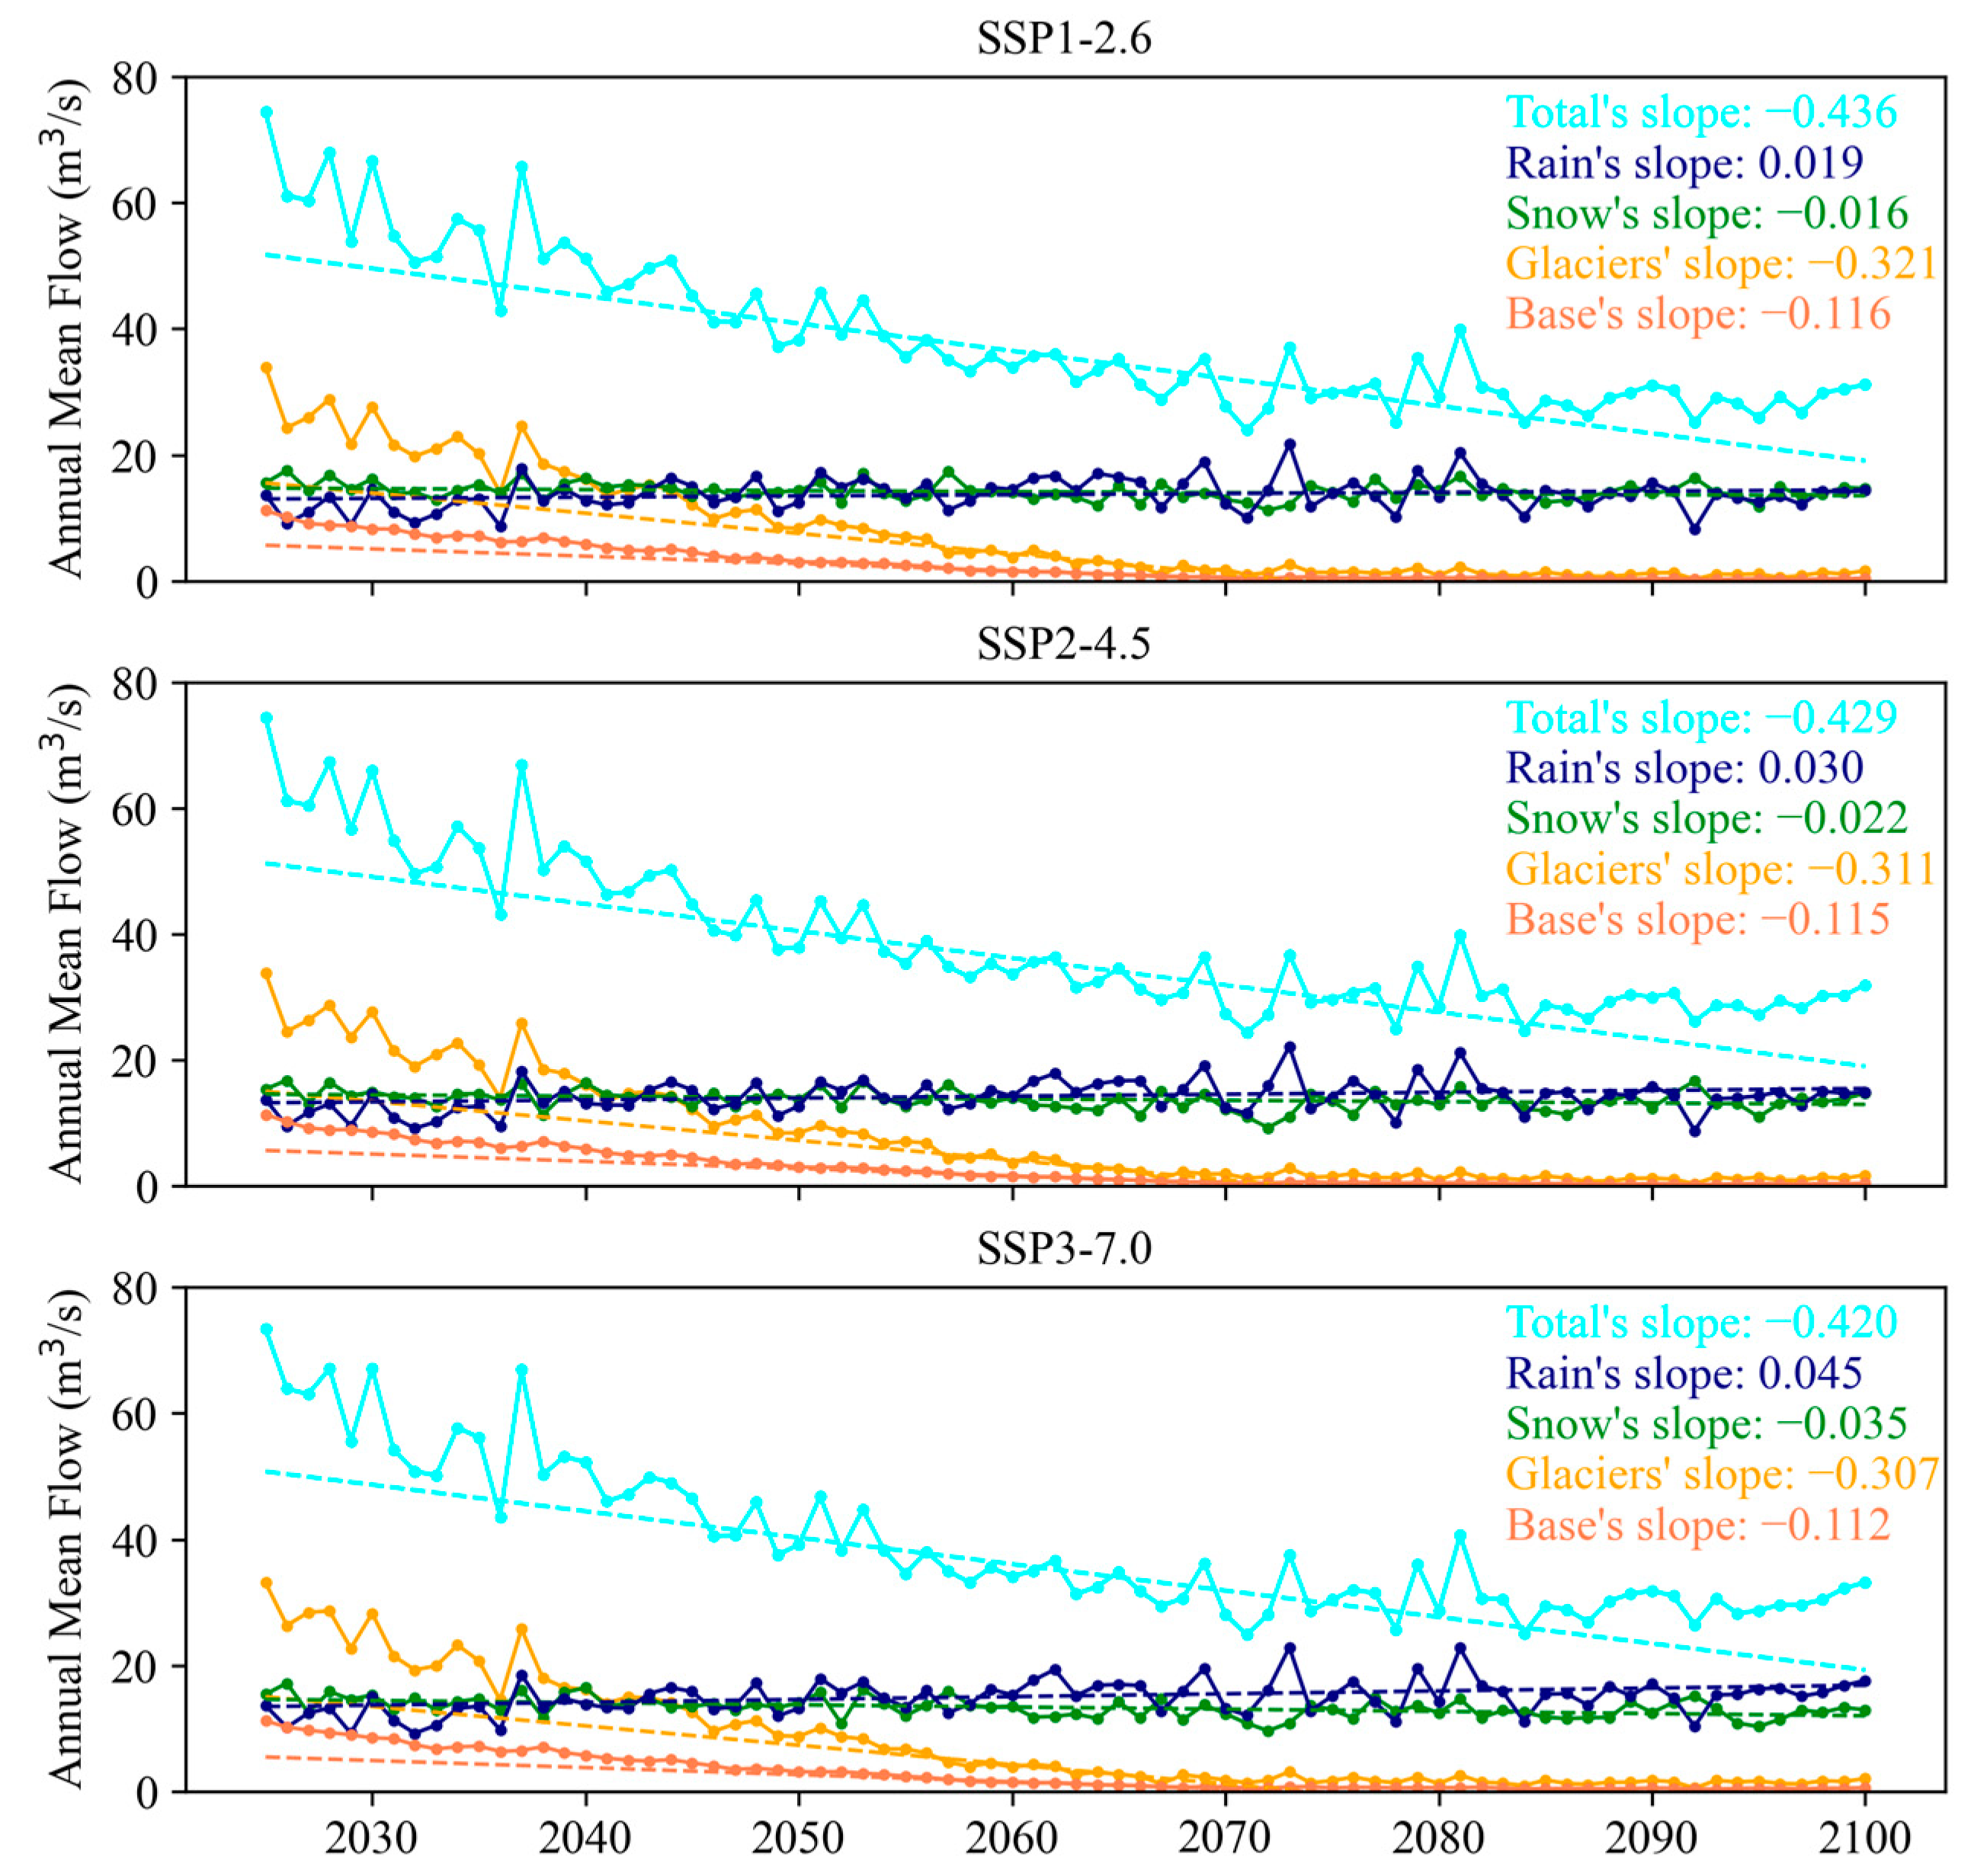
Figure 15 shows the changes in total runoff and runoff components in three different scenarios in the basin. The results indicate that total runoff in the basin will significantly decrease in future climate scenarios, mainly due to a reduction in glacial meltwater runoff. Glacial meltwater runoff will decrease significantly in the next 50 years and will maintain at a lower flow level from the late 2060s to 2100. Baseflow in the basin also shows a significant decreasing trend, consistent with glacial runoff. Snowmelt runoff exhibits a decreasing trend, but not significantly. The only increasing trend is rainfall runoff.
There appears the largest decrease in glacial meltwater and baseflow runoff in the SSP1-2.6 scenario, while both the decreasing trend of snowmelt runoff and the increasing trend of rainfall runoff in the SSP1-2.6, SSP2-4.5, and SSP3-7.0 scenarios are enhanced. By 2100, glacial runoff will only account for 5-6% of total runoff, while snow-melt and rainfall runoff will account for 46–47% in the SSP1-2.6 and SSP2-4.5 scenarios, and baseflow will only account for 1–2% of basin runoff. Hydrological processes in the basin will shift from being dominated by glacial meltwater processes to being dominated by rain and snow processes with the intensification of climate warming. By 2100, the total runoff will be less than half of the current level, which will have a serious impact on the lives of residents in the basin and downstream.
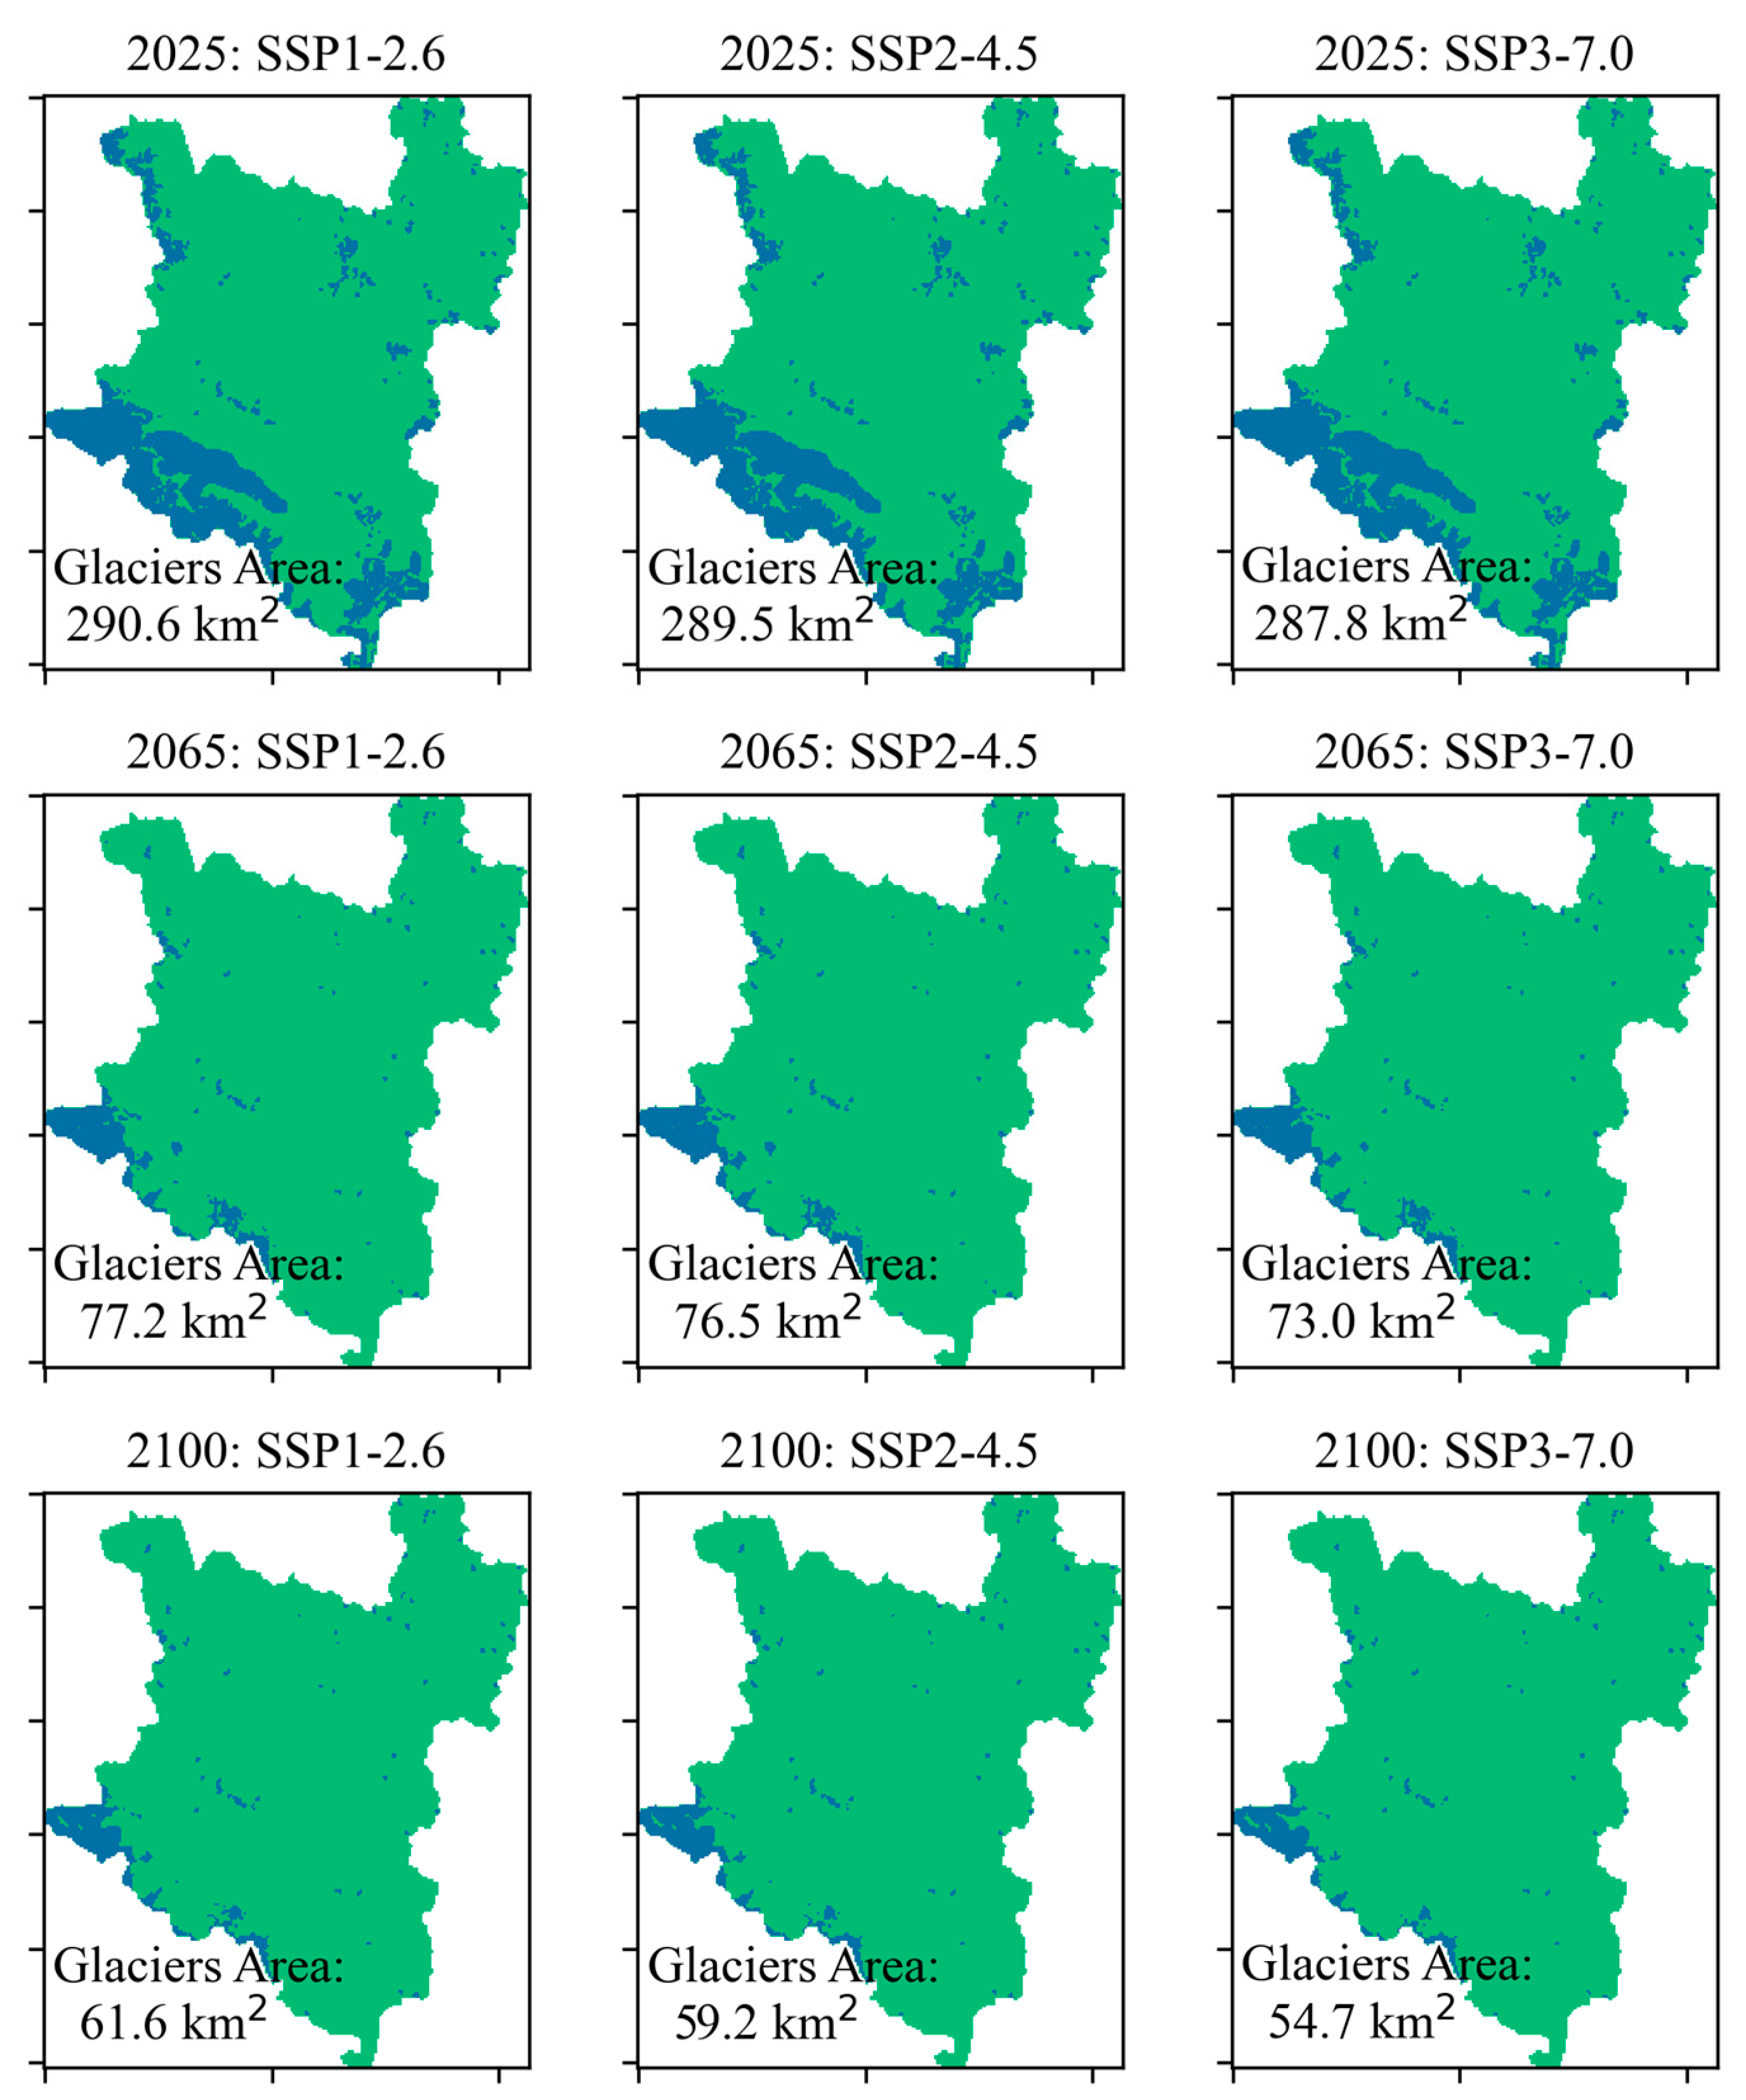
Taking September 30th as the end day of the melting season in each year, the SPHY model also generates glacier area maps for October 1st of every year. According to future climate scenarios, glaciers within the basin will experience rapid melting trends by the mid-2060s.
Figure 16 shows that regardless of scenario, glacier area in 2065 will account for only 25–26% of that in 2025; three-quarters of glaciers are expected to melt away over the next four decades or so. Afterward, glacier melt rates will slow down, and the glacier area within the basin by year 2100 will be about 21.2%, 20.5% and 18.9% of that in 2025 under the SSP1-2.6, SSP2-4.5 and SSP3-7.0 scenarios, respectively. The rapid retreat of glaciers in the basin will also affect the stability of the ecological environment in the basin, and vegetation may degrade with the decrease in runoff and groundwater [
63], while the exposed surface after glacier melting will accelerate desertification in the basin.
5. Conclusions
This article analyzes the temperature and precipitation changes in the Ranwu Lake basin from 1979 to 2018 and establishes an SPHY model applicable to the basin’s hydrological characteristics using hydrological and meteorological observation data from 2014 to 2018. Future temperature and precipitation under three different scenarios (SSP1-2.6, SSP2-4.5, and SSP3-7.0) in the CanESM5 dataset in CMIP6 were obtained using the SDSM downscaling method, and the hydrological processes and glacier changes in the basin from 2025 to 2100 were predicted using the SPHY model.
(1) Over the past 40 years, the temperature in the Ranwu Lake basin has shown a significant increasing trend with higher warming rates in high-altitude than in mid- and low-altitude areas and in winter than in other seasons. Precipitation has also shown a significant increasing trend with highest increasing rate in spring and second in summer. After the peak of precipitation in 1998, there has been a slight downward trend in precipitation in the basin over the past 20 years.
(2) The SPHY model, which showed good applicability in the Ranwu Lake basin, demonstrated that glacier meltwater accounted for more than half of the total runoff in the basin, followed by snow meltwater accounting for about 23%. Rainfall runoff and base flow accounted for 11.84% and 11.06% of the observed period, respectively. The dominant hydrological process in the basin was snow meltwater in spring, while glacial meltwater was dominant in summer and autumn, and base flow in winter.
(3) The future predictions under the three scenarios in CMIP6 showed that there was no significant upward trend in temperature in the basin from 2025 to 2100 under the SSP1-2.6 scenario. However, under the SSP2-4.5 and SSP3-7.0 scenarios, the temperature will show an upward trend, but the predicted increase is smaller than that in the past 40 years. The future predicted precipitation showed a slight decreasing trend under the SSP1-2.6 scenario, while it will slightly increase in the other two scenarios.
(4) The future runoff of the three predicted scenarios will significantly decrease, and the glaciers will experience severe melting and retreat. By 2100, the runoff may be less than 50% of that in 2025, and the proportion of glacial meltwater in the total basin runoff will only be 5–6%. The hydrological process in the basin will change from being dominated by glacier meltwater to being dominated by snowmelt and precipitation runoff.
Author Contributions
All authors listed have contributed substantially to the manuscript to be included as authors. Conceptualization, L.Z.; methodology and data analyses, Y.C.; field work investigation, J.J., L.L. and Y.W.; resources, L.Z.; writing—original draft preparation, Y.C.; writing—review and editing, L.Z. All authors have read and agreed to the published version of the manuscript.
Funding
This work is co-supported by the National Natural Science Foundation of China (NSFC) (41831177), the Second Tibetan Plateau Scientific Expedition and Research (STEP) (2019QZKK0202), and Chinese Academy of Sciences Strategic Priority Research Program (XDA20020100).
Data Availability Statement
The data are not publicly available due to the data in this paper were also used in the writing of other paper.
Acknowledgments
The authors thank to the South-East Tibetan Plateau Station for integrated observation and research of alpine environment of the Chinese Academy of Sciences for their support in hydrological and meteorological observations. We also extend our gratitude to Yang Wei and Wang Lei from the Institute of Tibetan Plateau Research, Chinese Academy of Sciences for providing ASW4600 and ASW 4398 meteorological station data used in validating CMFD downscaling results.
Conflicts of Interest
The authors declare no conflict of interest.
References
- Immerzeel, W.W.; Lutz, A.F.; Andrade, M.; Bahl, A.; Biemans, H.; Bolch, T.; Hyde, S.; Brumby, S.; Davies, B.J.; Elmore, A.C.; et al. Importance and vulnerability of the world’s water towers. Nature 2020, 577, 364–369. [Google Scholar] [CrossRef] [PubMed]
- Immerzeel, W.W.; van Beek, L.P.H.; Bierkens, M.F.P. Climate Change Will Affect the Asian Water Towers. Science 2010, 328, 1382–1385. [Google Scholar] [CrossRef] [PubMed]
- Chen, D.; Xu, B.; Yao, T.; Guo, Z.; Cui, P.; Chen, F.; Zhang, R.; Zhang, X.; Zhang, Y.; Fan, J.; et al. Assessment of past, present and future environmental changes on the Tibetan Plateau. Chin. Sci. Bull. 2015, 60, 3025–3035. [Google Scholar]
- Yao, T.; Bolch, T.; Chen, D.; Gao, J.; Immerzeel, W.; Piao, S.; Su, F.; Thompson, L.; Wada, Y.; Wang, L.; et al. The imbalance of the Asian water tower. Nat. Rev. Earth Environ. 2022, 3, 618–632. [Google Scholar] [CrossRef]
- Zhang, R.; Xu, Z.; Zuo, D.; Ban, C. Hydro-meteorological trends in the Yarlung Zangbo River Basin and possible associations with large-scale circulation. Water 2020, 12, 144. [Google Scholar] [CrossRef] [Green Version]
- Tang, Y.; Huo, J.; Zhu, D.; Yuan, Z. Simulation of the Water Storage Capacity of Siling Co Lake on the Tibetan Plateau and Its Hydrological Response to Climate Change. Water 2022, 14, 3175. [Google Scholar] [CrossRef]
- Chen, H.; Zhu, Q.; Peng, C.; Wu, N.; Wang, Y.; Fang, X.; Gao, Y.; Zhu, D.; Yang, G.; Tian, J.; et al. The impacts of climate change and human activities on biogeochemical cycles on the Qinghai-Tibetan Plateau. Glob. Chang. Biol. 2013, 19, 2940–2955. [Google Scholar] [CrossRef]
- Liu, X.; Chen, B. Climatic warming in the Tibetan Plateau during recent decades. Int. J. Climatol. 2000, 20, 1729–1742. [Google Scholar] [CrossRef]
- Yang, W.; Yao, T.; Guo, X.; Zhu, M.; Li, S.; Kattel, D.B. Mass balance of a maritime glacier on the southeast Tibetan Plateau and its climatic sensitivity. J. Geophys. Res.-Atmos. 2013, 118, 9579–9594. [Google Scholar] [CrossRef]
- Lan, C.; Zhang, Y.; Gao, Y.; Hao, Z.; Cairang, L. The impacts of climate change and land cover/use transition on the hydrology in the upper Yellow River Basin, China. J. Hydrol. 2013, 502, 37–52. [Google Scholar]
- Qiao, B.; Zhu, L.; Yang, R. Temporal-spatial differences in lake water storage changes and their links to climate change throughout the Tibetan Plateau. Remote Sens. Environ. 2019, 222, 232–243. [Google Scholar] [CrossRef]
- Yang, Y.; Wu, Q.; Jin, H.; Wang, Q.; Huang, Y.; Luo, D.; Gao, S.; Jin, X. Delineating the hydrological processes and hydraulic connectivities under permafrost degradation on Northeastern Qinghai-Tibet Plateau, China. J. Hydrol. 2019, 569, 359–372. [Google Scholar] [CrossRef]
- Zhao, Q.; Ding, Y.; Wang, J.; Gao, H.; Zhang, S.; Zhao, C.; Xu, J.; Han, H.; Shangguan, D. Projecting climate change impacts on hydrological processes on the Tibetan Plateau with model calibration against the glacier inventory data and observed streamflow. J. Hydrol. 2019, 573, 60–81. [Google Scholar] [CrossRef]
- Wu, J.; Li, H.; Zhou, J.; Tai, S.; Wang, X. Variation of Runoff and Runoff Components of the Upper Shule River in the Northeastern Qinghai-Tibet Plateau under Climate Change. Water 2021, 13, 3357. [Google Scholar] [CrossRef]
- Zhao, F.; Long, D.; Li, X.; Huang, Q.; Han, P. Rapid glacier mass loss in the Southeastern Tibetan Plateau since the year 2000 from satellite observations. Remote Sens. Environ. 2022, 270, 112853. [Google Scholar] [CrossRef]
- Wang, L.; Wang, J.; Li, M.; Wang, L.; Li, X.; Zhu, L. Response of terrestrial water storage and its change to climate change in the endorheic Tibetan Plateau. J. Hydrol. 2022, 612, 128231. [Google Scholar] [CrossRef]
- Wang, L.; Zhang, F.; Nepal, S.; Xiang, Y.; Tang, H.; Shi, X.; Zeng, C.; Ahmad, I.; Yu, Z. Response of runoff processes to temperature rise in basins with different glacier ratios in the monsoon-influenced southern Tibetan Plateau. J. Hydrol. Reg. Stud. 2023, 45, 101299. [Google Scholar] [CrossRef]
- Yao, T.; Thompson, L.; Yang, W.; Yu, W.; Gao, Y.; Guo, X.; Yang, X.; Duan, K.; Zhao, H.; Xu, B.; et al. Different glacier status with atmospheric circulations in Tibetan Plateau and surroundings. Nat. Clim. Chang. 2012, 2, 663–667. [Google Scholar] [CrossRef]
- Yang, W.; Guo, X.; Yao, T.; Zhu, M.; Wang, Y. Recent accelerating mass loss of southeast Tibetan glaciers and the relationship with changes in macroscale atmospheric circulations. Clim. Dyn. 2016, 47, 805–815. [Google Scholar] [CrossRef]
- Wu, K.; Liu, S.; Jiang, Z.; Xu, J.; Wei, J.; Guo, W. Recent glacier mass balance and area changes in the Kangri Karpo Mountains from DEMs and glacier inventories. Cryosphere 2018, 12, 103–121. [Google Scholar] [CrossRef] [Green Version]
- Wang, Y.; Wang, L.; Zhou, J.; Yao, T.; Yang, W.; Zhong, X.; Liu, R.; Hu, Z.; Luo, L.; Ye, Q.; et al. Vanishing glaciers at southeast Tibetan Plateau have not offset the declining runoff at Yarlung Zangbo. Geophys. Res. Lett. 2021, 48, e2021GL094651. [Google Scholar] [CrossRef]
- Kong, Y.; Pang, Z. Evaluating the sensitivity of glacier rivers to climate change based on hydrograph separation of discharge. J. Hydrol. 2012, 434, 121–129. [Google Scholar] [CrossRef]
- Zhang, C.; Tang, Q.; Chen, D. Recent changes in the moisture source of precipitation over the Tibetan Plateau. J. Clim. 2017, 30, 1807–1819. [Google Scholar] [CrossRef]
- Chen, X.; You, Q. Effect of Indian Ocean SST on Tibetan Plateau precipitation in the early rainy season. J. Clim. 2017, 30, 8973–8985. [Google Scholar] [CrossRef]
- Wang, Y.; Zhang, Y.; Chiew, F.H.S.; McVicar, T.; Zhang, L.; Li, H.; Qin, G. Contrasting runoff trends between dry and wet parts of eastern Tibetan Plateau. Sci. Rep. 2017, 7, 15458. [Google Scholar] [CrossRef] [Green Version]
- Gao, C.; Liu, L.; Ma, D.; He, K.; Xu, Y. Assessing responses of hydrological processes to climate change over the southeastern Tibetan Plateau based on resampling of future climate scenarios. Sci. Total Environ. 2019, 664, 737–752. [Google Scholar] [CrossRef]
- Ju, J.; Zhu, L.; Wang, J.; Cui, Y.; Huang, L.; Yang, R.; Ma, Q.; Luo, L.; Wang, Y. Estimating the contribution of glacial meltwater to Ranwu Lake, a proglacial lake in SE Tibet, using observation data and stable isotopic analyses. Environ. Earth Sci. 2017, 76, 229. [Google Scholar] [CrossRef]
- Cui, Y.; Zhu, L.; Ju, J.; Luo, L.; Wang, Y. Seasonal variations of water balance and supply process based upon discharge monitoring in Ranwu Lake of Southeast Tibet. Acta Geogr. Sin. 2017, 72, 1221–1234. [Google Scholar]
- Zhang, W.; Zhou, T.; Zhang, L. Wetting and greening Tibetan Plateau in early summer in recent decades. J. Geophys. Res. Atmos. 2017, 122, 5808–5822. [Google Scholar] [CrossRef]
- Wu, Y.; Fang, H.; He, G.; Huang, L.; Wang, J. Climate-driven changes in hydrological and hydrodynamic responses in the Yarlung Tsangpo River. J. Hydrol. 2021, 598, 126267. [Google Scholar] [CrossRef]
- Zhang, T.; Li, D.; Lu, X. Response of runoff components to climate change in the source-region of the Yellow River on the Tibetan plateau. Hydrol. Process. 2022, 36, e14633. [Google Scholar] [CrossRef]
- Ju, J.; Zhu, L.; Huang, L.; Yang, R.; Ma, Q.; Hu, X.; Wang, Y.; Zhen, X. Ranwu Lake, a proglacial lake with the potential to reflect glacial activity in SE Tibet. Chin. Sci. Bull.-Chin. 2015, 60, 16–26. [Google Scholar]
- Li, J.; Zheng, B.; Yang, X.; Xie, Y.; Zhang, L.; Ma, Z.; Xu, S. Glaciers in Tibet Plateau; Science Press: Beijing, China, 1986. [Google Scholar]
- Gao, D. Expeditionary studies on the moisture passage of the Yarlung Zangbo River. Chin. J. Nat. 2008, 30, 301–303. [Google Scholar]
- Wu, K.; Liu, S.; Zhu, Y.; Liu, Q.; Jiang, Z. Dynamics of glacier surface velocity and ice thickness for maritime glaciers in the southeastern Tibetan Plateau. J. Hydrol. 2020, 590, 125527. [Google Scholar] [CrossRef]
- He, J.; Yang, K.; Tang, W.; Lu, H.; Qin, J.; Chen, Y.; Li, X. The first high-resolution meteorological forcing dataset for land process studies over China. Sci. Data 2020, 7, 25. [Google Scholar] [CrossRef] [Green Version]
- Yang, K.; He, J.; Tang, W.; Qin, J.; Cheng, C. On downward shortwave and longwave radiations over high altitude regions: Observation and modeling in the Tibetan Plateau. Agric. For. Meteorol. 2010, 150, 38–46. [Google Scholar] [CrossRef]
- Chen, Y.; Yang, K.; He, J.; Qin, J.; Shi, J.; Du, J.; He, Q. Improving land surface temperature modeling for dry land of China. J. Geophys. Res.-Atmosp. 2011, 116, D20104. [Google Scholar] [CrossRef]
- Zhou, J.; Wang, L.; Zhang, Y.; Guo, Y.; Li, X.; Liu, W. Exploring the water storage changes in the largest lake (Selin Co) over the Tibetan Plateau during 2003-2012 from a basin-wide hydrological modeling. Water Resour. Res. 2015, 51, 8060–8086. [Google Scholar] [CrossRef] [Green Version]
- Yang, R.; Zhu, L.; Wang, J.; Ju, J.; Ma, Q.; Turner, F.; Guo, Y. Spatiotemporal variations in volume of closed lakes on the Tibetan Plateau and their climatic responses from 1976 to 2013. Clim. Chang. 2017, 140, 621–633. [Google Scholar] [CrossRef]
- Zhu, Y.Y.; Yang, S. Evaluation of CMIP6 for historical temperature and precipitation over the Tibetan Plateau and its comparison with CMIP5. Adv. Clim. Chang. Res. 2020, 11, 239–251. [Google Scholar] [CrossRef]
- Cui, T.; Li, C.; Tian, F. Evaluation of temperature and precipitation simulations in CMIP6 models over the Tibetan Plateau. Earth Space Sci. 2021, 8, e2020EA001620. [Google Scholar] [CrossRef]
- Chen, R.; Duan, K.; Shang, W.; Shi, P.; Meng, Y.; Zhang, Z. Increase in seasonal precipitation over the Tibetan Plateau in the 21st century projected using CMIP6 models. Atmos. Res. 2022, 277, 106306. [Google Scholar] [CrossRef]
- Cui, Y. Study on Water Balance of Ranwu Lake in the Southeast Tibet Based on Hydrological Process Simulation. Ph.D. Thesis, University of Chinese Academy of Sciences, Beijing, China, 2021. [Google Scholar]
- Ding, L.; Zhou, J.; Zhang, X.; Liu, S.; Cao, R. A long-term 0.01° surface air temperature dataset of Tibetan Plateau. Data Brief 2018, 20, 748–752. [Google Scholar] [CrossRef] [PubMed]
- Wang, L.; Zhang, F.; Zhang, H.; Scott, C.; Zeng, C.; Shi, X. Intensive precipitation observation greatly improves hydrological modelling of the poorly gauged high mountain Mabengnong catchment in the Tibetan Plateau. J. Hydrol. 2018, 556, 500–509. [Google Scholar] [CrossRef]
- Hamed, K.H.; Rao, A.R. A modified Mann-Kendall trend test for autocorrelated data. J. Hydrol. 1998, 204, 182–196. [Google Scholar] [CrossRef]
- Da Silva, R.M.; Santos, C.A.; Moreira, M.; Corte-Real, J.; Silva, V.L.; Medeiros, I. Rainfall and river flow trends using Mann–Kendall and Sen’s slope estimator statistical tests in the Cobres River basin. Nat. Hazards 2015, 77, 1205–1221. [Google Scholar] [CrossRef]
- Gocic, M.; Trajkovic, S. Analysis of changes in meteorological variables using Mann Kendall and Sen’s slope estimator statistical tests in Serbia. Glob. Planet. Chang. 2013, 100, 172–182. [Google Scholar] [CrossRef]
- Mustapha, A. Detecting Surface Water Quality Trends using Mann-Kendall Tests and Sen’s Slope Estimates. Int. J. Agric. Innov. Res. 2013, 1, 108–114. [Google Scholar]
- Sen, P.K. Estimates of the regression coefficient based on Kendall’s tau. J. Am. Stat. Assoc. 1968, 63, 1379–1389. [Google Scholar] [CrossRef]
- Khattak, M.S.; Babel, M.S.; Sharif, M. Hydro-meteorological trends in the upper Indus River basin in Pakistan. Clim. Res. 2011, 46, 103–119. [Google Scholar] [CrossRef]
- Almazroui, M.; Şen, Z. Trend analyses methodologies in hydro-meteorological records. Earth Syst. Environ. 2020, 4, 713–738. [Google Scholar] [CrossRef]
- Zhang, F.; Shi, X.; Zeng, C.; Wang, L.; Xiao, X.; Wang, G.; Chen, Y.; Zhang, H.; Lu, X.; Immerzeel, W. Recent stepwise sediment flux increase with climate change in the Tuotuo River in the central Tibetan Plateau. Sci. Bull. 2020, 65, 410–418. [Google Scholar] [CrossRef] [PubMed] [Green Version]
- Xiang, X.; Ao, T.; Xiao, Q. Variation of Runoff and Runoff Components of the Lhasa River Basin in the Qinghai-Tibet Plateau under Climate Change. Atmosphere 2022, 13, 1848. [Google Scholar] [CrossRef]
- Nash, J.E.; Sutcliffe J, V. River flow forecasting through conceptual models part I—A discussion of principles. J. Hydrol. 1970, 10, 282–290. [Google Scholar] [CrossRef]
- White, J.T. A model-independent iterative ensemble smoother for efficient history-matching and uncertainty quantification in very high dimensions. Environ. Model. Softw. 2018, 109, 191–201. [Google Scholar] [CrossRef]
- Wilby, R.L.; Dawson, C.W.; Barrow, E.M. SDSM—A decision support tool for the assessment of regional climate change impacts. Environ. Model. Softw. 2002, 17, 145–157. [Google Scholar] [CrossRef]
- Wilby, R.L.; Dawson, C.W. The statistical downscaling model: Insights from one decade of application. Int. J. Climatol. 2013, 33, 1707–1719. [Google Scholar] [CrossRef]
- Wang, X.; Yang, T.; Shao, Q.; Acharya, K.; Wang, W.; Yu, Z. Statistical downscaling of extremes of precipitation and temperature and construction of their future scenarios in an elevated and cold zone. Stoch. Environ. Res. Risk Assess. 2012, 26, 405–418. [Google Scholar] [CrossRef]
- Wang, W.; Xing, W.; Shao, Q.; Yu, Z.; Peng, S.; Yang, T.; Yong, B.; Taylor, J.; Singh, V. Changes in reference evapotranspiration across the Tibetan Plateau: Observations and future projections based on statistical downscaling. J. Geophys. Res. Atmos. 2013, 118, 4049–4068. [Google Scholar] [CrossRef]
- Zhang, L.; Dai, Y.; Lin, J.; Han, J.; Sun, X.; Li, X.; Liu, P.; Liao, A. Evaluating spatiotemporal variations of groundwater–surface water interaction using an integrated hydrological model in Huashan Basin, China. Sustainability 2022, 14, 14325. [Google Scholar] [CrossRef]
- Sun, X.; Zhang, R.; Huang, W.; Sun, A.; Lin, L.; Xu, H.; Jiang, D. The response between glacier evolution and eco-geological environment on the Qinghai-Tibet Plateau. China Geol. 2019, 2, 1–7. [Google Scholar] [CrossRef]
Figure 1.
Overview map showing location of Ranwu Lake and its water system.
Figure 1.
Overview map showing location of Ranwu Lake and its water system.
Figure 2.
Regression equation between the downscaled temperature resampling and in situ measured values of Ari village weather station.
Figure 2.
Regression equation between the downscaled temperature resampling and in situ measured values of Ari village weather station.
Figure 3.
Downscaled CMFD precipitation and observed precipitation in the Ari village.
Figure 3.
Downscaled CMFD precipitation and observed precipitation in the Ari village.
Figure 4.
The relationships between CMFD- and SDSM-simulated daily maximum, average, and minimum temperatures and monthly precipitation in the Ranwu Lake basin.
Figure 4.
The relationships between CMFD- and SDSM-simulated daily maximum, average, and minimum temperatures and monthly precipitation in the Ranwu Lake basin.
Figure 5.
Trends of annual mean temperature, annual maximum temperature, and annual minimum temperature in different elevation zones. (a–c) Temperature trends in zone 1, zone 2, and zone 3. (d) Annual mean temperature variation trends at different elevations and stages.
Figure 5.
Trends of annual mean temperature, annual maximum temperature, and annual minimum temperature in different elevation zones. (a–c) Temperature trends in zone 1, zone 2, and zone 3. (d) Annual mean temperature variation trends at different elevations and stages.
Figure 6.
Mutation points analysis using Mann–Kendall test of annual mean temperature changes with different elevation gradients. (a) Mutation points analysis from 1979 to 2018; (b) mutation points analysis from 1991 to 2018.
Figure 6.
Mutation points analysis using Mann–Kendall test of annual mean temperature changes with different elevation gradients. (a) Mutation points analysis from 1979 to 2018; (b) mutation points analysis from 1991 to 2018.
Figure 7.
Trends of temperature change at different elevations in different seasons. (a) Spring. (b) Summer. (c) Autumn. (d) Winter.
Figure 7.
Trends of temperature change at different elevations in different seasons. (a) Spring. (b) Summer. (c) Autumn. (d) Winter.
Figure 8.
Analysis on trend and mutation of annual precipitation change from 1979 to 2018. (a)Trend and the Mann-Kendall test of annual precipitation from 1979 to 2018. (b) Annual precipitation trends at different stages.
Figure 8.
Analysis on trend and mutation of annual precipitation change from 1979 to 2018. (a)Trend and the Mann-Kendall test of annual precipitation from 1979 to 2018. (b) Annual precipitation trends at different stages.
Figure 9.
Analysis on trend and mutation of annual precipitation change in different seasons from 1979 to 2018. (a). Trends of annual precipitation in different seasons. (b). Mann-Kendall test of the seasonal precipitation trends.
Figure 9.
Analysis on trend and mutation of annual precipitation change in different seasons from 1979 to 2018. (a). Trends of annual precipitation in different seasons. (b). Mann-Kendall test of the seasonal precipitation trends.
Figure 10.
The measured and modeled daily flow during the calibration time (a) and the validation time (b).
Figure 10.
The measured and modeled daily flow during the calibration time (a) and the validation time (b).
Figure 11.
Daily flow of different runoff components during simulated period. (a) presents the calibration period and (b) presents the validation period.
Figure 11.
Daily flow of different runoff components during simulated period. (a) presents the calibration period and (b) presents the validation period.
Figure 12.
Daily average flow of different components in different seasons during modeled period.
Figure 12.
Daily average flow of different components in different seasons during modeled period.
Figure 13.
Mean annual contributions of each component to the total runoff from 2015 to 2018.
Figure 13.
Mean annual contributions of each component to the total runoff from 2015 to 2018.
Figure 14.
The changing trends of temperature and precipitation in three different scenarios.
Figure 14.
The changing trends of temperature and precipitation in three different scenarios.
Figure 15.
The changes of runoff in three different scenarios.
Figure 15.
The changes of runoff in three different scenarios.
Figure 16.
Glacier area in 2025, 2065 and 2010 in three different scenarios (Study areas are shown in green and glaciers in blue).
Figure 16.
Glacier area in 2025, 2065 and 2010 in three different scenarios (Study areas are shown in green and glaciers in blue).
Table 1.
Model Input Information.
Table 1.
Model Input Information.
| Data | Resolution | Source | Period |
|---|
| DEM | 270 m | SRTM | - |
| Soil map | 270 m | HiHydroSoil V2.0 | - |
| Landuse map | 270 m | GlobCover Landuse dataset | - |
| Glaciers map | 90 m | RGI 6.0 | - |
| Daily precipitation | 270 m | CMFD | Calibration:
14 April 2014 to 31 December 2016
Validation:
1 January 2017 to 31 December 2018 |
Daily temperature
(min, average, max) | 270 m | CMFD |
| Future precipitation and temperature | 270 m | CanEMS5 | 1 January 2025 to 31 December 2100 |
Table 2.
Model parameters calibrated by Parameter Estimation (PEST).
Table 2.
Model parameters calibrated by Parameter Estimation (PEST).
| No. | Parameter | Description | Value |
|---|
| 1 | DDFCL | Clean ice glacier degree-day factor
(mm·degree−1·day−1) | 7 |
| 2 | DDFDG | Debris covered glacier degree-day factor
(mm·degree−1·day−1) | 12 |
| 3 | DDFS | Snow degree-day factor (mm·degree−1·day−1) | 12 |
| 4 | SnowSC | Water storage capacity (mm·mm−1) | 0.3 |
| 5 | GwDepth, | Groundwater layer thickness (mm) | 5000 |
| 6 | deltaGw, | Delay time (d) | 0.01 |
| 7 | alphaGw | Baseflow recession coefficient (-) | 0.003 |
| 8 | Rootdepth | Rootzone depth (mm) | 200 |
| 9 | Subdepth | Sublayer thickness (mm) | 500 |
| 10 | Kx | Recession coefficient of routing | 0.96 |
| Disclaimer/Publisher’s Note: The statements, opinions and data contained in all publications are solely those of the individual author(s) and contributor(s) and not of MDPI and/or the editor(s). MDPI and/or the editor(s) disclaim responsibility for any injury to people or property resulting from any ideas, methods, instructions or products referred to in the content. |
© 2023 by the authors. Licensee MDPI, Basel, Switzerland. This article is an open access article distributed under the terms and conditions of the Creative Commons Attribution (CC BY) license (https://creativecommons.org/licenses/by/4.0/).


