Article

Modeling Multi-Objective Optimization with Updating Information on Humanitarian Response to Flood Disasters

School of Economics and Management, Beijing Jiaotong University, Beijing 100044, China
*
Author to whom correspondence should be addressed.
Water 2023, 15(11), 2122; https://doi.org/10.3390/w15112122
Submission received: 21 April 2023 / Revised: 16 May 2023 / Accepted: 20 May 2023 / Published: 2 June 2023

Abstract

:
Unpredictable natural disasters brought by extreme climate change compound difficulties and cause a variety of systemic risks. It is thus critical to provide possibilistic scheduling schemes that simultaneously involve emergency evacuation and relief allocation. But the existing literature seldom takes emergency evacuation and relief supplies as a joint consideration, nor do they explore the impact of an unpredictable flood disaster on the scheduling scheme. A multi-stage stochastic programming model with updating information is constructed in this study, which considers the uncertainty of supply and demand, road network, and multiple types of emergency reliefs and vehicles. In addition, a fuzzy algorithm based on the objective weighting of two-dimensional Euclidean distance is introduced, through moderating an effect analysis of the fuzzy number. Computational results show that humanitarian equity for allocating medical supplies in the fourth period under the medium and heavy flood is about 100%, which has the same as the value of daily and medical supplies within the first and third period in the heavy scenarios. Based on verifying the applicability and rationality of the model and method, the result also presents that the severity of the flood and the fairness of resources is not a simple cause-and-effect relationship, and the consideration of survivor is not the only factor for humanitarian rescue with multi-period. Specifically, paying more attention to a trade-off analysis between the survival probability, the timeliness, and the fairness of humanitarian service is essential. The work provides a reasonable scheme for updating information and responding to sudden natural disasters flexibly and efficiently.

1. Introduction

Various disasters (e.g., natural disasters, unconventional events, public health emergencies, etc.) have frequently occurred in recent years. According to data from Emergency Events Database [1], there were 999 natural disasters in Europe, focusing on the last 20 years (2001–2020). The most prominent ones are floods, storms, and extreme temperatures. It had killed over 150,000 people, affected over 11 million others, and cost over 217 billion dollars. Flood disaster characterized by the suddenness and interruption of disaster, poses a significant threat to the lives and welfare of entire populations [2,3,4]. Therefore, designing the multi-objective optimization by updating flood information, which consists of emergency evacuation [5,6,7] and supplies distribution [8] in dynamic flood scenarios, is a big challenge for decision-makers.
When a disaster occurs, the immediate evacuation of a person is pivotal in minimizing the possible risk of losses. Shahparvari et al. [9] aimed to maximize the number of evacuees with time windows and disruption risks under uncertainties. The succession of humanitarian evacuation depends on the capacity of available teams and fleets. Besides, relief items are only one kind of resource required for coping with the flood [3], which conduces to support evacuation activities and has increasingly drawn attention. Elçi and Noyan [10] discussed the state of the road through emergency transportation time in different scenarios.
Meanwhile, the research has turned its attention to the inter-connectivity and inter-dependency in various types of networks [11], network recovery and emergency response [12], as well as facilities location-routing problems with uncertainties [13]. In 2020, for instance, a large excess stock of supplies did not normally deliver as infrastructure had been damaged or destroyed [14,15]. But most of the literature assumes that no limitation exists in the state of the transportation network, the availability of vehicles and work crews, which in turn heavily obstructs the accessibility of schemes [16,17]. Moreover, a secondary disaster of the flood may occur, road network and evacuee population could be very hard to analyze, especially when considering the flood information. It is thus vital to research the problem of emergency evacuation and relief allocation simultaneously.
The existing work seldom takes emergency evacuation and relief supplies as a joint consideration, nor do they explore the impact of an unpredictable flood disaster on the scheduling scheme. Questions in research are thus proposed:
How to develop a multi-objective collaborative model with updated flood information that involves humanitarian evacuation and supplies distribution, according to the actual requirement of the disaster?
How to determine the optimal decisions to ensure that the trapped people and emergency reliefs are quickly and timely allocated to the nodes in the flood event?
Motivated by the literature and the actual situation of humanitarian rescue, the contexts of this study are included as follows: Firstly, a multi-stage stochastic programming model with the changed flood information is constructed. It not only applies Bayes’s theorem to discuss the variability of disasters, but also introduces the interval number and the triangular fuzzy number to describe the fuzzy uncertainty of variables. Secondly, in an attempt to systematically discuss the fuzzy uncertainty of functions and constraints in the model, the deterministic transformation of the fuzzy number, and a fuzzy algorithm that based on the objective weighting of two-dimensional Euclidean distance can be mainly involved in the method. Thirdly, the effectiveness and feasibility of the model and method can be verified by a case study, which is significantly impacted by heavy rains.
In brief, the contributions are as follows: In the first place, unlike the traditional study about the flood disaster, this work not only simultaneously considers emergency evacuation and relief allocation, but only integrates it into a multi-objective collaborative model with updating information in emergency response to the disasters. In addition, a methodology seamlessly and simultaneously maximizes problem-solving ability, which could effectively and efficiently dispatch emergency crews and supplies under the uncertainties of humanitarian demands and supplies.
This research is organized as follows: Section 2 briefly introduces an overview of the literature. This is followed by Section 3, where a mathematical model is given based on problem description and assumption. Section 4 demonstrates the processes of an efficient method. Results and discussion of case study can be drawn in Section 5, whilst Section 6 introduces the conclusion and future work.

2. Literature Review

Two streams of emergency evacuation and allocation and the main differences of the research have been presented.
After disaster strikes, emergency evacuation, a complex and systematic project, is essential in influencing humanitarian response. Scholars have independently studied or combined emergency evacuation behavior (e.g., the evacuee demographics, route preference, route diversion, warning signals, etc.) and modeling [5,6,7]. For example, Bayram [7] analyzed the traffic assignment models, research objectives in evacuation modeling (e.g., the total evacuation or clearance time minimization, total shelter cost, shelter coverage, etc.), and the evacuee behavior issues (e.g., gender, ethnicity, perceived risk, etc.). Meanwhile, few authors have applied technologies to obtain real-time traffic network, which is easily damaged by emergencies. Liebig et al. [18] studied dynamic route planning based on real-time traffic information. Rodríguez-Espíndola and Gaytán [19] used a GIS analysis to discard the facilities and identify road failures. Research is also largely related to work teams that could quickly relocate evacuees to protected or less vulnerable shelters. Vkbari and Salman [20] provided a method to generate a synchronized work schedule for the road-clearing teams. Li et al. [21] integrated the logistic support scheduling with repair crew scheduling and routing problem.
To make emergency rescue more practical, more and more attention is being paid to allocating humanitarian supplies, which ensures the evacuated individuals’ daily lives. It not only uses the aggregated coverage model, maximum coverage model, and P-center model, but also systematically discusses the capacity constraints of shelters or vehicles. However, previous research often applies a single type of tool, and ignores the availability of the network in the hardest-hit areas after severe destructive flooding. It is argued that multi-type vehicles could be dispatched according to the characteristics of humanitarian resources. Alem et al. [22] developed a two-stage stochastic network flow model for decisions on the fleet size of multiple types of vehicles over a dynamic multi-period horizon.
Apart from focusing on one of the above issues, researchers have gradually paid attention to the impact of facilities networks on humanitarian allocation in the post-disaster. For example, Tofighi et al. [8] aimed to minimize the cost of stock pre-positioning, and the facility located in the first stage, whereas they sought to minimize total distribution time, the total cost of unused inventories and the unmet demands in the second stage. Renkli and Duran [23] used a scenario-based formulation to minimize the weighted probability of road blockage, whereas Xu et al. [24] studied a balance between the demands and restoration vehicle reliefs based on real-time disruption scenarios. Several authors have also constructed multi-stage stochastic models to coordinate the procession of emergency allocation. Rennemo et al. [25] proposed three-stage stochastic facility routing model to maximize the combination of demand fulfillment and unused budget.
In summary, the possibilistic scheduling schemes for emergency evacuation and relief distribution are rarely discussed in the existing studies. The main differences in this research can be seen as follows: Most of the literature takes an earthquake, typhoon, snow disaster, and other emergencies as the background, but there are few reviews on flood disasters. Emergency rescue, which involves the evacuation and relief allocation in the changed flood scenarios, is studied. In addition, some reviews often regard cost or time as the common objective. The performance of victims and the fairness of reliefs allocation are rarely considered simultaneously. A multi-objective collaborative model of emergency rescue with updated information is established, and the triangular fuzzy number and the interval number can be used to discuss the uncertainties of the demands and supplies. Furthermore, the realistic case is applied to verify the reliability of the approach, which focuses on minimizing emergency service time, the unfulfilled rate of relief and maximizing the saving of lives.

3. Mathematical Modeling

3.1. Problem Description

As an essential aspect of disaster response, emergency evacuation and allocation have been challenged by many factors [26,27], including the intensity of the disaster, the uncertainty of demand, and the availability of networks and vehicles. Based on the realistic circumstance of a disaster, and the multi-type of reliefs and vehicles, a multi-objective optimization problem with multiple periods in the changed flood scenarios is presented. To simplify the transmission dynamics of the model, the affected nodes, alternative roads, humanitarian service teams and vehicles are considered in this study. In the first place, victims in the trapped nodes are serviced by work crews, which are dispatched by the rescue nodes. And residents in the more serious areas are moved to the resettlement nodes. In an attempt to maximize the saving of lives and property, based on the feasibility of the service path, the ready availability of emergency evacuation is improved through the work crews of the rescue nodes. Besides, the multi-type vehicles, which take more responsibility for delivering daily and medical resources to the trapped and resettlement nodes, are assigned by emergency distribution center. It is how headquarters perform these activities in the stipulated time, space, and resource constraints, to minimize the timeliness and fairness of emergency service.

3.2. Notations and Assumptions

The graph G = (N, A) of which N ( A j B e D i D l N ) is the set of nodes, and A is the set of links. There are various nodes of emergency work teams A j N , where each crew j A j ; A set of the trapped points in the flood B e N , where each node e B e ; Demand nodes ( D i N ) of which they are either the trapped nodes ( i D i ) or the resettlement nodes ( w D w D i ); A set of emergency distribution centers D l N , where each reliefs center l D l . In addition, the work denotes the path of acr l , i   as c l i , marks the road of acr   j , e   as   c j e . At the same time, the observed time variables t  D t can be presented. The indices, sets, parameters and decision variables are given below (Table 1):
Considering the complexity and uncertainty of the flood disaster, a clear set of assumptions underpinning the model ought to be illustrated to simplify its scope and a set of variables. The main assumptions are as follows:
  • The probability ( p | φ ) of the certain observed information in the flood.
  • Mixing of the same kind of resources is allowed, but the mixing of multiple supplies is unworkable.
  • Information regarding the road network in the hardest-hit areas can be done by satellite images, helicopters or drones.
  • The number of people in the affected area is known, and the demand at each node has a linear function of its capacity.
  • Each crew departing from the rescue nodes must visit at least one trapped node through its route, and each trapped node should be visited by at least a team at the end of the task.

3.3. Model Formulation

To integrate emergency rescue efficiently and precisely into a multi-objective collaborative model with updated information. Considering the fuzzy uncertainty of emergency demand and supply as well as the road network, the triangular fuzzy number, Bayes’s theorem and the interval number are introduced to construct the upper-level and lower-level modeling with multiple periods.

3.3.1. The Upper-Level Modeling

As an important aspect of the design of the upper-level model is to rescue the trapped people, its thus necessary to maximize the saving of lives in the flood scenario φ , which can be expressed as follow:
Min z 1   = t D t k M e B e p t φ · 1 S e t k e · x ke
It is indicated that the prior probability of flood disaster and the occurred probability of the observed information that denoted by the p φ   and p t | φ , respectively. The occurred probability p t φ which can be understood as the posterior probability in flood is presented:
p t φ = p φ t = 1 p φ p t | φ φ δ p φ p t | φ t = 2 ,   3 ,   ,   T
In view of the index function of the survival probability of victims, which is proposed by Fiedrich et al. [28]. A piecewise function is illustrated as Equation (3), which shows the probability of evacuating people in a flood disaster.
S e t k e = 1     0.5 ( t ke t e ) 2 ,   t ke     t e 0.5 e 2 ( 1 t ke / t e ) ,   t ke   >   t e ,   j     A j ,   e     B e
The above function is inflected by   t e  and t k e  variables. If one of the condition t k e t e , 1 0.5 t k e / t e 2   is feasible for the survival probability of victims in flood disasters. S e t k e is calculated by 0.5 e 2 1 t k e / t e , otherwise.
Disaster-formative environment refers to the conditions and surroundings where flood disasters occur, determined by the factors that mainly result from the combination of climate variables and underlying surfaces. The connectivity of road networks which impacted by disaster-formative environments may be struck or damaged. And the transferred time of the rescue team is easily affected by a part of the waterlogged road. Ajam et al. [29] analyzed the issue of minimizing the total latency of the nodes with a single work team. Based on analyzing various parameters such as t j k e , t je , η 1 , η 2 and   a k e , the most important aspects of the time of work crews that assigned to the trapped nodes can be captured:
t k e = t jke ,   a ke   =   0 t jke 1   +   η 1 a ke ,   0   <   a ke     ε t jke   +   t je ,   ε   <   a ke     δ t jke 1   +   η 2 a ke   +   t je ,   δ   <   a ke     γ + ,   γ   <   a ke     1
Equation (4) illustrates the range of a ke affects the computational selection of t ke . In particular, if the a ke is bigger than γ , the result of t ke   is infinity. The time of work crews that serving the trapped individuals is also obtained similarly.
S.t.:
k M e B e g B e x keg 1 ,   e B e ,   k M
e B e k M x ke M j ,   j A j ,   e B e ,   k M
Constraints (5) and (6) demonstrate that each rescue team is sent to a maximum of one node at a time, and emergency crews dispatched do not exceed the maximum number.
k M e B e f k x ke t D t e B e N t e ,   e B e ,   t D t ,   k M
t D t i D i N t i t D t w D w N t w
Constraint (7) expresses that the capability of emergency crew shall not be lower than the population of victims. The number of individuals that resettled to each node is not greater than its maximum, as illustrated in Constraint (8).
k M x k e 1 ,   e B e ,   k M
Constraint (9) guarantees that no trapped node receives service more than once. Equations (10)–(12) are the variable constraints:
y j e = 0 ,   ε < a ke γ ,   k M x ke   = 0   or   γ < a ke 1 1 ,   ε < a ke γ   and   k M x ke > 0 ,   j A j ,   k M ,   e B e
x k e = 0 , 1
x k e g = 0 , 1

3.3.2. The Lower-Level Modeling
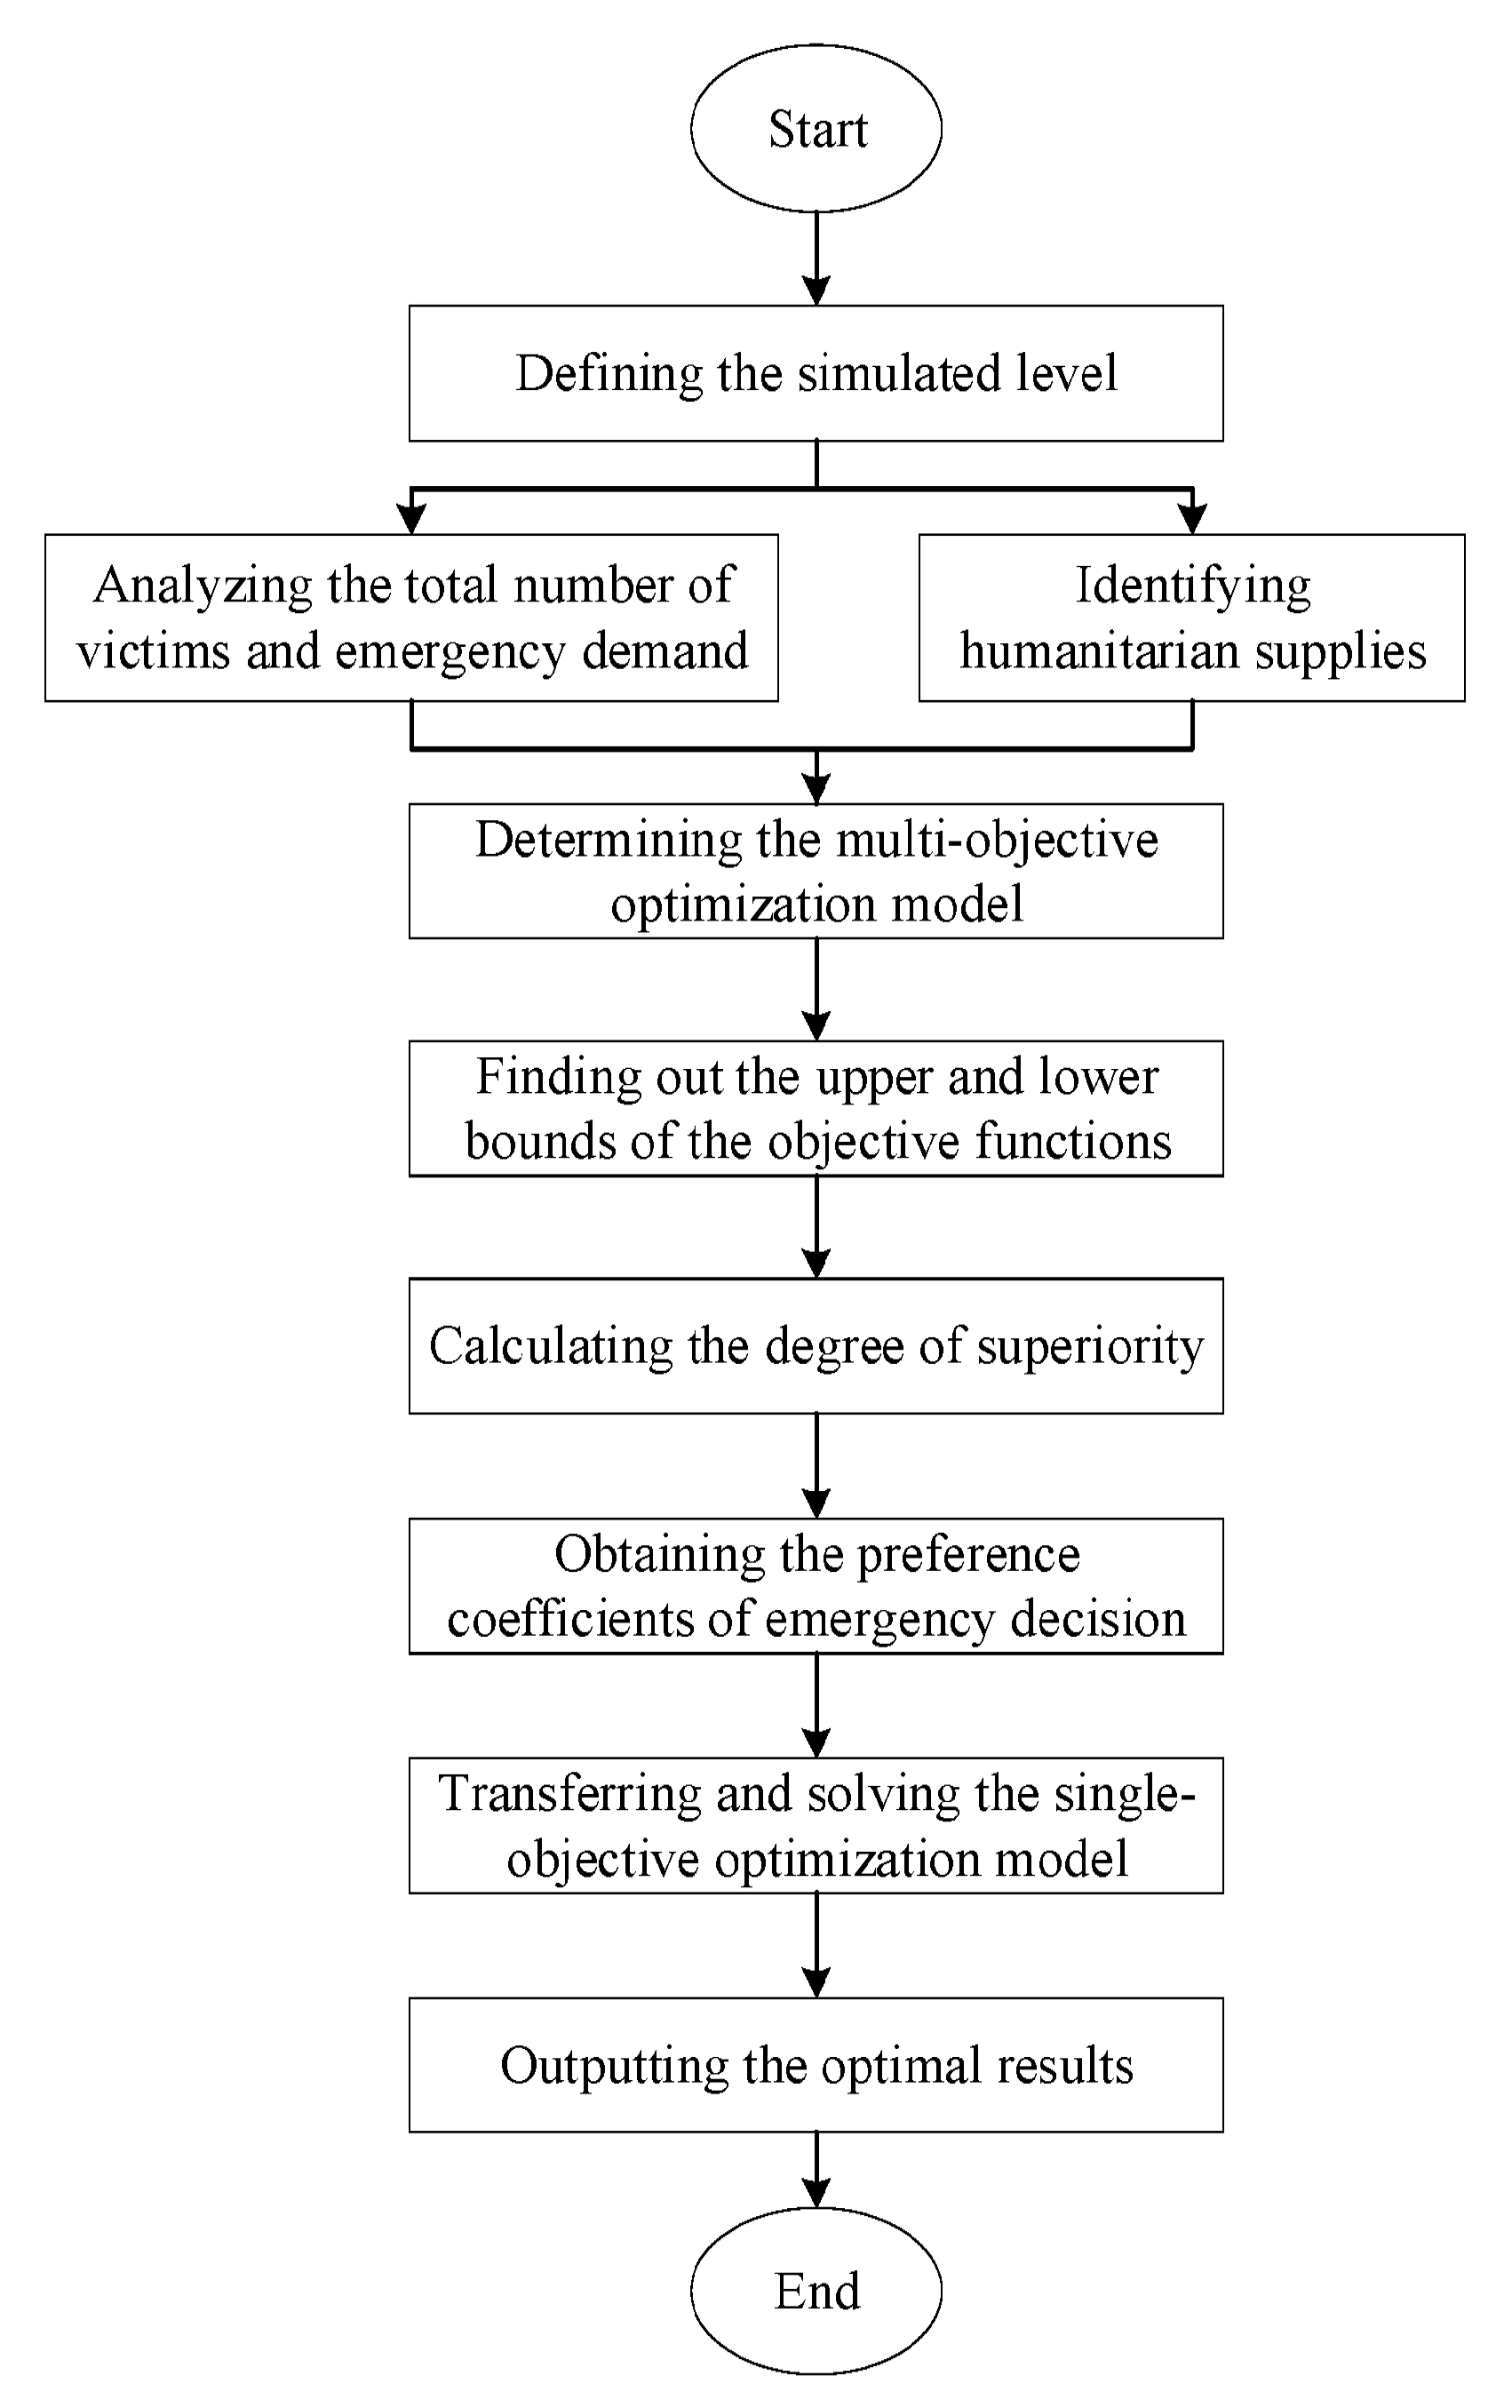
Satisfying emergency demand of nodes is crucial to the success of humanitarian relief allocation, as a lack of relief supplies may cause suffering and life loss for victims [30,31]. Fairness is included in the lower-level model that uses the performance measure related to the filling rate. This max-min objective function could be classified as an equality-based method [32]. Equation (13) is to maximize the minimum level of dissatisfaction on the condition of the flood scenario φ , thereby balancing the fill rate across them.
Max z 2   = min p t φ . l D l c C R l i c t D t i D i c C N t i d c
With the consideration of various variables such as the observation moments and waterlogged scenarios, the objective function of minimizing the service time of relief supplies is illustrated in Equation (14):
Min z 3 = p t φ · l D l i D i c C v L t li v c + ( t 1 ) · H
Many methodologies have been applied to discuss the damaged network [33,34] and vehicle travel time [35]. For instance, Baskaya et al. [34] explored the different route distances between relief centers and affected locations to reveal the disruption levels of road infrastructure. Humanitarian allocation greatly depends on the available fleet of emergency service vehicles and their capacity, the arrival time of vehicles is mainly affected by the distance of the flood-stricken areas. When the t li v c  is identified in Equation (15), which is associated with d l i , v l i c v and the coefficients that impacted by the connectivity of road network in the flood disaster.
t li v c = d li / v lic v ,   d li 15   km ,   a li = 0 ( d li / v lic v ) ,   d li 15   km ,   0 < a li ε τ ( d li / v lic v ) ,   d li 15   km ,   ε < a li δ ϑ ( d li / v lic v ) ,   d li 15   km ,   δ < a li γ + ,   otherwise
S.t.:
i D i c C v L τ M l v O i c τ v Q v ,   i D i , c C , v L , τ M l v
i D i c C R l i c l D l R l , l D l , i D i , c C
Constraints (16) and (17) are mainly analyzed for the capacity of emergency distribution vehicles and service centers.
l D l i D i c C v L x l i v c o D i i D i c C v L x i o v c 1 , l D l , i D i , c C , v L , o D i
Constraint (18) describes the continuity of emergency distribution service. Constraint limits the number of dispatched vehicles.
l D l i D i x l i v c M l v , c C , i D i , l D l , v L
The distribution of relief supplies to the affected nodes does not exceed its demand, as depicted in Constraint (20).
0 < l D l c C R lic t D t i D i c C N t i d c , l D l , c C , i D i , t D t
Constraint (21) defines the limited time of distribution service.
l D l i D i c C v L t l i v c i D i T i , i D i , c C , v L , l D l
Constraint (22) refers to the relationship between resources within a vehicle when it goes through two nodes before and after.
i 1 D i c C v L τ M lv O i 1 c τ v t D t i D i c C N t i d c = i D i c C v L τ M lv O ic τ v , i 1 D i , c C , v L , τ M l v , t D t
Constraint (23) demonstrates the domain of decision variables.
x livc = 0 , 1

4. Methodology

An efficient task does depend on the coordination between emergency evacuation and reliefs allocation, but addressing the multi-stage stochastic programming model with updating information in parallel gives a challenge in comparison to the single-objective case. Several studies in recent years have focused on the model and algorithm to improve the capability of humanitarian service after disruptive events, such as the heuristic algorithm [36,37], the random search algorithm [38] or other approaches [39]. Nevertheless, these methodologies are less used in a multi-objective collaborative model with the updated flood information. Instead, higher stability and reliability of the fuzzy algorithm based on the objective weighting of two-dimensional Euclidean distance is applied, considering the blurred boundaries, the urgency of reliefs, and the mutual and interconnected influences among objectives.
To deterministically analyze the fuzzy uncertainty of functions and constraints, which are transformed by the interval number and the triangular fuzzy number, the deterministic transformation method of fuzzy number is first utilized. A triangular fuzzy number is seen as a fuzzy set in the studied domain, and the interval number is included in the set, which consists of all real numbers in the range of a closed interval. The objective function (13) and some constraints can be updated as follows:
Min z 2 = p t φ . ( ( 1 r ) · l D l c C r l i c + r · l D l c C r l i c + ) / ( t D t i D i c C N t i · q c c + u q c c q c b )
( 1 u ) · l D l c C r l i c + u · l D l c C r l i c + ( 1 u ) · l D l r l + u · l D l r l + , l D l , c C 0
0 < 1 u · l D l c C r l i c + u · l D l c C r l i c + t D t i D i c C N t i · ( q c c + u q c c q c b , l D l , c C , i D i , t D t
k M e B e f k c + u f k c f k b · x k e t D t e B e N t e , e B e , t D t , k M
i 1 D i c C v L τ M l v O i 1 c τ v t D t i D i c C N t i · ( q c c + u q c c q c b = i D i c C v L τ M l v O i c τ v , c C , v L , τ M l v , t D t , i D i
Moreover, based on the discussion of deterministically transforming the fuzzy number within the model, the specific ideas and processes of an applied algorithm is seen in Figure 1. Main steps in the approach are:
(1) Based on the discussion and definition of simulating level, the function of three objectives in the mathematical model is rephrased as:
Minz ( x ) = ( z 1 x , z 2 x , z 3 x )
(2) Finding out the maximum and minimum of objectives, at the given constraints of modeling, the upper and lower bounds of them noted as sup{ z i x } and inf{ z i x }, respectively.
(3) Dealing with the degree of superiority of the objective functions, which are marked as μ 1 x , μ 2 x and μ 3 x , separately.
μ 1 x = ( sup { z 1 ( x ) }     z 1 ( x ) ) / ( sup { z 1 ( x ) }     inf { z 1 ( x ) } )
μ 2 x = ( sup { z 2 ( x ) }     z 2 ( x ) ) / ( sup { z 2 ( x ) }     inf { z 2 ( x ) } )
μ 3 ( x ) = ( sup { z 3 ( x ) }     z 3 ( x ) ) / ( sup { z 3 ( x ) }     inf { z 3 ( x ) } )  
(4) According to various factors such as the severity of a disaster, emergency supply and demand in each period, the decision preference coefficients are jointly determined by humanitarian experts and deciders. Denoting the coefficients of decision preference as w 1  and w 2 . It is noteworthy that the effective solution of modeling could be as close as possible to the ideal value.
i n w i 2 · μ i x b i 2 = i n w i 2 · μ i 2 ( x )
i n w i 2 · c i μ i x 2 = i n w i 2 · ( 1 μ i ( x ) ) 2
where b and c mean the preferred genera of the negative and positive solutions of the fuzzy, respectively.
(5) Combining the solution method and the preference coefficients of deciders, the multi-objective collaborative model can be transferred into a single one.
Max i n w i 2 · μ i 2 x + ( 1 i n w i 2 · 1 μ i x 2 )
i n w i = 1
(6) By constructing the Lagrange function, the above model is analyzed by Equation (37). To obtain the multiple objectives, it is necessary to find the partial derivative for w i , x i , σ , namely.
Z ( w i , x i , σ ) = i n w i 2 · μ i 2 x + ( 1 i n w i 2 · 1 μ i x 2 ) σ · ( i n w i 1 )

5. Results and Discussion

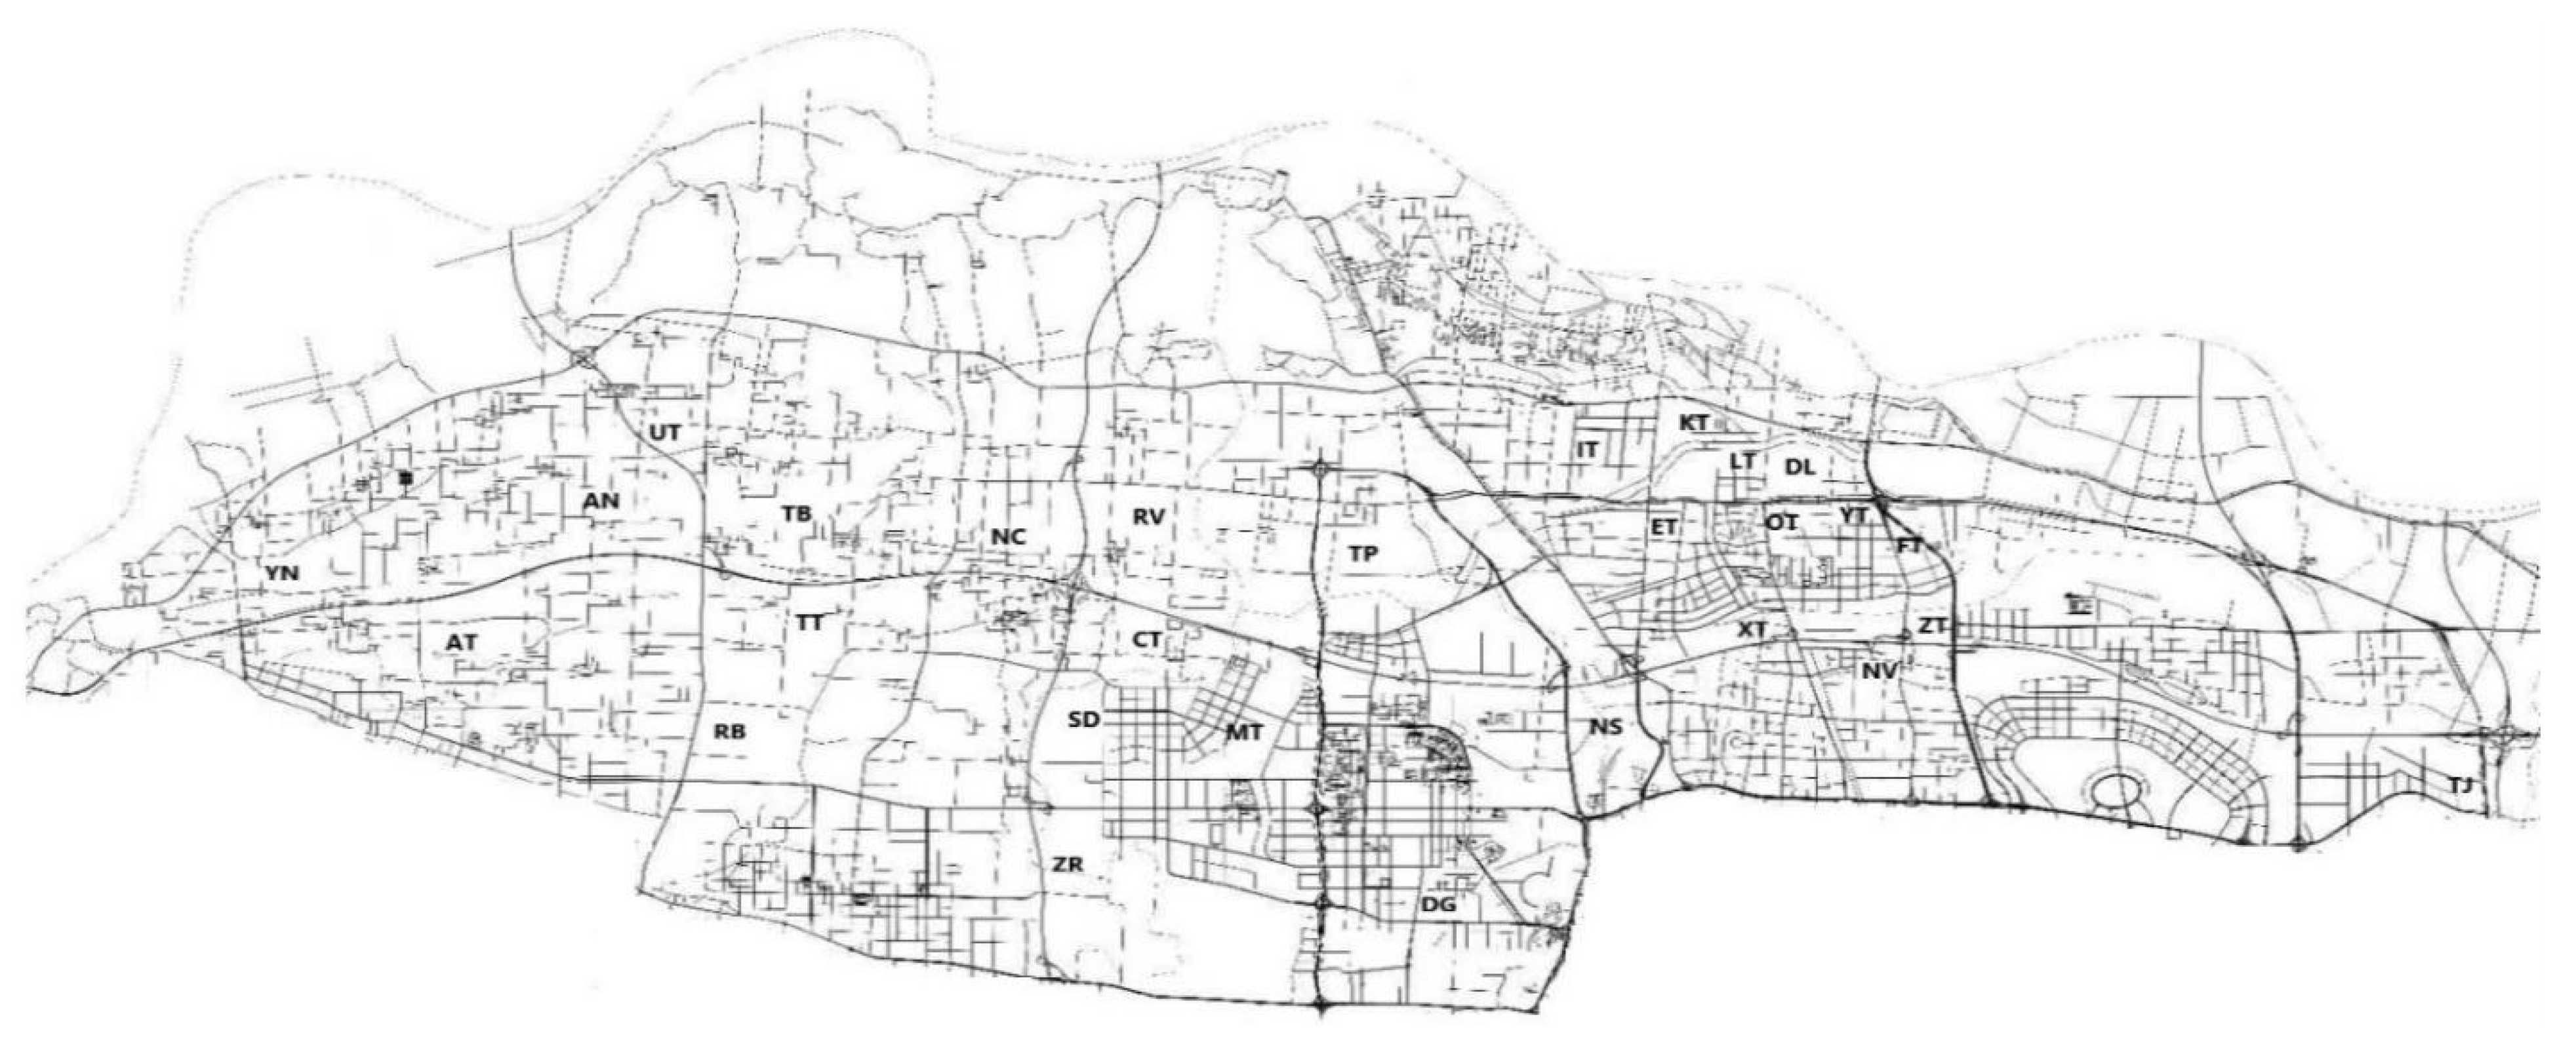
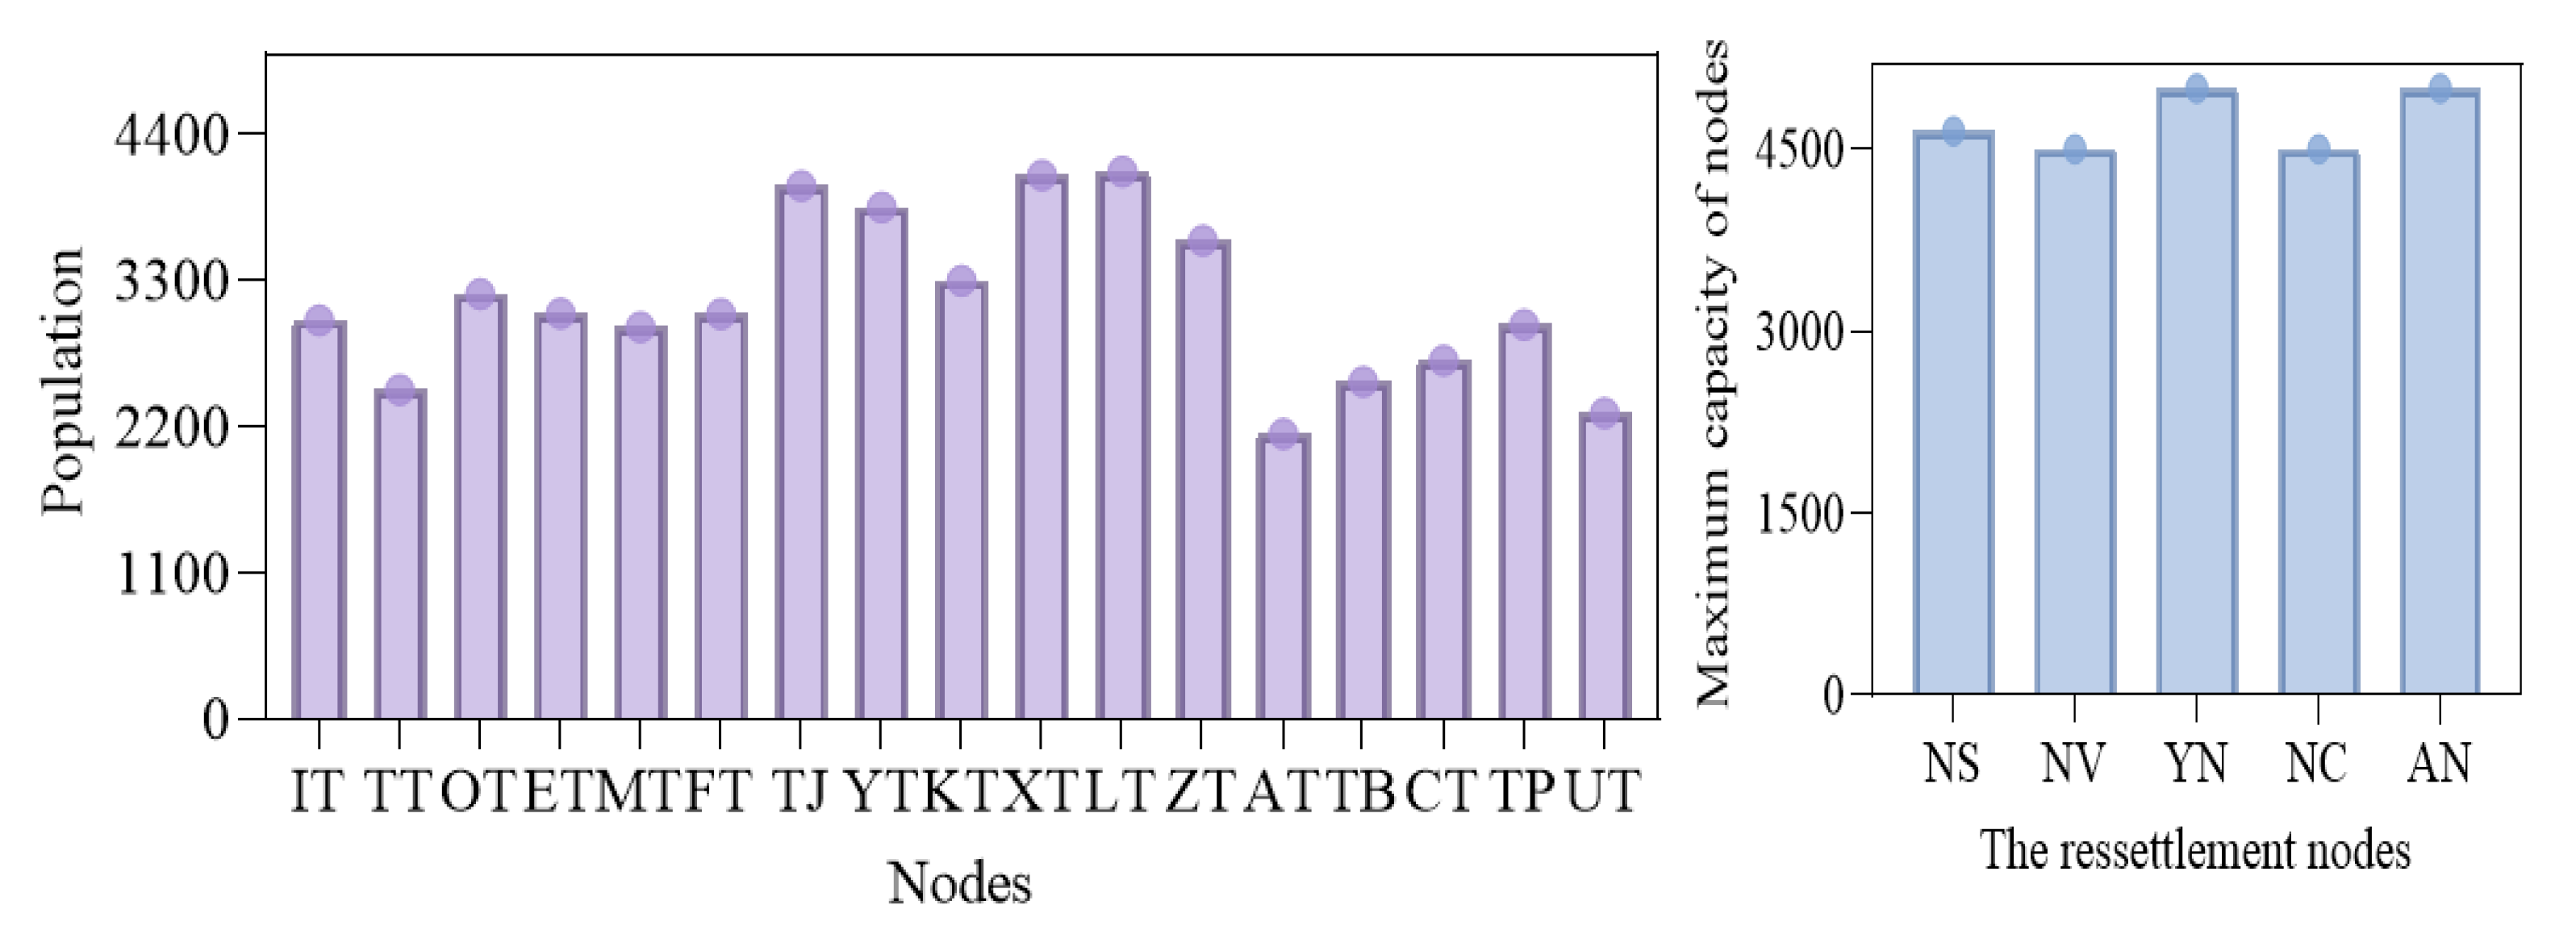
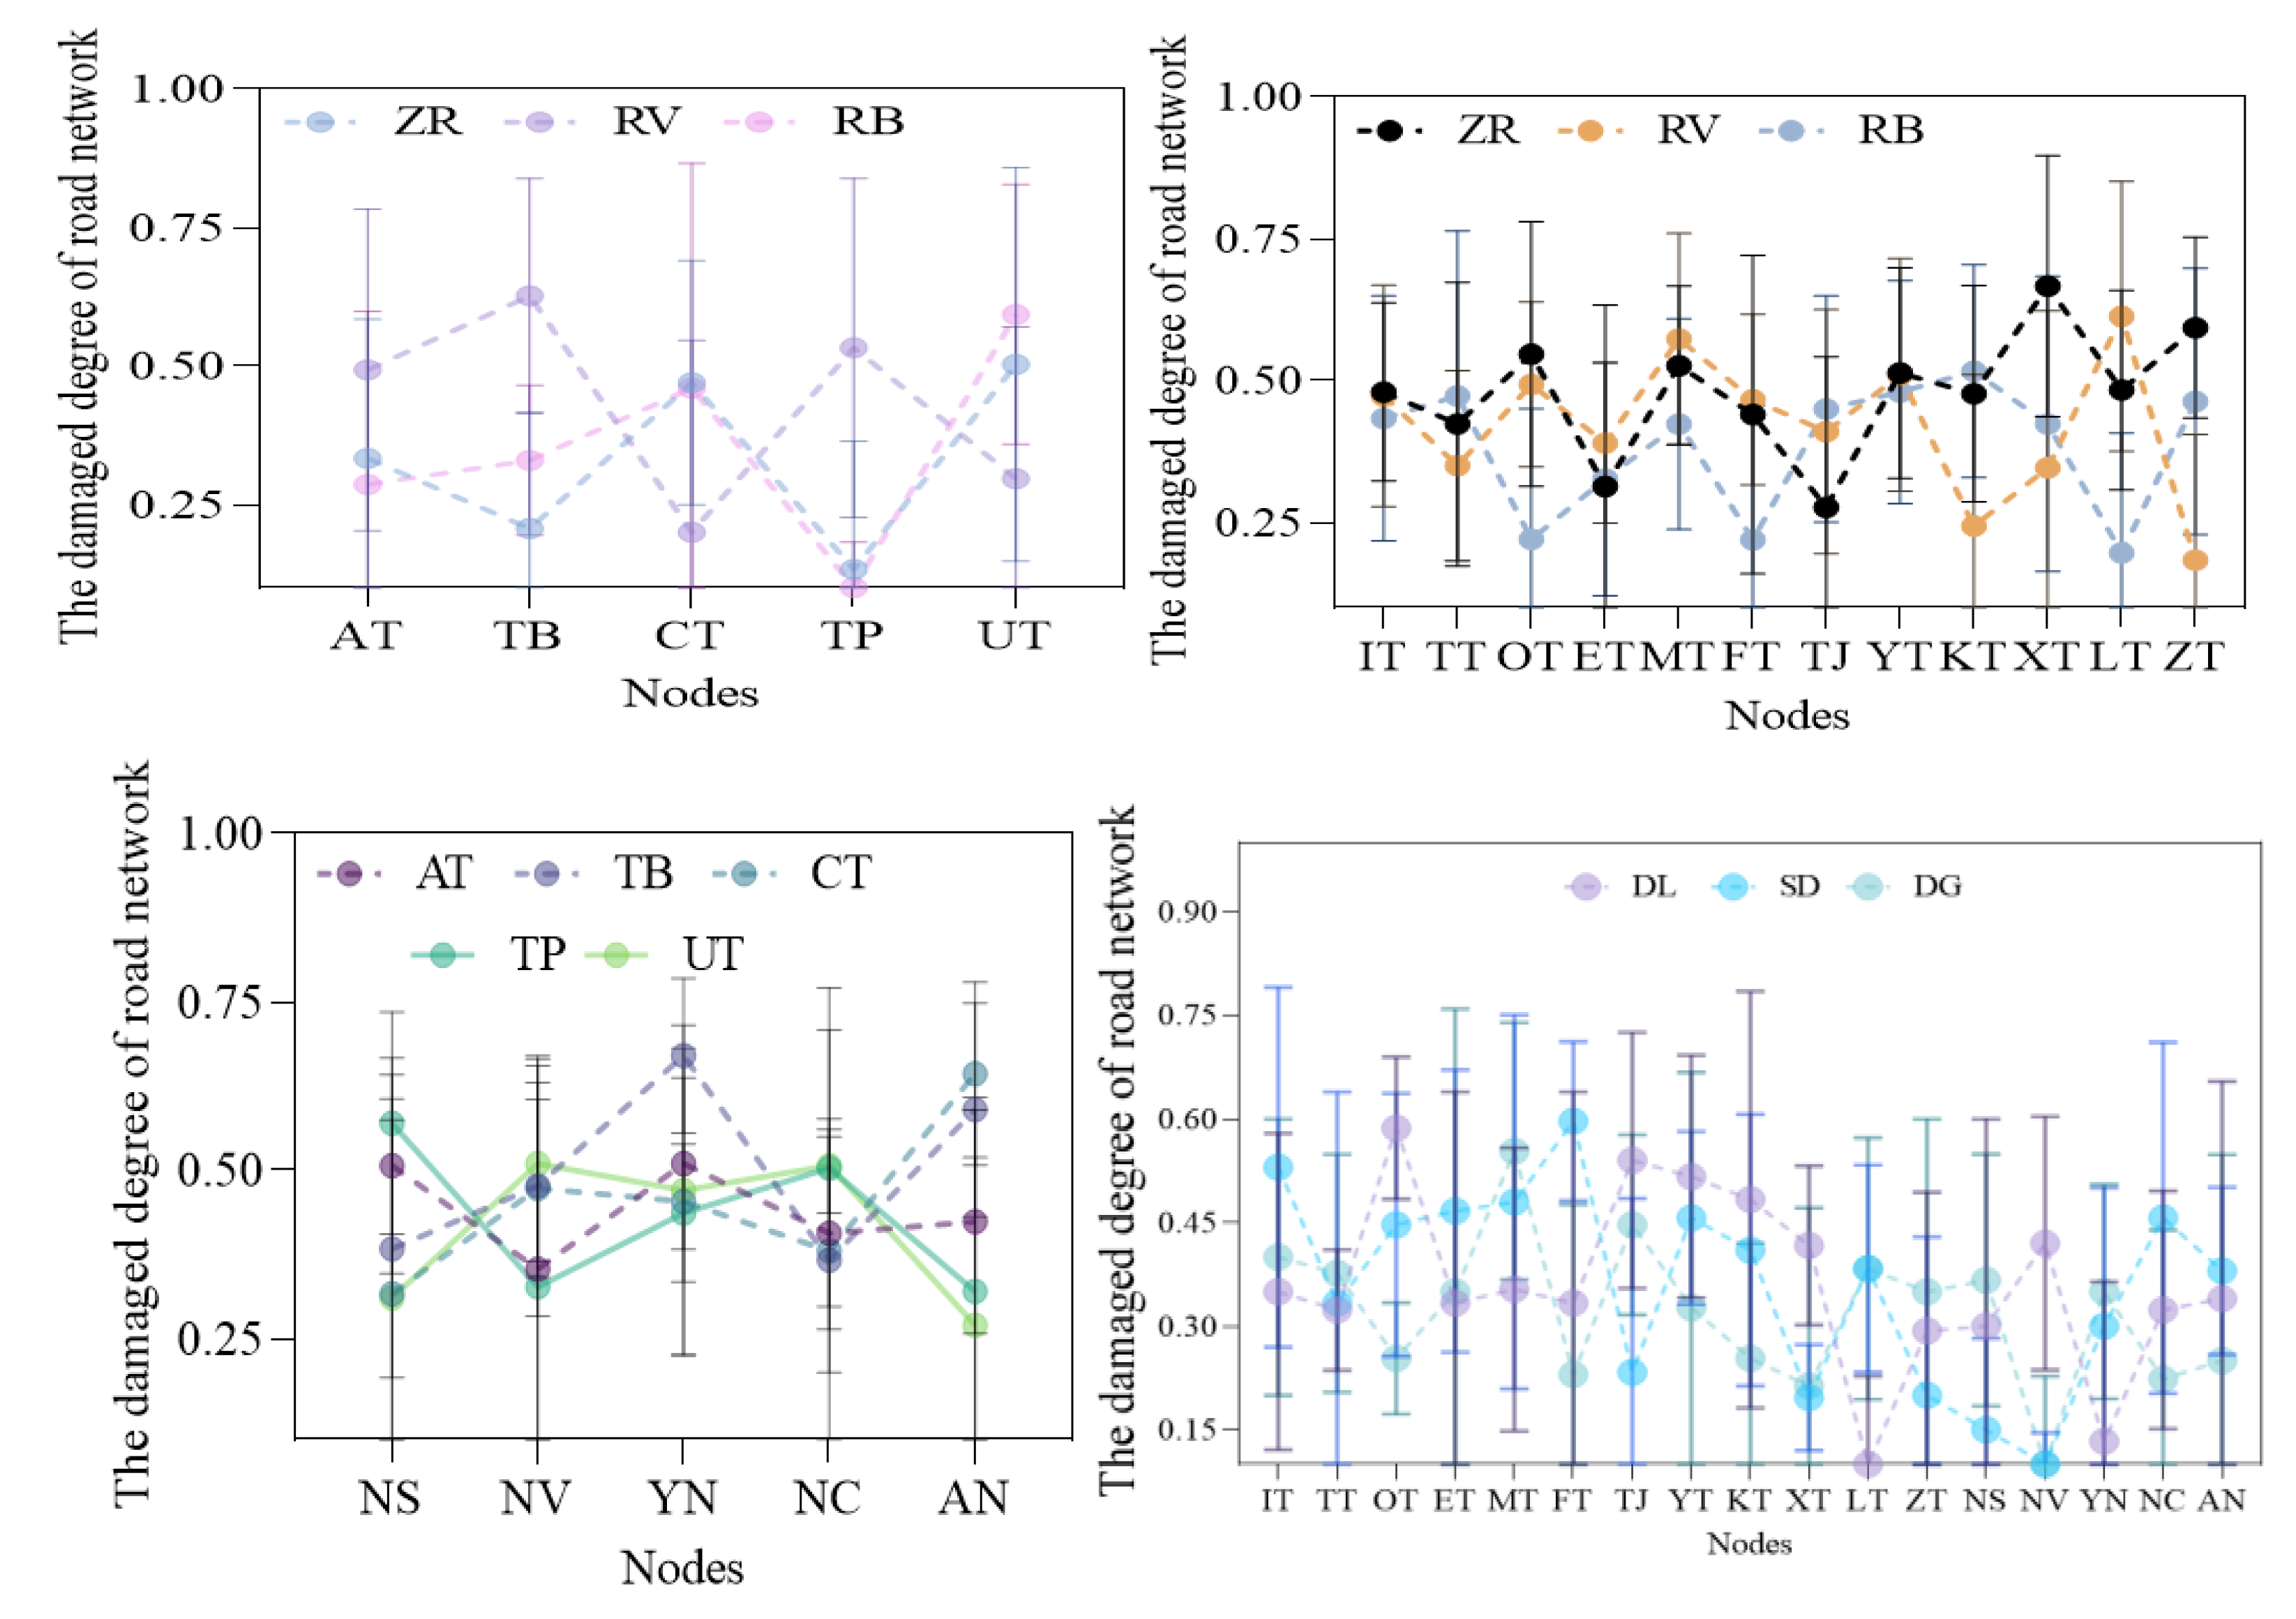
5.1. Data for Numerical Studies

In this subsection, the emergency rescue of rare sudden heavy rainfall in A District, Henan Province, China, in July 2021 is an analysis example. The rainfall volume of the case has broken the historical record in mainland China [40,41], which has seriously threatened people’s lives and the safety of the road. As shown in Figure 2, the rescued nodes (ZR, RV, RB) have work crews, which not only transfer victims from nodes such as AT, TB, CT, TP and UT to the resettlement nodes (NS, NV, YN, NC, AN), but also service the affected nodes (IT, TT, OT, ET, MT, FT, TJ, YT, KT, XT, LT, ZT) where people cannot be transferred. Three resettlement nodes are selected based on the rescue performance. The population and the capacity of various nodes are presented in Figure 3.
Flood process segmentation rules identify the beginning and ending times of flood phases considering both natural and social aspects and divide the flooding process into four phases: latency, onset, development, and recovery [42]. Increases in rainfall return periods and rainfall durations in the last three stages could lead to more severe flooding. It is of great significance to analyze the impact of the road network of the affected nodes on the runoff process in combination with the characteristics of the flood. The distance among the flood-stricken areas is seen in Figure 4, whereas the damaged level of road network in an extreme rainstorm is defined in Figure 5. Two commodity types, which require multi-type of tools (emergency daily and medical vehicles), are supplied by the relief centers (DL, SD, DG). The fuzzy demand per capita for daily relief and the medical item is [1, 4, 5] and [0, 2, 3], and the average weight of each pack is 5 kg and 0.36 kg.
In urban flood disasters, the disaster drivers primarily refer to heavy rain expressed by rainfall duration and accumulated rainfall [41]. At the same time, to accurately describe the difference in rainfall throughout the flooding process, the scenarios of the flood are divided into mild, moderate, and severe groups. By comparing with the official data released by the government [41,43,44] and the result of expert consultation, the relevant parameters settings for p | φ are represented in Table 2. It assumes that humanitarian managers not only may make a direct decision without observing the flood information at the first time, but also can carry out the rescue efforts.
In the case of data for some variables that cannot be published, according to the review of relevant literature [40,41], the investigation and consultation carried out in the scope of the research, the relevant parameters are set in a way that combines the simulated data are seen in Figure 6 and the Table 3, respectively.

5.2. Computational Results

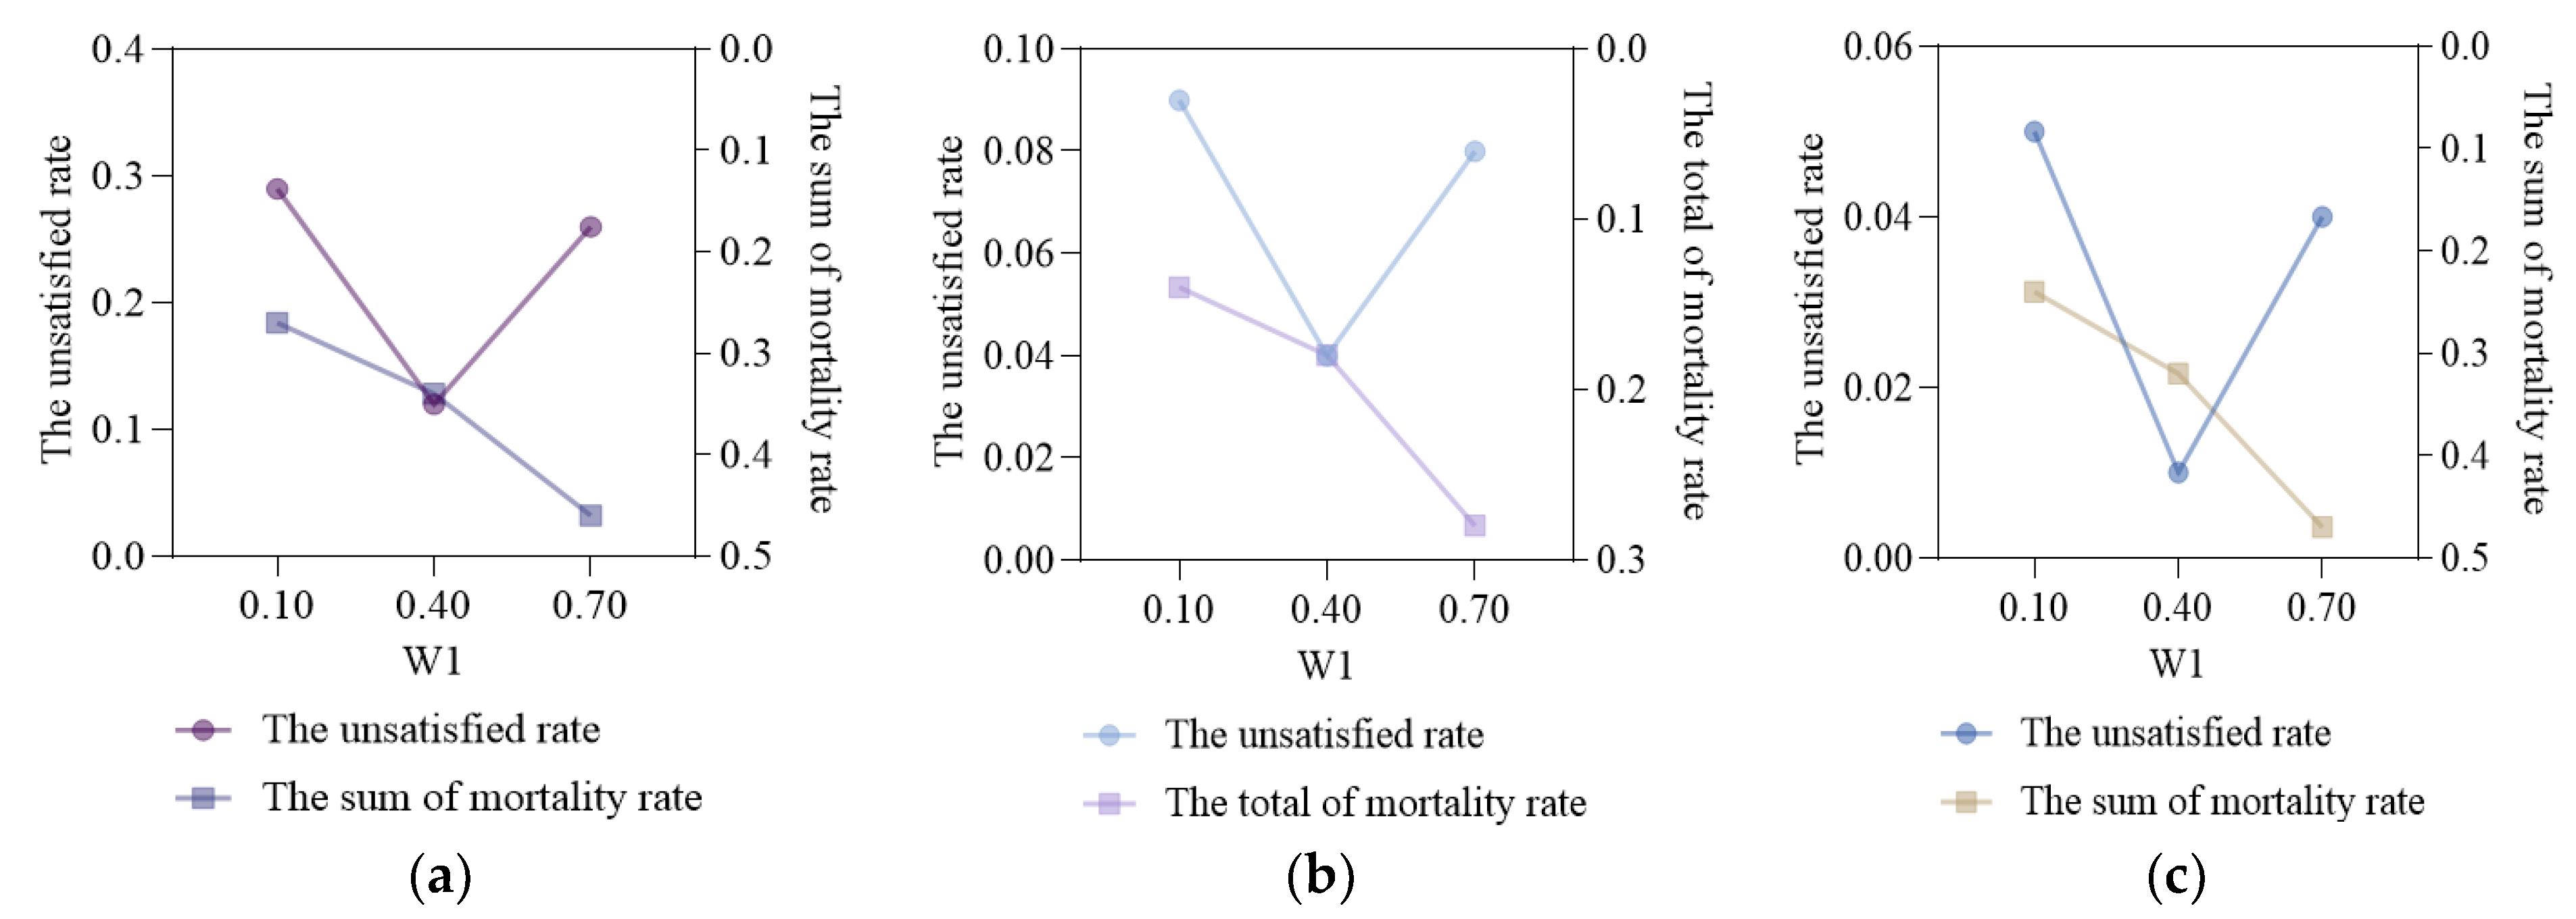
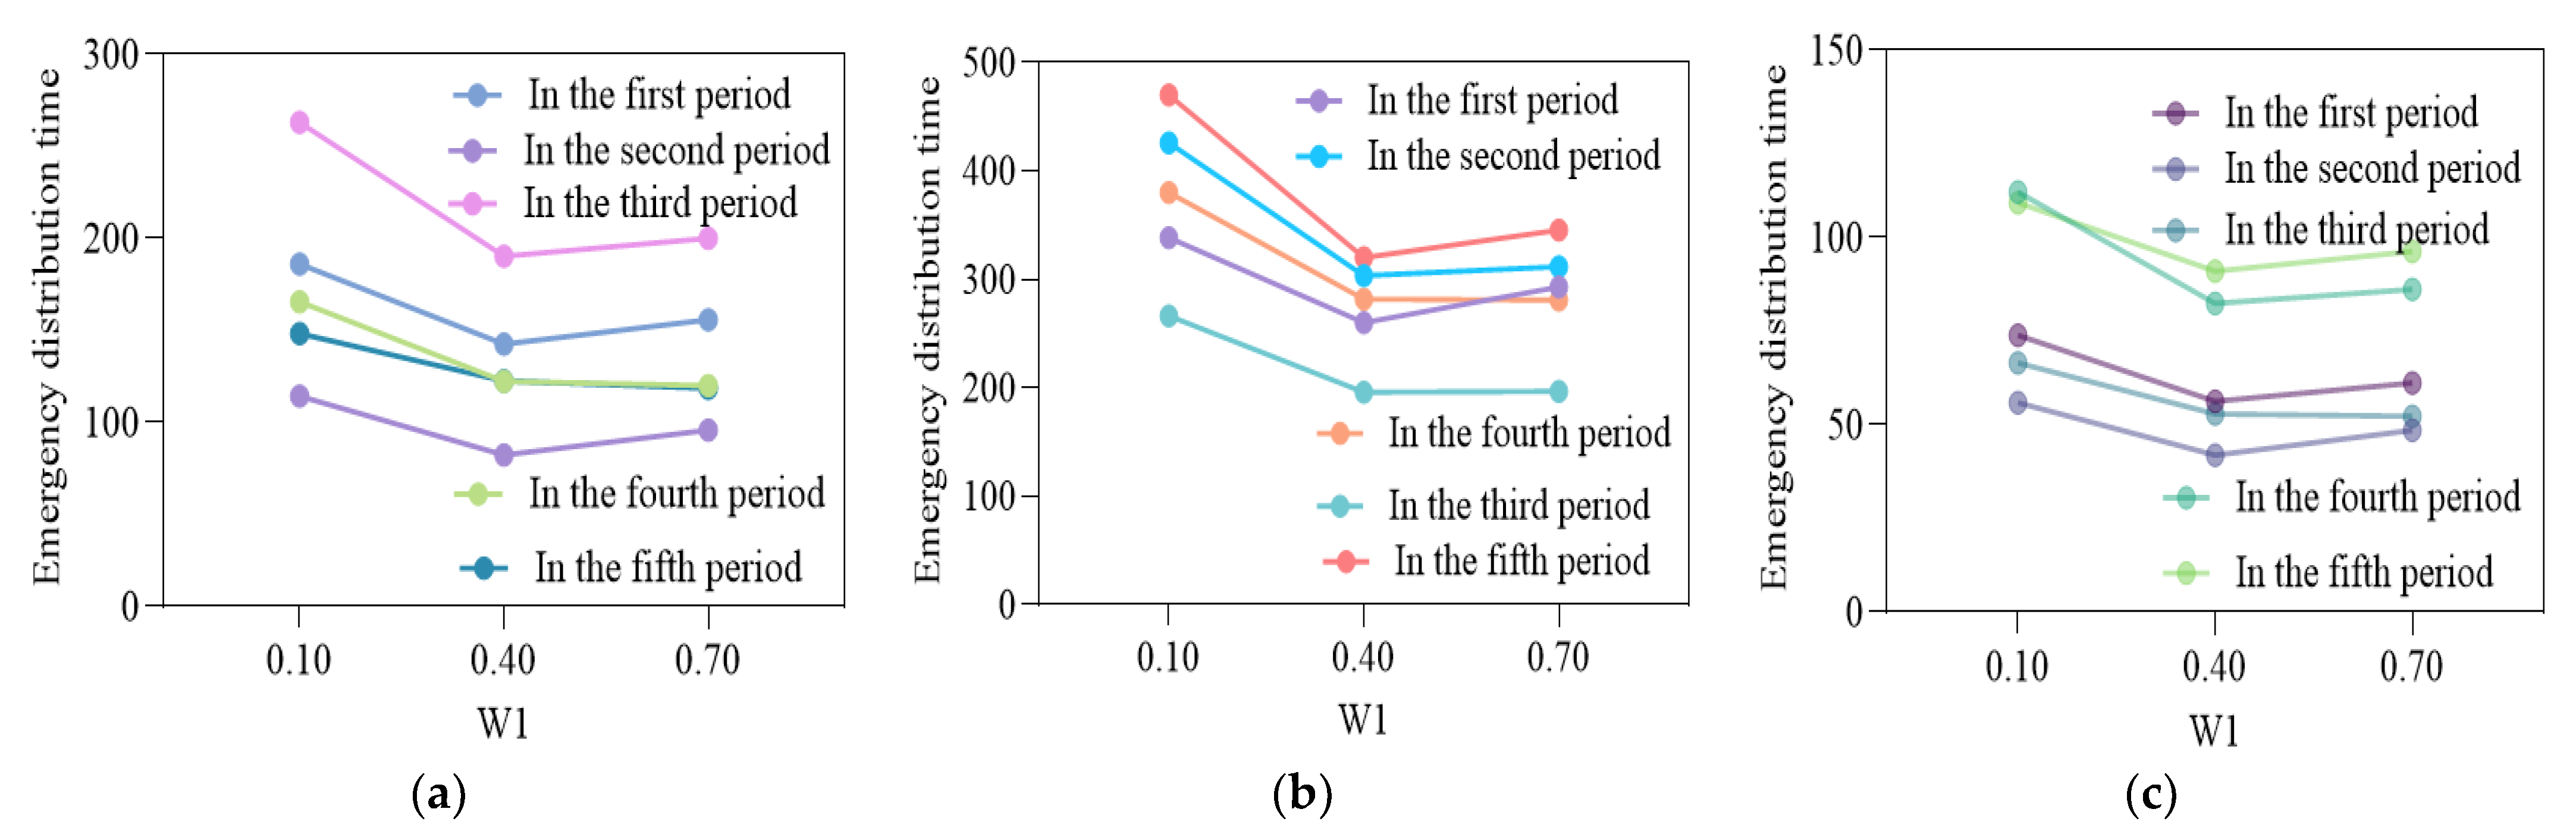
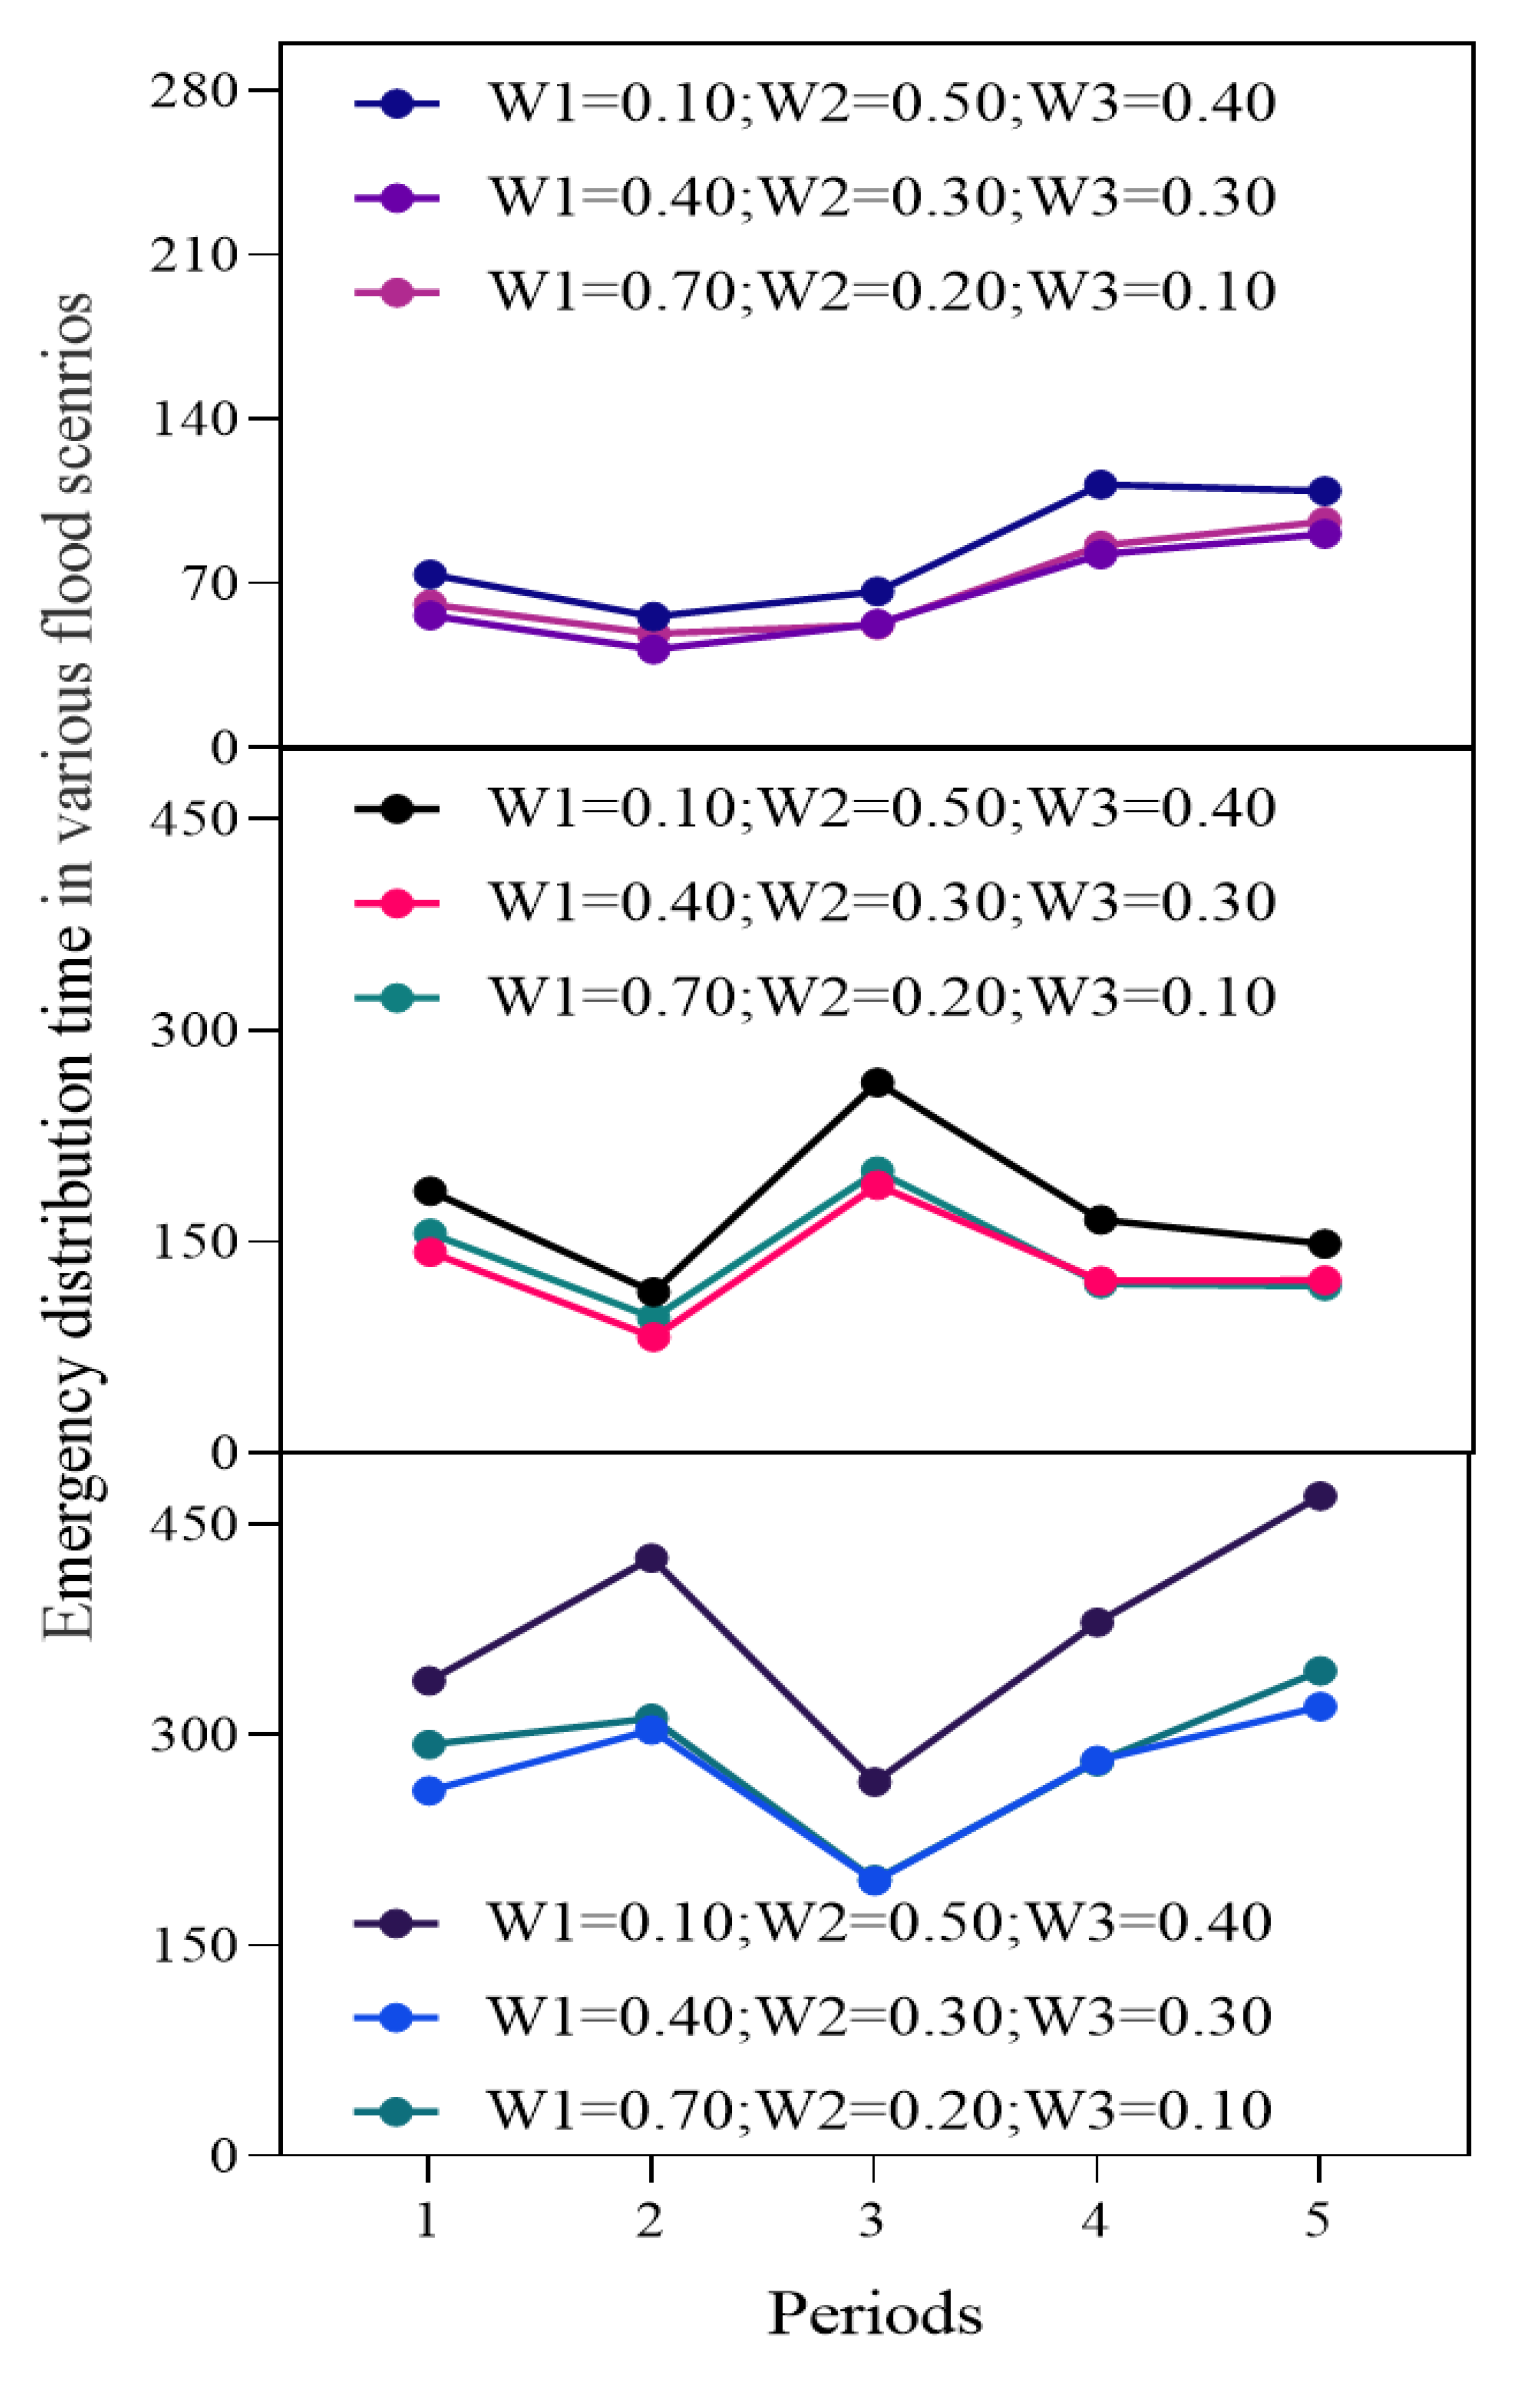
5.2.1. Ideal Weight of Sub-Objectives for Humanitarian Rescue

To obtain the scheduling schemes for the flood disaster, the first step is to discuss the ideal weight of sub-objectives for humanitarian rescue. The objectives of the model with multiple periods in the flood scenario φ  are calculated, with the constraints of decision preference (W1 = 0.10, W2 = 0.50, W3 = 0.40; W1 = 0.40, W2 = 0.30, W3 = 0.30; W1 = 0.70, W2 = 0.20, W3 = 0.10) which follow i n w i = 1. In the light, medium and heavy scenarios, the trend in the total mortality and unfulfilled rate in the first, second and fifth periods can be randomly selected (Please see Figure 7).
In the process of humanitarian rescue, the coefficient of decision preference has an important influence on the choice of scheme. As the weight of the survival probability gradually increases, the determination to minimize the mortality rate rises progressively. It increases the probability of survival within periods under the low, medium, and heavy disasters. Additionally, there is a tendency to fall and rise, when the unsatisfied logistics service gradually decreases. When the weight of the survival coefficient is greater than the unfulfilled coefficient, it implies that relief agencies focus on minimizing the mortality rate. Emergency performance is related to the capability of work teams and the updated information. On the contrary, emergency deciders are inclined to the fairness of relief allocation, with the consideration of the flood, victims, and tools information.
Emergency distribution time for each period in the low, medium, and heavy flood disaster is depicted in Figure 8, panels (a), (b) and (c), respectively. Following the decrease in service time preference, the requirement of planners for minimizing time is not very strong. It indicates that the target of emergency distribution time in multiple periods progressively decreases and then increases. What’s more, there is a different tendency from the first period to the fifth one in the same scenario. The reason why humanitarian time in the severe flood is significantly lower than others is that the value of p t φ is generally smaller. In terms of giving the preference of sub-objectives, deciders should be scientific in choosing the “degree”, and pay more attention to the dynamic information about the flood disaster, actual demand, and transportation network. And with the consideration of the uncertainty and different durations of the whole flood process [45], the planners could reduce barriers to exchange between regions and promote the circulation efficiency of elements in various areas [42].

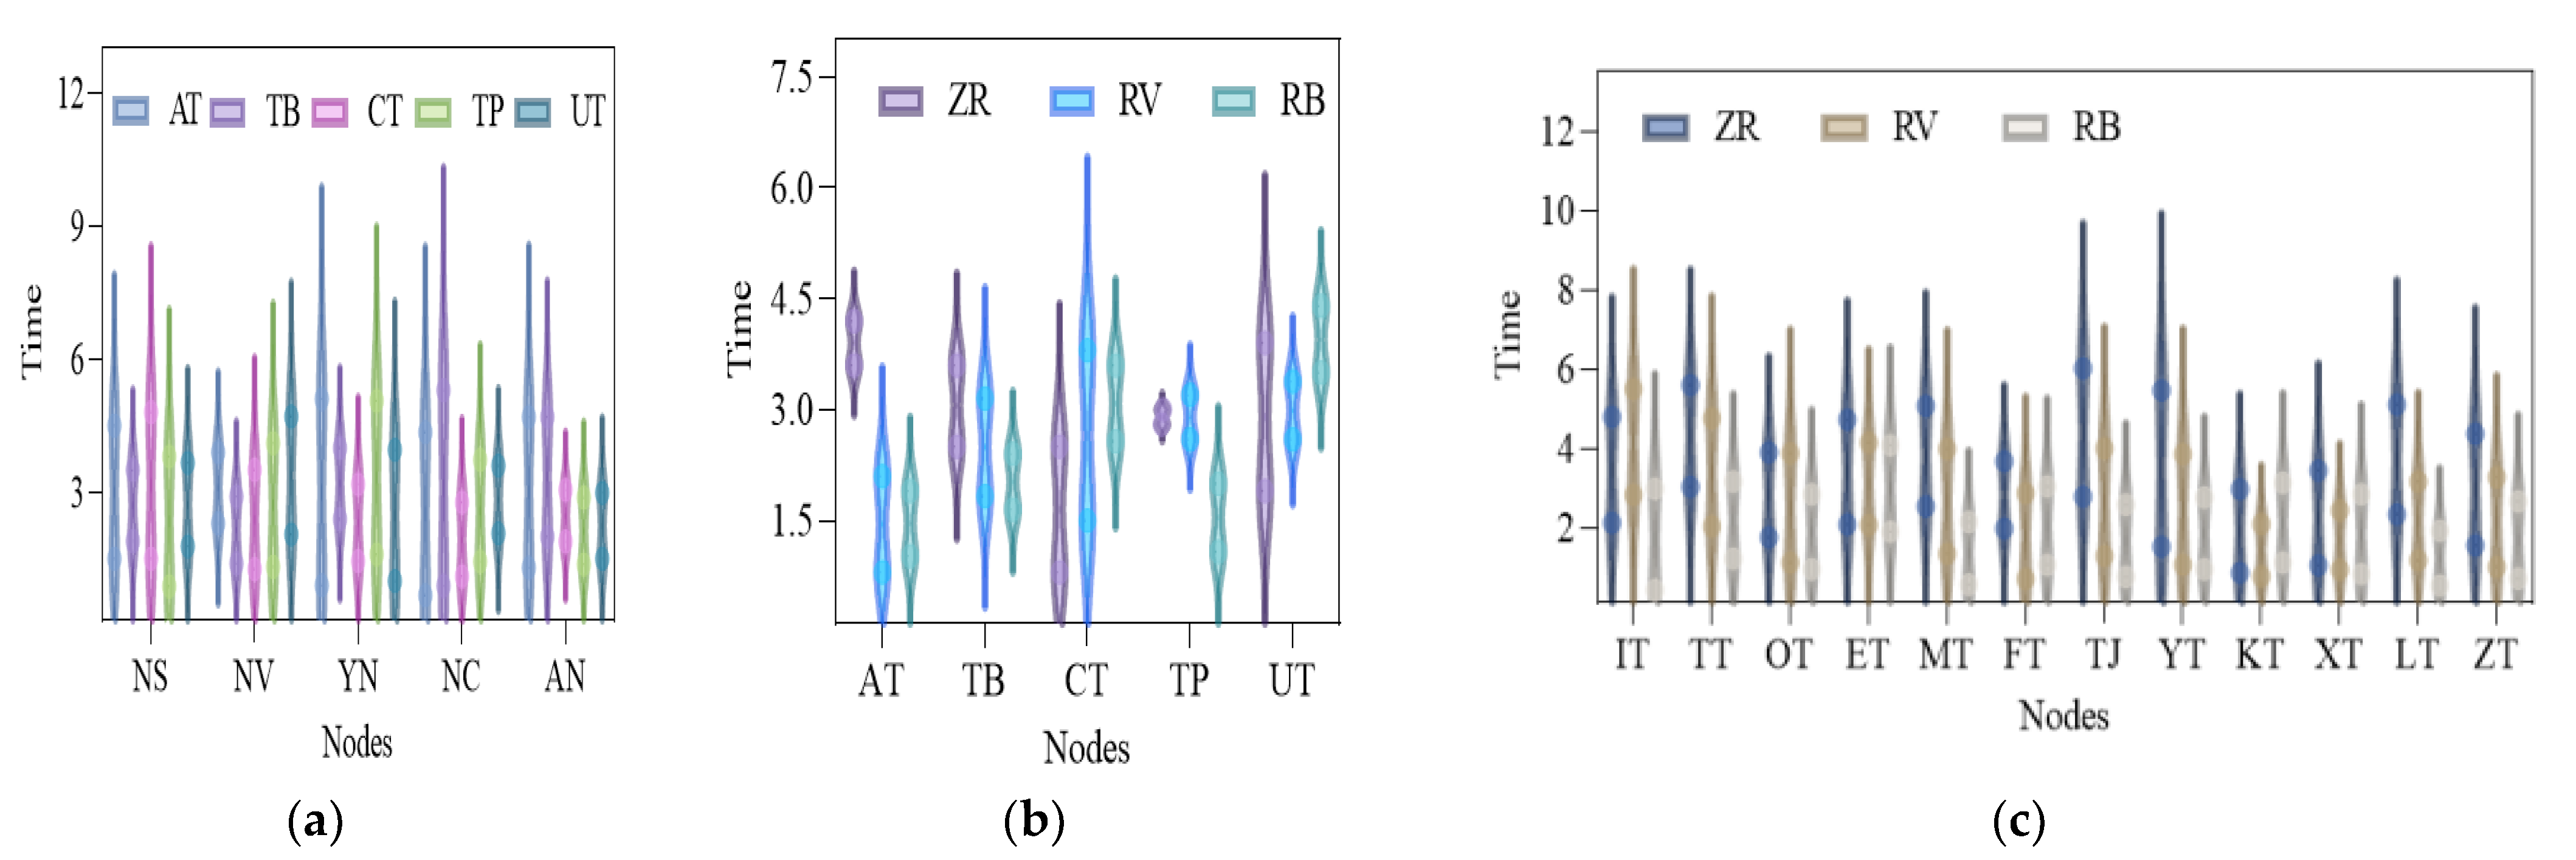
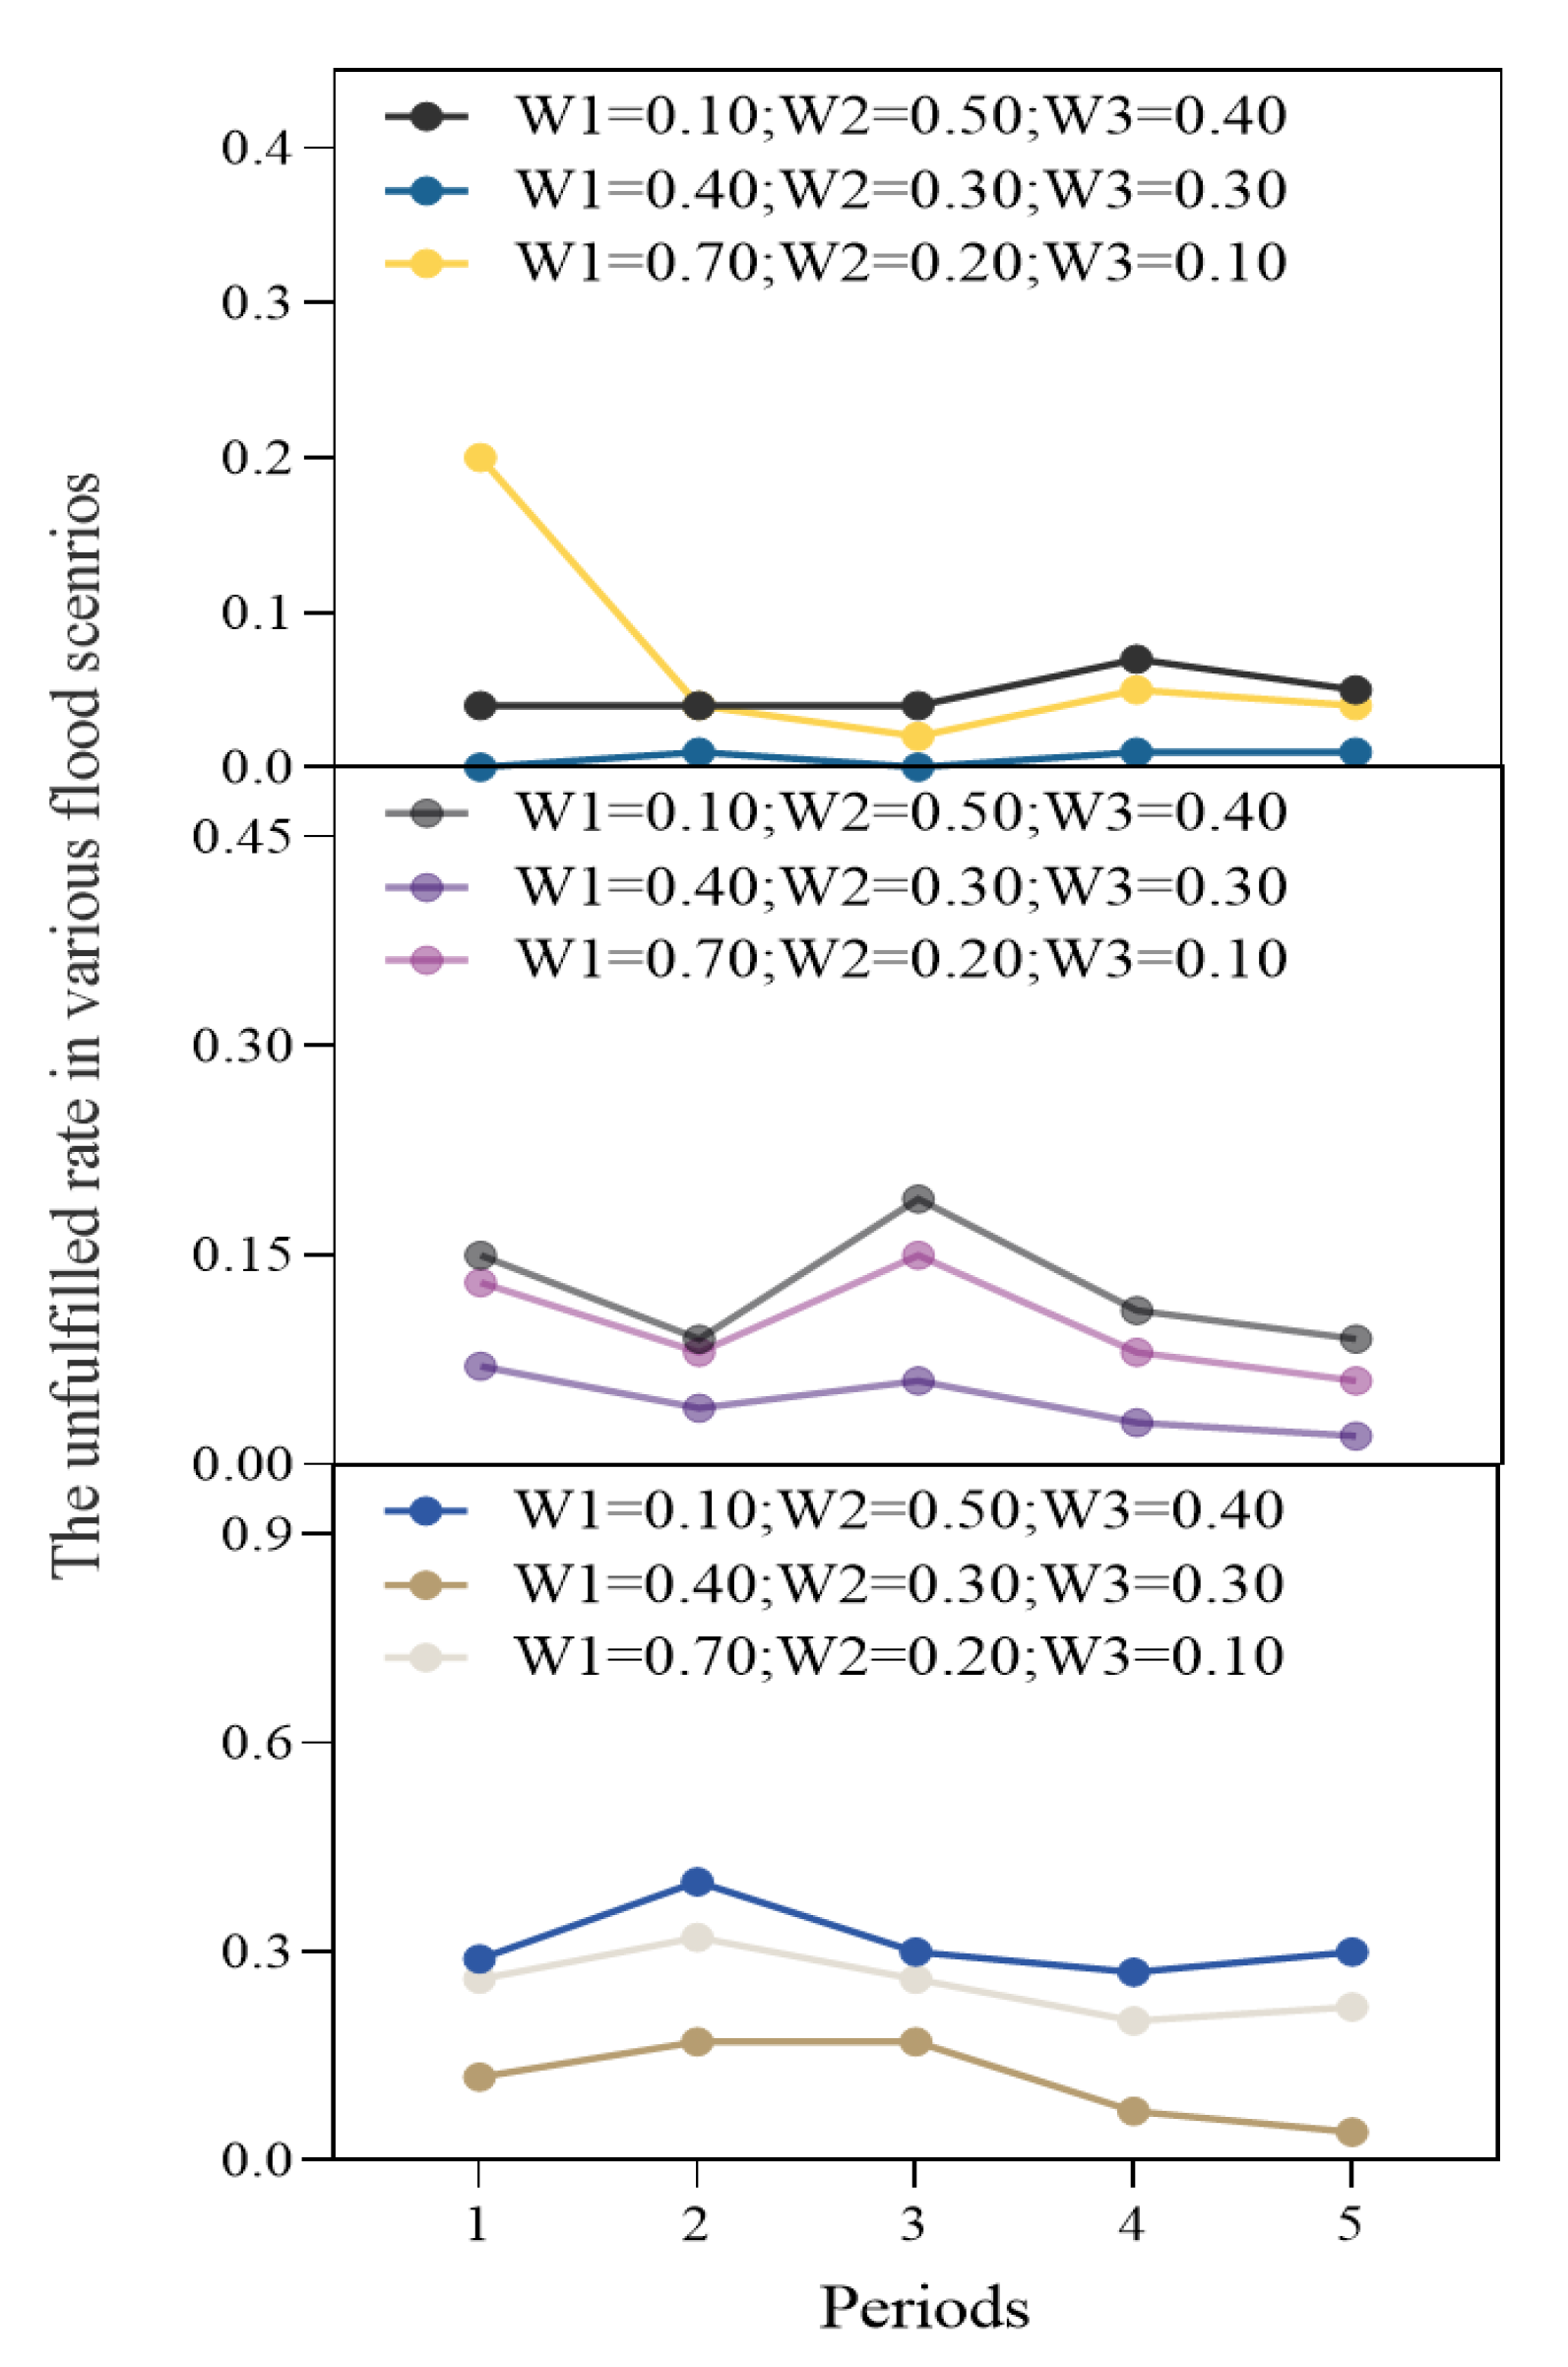
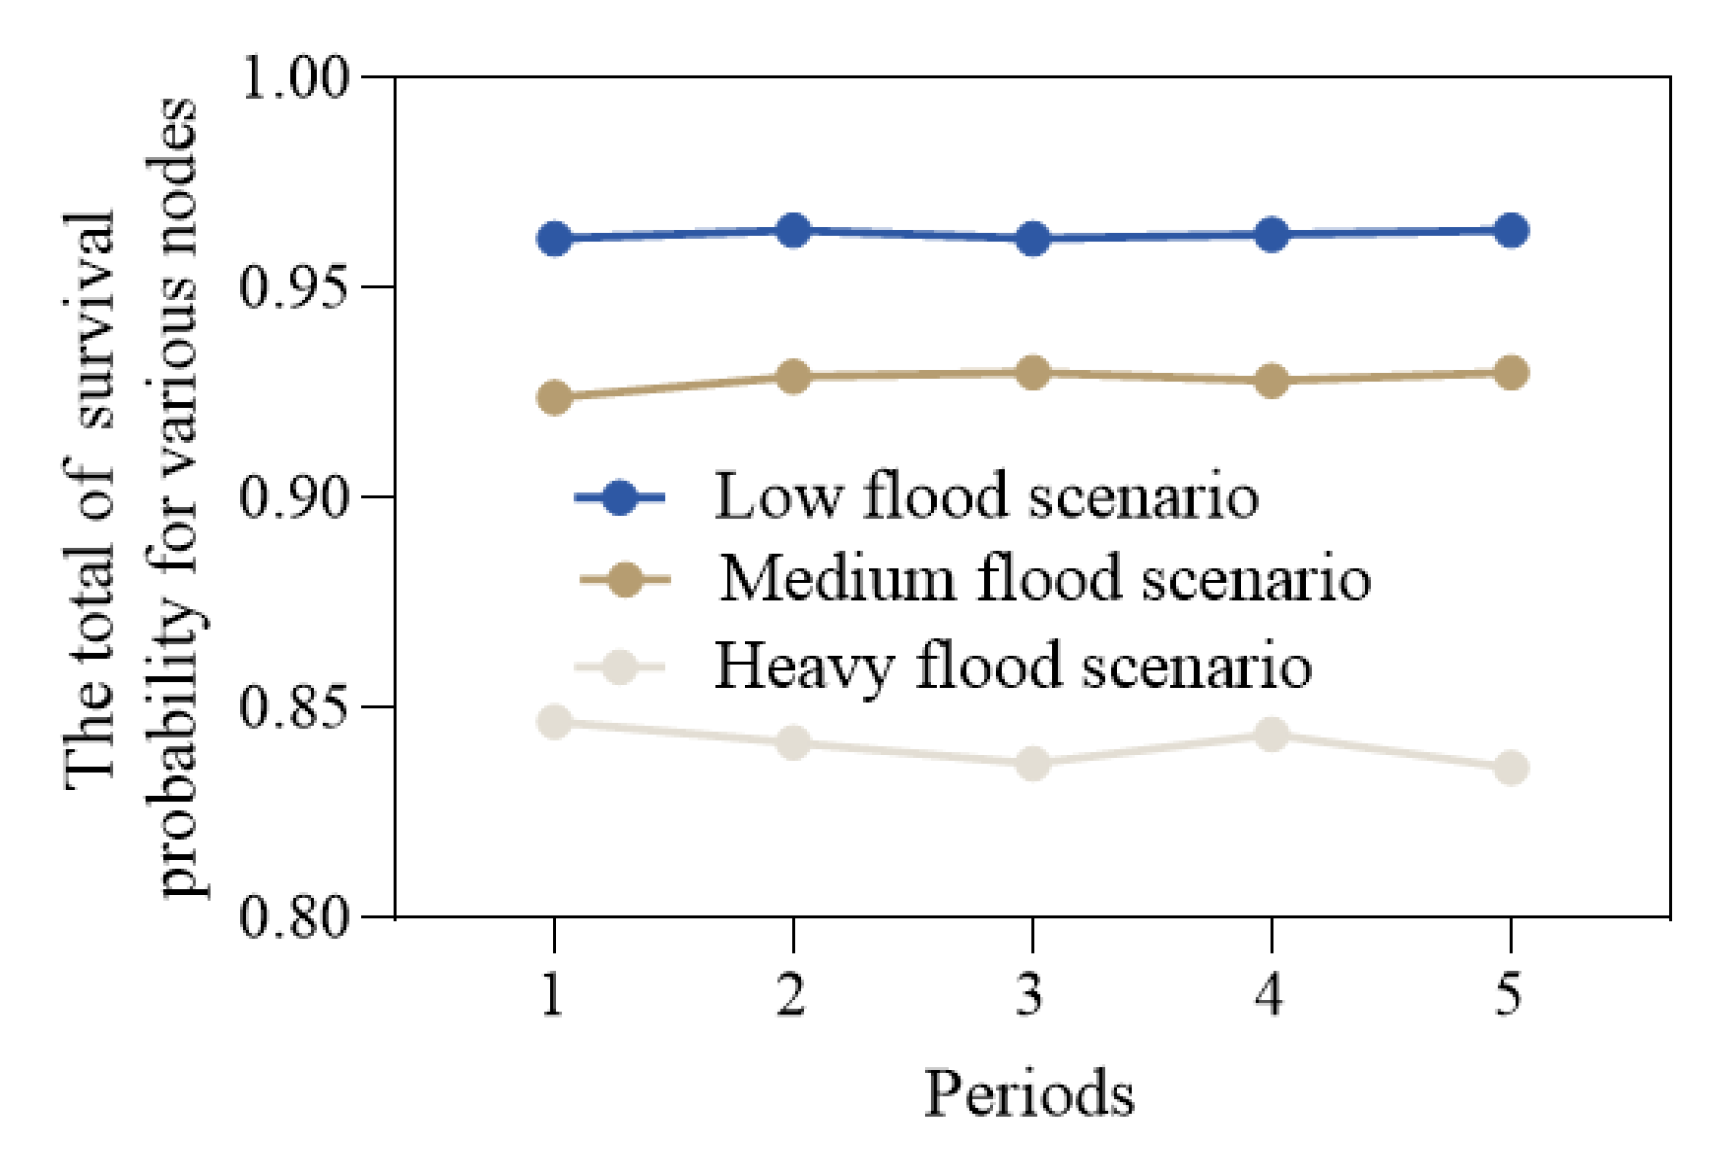
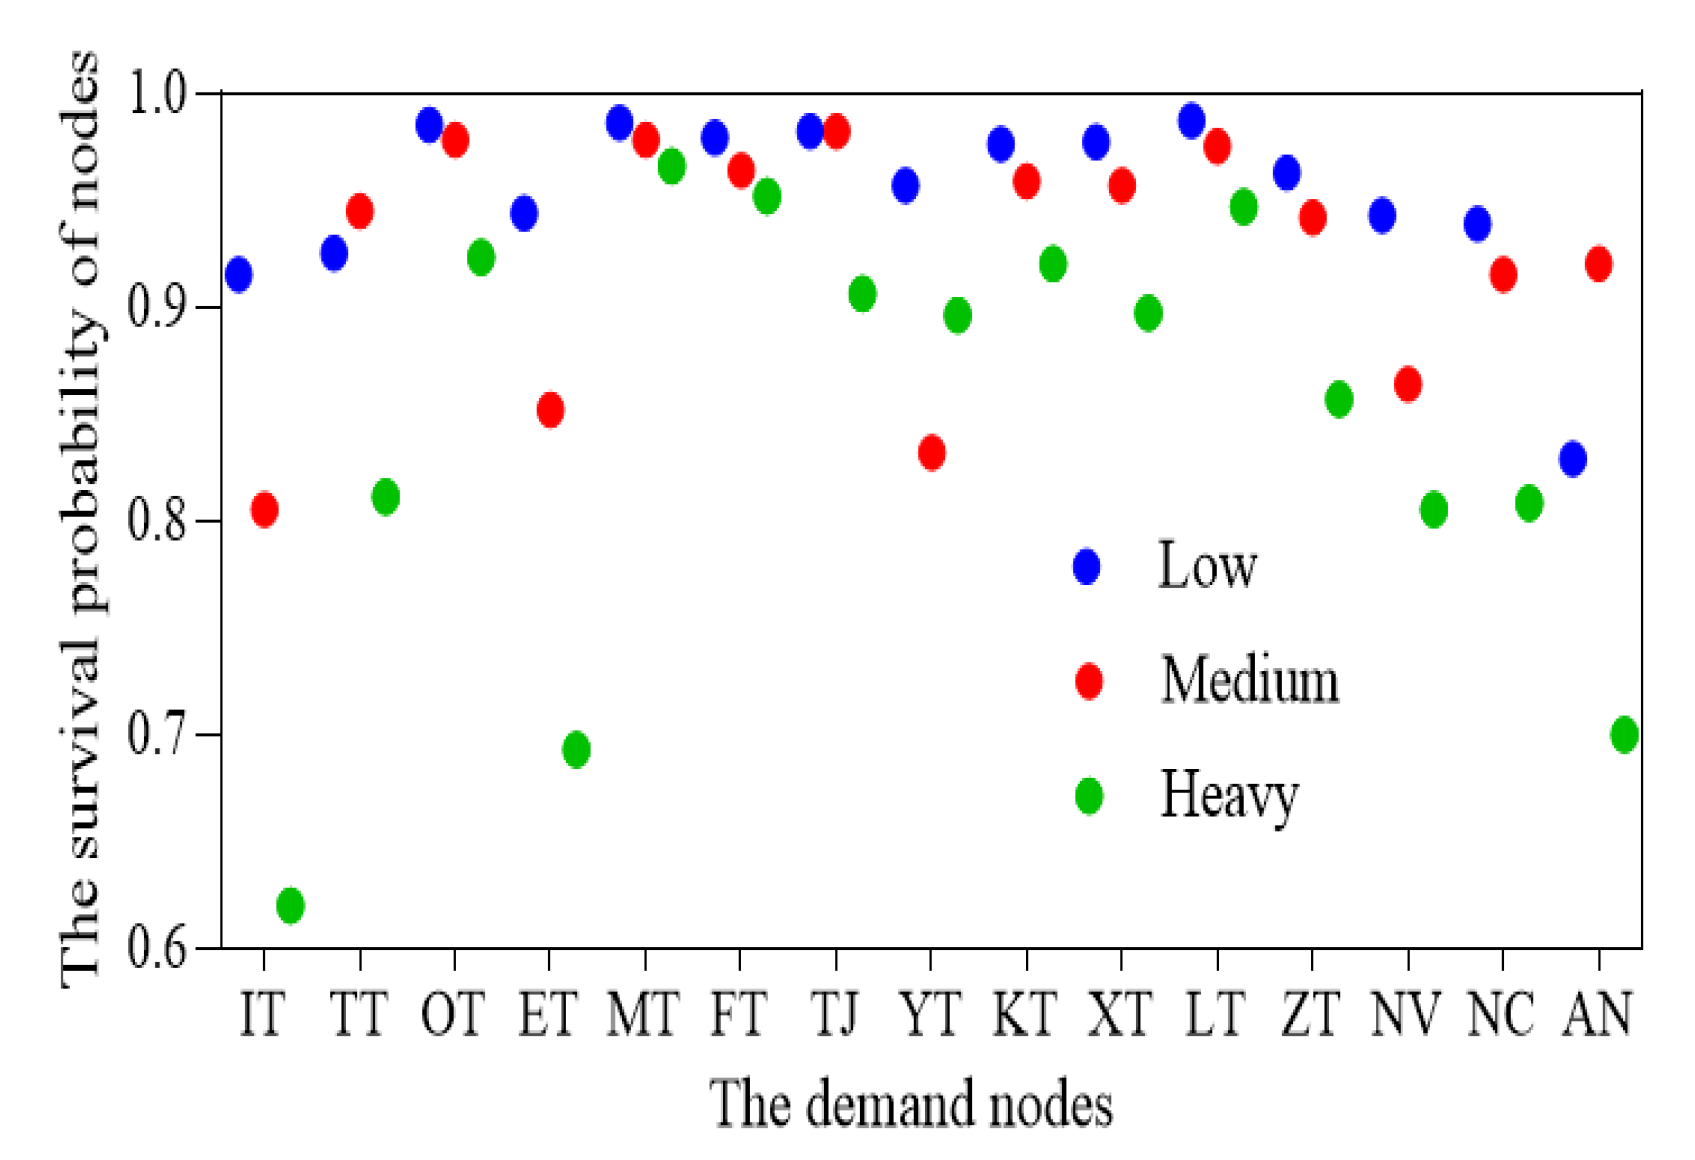
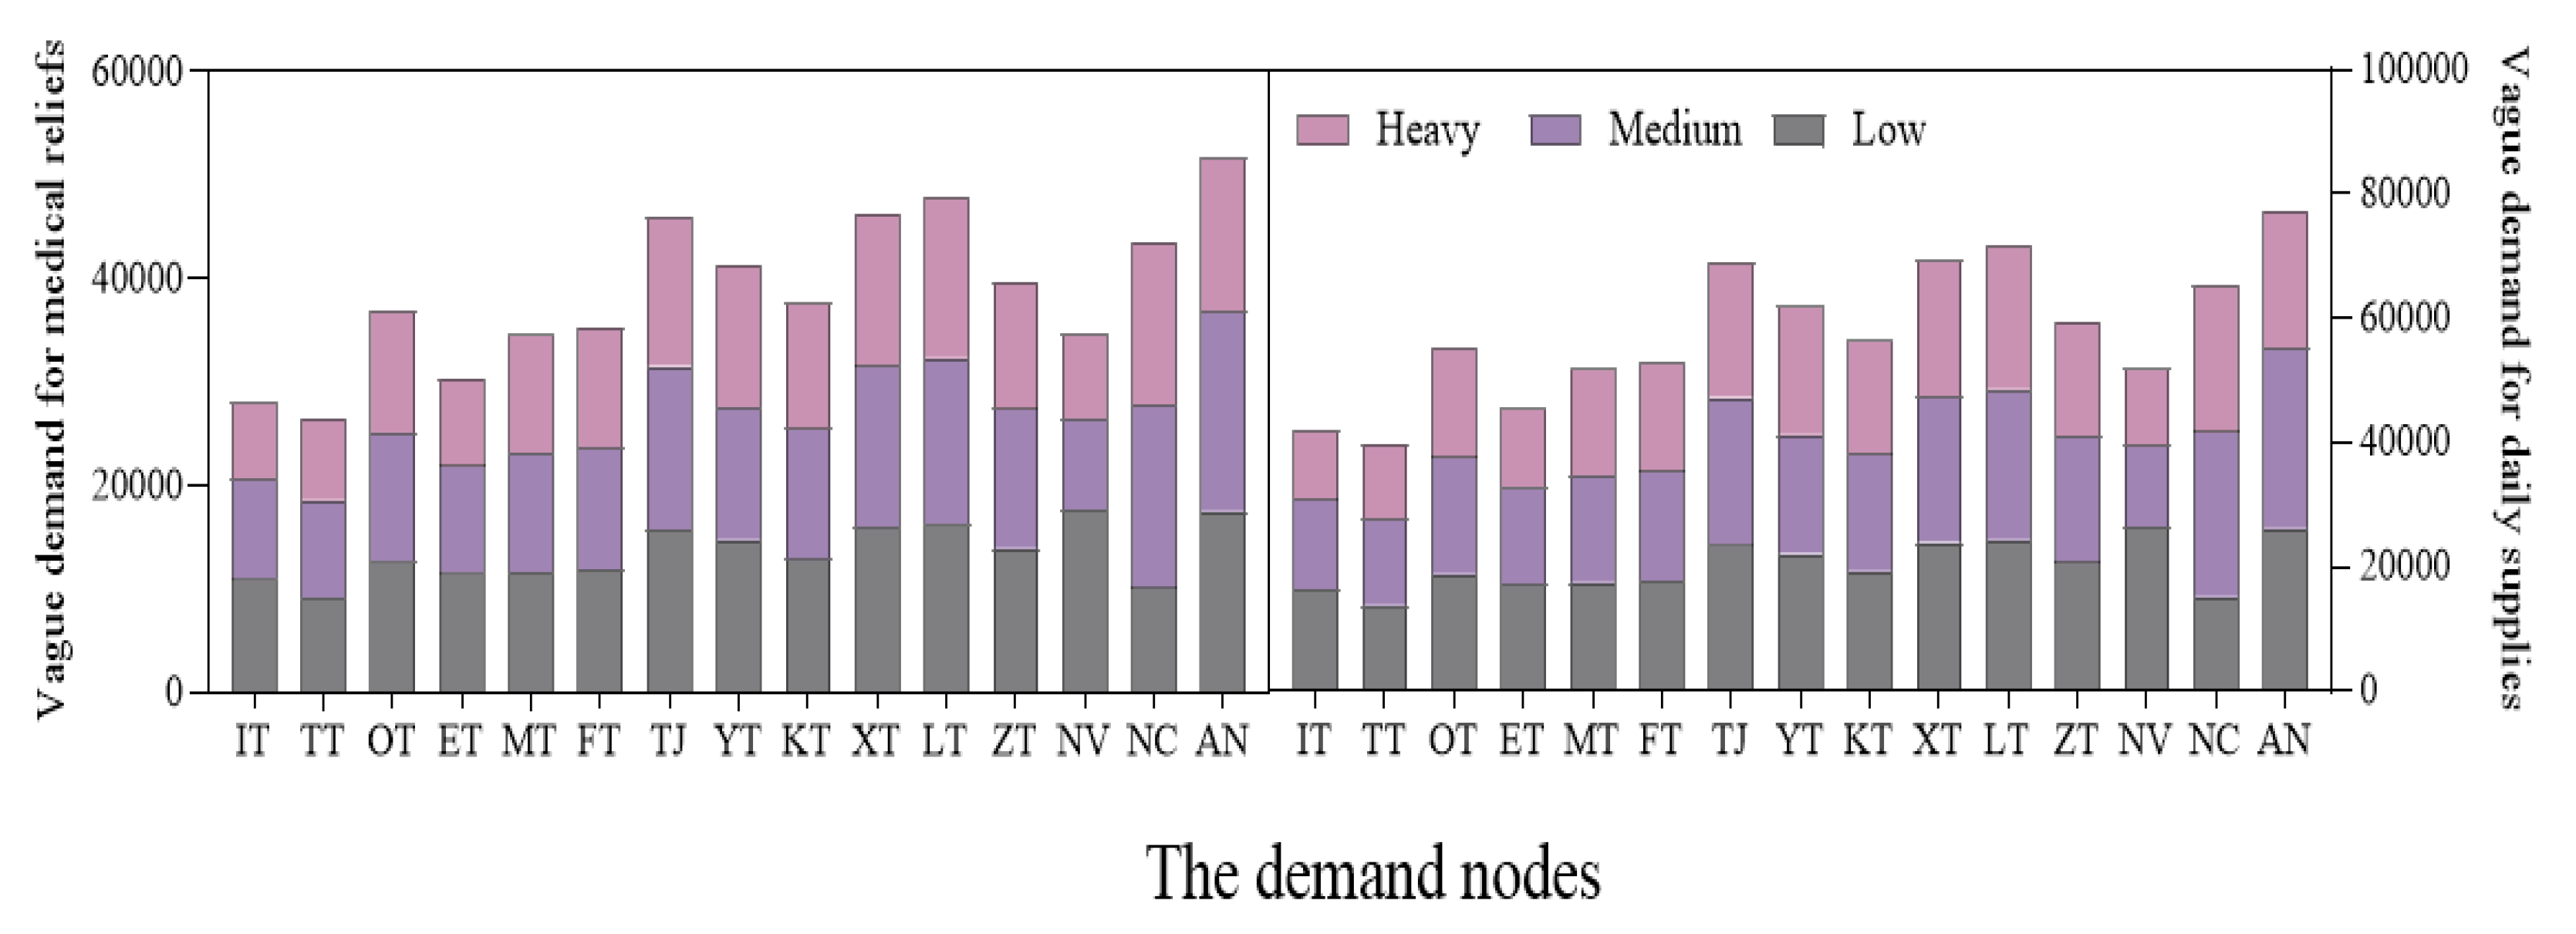
5.2.2. Humanitarian Scheme Impacted by the Flood Disaster

The second step is to explore humanitarian schemes affected by flood information. Figure 9 presents that when W1 = 0.70, the sum of the probability of death in the flood disaster is generally larger than the remaining scenarios. It depicts that the worse the disaster, the greater threat to people’s lives. Regarding scenario W1 = 0.70, the minimum mortality is located in the third period of the light disaster, the second period of the medium and heavy flood.
Figure 10 shows that when W1 = 0.10, W2 = 0.50 and W3 = 0.40, the unmet rate in the low and medium flood is bigger. Expecting that W1 = 0.70 in the heavy flood scenario, the objective trend with the constraint of W1 = 0.10 and W1 = 0.40 is more similar. The cause lies in the fact that, the unfulfilled rate is influenced by the damaged network, decision preference, and relief supplies in each cycle. As seen in Figure 11, increasing the time preference (W3) rises the objective. Although the variability of change for emergency distribution time in the low flood is greater, a similar tendency of it in the medium and heavy flood scenario can be found. The reason is that emergency distribution time in the periods under the low scenario is impacted by time preference, the length and accessibility of the network.
According to the model’s results with multiple periods in the same flood scenario, when the preference coefficient of morality is 0.4, the value of it is smaller than the result with the constraint of W1 = 0.70, and larger than the rate of death when W1 = 0.10. Compared to the preference of W1 = 0.70 and W1 = 0.10, the unmet rate and emergency distribution time under the condition that W1 = 0.40 is the smallest, and its curve is more similar to the structure of the result with the constraints of W1 = 0.70. It’s not only relevant to the deciders’ preference, but also indirectly related to the severity of the disaster, the rescue tools, and road network. The objective of the model with the constraint of W1 = 0.40 is relatively greater than that in the preferences of W1 = 0.70 and W1 = 0.10. To further explore the optimal strategy of the multi-objective collaborative model with the condition of W1 = 0.40, W2 = 0.30 and W3 = 0.30, we start to analyze the rescue performance in the flood scenario φ .
As can be seen from Figure 12, there is a noticeable difference in the survival probability under the updated flood scenarios, whereas the survival probability of nodes rescued by the crews in the first period is indicated in Figure 13. The more severe the flood disaster, the higher the mortality rate of the affected nodes. The finding is not only easy to understand, but also fits with a realistic scenario. Affected by the rain island effect, the frequency of heavy rain increases in the concentrated areas [45], where the wetland area and surface water infiltration as well as stormwater absorption capacity may be reduced. It is thus important to make more efficient flood control, such as constructing flood control facilities and technologies in accordance with the principles of adapting differentiated behaviors to a local location. Besides, since emergency demand is impacted by the number of victims in different scenarios, the next step is to analyze the node’s demand with multiple periods under the flood scenario φ . As shown in Figure 14, vague demand for medical and daily reliefs in the first period varies across the demand nodes.
On the basis of the information about the changed flood, traffic network, supplies of reliefs (shown in Table 4) and emergency tools and demand, humanitarian allocation scheme with multi-period in the updated flood scenarios can be illustrated in Table 5. Humanitarian equity for allocating medical supplies in the fourth period under the medium and heavy flood is about 100%, which has the same as the value of daily and medical supplies within the first and third period in the heavy scenarios. It represents that the severity of the flood and the fairness of resources is not a simple cause-and-effect relationship. In other words, emergency equity is impacted by the combined effect of variables (e.g., the supplies, the flood scenarios and road network, etc.) in models. Comparing the results in the low flood disaster, the time in the second period is the lowest, while the maximum time is located in the fifth period under the medium scenario. It enables the determination of an equilibrium strategy for multi-commodity, and a timely plan within various periods. And attention could be paid to the time evolution characteristics and variation laws, the alternative concepts and technologies on flood disasters.

6. Conclusions and Future Work

As the suddenness and destruction of the flood disasters, the limited capacity of the organization, the possibilitic and adaptive scheme is crucial to humanitarian response. Emergency evacuation and resource allocation are formulated by a multi-stage stochastic programming problem. From the view of systematic optimization, the work considers the abruptness of flood disasters, the vulnerability of roads, and the uncertainty and urgency of emergency demand, a multi-objective collaborative model with dynamic flood scenarios and multiple periods is constructed. It not only implies the interval number, the triangle fuzzy number and Bayes’s theorem, but also involves the quantity and capacity limitation of tools, the constraints of network accessibility and service continuity.
Based on the fuzzy number clarification method and model solution, multiple objectives of the model, such as the survival probability, timeliness, and fairness of humanitarian rescue, have been resolved and balanced throughout computational results. Humanitarian equity for allocating medical supplies in the fourth period under the medium and heavy flood is about 100%, which has the same as the value of daily medical supplies within the first and third period in the heavy scenarios. But the severity of the flood and the fairness of resources is not a simple cause-and-effect relationship. Moreover, our study reveals that the p t φ  parameter, and the decision preference usually affects the model’s performance of the model. Although the shortage of humanitarian service time is helped to improve the survival rate of victims, it is pointed out that time is not the only factor to be considered. The reason is that the single consideration of sub-objectives is one-sided. The “degree” of humanitarian choice, which shall be grasped, plays a mutually reinforcing role. It provides a reference for planners to prioritize the high-risk nodes and improve emergency-response capacity of flood-stricken areas.
The next step is to quantify the risk of flood disaster, explore the emergency location and reservation problems in the first stage, and further analyze humanitarian service for the victims and supplies in the next stage. Secondly, in an effect to build a network model with dynamic changes for hurricanes, earthquakes, snow disasters and other emergencies. It can explore the economic measurement of the psychological trauma or shadow of victims by the rescue performance. And a more comprehensive analysis will be conducted to test the objectives in more instances.

Author Contributions

Conceptualization, X.J.; Data curation, X.J. and S.F.; Formal analysis, X.J.; Investigation, X.J. and S.F.; Methodology, X.J.; Software, X.J.; Resources, S.F.; Supervision, S.F.; Validation, X.J.; Funding acquisition, S.F.; Project administration, S.F.; Visualization, S.F.; Writing-original draft, X.J. and S.F.; Writing-review and editing, X.J. and S.F. All authors have read and agreed to the published version of the manuscript.

Funding

This study was supported by the Social Science Foundation of Beijing (21JCB091).

Institutional Review Board Statement

Not applicable.

Informed Consent Statement

Not applicable.

Data Availability Statement

The data that support the findings of this study is available upon request to the corresponding author.

Conflicts of Interest

The author declares that there is no conflict of interest regarding the publication of this paper.

References

  1. EM-DAT. The International Disaster Database. Available online: http://www.emdat (accessed on 11 July 2021).
  2. Annis, A.; Nardi, F.; Petroselli, A.; Apollonio, C.; Arcangeletti, E.; Tauro, F.; Belli, C.; Bianconi, R.; Grimaldi, S. UAV-DEM for small-scale flood hazard mapping. Water 2020, 12, 1717. [Google Scholar] [CrossRef]
  3. Liu, Z.; Yang, Z.; Chen, M.; Xu, H.; Yang, Y.; Zhang, J.; Wu, Q.; Wang, M.; Song, Z.; Ding, F. Research hotspots and frontiers of mountain flood disaster: Bibliometric and visual analysis. Water 2023, 15, 673. [Google Scholar] [CrossRef]
  4. Syed Muzamil, S.A.H.B.; Zainun, N.Y.; Ajman, N.N.; Sulaiman, N.; Khahro, S.H.; Rohani, M.M.; Mohd, S.M.B.; Ahmad, A. Proposal framework for the flood disaster management cycle in Malaysia. Sustainability 2022, 14, 4088. [Google Scholar] [CrossRef]
  5. Esposito, A.; Amideo, A.; Scaparra, M.P.; Kotiadis, K. Optimising shelter location and evacuation routing operations: The critical issues. Eur. J. Oper. Res. 2019, 279, 279–295. [Google Scholar] [CrossRef]
  6. Ukkusuri, S.V.; Hasan, S.; Luong, B.; Doan, K.; Zhan, X.; Murray-Tuite, P.; Yin, W. A-RESCUE: An agent based regional evacuation simulator coupled with user enriched behavior. Netw. Spat. Econ. 2017, 17, 197–223. [Google Scholar] [CrossRef]
  7. Bayram, V. Optimization models for large scale network evacuation planning and management: A literature review. Surv. Oper. Res. Manag. 2016, 21, 63–84. [Google Scholar] [CrossRef]
  8. Tofighi, S.; Torabi, S.A.; Mansouri, S.A. Humanitarian logistics network design under mixed uncertainty. Eur. J. Oper. Res. 2016, 250, 239–250. [Google Scholar] [CrossRef] [Green Version]
  9. Shahparvari, S.; Abbasi, B.; Chhetri, P. Possibilistic scheduling routing for short-notice bushfire emergency evacuation under uncertainties: An Australian case study. Omega 2017, 72, 96–117. [Google Scholar] [CrossRef]
  10. Elçi, Ö.; Noyan, N. A chance-constrained two-stage stochastic programming model for humanitarian relief network design. Transp. Res. Part B. 2018, 108, 55–83. [Google Scholar] [CrossRef]
  11. Sharkey, T.C.; Cavdaroglu, B.; Nguyen, H.; Holman, J.; Mitchell, J.E.; Wallace, W.A. Interdependent network restoration: On the value of information-sharing. Eur. J. Oper. Res. 2015, 244, 309–321. [Google Scholar] [CrossRef]
  12. Iloglu, S.; Albert, L.A. An integrated network design and scheduling problem for network recovery and emergency response. Oper. Res. Perspect. 2018, 5, 218–231. [Google Scholar] [CrossRef]
  13. Zhang, B.; Li, H.; Li, S.; Peng, J. Sustainable multi-depot emergency facilities location-routing problem with uncertain information. Appl. Math. Comput. 2018, 333, 506–520. [Google Scholar] [CrossRef]
  14. Vahdani, B.; Veysmoradi, D.; Noori, F.; Mansour, F. Two-stage multi-objective location-routing inventory model for humanitarian logistics network design under uncertainty. Int. J. Disaster Risk Reduct. 2018, 27, 290–306. [Google Scholar] [CrossRef]
  15. Yáñez-Sandivari, L.; Cortés, C.E.; Rey, P.A. Humanitarian logistics and emergencies management: New perspectives to a sociotechnical problem and its optimization approach management. Int. J. Disaster Risk Reduct. 2021, 52, 101952. [Google Scholar] [CrossRef]
  16. Ertem, M.A.; Akdogan, M.A.; Kahya, M. Intermodal transportation in humanitarian logistics with an application to a Turkish network using retrospective analysis. Int. J. Disast. Risk Reduct. 2022, 72, 102828. [Google Scholar] [CrossRef]
  17. Shao, J.; Wang, X.; Liang, C.; Holguín-Veras, J. Research progress on deprivation costs in humanitarian logistics. Int. J. Disaster Risk Reduct. 2020, 42, 101343. [Google Scholar] [CrossRef]
  18. Liebig, T.; Piatkowski, N.; Bockermann, C.; Morik, K. Dynamic route planning with real-time traffic predictions. Inform. Syst. 2017, 64, 258–265. [Google Scholar] [CrossRef]
  19. Rodríguez-Espíndola, O.; Gaytán, J. Scenario-based preparedness plan for floods. Nat. Hazards 2015, 76, 1241–1262. [Google Scholar] [CrossRef]
  20. Akbari, V.; Salman, F.S. Multi-vehicle synchronized arc routing problem to restore post-disaster network connectivity. Eur. J. Oper. Res. 2017, 257, 625–640. [Google Scholar] [CrossRef]
  21. Li, S.; Ma, Z.; Teo, K.L. A new model for road network repair after natural disasters: Integrating logistics support scheduling with repair crew scheduling and routing activities. Comput. Ind. Eng. 2020, 145, 106–506. [Google Scholar] [CrossRef]
  22. Alem, D.; Clark, A.; Moreno, A. Stochastic network models for logistics planning in disaster relief. Eur. J. Oper. Res. 2016, 255, 187–206. [Google Scholar] [CrossRef]
  23. Renkli, Ç.; Duran, S. Pre-Positioning Disaster Response Facilities and Relief Items. Hum. Ecol. Risk. Assess. 2015, 21, 1169–1185. [Google Scholar] [CrossRef]
  24. Xu, G.; Wang, J.; Huang, G.Q.; Chen, C. Data-driven resilient fleet management for cloud asset-enabled urban flood control. IEEE T. Intell. Transp. Syst. 2018, 19, 1827–1838. [Google Scholar] [CrossRef]
  25. Rennemo, S.J.; Rø, K.F.; Hvattum, L.M.; Tirado, G. A three-stage stochastic facility routing model for disaster response planning. Transp. Res. Part E. 2014, 62, 116–135. [Google Scholar] [CrossRef] [Green Version]
  26. Moreno, A.; Alem, D.; Gendreau, M.; Munari, P. The heterogeneous multi-crew scheduling and routing problem in road restoration. Transp. Res. Part B. 2020, 141, 24–58. [Google Scholar] [CrossRef]
  27. Duque, P.A.M.; Dolinskaya, I.S.; Sörensen, K. Network repair crew scheduling and routing for emergency relief distribution problem. Eur. J. Oper. Res. 2016, 248, 272–285. [Google Scholar] [CrossRef]
  28. Fiedrich, F.; Gehbauer, F.; Rickers, U. Optimized resource allocation for emergency response after earthquake disaster. Saf. Sci. 2000, 35, 41–57. [Google Scholar] [CrossRef]
  29. Ajam, M.; Akbari, V.; Salman, F.S. Minimizing latency in post-disaster road clearance operations. Eur. J. Oper. Res. 2019, 277, 1098–1126. [Google Scholar] [CrossRef]
  30. Ahmadi, M.; Seifi, A.; Tootooni, B. A humanitarian logistics model for disaster relief operation considering network failure and standard relief time: A case study on San Francisco district. Transp. Res. Part E. 2015, 75, 145–163. [Google Scholar] [CrossRef]
  31. Rajakaruna, S.; Wijeratne, A.W.; Mann, T.S.; Yan, C. Identifying key skill sets in humanitarian logistics: Developing a model for Sri Lanka. Int. J. Disast. Risk Reduct. 2017, 24, 58–65. [Google Scholar] [CrossRef]
  32. Huang, K.; Jiang, Y.; Yuan, Y.; Zhao, L. Modeling multiple humanitarian objectives in emergency response to large-scale disasters. Transp. Res. Part E 2015, 75, 1–17. [Google Scholar] [CrossRef]
  33. Peng, M.; Peng, Y.; Chen, H. Post-seismic supply chain risk management: A system dynamics disruption analysis approach for inventory and logistics planning. Comput. Oper. Res. 2014, 42, 14–24. [Google Scholar] [CrossRef]
  34. Baskaya, S.; Ertem, M.A.; Duran, S. Pre-positioning of relief items in humanitarian logistics considering lateral transhipment opportunities. Socioecon. Plann. Sci. 2017, 57, 50–60. [Google Scholar] [CrossRef]
  35. Qiu, B.J.; Zhang, J.H.; Qi, Y.T.; Liu, Y. Grey-theory-based optimization model of emergency logistics considering time uncertainty. PLoS ONE 2015, 10, e0139132. [Google Scholar] [CrossRef] [PubMed]
  36. Akbari, V.; Sadati, M.E.H.; Kian, R. A decomposition-based heuristic for a multicrew coordinated road restoration problem. Transp. Res. Part D. 2021, 95, 102854. [Google Scholar] [CrossRef]
  37. Chanta, S.; Mayorga, M.E.; McLay, L.A. Improving emergency service in rural areas: A bi-objective covering location model for EMS systems. Ann. Oper. Res. 2014, 221, 133–159. [Google Scholar] [CrossRef]
  38. Belfiore, P.C.; Yoshida Yoshizaki, H.T. Scatter search for a real-life heterogeneous fleet vehicle routing problem with time windows and split deliveries in Brazil. Eur. J. Oper. Res. 2009, 199, 750–758. [Google Scholar] [CrossRef]
  39. Moreno, A.; Munari, P.; Alem, D. A branch-and-Benders-cut algorithm for the Crew Scheduling and Routing Problem in road restoration. Eur. J. Oper. Res. 2019, 275, 16–34. [Google Scholar] [CrossRef]
  40. Zhao, X.; Li, H.; Qi, Y. Are Chinese cities prepared to manage the risks of extreme weather events? Evidence from the 07, 20. Zhengzhou Flood in Henan Province. SSRN Electron. J. 2021, 4, 3303. [Google Scholar]
  41. Wu, Z.; Shen, Y. Assessing urban areas’ vulnerability to flood disaster based on text data: A case study in Zhengzhou City. Sustainability 2019, 11, 4548. [Google Scholar] [CrossRef] [Green Version]
  42. Yao, S.; Du, W.; Chen, N.; Wang, C.; Chen, Z. An integrated process-based framework for flood phase segmentation and assessment. Int. J. Geogr. Inf. Sci. 2023, 37, 1315–1337. [Google Scholar] [CrossRef]
  43. Available online: https://www.henan.gov.cn (accessed on 24 August 2022).
  44. Duan, Y.; Gao, Y.G.; Zhang, Y.; Li, H.; Li, Z.; Zhou, Z.; Tian, G.; Lei, Y. “The 20 July 2021 major flood event” in greater Zhengzhou, China: A case study of flooding severity and landscape characteristics. Land 2022, 11, 1921. [Google Scholar] [CrossRef]
  45. Wang, J.; Hu, C.; Ma, B.; Mu, X. Rapid urbanization impact on the hydrological processes in Zhengzhou, China. Water 2020, 12, 1870. [Google Scholar] [CrossRef]
Figure 1. The specific ideas and processes of methodology.
Water 15 02122 g001
Figure 2. Illustration of the study site.
Water 15 02122 g002
Figure 3. The population of nodes and the maximum capacity of the resettlement node.
Water 15 02122 g003
Figure 4. The distance among flood-stricken areas.
Water 15 02122 g004
Figure 5. The damaged level of the road in flood scenarios (low, medium, heavy).
Water 15 02122 g005
Figure 6. The requirement of each node for emergency rescue and repair time.
Water 15 02122 g006
Figure 7. Trends in the total mortality and unfulfilled rate in the first, second and fifth periods under various scenarios.
Water 15 02122 g007
Figure 8. Emergency distribution time in various periods under different preferences.
Water 15 02122 g008
Figure 9. The probability of death per period with different decision preferences under various flood scenarios.
Water 15 02122 g009
Figure 10. The total unfulfilled rate for reliefs among periods in various flood scenarios.
Water 15 02122 g010
Figure 11. The total emergency distribution time in periods under various flood scenarios.
Water 15 02122 g011
Figure 12. The survival probability of various nodes in periods under the updated flood scenarios.
Water 15 02122 g012
Figure 13. The survival probability of nodes rescued by emergency crews in the first period.
Water 15 02122 g013
Figure 14. Vague demand of the demand nodes for medical and daily reliefs in the first period.
Water 15 02122 g014
Table 1. Relevant parameters are presented in this model.
Sets and IndicesDefinitions
j A j A set of the rescue nodes of work teams;
e B e A set of the trapped sites in the disaster;
i D i A set of demand nodes;
l D l A set of reliefs centers;
D t The observed time variables;
l , i = c li A   , j , e = c je A The interrupted or damaged road;
c C Categories of reliefs;
v L Sets of emergency service vehicles;
φ δ The possible set of flood scenarios;
Parameters
HThe fixed time between two adjacent observation moments;
d li The distance from the node l to node i ;
εThe critical value of the waterlogged road which meets the traffic condition, 0 < ε < 1;
γThe threshold value of whether the road network is passable, δ < γ < 1;
δ The critical value of the waterlogged road, which is restorative, ε < δ < 1;
η 1 The corrected parameter of deterioration coefficient;
η 2 The correction factor of repairability;
, τ , ϑ Coefficients affected by the connectivity of road network;
S j t j e The survival probability of the trapped node e that was impacted by emergency rescue node j;
t Results of the observed information at time t;
p φ The prior probability of flood disaster;
p t φ The probability of the flood scenario φ , which can be understood as the posterior probability of disaster by using the Bayesian theorem;
p t | φ The occurred probability of observable information under the flood scenario φ at time t;
a k e The waterlogged degree of road c j e   where emergency team k that dispatched from the rescue point j to node e;
d c The fuzzy demand for reliefs c per capita, dc =   q c a , q c b , q c c ;
f k The fuzzy capacity of emergency crew k, f k = f k a , f k b , f k c ;
N t e Number of victims in the trapped node e at time t;
N t i The actual number of people in node i at time t;
N t w The upper limit that node w can accommodate victims at time t;
R l i c Quantity of relief supplies c distributed by emergency distribution center l to node i, R lic = ( r lic , r lic + ). The upper and lower limits of the interval numbers are denoted by r lic   and   r lic + , respectively;
Q v The loaded capacity of each type v of emergency service vehicle;
M l v Number of the type v   of vehicles that dispatched by emergency distribution center l;
RlThe capacity of emergency distribution center l ( l D l ) for dealing with reliefs. R l = ( r l , r l + ), r l   and   r l +  parameters explain the upper and lower limits of the interval numbers;
MjNumber of emergency rescue teams deployed from the node j;
a l i The waterlogged degree of c l i between node l and node i ;
t j k e Rescuing time of emergency rescue team k from node j to the node e;
t l i v c Traveling time of the type v   of vehicle τ to transport reliefs c from node l and node i ;
t k e The actual time of emergency rescue team k that aims to rescue the node e;
t li The restorative time from node l and node i ;
t je The rehabilitation time of road network from node j and node e;
t e The time point when the survival probability of victims in the node e is 0.5;
v li c v The average speed of the type v   of vehicle τ , which contributes to transporting the supplies c from node l to node i;
O i c τ v The remained quality of reliefs supplies c after arriving the node i by the type v   of vehicle τ ;
x k e x k e = 1, if emergency work team k   is responsible for the trapped node e ; 0, otherwise;
x k e g x k e g = 1, if emergency crew k completes humanitarian work for the trapped node e, and still moves to the next node g; 0, otherwise;
y j e y j e = 1, if the trapped node e is processed by emergency rescue crew, which is assigned by the node j; 0 otherwise;
x livc x livc = 1, if a node i D i   is visited by the type v   of vehicle τ that loading reliefs c, which is assigned by reliefs center l; 0, otherwise;
Table 2. Parameters settings for p | φ .
Rainfall (mm)Scenarios
MildModerateSevere
3000.480.220.3
4200.280.40.32
4500.30.250.45
5000.360.20.44
Table 3. Relevant parameters of the model.
ParametersValueParametersValue
r0.85 t YT (10.48, 12.05, 14.93)
μ0.85 t KT (7.13, 7.96, 9.46)
ϑ 2.16 t XT (7.46, 9.34, 11.86)
τ1.50 t LT (7.58, 9.35, 11.94)
1.22 t ZT (8.27, 10.14, 12.03)
η 2 0.56 t NS (20.00, 19.95, 20.08)
H3600 (s) t IT (7.95, 11.09, 13.45)
ε 0.40 t TT (9.31, 13.27, 15.61)
δ 0.60 t OT (9.63, 14.79, 16.23)
γ 0.85 t ET (8.69, 9.86, 14.17)
η 1 0.45 t MT (10.32, 12.84, 14.32)
M DL v (3, 13) t AN (14.72, 13.46, 13.58)
M DG v (4, 12) t NV (17.35, 14.68, 13.37)
Q 1 45 (tons) p φ (0.6, 0.3, 0.1)
Q 2 9 (tons) t FT (11.56, 13.26, 15.97)
M SD v (2, 12) t TJ (9.93, 12.78, 15.35)
v lic 2 50 (km/h) v lic 1 60 (km/h)
Table 4. The maximum number of reliefs transported by the emergency distribution center in each period.
ScenariosPeriodEmergency Distribution Center
DLSDDG
Medical ReliefsLiving ReliefsMedical ReliefsLiving ReliefsMedical ReliefsLiving Reliefs
Light1[19.00, 22.00][400.00, 465.00][17.00, 22.50][390.00, 430.00][21.00, 25.00][430.00, 480.00]
2[16.00, 19.00][350.40, 441.75][21.00, 25.00][351.00, 412.80][15.00, 19.00][374.10, 509.00]
3[18.00, 21.00][326.00, 419.66][16.00, 21.50][312.39, 365.00][14.00, 18.00][325.47, 520.00]
4[19.50, 25.80][285.58, 354.00][23.50, 28.00][306.14, 350.40][19.00, 23.00][510.41, 685.00]
5[20.00, 26.00][367.71, 450.00][19.00, 23.00][450.00, 600.00][18.00, 21.50][444.06, 516.00]
Medium1[16.53, 21.34][318.40, 353.40][16.32, 21.60][374.40, 412.80][20.16, 24.00][412.80, 460.80]
2[22.19, 24.64][278.92, 335.73][19.00, 23.00][336.96, 396.29][14.40, 18.24][359.14, 450.00]
3[15.66, 20.37][312.96, 410.00][15.36, 20.64][299.89, 400.00][20.00, 26.00][312.45, 524.00]
4[22.37, 25.03][274.15, 300.00][20.56, 24.88][293.90, 336.38][18.24, 22.08][489.99, 657.60]
5[17.40, 18.20][353.00, 427.00][18.24, 22.08][432.00, 576.00][17.28, 20.64][426.29, 495.36]
Heavy1[13.89, 17.93][329.00, 437.00][13.71, 18.14][356.00, 437.00][20.16, 26.00][387.00, 465.00]
2[18.64, 20.70][259.30, 360.00][15.96, 19.32][283.05, 398.00][15.50, 20.80][301.67, 378.00]
3[21.00, 27.00][260.00, 400.00][21.00, 24.70][251.91, 436.00][18.80, 20.00][420.00, 580.00]
4[20.79, 23.22][285.00, 370.00][17.27, 21.90][246.87, 320.00][20.00, 21.55][411.59, 552.38]
5[14.62, 19.90][272.10, 419.00][15.32, 22.55][483.00, 540.00][14.52, 19.55][358.09, 510.00]
Table 5. Humanitarian allocation scheme with multi-period in various scenarios (W1 = 0.40, W2 = 0.30, W3 = 0.30).
Emergency Timeliness and Equity PeriodsScenarios
LowMediumHeavy
Equity for allocating medical reliefT = 10.940.950.97
T = 20.870.940.96
T = 30.810.941.00
T = 40.991.001.00
T = 50.950.880.93
Equity for allocating daily suppliesT = 10.860.831.00
T = 20.900.840.86
T = 30.870.900.97
T = 40.880.880.94
T = 50.990.991.00
Emergency timeliness of medical reliefT = 1191.27227.87238.27
T = 2164.71227.87238.27
T = 3164.71227.87238.27
T = 4249.59227.87238.27
T = 5191.27183.95238.27
Emergency timeliness of daily suppliesT = 1242.35247.86324.25
T = 2238.83250.43273.32
T = 3201.44267.80327.76
T = 4215.01249.70291.03
T = 5273.60440.60431.10
Disclaimer/Publisher’s Note: The statements, opinions and data contained in all publications are solely those of the individual author(s) and contributor(s) and not of MDPI and/or the editor(s). MDPI and/or the editor(s) disclaim responsibility for any injury to people or property resulting from any ideas, methods, instructions or products referred to in the content.

