Abstract
The proficient supply of water and nutrients is a key factor for successful vegetable production under greenhouses. This field experiment was conducted during 2018–2019 under a completely randomized design to evaluate the effects of drip irrigation and nutrient schedule on soil water dynamics and the productivity of greenhouse tomato. The experiment consisted of two irrigation schedules, i.e., I1 (irrigation applied from week 1 to 2 on the basis of 100% pan evaporation (Epan), week 3 to 8 on the basis of 40% of Epan, week 9 to 14 on the basis of 60% of Epan, week 15 to 20 on the basis of 80% of Epan, week 21 to 24 on the basis of 100% of Epan) and I2 (irrigation applied on the basis of 100% of Epan throughout the crop period) with a five-nutrient schedule, viz., F1 (100% NPK applied through the conventional method), F2 (100% N applied through fertigation + PK through the conventional method), F3 (100% NK applied through fertigation + P through the conventional method), F4 (100% NPK applied through fertigation) and F5 (50% NPK applied through the conventional method + 150% NPK applied through fertigation). The soil moisture content (SMC) and its depletion were measured during growing season. The tomato yield was significantly higher under I2. However, water use efficiency (WUE) was significantly higher under I1 treatment. Among the nutrient schedules, the yield and WUE were significantly higher in F5 treatment. The net returns were highest under F5 and lowest under F1. The Benefit:Cost ratio was highest in F4 and lowest under F1. The irrigation level I2 (irrigation applied on the basis of 100% of Epan throughout the crop period) with fertigation treatment F4 (100% NPK applied through fertigation) was the best strategy for obtaining the maximum productivity of tomato under the greenhouse. It can be concluded that the drip-based fertigation enhances the crop yield and net returns and therefore may be promoted to increase the income of the farmers.
1. Introduction
Since tomato (Lycopersicum esculentum) is a high-value cash crop, it is being cultivated under a protected environment in Northwest India [1]. It is one of the low-calorie vegetables and is an excellent source of antioxidants, dietary fiber, minerals and vitamins, and hence serves as an economical source to meet daily nutritional requirements [2]. In India, it is cultivated in all agroclimatic zones over an area of 796.87 thousand ha with an annual production of 20.71 million tonnes (mt) [3]. It is a major off-season vegetable crop of the mid and low hills of Himachal Pradesh (HP), grown over an area of about 13.1 thousand ha with 5.39 mt production per annum. The proper management of water and nutrient supply is essential for the effective growth of vegetables, including tomato, in HP. The excessive use of water and chemical fertilizers have caused environmental problems [4,5] including contamination of the groundwater and releasing nitrous oxide into the atmosphere [6]. Therefore, the proper management of water and fertilizer inputs is an important aspect of vegetable production under protected environments.
Drip irrigation saves the irrigation water as it applies a proper amount of water at the appropriate time [7]. The precise application of water with drip irrigation saves water as well as providing a favorable environment to crops by reducing the humidity that builds up in greenhouses, resulting in better crop yield and quality [8]. Fertigation supplies fertilizer to crops directly in the root zone at the appropriate time and concentration [9,10]. It maintains the optimal nutrient levels and water supply which leads to higher yield and fertilizer use efficiency. It also helps in saving labor, optimizes soil–air–water relations thereby enhancing productivity [11]. The fertilizer requirement of crops is reduced up to 15–25 percent with the fertigation technique without reducing the yield of crop [12]. Drip-based fertigation provides a scope of varied applications of nutrients at different crop growth stages [13]. Moreover, the nutrients’ application through fertigation with frequent intervals leads to constant nutrient availability [14,15].
The tomato is a sensitive crop and is severely affected by changes in climatic conditions. Temperature variation (i.e., an increase in the optimal temperature) causes pollen abortion and sometimes a complete failure of fruit sets occurs [16]. Therefore, it is important to maintain favorable environment conditions to have better crop growth [17]. Keeping this in view, tomatoes are cultivated under greenhouses. Greenhouse cultivation is not only highly productive but also helps to conserve water and soil [18]. It provides greater scope in vegetable production due to higher yield and better quality with efficient use of resources. Greenhouse cultivation pays well for small and marginal farmers because it helps them to produce a higher number of crops in one year and particularly during the off-season, which helps to increase their income. With an increasing population, the consumption of vegetables has increased and the demand for vegetables will be 225 mt by 2020, which will further increase to 350 mt by 2030. Greenhouse cultivation has gained significant importance for growing quality off-season vegetables [19].
The indeterminate cultivars of the tomato tend to grow vertically, thus covering the vertical space in the greenhouse and the vegetative and reproductive stages of these cultivars overlap due to their growth habit. Therefore, the crop requires nutrients at regular intervals for better fruit size and vegetative growth of the plant. Hence, the application of fertilizers through drip irrigation may prove to be an effective technique for the cultivation of tomato in greenhouses [20]. Since tomato crop is a heavy feeder of nutrients, having higher nutrient requirements and also with better root proliferation under a greenhouse, the plants are likely to behave differently under different soil moisture regimes and fertigation levels. Keeping this in view, it is necessary to evaluate the optimum dose of water along with the nutrients for better crop growth particularly in Himalayan conditions. Therefore, the present study evaluates the effects of various levels of drip irrigation and fertigation on water-use efficiency and the yield of tomato, and recommends a suitable strategy for water and nutrient management through drip irrigation and fertigation under a greenhouse.
2. Materials and Methods
2.1. Experimental Site
The study was conducted at the research farm of Chaudhary Sarwan Kumar Himachal Pradesh Agricultural University, Palampur, in a naturally ventilated greenhouse with tomato as a test crop during 2018–2019. The study site was located at 32°6′ N latitude and 76°3′ E longitude at an elevation of 1290 m above mean sea level. The climate of the study area was sub-humid with maximum and minimum temperatures of 36 °C and 2 °C, experienced in June and January, respectively. The average annual rainfall was about 2500 mm and relative humidity varied from 46 to 84%. The soils in general were deep, having average soil depths of about 120–150 cm. The basic soil properties of the study site are shown in Table 1.

Table 1.
Basic Soil Properties of study site.
2.2. Experimental Design
The experiment plots (raised strips with dimensions of 3.0 m × 0.5 m) were arranged in a completely randomized design, with two irrigation levels and five fertigation schedules replicated thrice. The two irrigation levels, i.e., I1 (Irrigation applied from week 1 to 2 on the basis of 100% Epan, week 3 to 8 on the basis 40% of Epan, week 9 to 14 on the basis of 60% of Epan, week 15 to 20 on the basis of 80% of Epan, week 21 to 24 on the basis of 100% of Epan) and I2 (Irrigation applied on the basis of 100% of Epan during the entire crop period) with five nutrient schedules, viz., F1 (100% NPK applied through the conventional method), F2 (100% N applied through fertigation + PK applied through the conventional method), F3 (100% NK applied through fertigation + P applied through the conventional method), F4 (100% NPK applied through fertigation) and F5 (50% NPK applied through the conventional method + 150% NPK applied through fertigation). In total, eight plants were grown per plot at a spacing of 30 cm. The tomato hybrid (Palam Tomato Hybrid-1) was transplanted on 20 April 2018, and harvested during the last week of August 2018. The treatment details of the experiment are given in Table 2.
Table 2.
Details of treatments imposed.
2.3. Irrigation Water and Evaporation
The gravity-fed drip irrigation system was installed and managed to ensure the uniform application of water in a naturally ventilated greenhouse. The sub-main line with 16 m length was installed and connected with 15 laterals at 45 cm distance. The length of each lateral was 3 m having 8 inline drippers at 30 cm spacing. The average flow rate of each dripper was 0.60 L/h and the amount of irrigation water was calculated on the basis of average Epan. The fertilizers were added in the fertigation tank of 30 L capacity and supplied to main line using a venturi injector. The layout of the irrigation system is shown in Figure 1.
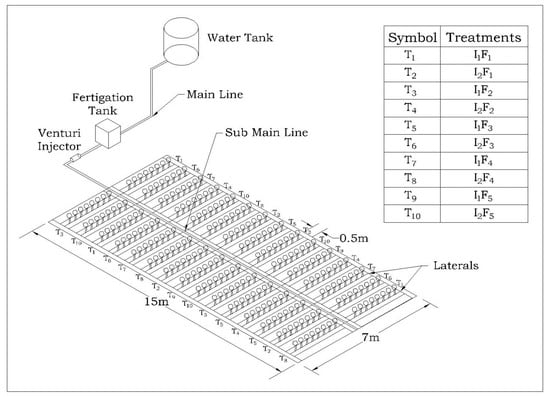
Figure 1.
Layout of field with drip irrigation system.
2.4. Fertilizers Application
The recommended dose of nitrogen, phosphorous and potassium is 150:120:60 kg/ha. In nutrient schedules, the fertilizer doses were calculated as per the treatments and applied via basal and fertigation at different intervals from the second fortnight of transplanting to 15 days prior to final harvest. In the conventional method, half of N and the full dose of P and K were applied as basal and the remaining half of N as top dressing after one month of transplanting; whereas, in nutrient schedules, water-soluble fertilizers including urea, mono-ammonium phosphate and potassium sulphate were applied through the drip fertigation system.
2.5. Soil Moisture Content (SMC) and Soil Water Stock (SWS)
The gravimetric method was used to determine the soil moisture content (SMC) at various depths (0–7.5, 7.5–15 and 15–30 cm). The volumetric moisture content (Ө) was obtained by multiplying the soil moisture content at a particular depth and bulk density of that particular depth. The product of ‘Ө’ and soil depth yielded the soil water stock (SWS) [21].
2.6. Soil Moisture Depletion
The soil profile water depletion (ΔSz) was calculated during tomato crop growth by taking the difference of water stocks during related intervals [22] with the help of the equation given below.
where
ΔSz is the profile water depletion (mm) for 0–7.5, 7.5–15 and 15–30 cm depths, t is the time, dz is the depth (m) and Ө is the volumetric wetness (m3/m3).
2.7. Biological Yield
Five plants were taken from each plot at final harvest time and placed into different paper bags. The fresh weight of plants was measured and thereafter the plants were oven-dried at 65 °C temperature to determine the dry biomass. The tomato fruit was ready for picking after 50 days of transplantation. After every picking, the fruits were weighed to obtain the total fruit yield.
2.8. Total Water Use and Water Use Efficiency
The total quantity of irrigation water applied during the crop growth period was considered as total irrigation water used in crop production. The water use efficiency was obtained by dividing the fruit yield by the total water applied [23].
where WUE is water use efficiency (g/m2/mm), Yf is the fruit yield (g/m2) and TWA is the amount of total water applied (mm).
2.9. Soil Sampling and Analysis
The surface (0–15 cm) and subsurface (15–30 cm) soil samples were collected from each plot before transplanting and at harvest. The samples were air-dried and passed through a 2 mm sieve size. The pH of processed samples was determined by glass electrode using soil suspension in a ratio of 1:2 (soil:water) and the electrical conductivity was determined using an EC meter [24]. The soil texture and aggregate size distribution were determined by the international pipette method [25] and Yoder’s apparatus [26], respectively. The core sampler method was used for determination of the bulk density of soil [27] and the particle density was determined by the Pycnometer method [28]. The water-holding capacity was determined by Keen’s box method [25]. Infiltration rate was determined by using the double-ring infiltrometer method [21]. The wet oxidation method was used for estimating the organic carbon [29]. Available nitrogen was determined by the alkaline permanganate method [30], available phosphorus by using (0.5 M NaHCO3) Olsen’s method [31] and available potassium was determined with neutral 1N ammonium acetate and the extract analyzed by flame photometer [24].
2.10. Economic Analysis
The net returns for different treatments were computed by the total input cost subtracted from the gross returns for that treatment. The benefit–cost (B:C) ratio for different treatments was calculated by dividing the net returns with the cost of cultivation for that treatment.
2.11. Statistical Analysis
A two-way ANOVA was used to analyze the data using SAS 9.1 statistical software. The treatments’ mean effects were compared by Duncan’s multiple range test (p ≤ 0.05).
3. Results
3.1. Soil Water Studies
3.1.1. Soil Moisture Content (SMC) and Soil Water Stock (SWS)
The SMC showed considerable variations under various drip irrigation levels and was also influenced by different nutrients applied through fertigation (Table 3). The SMC determined at 15 DAT was non-significant for the 0–7.5 cm soil depth but was significantly (p ≤ 0.05) higher in I2 (0.33 and 0.39 m3/m3) than I1 (0.31 and 0.36 m3/m3) for 7.5–15 and 15–30 cm soil depths, respectively. Among nutrient schedules, the SMC was non-significant for 0–7.5 cm soil depth. The SMC was significantly higher in F5 (0.33 m3/m3) and F2 (0.33 m3/m3) than F3 (0.31 m3/m3) but was statistically similar with F4 (0.32 m3/m3) and F1 (0.32 m3/m3) for 7.5–15 cm soil depth, and the SMC was significantly higher in F2 (0.40 m3/m3) as compared to F1 (0.37 m3/m3), F4 (0.36 m3/m3) and F5 (0.36 m3/m3) but was statistical similar with F3 (0.38 m3/m3) for 15–30 cm soil depth. The interaction between various irrigation levels and nutrient schedules was non-significant.
Table 3.
Effect of drip irrigation and nutrient schedule on soil moisture content (m3/m3).
The SMC was significantly (p ≤ 0.05) higher in I2 (0.23, 0.27 and 0.32 m3/m3) than I1 (0.19, 0.24 and 0.29 m3/m3) for 0–7.5, 7.5–15 and 15–30 cm soil depths, respectively. Among nutrient schedules, the SMC was non-significant for 0–7.5 and 15–30 cm soil depths and at 7.5–15 cm soil depth, the SMC was significantly higher in F2 (0.27 m3/m3) than F1 (0.24 m3/m3) but was statistically similar with F3 (0.26 m3/m3), F4 (0.26 m3/m3) and F5 (0.25 m3/m3) at 45 DAT. The interaction between various irrigation levels and nutrient schedules was non-significant.
The SMC at 75 DAT was significantly higher in I2 (0.33, 0.38 and 0.44 m3/m3) than I1 (0.30, 0.35 and 0.40 m3/m3) for 0–7.5, 7.5–15 and 15–30 cm soil depths, respectively. Among nutrient schedules, the SMC was non-significant for 0–7.5 cm soil depth. The SMC was significantly higher in F4 (0.39 m3/m3) as compared to F5 (0.36 m3/m3), F1 (0.35 m3/m3) and F3 (0.34 m3/m3) but was statistical similar with F2 (0.38 m3/m3) for the 7.5–15 cm soil depth and the SMC was significantly higher in F2 (0.44 m3/m3) than F4 (0.41 m3/m3), F3 (0.41 m3/m3) and F1 (0.41 m3/m3) but was statistically similar with F5 (0.42 m3/m3) for 15–30 cm soil depth. The interaction between various irrigation levels and nutrient schedules was non-significant at the 0–7.5 cm soil depth but significant for 7.5–15 and 15–30 cm soil depths, which may be due to better root growth promoted by fertigation, and the plants required a lower amount of water at the flowering stage which helps to increase the soil moisture in different layers of soil [32,33].
The SMC was significantly higher in I2 (0.41, 0.46 and 0.54 m3/m3) than I1 (0.38, 0.43 and 0.51 m3/m3) for 0–7.5, 7.5–15 and 15–30 cm soil depths, respectively. Among nutrient schedules, the SMC was significantly higher in F2 (0.41 m3/m3) and F4 (0.41 m3/m3) and F5 (0.40 m3/m3) than F1 (0.37 m3/m3) but was statistically similar with F3 (0.39 m3/m3) for the 0–7.5 cm soil depth and the SMC was significantly higher in F2 (0.47 m3/m3), F3 (0.46 m3/m3) and F5 (0.46 m3/m3) as compared to F4 (0.42 m3/m3) and F1 (0.41 m3/m3) for 7.5–15 cm soil depth. The SMC was significantly higher in F2 (0.54 m3/m3) and F3 (0.54 m3/m3) as compared to F4 (0.50 m3/m3) and F1 (0.51 m3/m3) but was statistically similar with F5 (0.52 m3/m3) for the 15–30 cm soil depth at 105 DAT. The interaction between various irrigation levels and nutrient schedules was non-significant for 0–7.5 and 7.5–15 cm soil depths but was significant at the 15–30 cm soil depth which could be due to less water being required by plants at the maturity stage, as compared to the vegetative growth stage, and water was stored in the 15–30 cm soil layer [32,33].
The soil water stock (SWS) calculated at monthly intervals (i.e., 15 DAT, 45 DAT, 75 DAT and 105 DAT) for 0–7.5, 7.5–15 and 15–30 cm soil depths during the crop growth period are given in Table 4. The SWS determined at 15 DAT was non-significant for the 0–7.5 cm soil depth and was significantly (p ≤ 0.05) higher in I2 (25.07 and 58.26 mm) than I1 (23.03 and 53.84 mm) for 7.5–15 and 15–30 cm soil depths, respectively. Among nutrient schedules, the SWS was non-significant for 0–7.5 cm soil depth. The SWS was significantly higher in F5 (24.51 mm) than F3 (23.24 mm) but was statistically similar with F2 (24.45 mm), F1 (24.34 mm) and F4 (23.70 mm) for the 7.5–15 cm soil depth and the SWS was significantly higher in F2 (60.10 mm) as compared to F1 (55.40 mm), F4 (54.42 mm) and F5 (53.26 mm), but was statistically similar with F3 (57.06 mm) for 15–30 cm soil depth. The interaction between various irrigation levels and nutrient schedules was non-significant.
Table 4.
Effect of drip irrigation and nutrient schedule on soil water stock (mm).
The SWS was significantly higher in I2 (17.35, 20.36 and 47.83 mm) than I1 (14.23, 18.18 and 43.45 mm) for 0–7.5, 7.5–15 and 15–30 cm soil depths, respectively. Among nutrient schedules, the SWS was significantly higher in F4 (16.48 mm) than F1 (14.64 mm) but was statistically similar with F5 (16.22 mm), F2 (15.95 mm) and F3 (15.66 mm) for the 0–7.5 cm soil depth and at 7.5–15 cm soil depth, the SWS was significantly higher in F2 (19.98 mm) as compared to F5 (18.43 mm) and F1 (18.32 mm), but was statistically similar with F3 (19.76 mm) and F4 (19.86 mm). The SWS was non-significant for the 15–30 cm soil depth at 45 DAT. The interaction between various irrigation levels and nutrient schedules was non-significant.
The SWS at 75 DAT was significantly higher in I2 (24.45, 28.78 and 65.78 mm) than I1 (22.54, 25.92 and 59.35 mm) for 0–7.5, 7.5–15 and 15–30 cm soil depths, respectively. Among nutrient schedules, the SWS was non-significant for 0–7.5 cm soil depth. The SWS was significantly higher in F4 (29.52 mm) and F2 (28.73 mm) as compared to F5 (26.85 mm), F1 (26.22 mm) and F3 (25.43 mm) for the 7.5–15 cm soil depth and the SWS was significantly higher in F2 (66.39 mm) than F4 (60.80 mm), F3 (61.14 mm) and F1 (61.67 mm), but was statistically similar with F5 (62.83 mm) for 15–30 cm soil depth. The interaction between various irrigation levels and nutrient schedules was non-significant at the 0–7.5 cm soil depth but significant for 7.5–15 and 15–30 cm soil depths, respectively. The SWS was significantly higher in I2 (30.75, 34.44 and 80.60 mm) than I1 (28.45, 31.90 and 76.35 mm) for 0–7.5, 7.5–15 and 15–30 cm soil depths, respectively. Among nutrient schedules, the SWS was significantly higher in F2 (30.48 mm) and F4 (30.49 mm) than F1 (27.76 mm) but was statistically similar with F3 (29.47 mm) and F5 (29.78 mm) for 0–7.5 cm soil depth, and the SWS was significantly higher in F2 (34.97 mm), F3 (34.36 mm) and F5 (34.26 mm) as compared to F4 (31.37 mm) and F1 (30.88 mm) for 7.5–15 cm soil depth. The SWS was significantly higher in F2 (81.40 mm) and F3 (81.16 mm) as compared to F4 (75.03 mm) and F1 (76.86 mm) but was statistically similar with F5 (77.94 mm) for the 15–30 cm soil depth at 105 DAT. The interaction between various irrigation levels and nutrient schedules was non-significant for 0–7.5 and 7.5–15 cm soil depths but significant at 15–30 cm soil depth.
The total profile water stock determined for 0–7.5, 7.5–15 and 15–30 cm soil depths during crop growth period are given in Table 5. The 8.0–9.5% increase in total profile water stock was observed in I2. It was significantly higher than I1 at 0–7.5, 7.5–15 and 15–30 cm soil depths. Among the nutrient schedule, the total profile water stock was significantly higher in F2 than F1 which was statistically similar with F5, F4 and F3 at the 0–7.5 cm soil depth and the total profile water stock was significantly higher in F2, which was statistically similar with F4, and lower in F1 treatment at 7.5–15 and at 15–30 cm soil depth. The total profile water stock was significantly higher in F2 than all other treatments. The results showed that total soil water stock at the 15–30 cm soil depth was higher than the 0–7.5 and 7.5–15 cm soil depths and soil water stock was higher in I2 than I1 due to a higher quantity of water application in I2 treatment.
Table 5.
Effect of drip irrigation and nutrient schedule on total profile water stock (mm).
3.1.2. Soil Profile Water Depletion
The soil profile water depletion determined at monthly intervals (i.e., 15–45 DAT, 45–75 DAT and 75–105 DAT) for 0–7.5, 7.5–15 and 15–30 cm soil depths during the crop growth period are given in Table 6. The soil profile water depletion was calculated at 15–45 DAT and was significantly higher in I1 (6.25 mm) than I2 (3.97 mm) for 0–7.5 cm soil depth. The soil profile water depletion was non-significant for 7.5–15 and 15–30 cm soil depths, respectively. Among nutrient schedules, the soil profile water depletion was non-significant for 0–7.5 cm soil depth and at 7.5–15 cm soil depth the soil profile water depletion was significantly higher in F5 (6.08 mm) and F1 (6.02 mm) than F3 (3.49), but was statistically similar with F2 (4.48 mm) and F4 (3.84 mm). The soil profile water depletion was significantly higher in F2 (14.80 mm) as compared to F4 (8.04 mm) but was statistically similar with F1 (11.07 mm), F3 (9.34) and F5 (8.81 mm) at the 15–30 cm soil depth. The interaction between various irrigation levels and nutrient schedules was non-significant.
Table 6.
Effect of drip irrigation and nutrient schedule on soil profile water depletion (mm).
The soil profile water depletion was significantly higher in I1 (−8.32 mm) than I2 (−7.10 mm) for the 0–7.5 cm soil depth. The soil profile water depletion was non-significant for 7.5–15 and 15–30 cm soil depths, respectively. Among nutrient schedules, the soil profile water depletion was non-significant for the 0–7.5 cm soil depth and at the 7.5–15 cm soil depth the soil profile water depletion was significantly higher in F3 (−5.67 mm) as compared to F5 (−8.42 mm), F2 (−8.76 mm) and F4 (−9.66 mm), but was statistically similar with F1 (−7.90 mm). The soil profile water depletion at 15–30 cm was statistically higher in F4 (−14.42 mm) and F3 (−13.41 mm) than F2 (−21.09 mm) but was statistically similar with F1 (−17.33 mm) and F5 (−18.38 mm) at 45–75 DAT. The interaction between various irrigation levels and nutrient schedules was non-significant.
The soil profile water depletion was calculated at 75–105 DAT and was non-significantly under various drip irrigation levels. Among nutrient schedules, the soil profile water depletion was non-significant for 0–7.5 and 15–30 cm soil depths and at the 7.5–15 cm soil depth the soil profile water depletion was significantly higher in F4 (−1.86 mm) and significantly lower in F3 (−8.93 mm) in comparison to other treatments. The interaction between various irrigation levels and nutrient schedules was non-significant for 0–7.5 cm and significant for 7.5–15 and 15–30 cm soil depths, respectively.
The total soil profile water depletion calculated for 0–7.5, 7.5–15 and 15–30 cm soil depths is given in Table 6. The results showed that the depletion of profile water occurred at 15–45 DAT and thereafter, the recharge of water was observed. The higher recharge of groundwater obtained in I2 compared to I1 may be due to a higher quantity of water application in the I2 treatment. The total soil profile water depletion was non-significant among different drip irrigation levels at 0–7.5, 7.5–15 and 15–30 cm soil depths. Among the nutrient schedules the total soil water depletion was non-significant at 0–7.5 and 15–30 cm soil depths and total soil profile water depletion was significantly higher in F1 as compared to F3 and F2 but was statistically similar with F4. The interaction between various irrigation levels and nutrient schedules was non-significant.
3.2. Nutrient Uptake
The available soil NPK calculated for 0–15 and 15–30 cm soil depths at harvesting of crop are given in Table 7. The available nitrogen (N) was non-significant for 0–15 cm and 15–30 cm soil depths under different irrigation levels. Among different nutrient schedules, the available nitrogen (N) was significantly higher in F5 than all other treatments for both 0–15 cm and 15–30 cm soil depths. The interaction between various irrigation levels and nutrient schedules was non-significant. The available phosphorus (P) was non-significant for the 0–15 cm soil depth, but was significantly higher under I1 than I2 for the 15–30 cm soil depth. Under nutrient schedules, the available phosphorus (P) was non-significant for the 0–15 cm soil depth but was significantly higher under F1 as compared to F2 and F3 but was statistically similar with F5 and F4 for the 15–30 cm soil depth, because P applied at the time of transplanting as a basal dose helps to increase its availability to the roots of plants [34,35,36]. The interaction between various irrigation levels and nutrient schedules was non-significant for the 0–15 cm soil depth and was significant at the 15–30 cm soil depth which may be due to the fact that the drip fertigation helps to provide nutrient at the root zone and is taken up by the plant root, but after meeting the required P deposited in the subsurface layer [33,37].
Table 7.
Effect of drip irrigation and nutrient schedule on available NPK (kg/ha).
The available potassium (K) was significantly higher in I2 than I1 for the 0–15 cm soil depth and was non-significant for the 15–30 cm soil depth under different irrigation levels. Among different nutrient schedules, the available potassium was significantly higher in F5 and lower in F1 in comparison to other treatments for the 0–15 cm soil depth, and for the 15–30 cm soil depth available potassium (K) was significantly higher in F3 and lower in F1 in comparison to other treatments, because fertigation helps to increase the availability of potassium in the root zone as compared to other fertilizer application methods [34,35,36,38]. The interaction between various irrigation levels and nutrient schedules was significant for the 0–15 cm soil depth due to even distribution of nutrients in fertigation which increases the fertilizer use efficiency [39]. It was non-significant for the 15–30 cm soil depth.
3.3. Total Water Use and Water Use Efficiency
The effect of drip irrigation levels and the nutrient schedule on total water use and water use efficiency in tomato is given in Table 8. The total profile water depletion calculated in I1 and I2 irrigation levels during tomato growth was −14.8 and 26.6 mm at the 0–0.30 m profile depth (Table 6). The total crop water use was significantly lower under the I1 treatment as compared to I2. The total water use among different nutrient schedules was non-significant.
Table 8.
Effect of drip irrigation and nutrient schedule on biological yield, total water use and water use efficiency.
The water use efficiency was significantly higher in I1 than I2. In the I1 treatment, with a lower amount of water used, the yield was maintained as compared to I2 which helps to increase the water use efficiency [40,41,42,43,44]. The lowest water use efficiency in I2 was mainly due to a higher amount of water used as compared to the I1 treatment. Under different nutrient schedules, the water use efficiency was significantly higher in F5, F4 and F3 compared to F1 but was significantly similar with F2 because F5 treatment gives the nutrients which fulfil the plants’ requirements and the crops give better responses and produced maximum water use efficiency with an optimum yield [33]. The interaction between irrigation levels and nutrient schedules was non-significant.
3.4. Biological Yield
The effect of drip irrigation levels and the nutrient schedule on the biological yield of tomato is given in Table 8.
The data revealed that significantly higher fruit and straw yields were recorded in I2 than I1. Among different nutrient schedules, the fruit yield was significantly higher in F5 and F3 as compared to F1 but was statistically similar with F2 and F4. The straw yield was also significantly higher in F5, F3 and F4 in comparison to F1 and F2 treatments due to the higher dose of fertilizers applied through fertigation in F5, which leads to greater availability of nutrients to the plant for better growth and development, leading them to produce maximum yield [20,45,46]. The interaction between irrigation levels and nutrient schedule was non-significant.
3.5. Economics Analysis
The effect of drip irrigation levels and nutrient schedules on net returns and the B:C ratio in tomato is given in Table 9.
Table 9.
Effect of drip irrigation and nutrient schedule on net returns and B:C ratio.
The net returns and B:C ratio were significantly higher under I2 as compared to I1. Among different nutrient schedules, the net returns were significantly higher in F5 than F1 but were statistically similar with F3 and F4 treatment. The B:C ratio was significantly higher in F4 and lower in F1. The higher B:C ratio in F4 was due to higher yields with a lower cost of cultivation in comparison to other irrigation levels and nutrient schedules because the B:C ratio not only depends upon the total yield of crop, but it also depends upon the cost of inputs used during the growing period of that crop [36]. The treatment with a 100 per cent recommended dose of fertilizer through fertigation has a maximum benefit cost ratio (3.75). The interaction between irrigation levels and nutrient schedules was non-significant.
4. Discussion
4.1. Soil Water Studies
The different levels of drip irrigation and fertigation significantly affected the availability of moisture content at different soil layers. Our results showed that the SMC was observed to be higher in I2 as compared to I1 treatment which may be due to a higher amount of water applied, which compensates the evaporation and drainage losses and maintains the availability of water [47]. The drip irrigation with optimum levels helps to maintain the favorable moisture regimes which maintain the growth and development of the plant [48]. The SWS was also significantly higher in I2 than I1 because more water penetrated into the deeper layers in the drip system of irrigation, which increases the availability of water in the soil and the crop utilized the water very effectively [45]. The soil profile water depletion was higher in I2 than I1 due to a higher water application which may be due to higher percolation in I2 than I1. The greater availability leads to higher uptake of water by plants and more water losses through the transpiration in I2 as compared to I1 [49]. So, the I2 can be recommended as one of the best water management methods for efficient tomato cultivation under drip irrigation systems. Among nutrient schedules, SMC was significantly higher in F2 and F4 than F1 at different soil depths because fertigation helps with better root development of the crop, which will lead to the absorption of more water as compared to other methods. The depletion of soil profile water was significantly higher in the F5 treatment because the increase in levels of NPK leads to better development of root and shoot parameters of the crop and they absorb more water from the soil [50,51]. The appropriate scheduling of irrigation is very important for maximum crop production; it consists of knowledge about crop characteristics and the amount of water required at different growth stages. Our study revealed that the optimum level of drip irrigation maintains the soil moisture conditions and produces the maximum yield of tomato.
4.2. Total Water Use and Water Use Efficiency
The water use efficiency is mainly governed by the water obtained from rainfall, soil profile storage and irrigation water, and crop yield. The appropriate irrigation method with optimum levels helps to achieve the maximum water use efficiency [52]. The drip irrigation method is the best method for efficient management of water and produced maximum water use efficiency [53]. Drip irrigation reduces the evaporation and percolation losses and provides favorable soil moisture conditions by maintaining the soil moisture in the root zone of the plant [51,52]. Our results showed the optimum levels of drip irrigation and fertigation that help to achieve the maximum water use efficiency with optimum crop yield. The data showed that the total water use was significantly higher in I2 than I1 due to a higher application of water. The water use efficiency was significantly higher in I1 than I2. In I1 treatment, with a lower amount of water used the yield was maintained due to minimum losses of N due to leaching and supply of nutrients directly into the root zone, which helps to increase the water use efficiency [41,42,43]. The lowest WUE in I2 was mainly due to a higher amount of water used as compared to I1 treatment. Under different nutrient schedules, the water use efficiency was significantly higher in F5 and lower in F1. The higher water use efficiency in F5 was due to higher marketable yield because water use efficiency directly depends on the yield of crop [40,54] and the lower water use efficiency in F1 may be associated with the nutrient solution that leaches at every irrigation. So, fertigation with optimum nutrients was useful practice for improving water use efficiency [36,55].
4.3. Soil Nutrient Status and Crop Yield
The availability of nutrients plays an important role in maintaining the growth and development of plants with optimum yield. The drip irrigation and fertigation is an effective method for obtaining the maximum fertilizer use efficiency [47,56]. Our study evaluated the optimum levels of irrigation and fertilizers through drip irrigation and the data showed that the NPK uptake was higher under the I2 than I1 due to frequent application of water and fertilizer with low concentrations and efficient utilization as they were directly placed into the root zone as compared to other irrigation methods. The drip irrigation with optimum levels maintained the balance ratio between supply and required uptake of nutrients which results in higher shoot and root growth of the plant and provides better nutrient uptake from the soil with minimal losses [57]. The influence of fertigation indicates that with the increase in NPK application there was a corresponding increase in nutrient uptake. The total nitrogen (N) uptake was significantly higher in F5 than all other treatments because, with an increasing N rate and more frequent application, more accumulation occurred in the soil [58]. The fertigation allowed the efficient use of nutrients by reducing the leaching losses and it is a more controllable method of nutrient application [43]. The total phosphorus (P) uptake was significantly higher under F1 because P is immobile naturally in the soil and its application as a basal dose at the time of transplanting through the conventional method helped to increase their availability to the roots of plants [39,40,41]. The total potassium (K) uptake was significantly higher in F5 and F3 and lower in F1 because, in these treatments, K was applied through fertigation which helps to increase the availability of potassium in the root zone as compared to other fertilizer application methods [39,40,41,42]. The uptake of NPK increase in fertigation may be due to a combined effect between the crop nutrient uptake and nutrient availability in the soil as compared to conventionally applied fertilizers which, by and large, results in uneven distribution of nutrients in the root zone [12]. The optimum levels of drip irrigation and fertigation are necessary for maximum crop production.
Crop yield is always considered as an economic index in the development of crop. These data revealed that significantly higher fruit and straw yield were recorded in I2 than I1. The highest fruit yield in I2 might be due to a higher quantity of water applied which leads to improving the plant shoot and root growth, which might have resulted in increased nutrient uptake and produced a higher yield in comparison to I1 [54,59,60]. The fruit and straw yield under different nutrient schedules was significantly higher in F5 treatment due to a higher dose of fertilizers applied through fertigation in F5, which leads to a greater availability of nutrients to the plant for their better growth and development, which leads them to produce maximum yield [20,45,46]. The increase in the NPK fertilizer rate leads to an increase in the number of fruits per plant and total yield of crop [61]. The fruit and straw yield were significantly higher in F5 as compared to other treatments, which may be attributed to the application of a greater amount of fertilizer through fertigation and plants give better responses to F5 treatment.
4.4. Economics and Returns
The net returns and B:C ratio are the most important parameters to determine the cost-effectiveness of any treatment. The ultimate objective of any treatment is to achieve profit in terms of net return and B:C ratio. The net returns and B:C ratio was significantly higher under I2 as compared to I1 because I2 treatment gives the higher marketable yield, which increases the net returns and B:C ratio [62]. Among different nutrient schedules, the net returns were significantly higher in F5, which was statistically similar with F3 and F4 and lower in F1 treatment. The B:C ratio was significantly higher in F4 and lower in F1. The higher B:C ratio in F4 was due to higher yields with lower costs of cultivation in comparison to other irrigation levels and nutrient schedules because the B:C ratio not only depends upon the total yield of crop, but it also depends upon cost of inputs used during the growing period of that crop [31]. The treatment with a 100 per cent recommended dose of fertilizer through fertigation has a maximum benefit cost ratio (3.75).
5. Conclusions
Based on the results of the present study, it can be concluded that the application of drip irrigation on the basis of 100% of Epan was the most suitable treatment with higher soil moisture content leading to higher crop yield, higher net returns and higher B:C ratio. The application of 100% RDF through fertigation was the most suitable fertigation schedule compared to other treatments as it resulted in better plant growth and higher yield. However, it is difficult to obtain not only the maximum water use efficiency but also the highest yield at the same time because a decreased quantity of water leads to greater WUE; albeit a higher yield cannot be achieved at a lower irrigation rate. Therefore, irrigation on the basis of 100% of Epan and 100% RDF through fertigation overall showed better performance and should be recommended for tomato cultivation under greenhouse conditions. Overall, the cultivation of tomato under a greenhouse should be encouraged in the temperate Himalayan region among smallholder farmers owing to small land holdings in this region. The fertigation schedule may be optimized according to the crop growth stages in future studies as it may lead to lower application of fertilizers resulting in more profit for the farmers.
Supplementary Materials
The following supporting information can be downloaded at: https://www.mdpi.com/article/10.3390/w15112086/s1. Table S1: Discharge rate, variation and uniformity coeffcient of different plots.
Author Contributions
Conceptualization, J.S. and S.K.S.; methodology, J.S. and S.K.S.; software, J.S.; validation, J.S. and S.K.S.; formal analysis, J.S. and S.K.S.; investigation, J.S.; resources, S.K.S.; data curation, J.S. and S.K.S.; writing— J.S. and A.Y.; writing—review and editing, A.Y. and P.S.S.; visualization, S.K.S.; supervision, J.S. and S.K.S.; project administration, J.S. and S.K.S.; funding acquisition, J.S. and S.K.S. All authors have read and agreed to the published version of the manuscript.
Funding
This research received no external funding.
Data Availability Statement
The data is available in the supplementary materials.
Acknowledgments
The authors express their gratitude to Chaudhary Sarwan Kumar Himachal Pradesh Agricultural University, Palampur, Himachal Pradesh for providing research facilities.
Conflicts of Interest
The authors declare no conflict of interest.
References
- Narolia, R.K.; Reddy, R.V.S.K.; Sujatha, M. Genetic architecture of yield and quality in tomato (Solanum lycopersicon L.). Agric. Sci. Digest. 2012, 32, 281–285. [Google Scholar] [CrossRef]
- Dagade, S.B.; Dhaduk, L.K.; Hariprasanna, K.; Mehata, D.R.; Bhatt, V.M.; Barad, A.V. Parent offspring relations of nutritional quality traits in 8 × 8 partial diallel cross of fresh tomatoes. Int. J. Appl. Biol. Pharm. 2015, 6, 45–55. [Google Scholar]
- Food and Agriculture Organisation of the United Nations. Available online: http://faostat.fao.org.com (accessed on 26 June 2019).
- Fan, Z.; Lin, S.; Zhang, X.; Jiang, Z.; Yang, K.; Jian, D.; Chen, Y.; Li, J.; Chen, Q.; Wang, J. Conventional flooding irrigation causes an overuse of nitrogen fertilizer and low nitrogen use efficiency in intensively used solar greenhouse vegetable production. Agric. Water Manag. 2014, 144, 11–19. [Google Scholar] [CrossRef]
- Cao, J.; Lee, J.; Six, J.; Yan, Y.; Zhang, F.; Fan, M. Changes in potential denitrification-derived N2O emissions following conversion of grain to greenhouse vegetable cropping systems. Eur. J. Soil Biol. 2015, 68, 94–100. [Google Scholar] [CrossRef]
- Du, T.; Kang, S.; Zhang, X.; Zhang, J. China’s food security is threatened by the unsustainable use of water resources in North and Northwest China. Food Energy Secur. 2014, 3, 7–18. [Google Scholar] [CrossRef]
- Qiu, R.; Kang, S.; Li, F.; Du, T.; Tong, L.; Wang, F.; Chen, R.; Liu, J.; Li, S. Energy partitioning and evapotranspiration of hot pepper grown in greenhouse with furrow and drip irrigation methods. Sci. Hortic. 2011, 129, 790–797. [Google Scholar] [CrossRef]
- Nikolaou, G.; Neocleous, D.; Katsoulas, N.; Kittas, C. Irrigation of Greenhouse Crops. Acta. Hortic. 2019, 5, 7. [Google Scholar] [CrossRef]
- Sandal, S.K.; Kapoor, R. Fertigation technology for enhancing nutrient use and crop productivity: An overview. HJAR 2015, 41, 114–121. [Google Scholar]
- Singandhupe, R.B.; Rao, G.G.S.N.; Patil, N.G.; Brahmanand, P.B. Fertigation studies and irrigation scheduling in drip irrigation system in tomato crop (Lycopersicon esculentum L.). Eur. J. Agron. 2003, 19, 1–17. [Google Scholar] [CrossRef]
- Jat, R.A.; Wani, S.P.; Piara, K.L.S.; Dhaka, B.L. Fertigation in vegetable crops for higher productivity and resource use efficiency. Indian J. Ferti. 2011, 7, 22–37. [Google Scholar]
- Hongal, M.M.; Nooli, S.S. Nutrient movement in fertigation through drip-A review. Agric. Rev. 2007, 28, 301–304. [Google Scholar]
- Moncada, A.; Vetrano, F.; Esposito, A.; Miceli, A. Fertigation Management And Growth Promoting Treatments Affect Tomato Transplant Production And Plant Growth After Transplant. Agron J. 2020, 10, 1504. [Google Scholar] [CrossRef]
- Plaza, B.M.; Lao, M.T.; Becker, S.J. Fertigation Strategies to Alleviate Fertilizer Contamination Generated By Tomato Crops Under Plastic Greenhouses. Agron. J. 2021, 11, 444. [Google Scholar] [CrossRef]
- Dan, D.Y.; Xia, C.A.O.H.; Quan, L.S.; Bo, G.U.X.; Xin, C.A.O.Y. Response of Yield, Quality, Water and Nitrogen Use Efficiency of Tomato to Different Levels of Water and Nitrogen Under Drip Irrigation in Northwestern China. J. Integr. Agric. 2017, 5, 1153–1161. [Google Scholar] [CrossRef]
- Ayenan, M.A.T.; Danquah, A.; Hanson, P.; Asante, I.K.; Danquah, E.Y. Tomato (Solanum lycopersicum L.) Genotypes Respond Differently to Long-Term Dry and Humid Heat Stress. Hortic. Sci. 2022, 8, 118. [Google Scholar] [CrossRef]
- Cifuentes, A.M.; Aguilar, L.A.V.; Zapata, M.C.; Fuentes, J.A.G.; Maruri, J.A.H.; Camarillo, D.A. Water and Fertilizer Use Efficiency in Subirrigated Containerized Tomato. Water 2020, 12, 1313. [Google Scholar] [CrossRef]
- Jensen, M.H. Controlled environment agriculture in deserts tropics and temperate region-A world review. Acta Hortic. 2002, 578, 19–25. [Google Scholar] [CrossRef]
- World Agriculture: Towards 2030/2050—Interim Report. Available online: http://www.fao.org/fileadmin/user_upload/esag/docs/Interim_report_AT2050web.pdf. (accessed on 20 March 2006).
- Mahajan, G.; Singh, K. Response of greenhouse tomato to irrigation and fertigation. Agric. Water Manag. 2006, 84, 202–206. [Google Scholar] [CrossRef]
- Hillel, D. Introduction to Soil Physics; Elsevier: Amsterdam, The Netherlands, 1982. [Google Scholar]
- Jensen, M.E.; Wright, J.L.; Pratt, B.J. Estimating Soil Moisture Depletion from Climate, Crop and Soil Data. Trans. ASAE 1971, 14, 954–959. [Google Scholar] [CrossRef]
- Brar, S.K.; Mahal, S.S.; Brar, A.S.; Vashist, K.K.; Sharma, N.; Buttar, G.S. Transplanting time and seedling age affect water productivity, rice yield and quality in north-west India. Agric. Water Manag. 2012, 115, 217–222. [Google Scholar] [CrossRef]
- Jackson, M.L. Soil Chemical Analysis; Prentice Hall Inc.: Englewood Cliffs, NJ, USA, 1973. [Google Scholar]
- Piper, C.D. Soil and Plant Analysis; Inc. Sci. Pub. INC: New York, NY, USA, 1950. [Google Scholar]
- Yoder, R.E. A direct method of aggregate analysis and study of the physical nature of erosion losses. J. Am. Soc. Agron. 1936, 28, 337–351. [Google Scholar] [CrossRef]
- Black, C.A. Methods of Soil Analysis Part-I; American Society of Agronomy: Madison, WI, USA, 1965. [Google Scholar]
- Gupta, R.P.; Dhakshinamoorthy, C. Procedures for Physical Analysis of Soils and Collection of Agrometerological Data; Division of Agricultural Physics, Indian Agricultural Research Institute: New Delhi, India, 1980. [Google Scholar]
- Walkley, A.; Black, I.A. An examination of the Degtjareff (wet acid) method for determining soil organic matter and a proposed modification of the chromic acid titration method. Soil Sci. 1934, 37, 29–38. [Google Scholar] [CrossRef]
- Subbiah, B.V.; Asija, G.L. A rapid procedure for the determination of available nitrogen in soils. Curr. Sci. 1956, 25, 259–260. [Google Scholar]
- Olsen, S.R.; Cole, C.V.; Watanabe, F.S.; Dean, L.A. Estimation of available phosphorus by extraction with sodium carbonate. USDA 1954, 939, 19–33. [Google Scholar]
- Jaswal, R.; Sandal, S.K. Effect of drip irrigation and NK fertigation on soil water dynamics and water productivity of strawberry under protected conditions. J. Soil Water Conserv. 2022, 21, 378–384. [Google Scholar] [CrossRef]
- Pardhan, P.C.; Behera, S.; Devi, S.; Dash, D.K. Growth, yield and quality of onion under different levels of irrigation and NPK fertigation. J. Soil Water Conserv. 2022, 21, 114–117. [Google Scholar] [CrossRef]
- Ibrikci, G.S.; Buyuk, H. Yield and elemental composition of cucumber as affected by drip and furrow irrigation. Acta Hortic. 2002, 571, 51–57. [Google Scholar] [CrossRef]
- Elzopy, K.A.; Biradar, M.S.; Channal, H.T.; Manjunath, M.V.; Palled, Y.B.; Radder, B.M.; Patil, P.L. NPK uptake of tomato as influenced by irrigation regimes and fertigation levels under greenhouse condition. Asian J. Adv. Agric. Res. 2017, 3, 1–10. [Google Scholar] [CrossRef]
- Chand, A.R.J. Nutrient use efficiency and economics of salad cucumber using drip fertigation in naturally ventilated polyhouse. IOSR J. Agric. Vet. Sci. 2014, 7, 22–25. [Google Scholar] [CrossRef]
- Muhammad, T.; Zhou, B.; Liu, Z.; Chen, X.; Li, Y. Effects of phosphorus fertigation on emiiter clogging in drip irrigation system with saline water. Agric. Water Manag. 2021, 243, 106392. [Google Scholar] [CrossRef]
- Ankush, D.; Singh, V.; Kumar, V.; Singh, D.P. Impact of drip irrigation and fertigation scheduling on tomato crop—An overview. J. Appl. Nat. Sci. 2018, 10, 165–170. [Google Scholar] [CrossRef]
- Shedeed, S.I.; Zaghloul, S.M.; Yassen, A.A. Effect of method and rate of fertilizer application under drip irrigation on yield and nutrient uptake by tomato. Ozean J. Appl. Sci. 2009, 2, 139–147. [Google Scholar]
- Wang, X.; Xing, Y. Evaluation of the effects of irrigation and fertilization on tomato fruit yield and quality: A principal component analysis. Sci. Rep. 2017, 7, 350. [Google Scholar] [CrossRef]
- Yaghi, T.; Arslan, A.; Naoum, F. Cucumber (Cucumis sativus, L.) water use efficiency (WUE) under plastic mulch and drip irrigation. Agric. Water Manag. 2013, 128, 149–157. [Google Scholar] [CrossRef]
- Zhang, H.X.; Chi, D.C.; Wang, Q.; Fang, J.; Fang, X.Y. Yield and quality response of cucumber to irrigation and nitrogen fertilization under subsurface drip irrigation in solar greenhouse. Agric. Sci. China. 2011, 10, 921–930. [Google Scholar] [CrossRef]
- Gupta, A.J.; Chattoo, M.A.; Singh, L. Drip irrigation and fertigation technology for improved yield, quality, water and fertilizer use efficiency in hybrid tomato. J. AgriSearch. 2015, 2, 94–99. [Google Scholar]
- Hakkim, V.M.A.; Chand, A.R.J. Effect of drip irrigation levels on yield of salad cucumber under naturally ventilated polyhouse. IOSR J. Eng. 2014, 4, 18–21. [Google Scholar] [CrossRef]
- Feleafel, M.N.; Mirdad, Z.M.; Hassan, A.S. Effects of NPK fertigation rate and starter fertilizer on the growth and yield of cucumber grown in greenhouse. J. Agric. Sci. 2014, 6, 81–92. [Google Scholar] [CrossRef]
- Pushpendra, S.; Hardaha, M.K. Effect of fertigation levels on growth, quality and yield of polyhouse cucumber (Cucumis sativus). Int. J. Agric. Sci. 2016, 8, 1863–1866. [Google Scholar]
- Kumar, J.; Kapoor, R.; Sandal, S.K.; Sharma, S.K.; Saroch, K. Effect of drip irrigation and NPK fertigation on soil-plant water, productivity, fertilizer expense efficiency and nutrient uptake of capsicum (Capsicumannuum L.) in an acid Alfisol. Indian J. Soil Conserv. 2017, 45, 105–111. [Google Scholar] [CrossRef]
- Shu, L.Z.; Liu, R.; Min, W.; Wang, Y.S.; Yu, H.; Zhu, P.F.; Zhu, J.R. Regulation of soil water threshold on tomato plant growth and fruit quality under alternate partial root-zone drip irrigation. Agric. Water Manag. 2020, 238, 106200. [Google Scholar] [CrossRef]
- Bhattarai, B.; Singh, S.; West, C.P.; Ritchie, G.L.; Trostle, C.L. Water depletion pattern and water use efficiency of forage sorghum, pearl millet, and corn under water limiting condition Agric. Water Manag. 2020, 238, 106206. [Google Scholar] [CrossRef]
- Wang, C.; Shu, L.; Zhou, S.; Yu, H.; Zhu, P. Effects of alternate partial root-zone irrigation on the utilization and movement of nitrates in soil by tomato plants. Sci. Hortic. 2019, 243, 41–47. [Google Scholar] [CrossRef]
- Wang, Y.; Liu, C.; Cui, P.; Su, D. Effects of partial root-zone drying on alfalfa growth, yield and quality under subsurface drip irrigation. Agric. Water Manag. 2021, 245, 106608. [Google Scholar] [CrossRef]
- Zhang, Y.Q.; Wang, J.D.; Gong, S.H.; Xu, D.; Sui, J.; Wu, Z.D.; Mo, Y. Effects of film mulching on evapotranspiration, yield and water use efficiency of a maize field with drip irrigation in Northeastern China. Agric. Water Manag. 2018, 205, 90–99. [Google Scholar] [CrossRef]
- Aggarwal, N.; Tamrakar, S.K.; Tiwari, R.B. Impact of Fertigation through Drip on the Cultivation of Tomato. Int. J. Curr. Microbiol. App. Sci. 2018, 7, 4528–4535. [Google Scholar] [CrossRef]
- Wang, X.; Xing, Y. Evaluation of the Effect of Irrigation and Fertilization by Drip Fertigation on Tomato Yield and Water Use Efficiency in Greenhouse. Int. J. Agron. 2016, 2016, 3961903. [Google Scholar]
- Thakur, M. Standardization of Drip Based Irrigation and Fertigation Schedule in Cucumber Grown under Protected Condition. Master’s Thesis, CSK Himachal Pradesh Krishi Vishvavidayalaya, Palampur, India, 2015. [Google Scholar]
- Kumar, R.; Kumar, M. Effect of drip irrigated mulch on soil properties and water use efficiency-A review. J. Soil Water Conserv. 2020, 19, 300–309. [Google Scholar] [CrossRef]
- Kalita, P.; Thakuria, R.K.; Deka, B.; Choudhary, H. Effect of varying drip irrigation levels and NPK fertigation on nutrient uptake, root characteristics, physiological behavior and head quality of broccoli (Brassica oleracea var. italica) in warm humid climatic condition of Assam. Pharma Innov. 2022, 12, 563–569. [Google Scholar]
- Badr, M.A.; Abou Hussein, S.D.; El-Tohamy, W.A.; Gruda, N. Nutrient uptake and yield of tomato under various methods of fertilizer application and levels of fertigation in arid lands. Gesunde Pflanz. 2011, 62, 11–19. [Google Scholar] [CrossRef]
- Pires, R.C.M.; Furlani, P.R.; Sakai, E.; Lourencao, A.L.; Silva, E.A.D.; Neto, A.T.; Melo, A.M. Tomato development and yield under different irrigation frequencies in greenhouse. Hort. Bras. 2009, 27, 228–234. [Google Scholar] [CrossRef]
- Moujabber, E.I.; Atallah, M.; Darwish, T. Crop modeling and water use efficiency of protected cucumber. IAEA 2002, 1266, 61–67. [Google Scholar]
- Eifediyi, E.K.; Remison, S.U. Growth and yield of cucumber (Cucumis sativum L.) as influenced by farm yard manure and inorganic fertilizer. J. Plant Breed. Crop Sci. 2009, 2, 216–220. [Google Scholar] [CrossRef]
- Biswas, S.K.; Akanda, A.R.; Rahman, M.S.; Hossain, M.A. Effect of drip irrigation and mulching on yield, water-use efficiency and economics of tomato. Plant Soil Environ. 2015, 61, 97–102. [Google Scholar] [CrossRef]
Disclaimer/Publisher’s Note: The statements, opinions and data contained in all publications are solely those of the individual author(s) and contributor(s) and not of MDPI and/or the editor(s). MDPI and/or the editor(s) disclaim responsibility for any injury to people or property resulting from any ideas, methods, instructions or products referred to in the content. |
© 2023 by the authors. Licensee MDPI, Basel, Switzerland. This article is an open access article distributed under the terms and conditions of the Creative Commons Attribution (CC BY) license (https://creativecommons.org/licenses/by/4.0/).