
Distribution Characteristics and Genesis of Iron and Manganese Ions in Groundwater of Eastern Sanjiang Plain, China

Abstract
1. Introduction
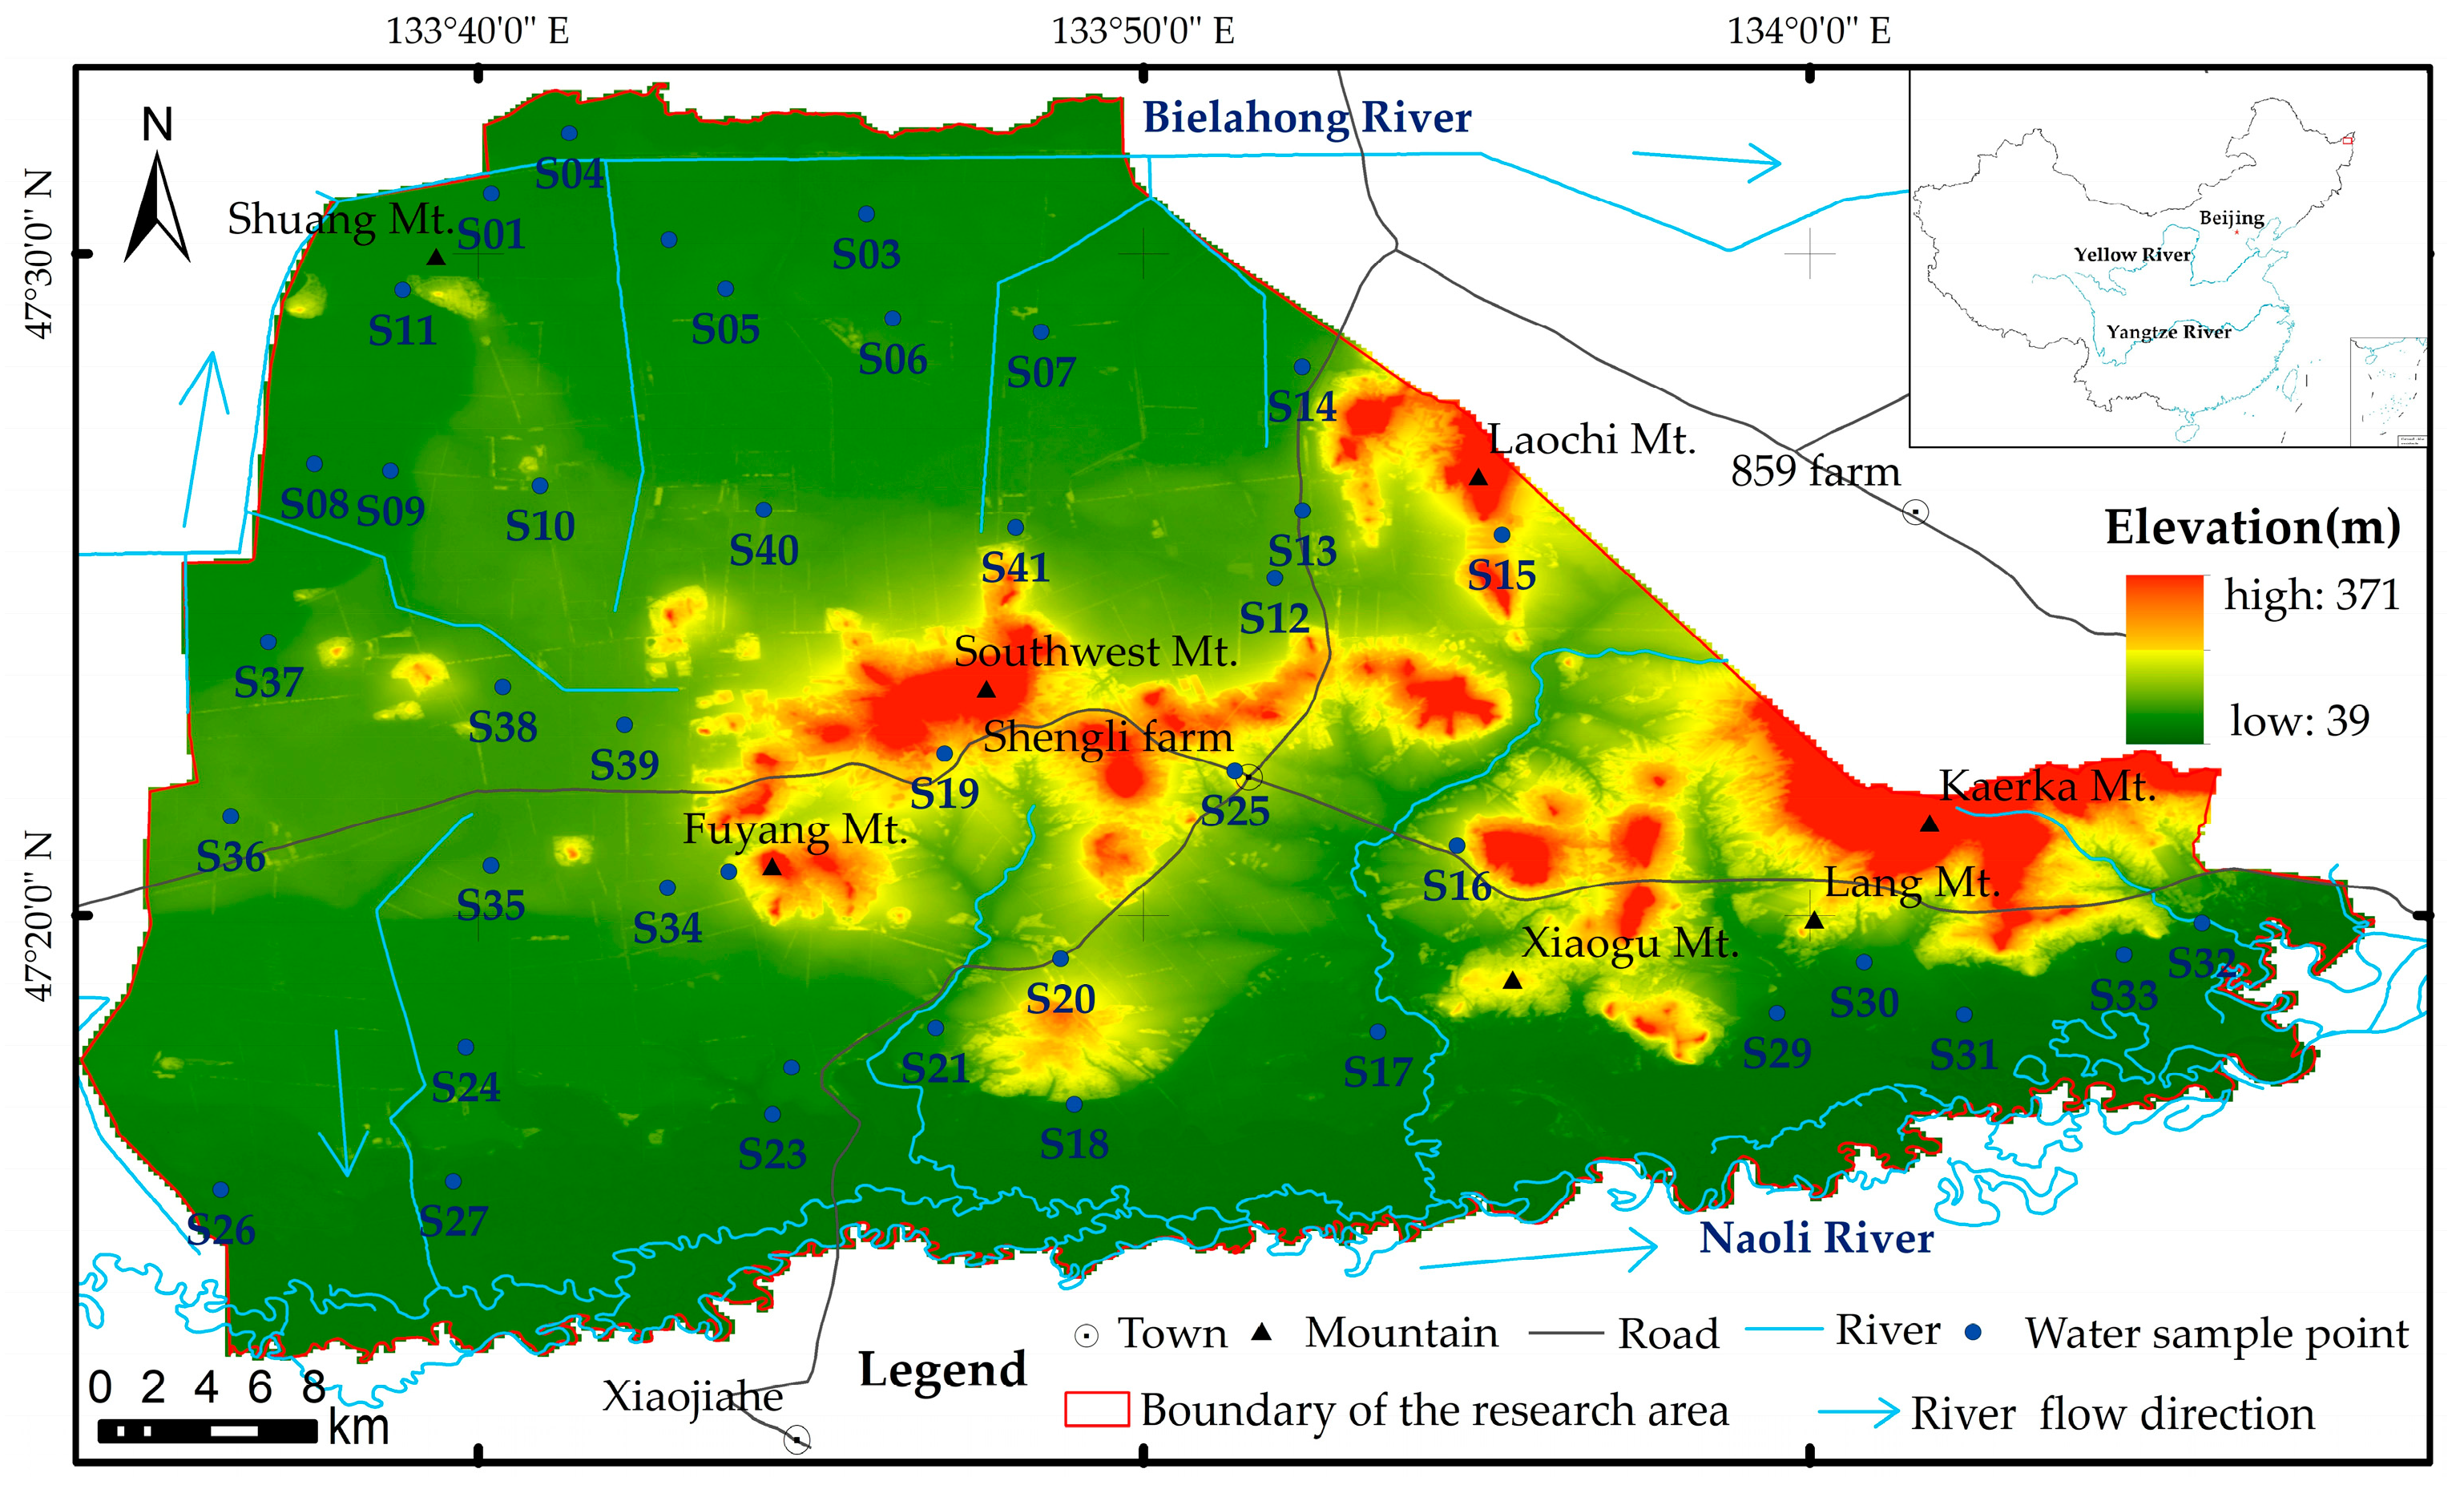
2. Study Area
2.1. Overview
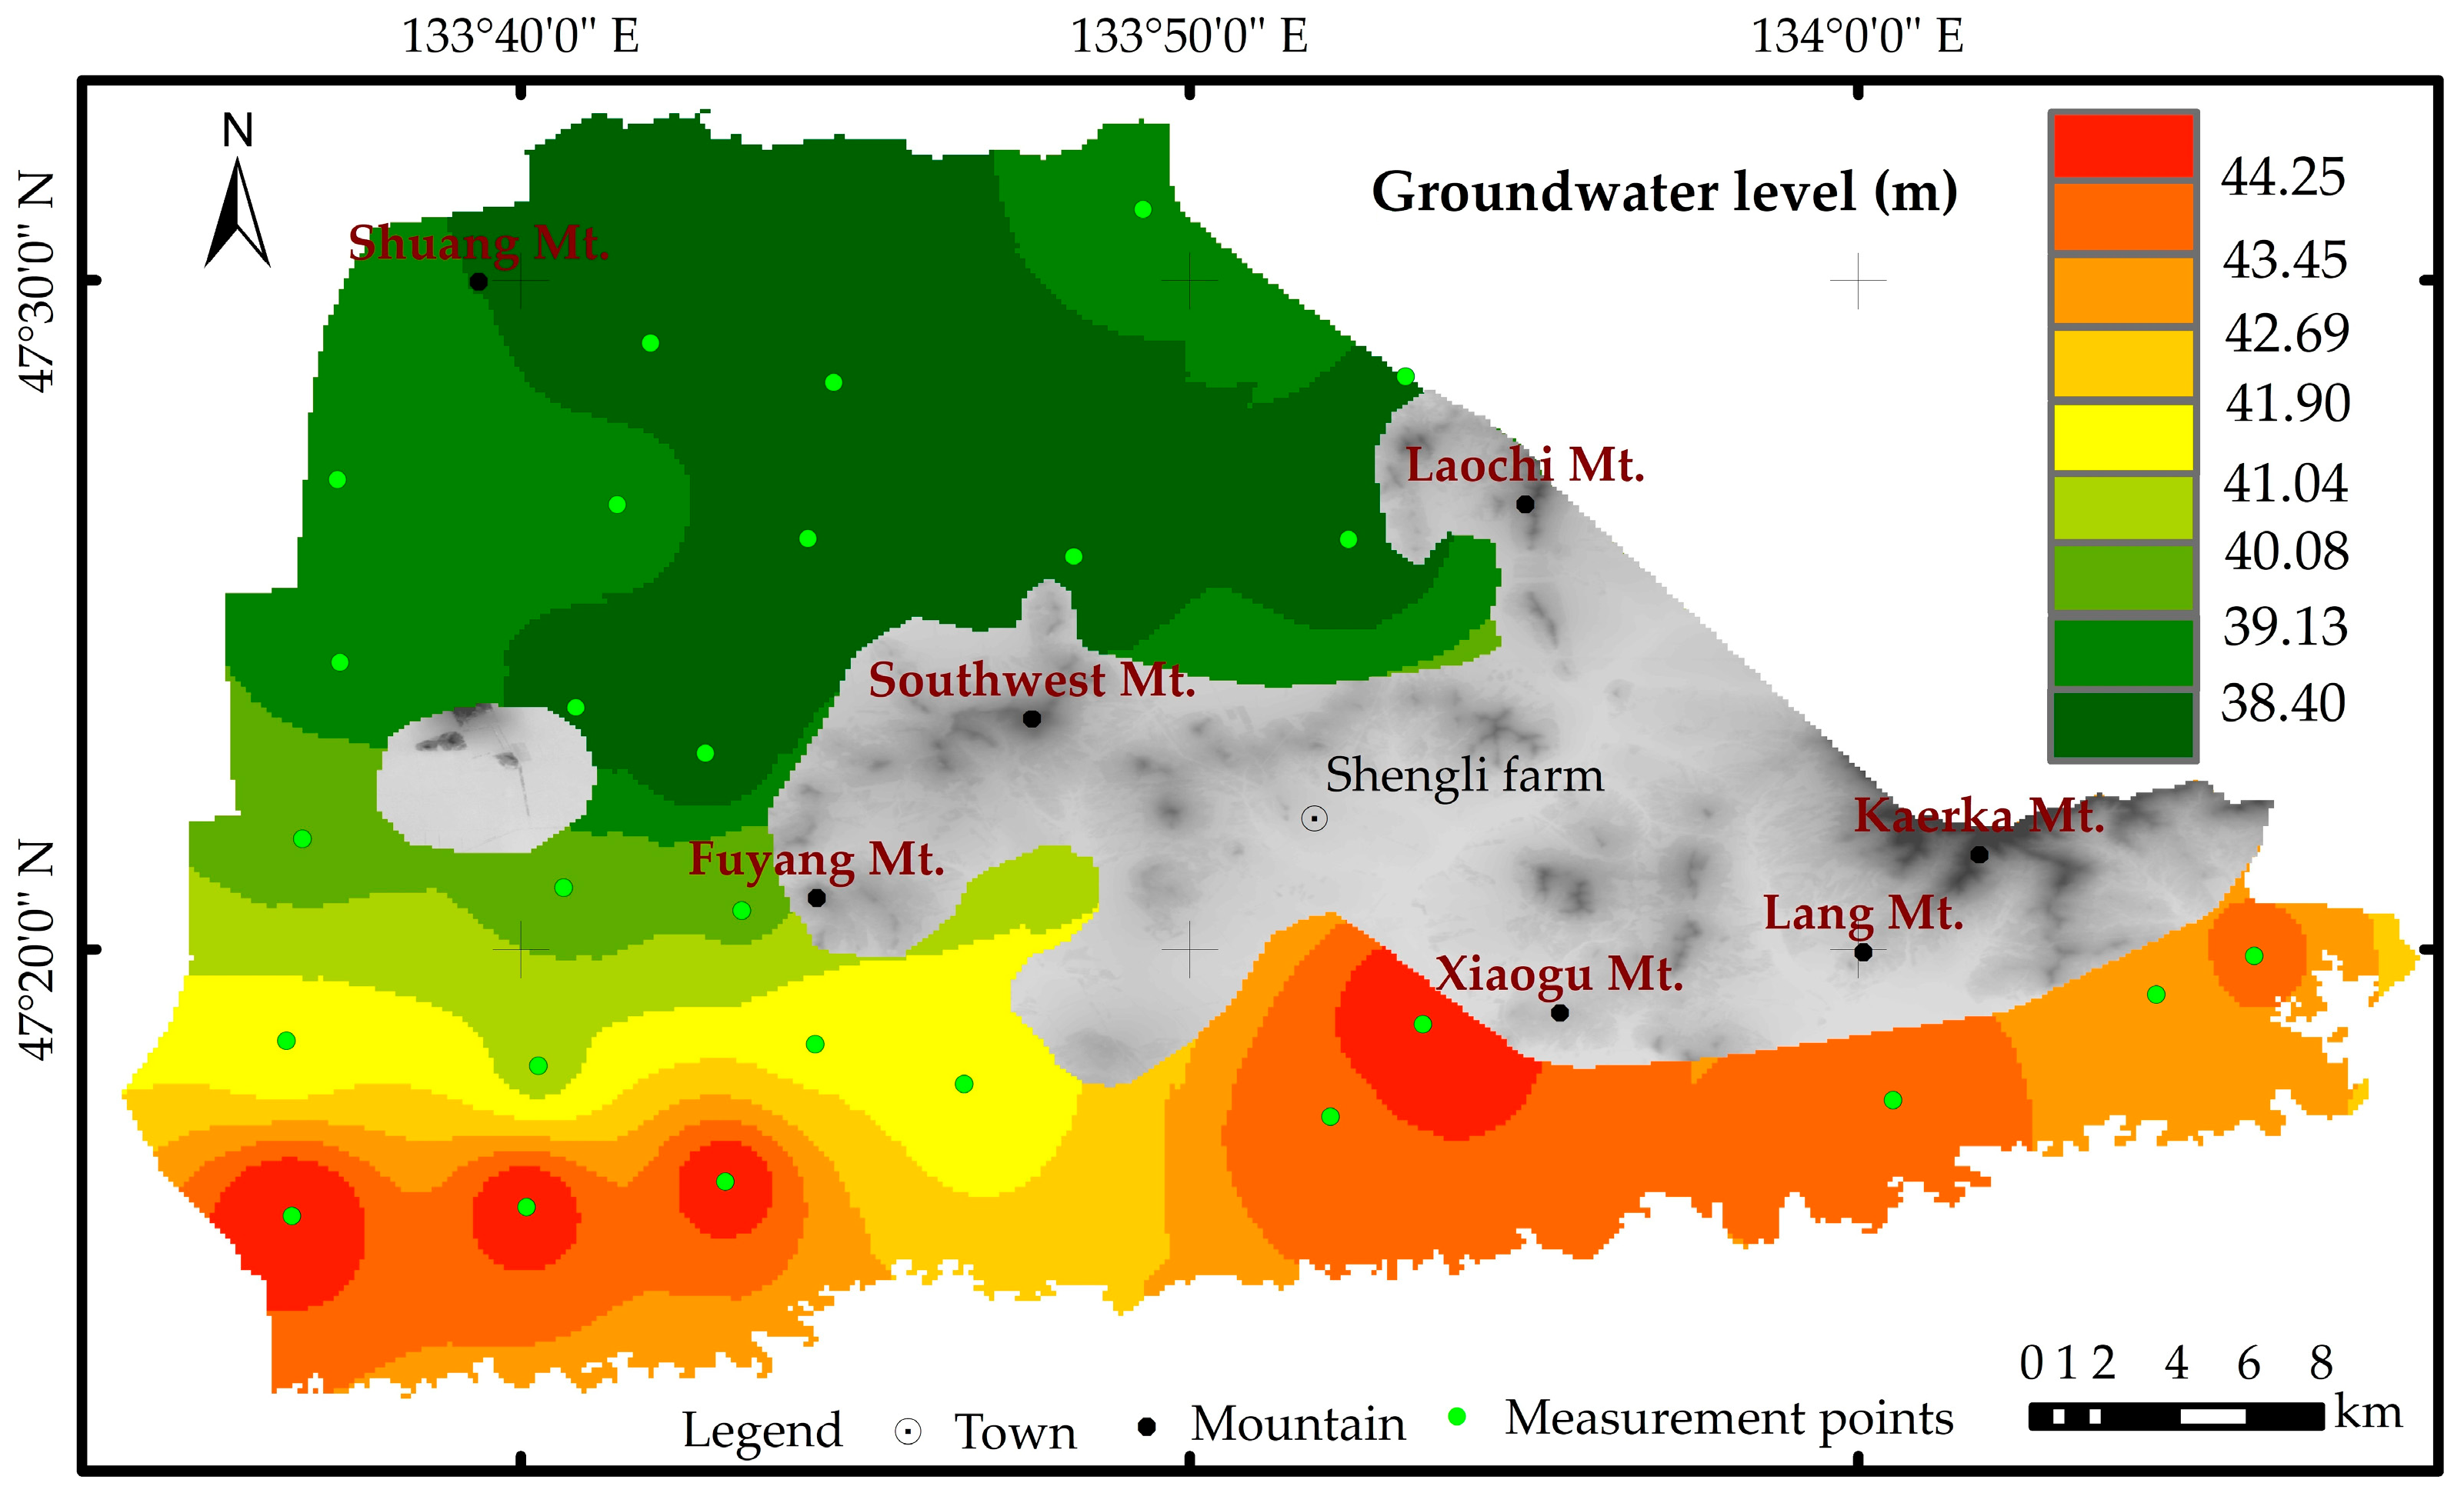
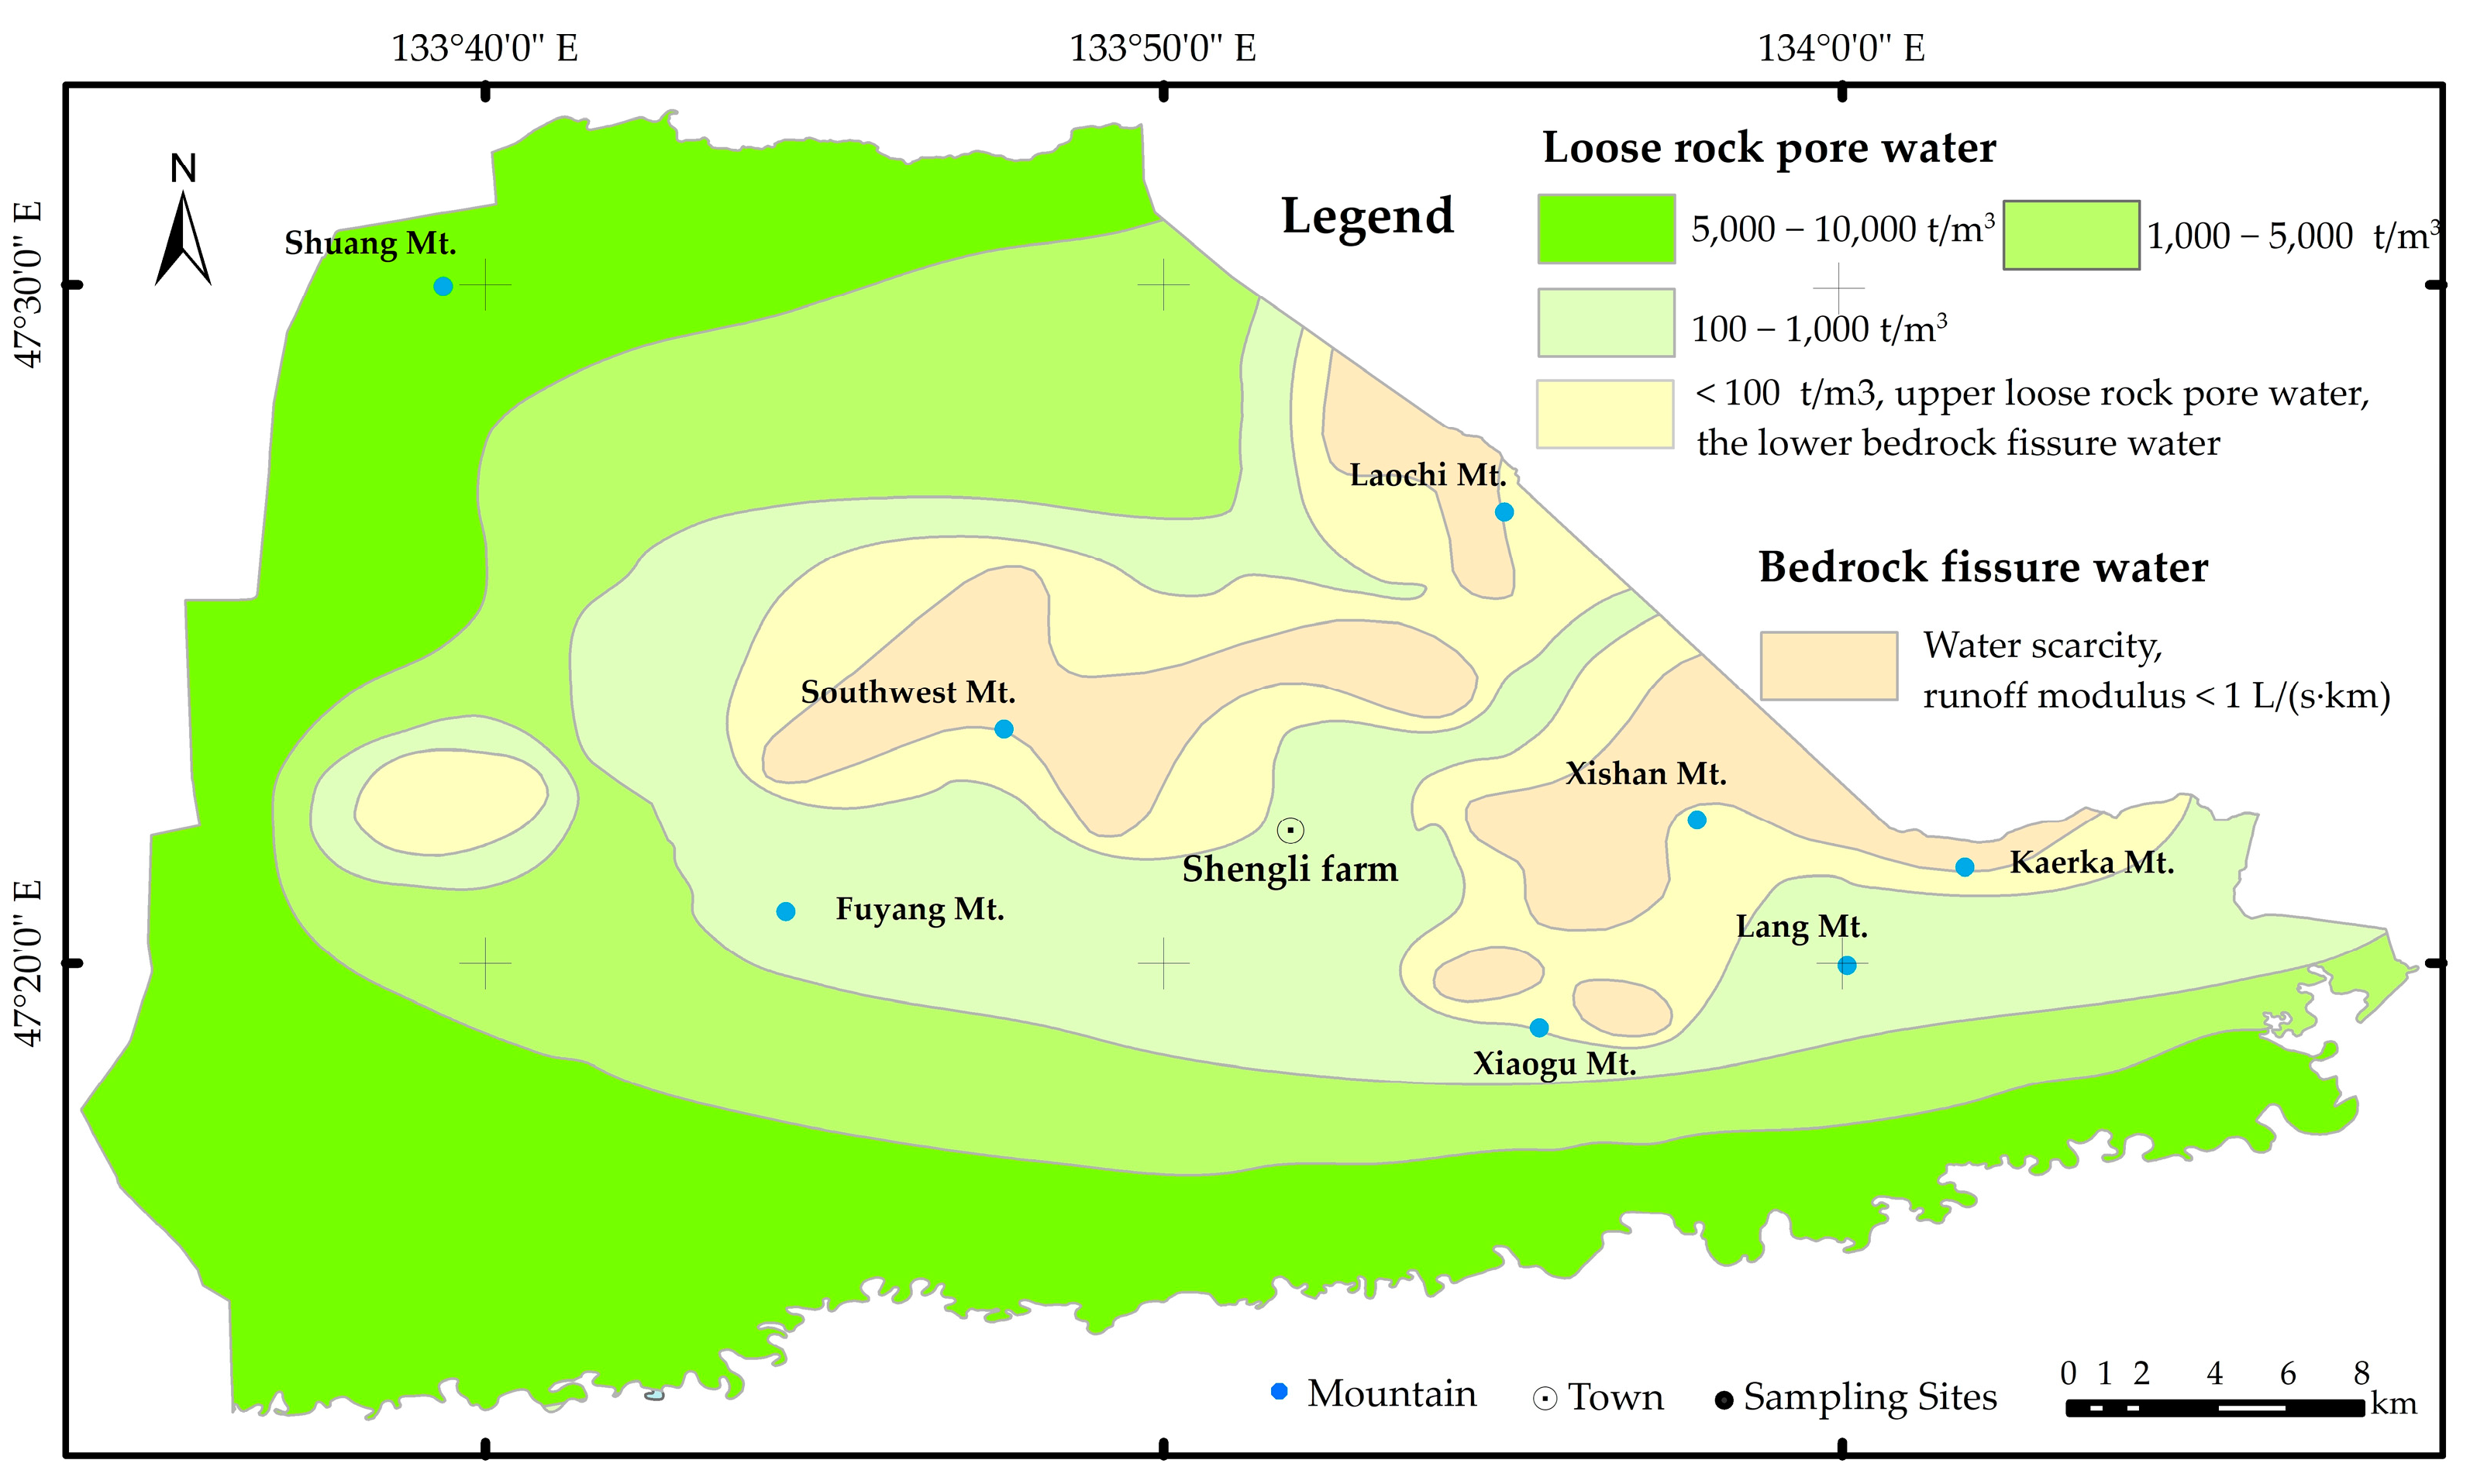
2.2. Groundwater
3. Materials and Methods
3.1. Sampling and Analyzing
3.2. Data Analysis
4. Results and Discussion
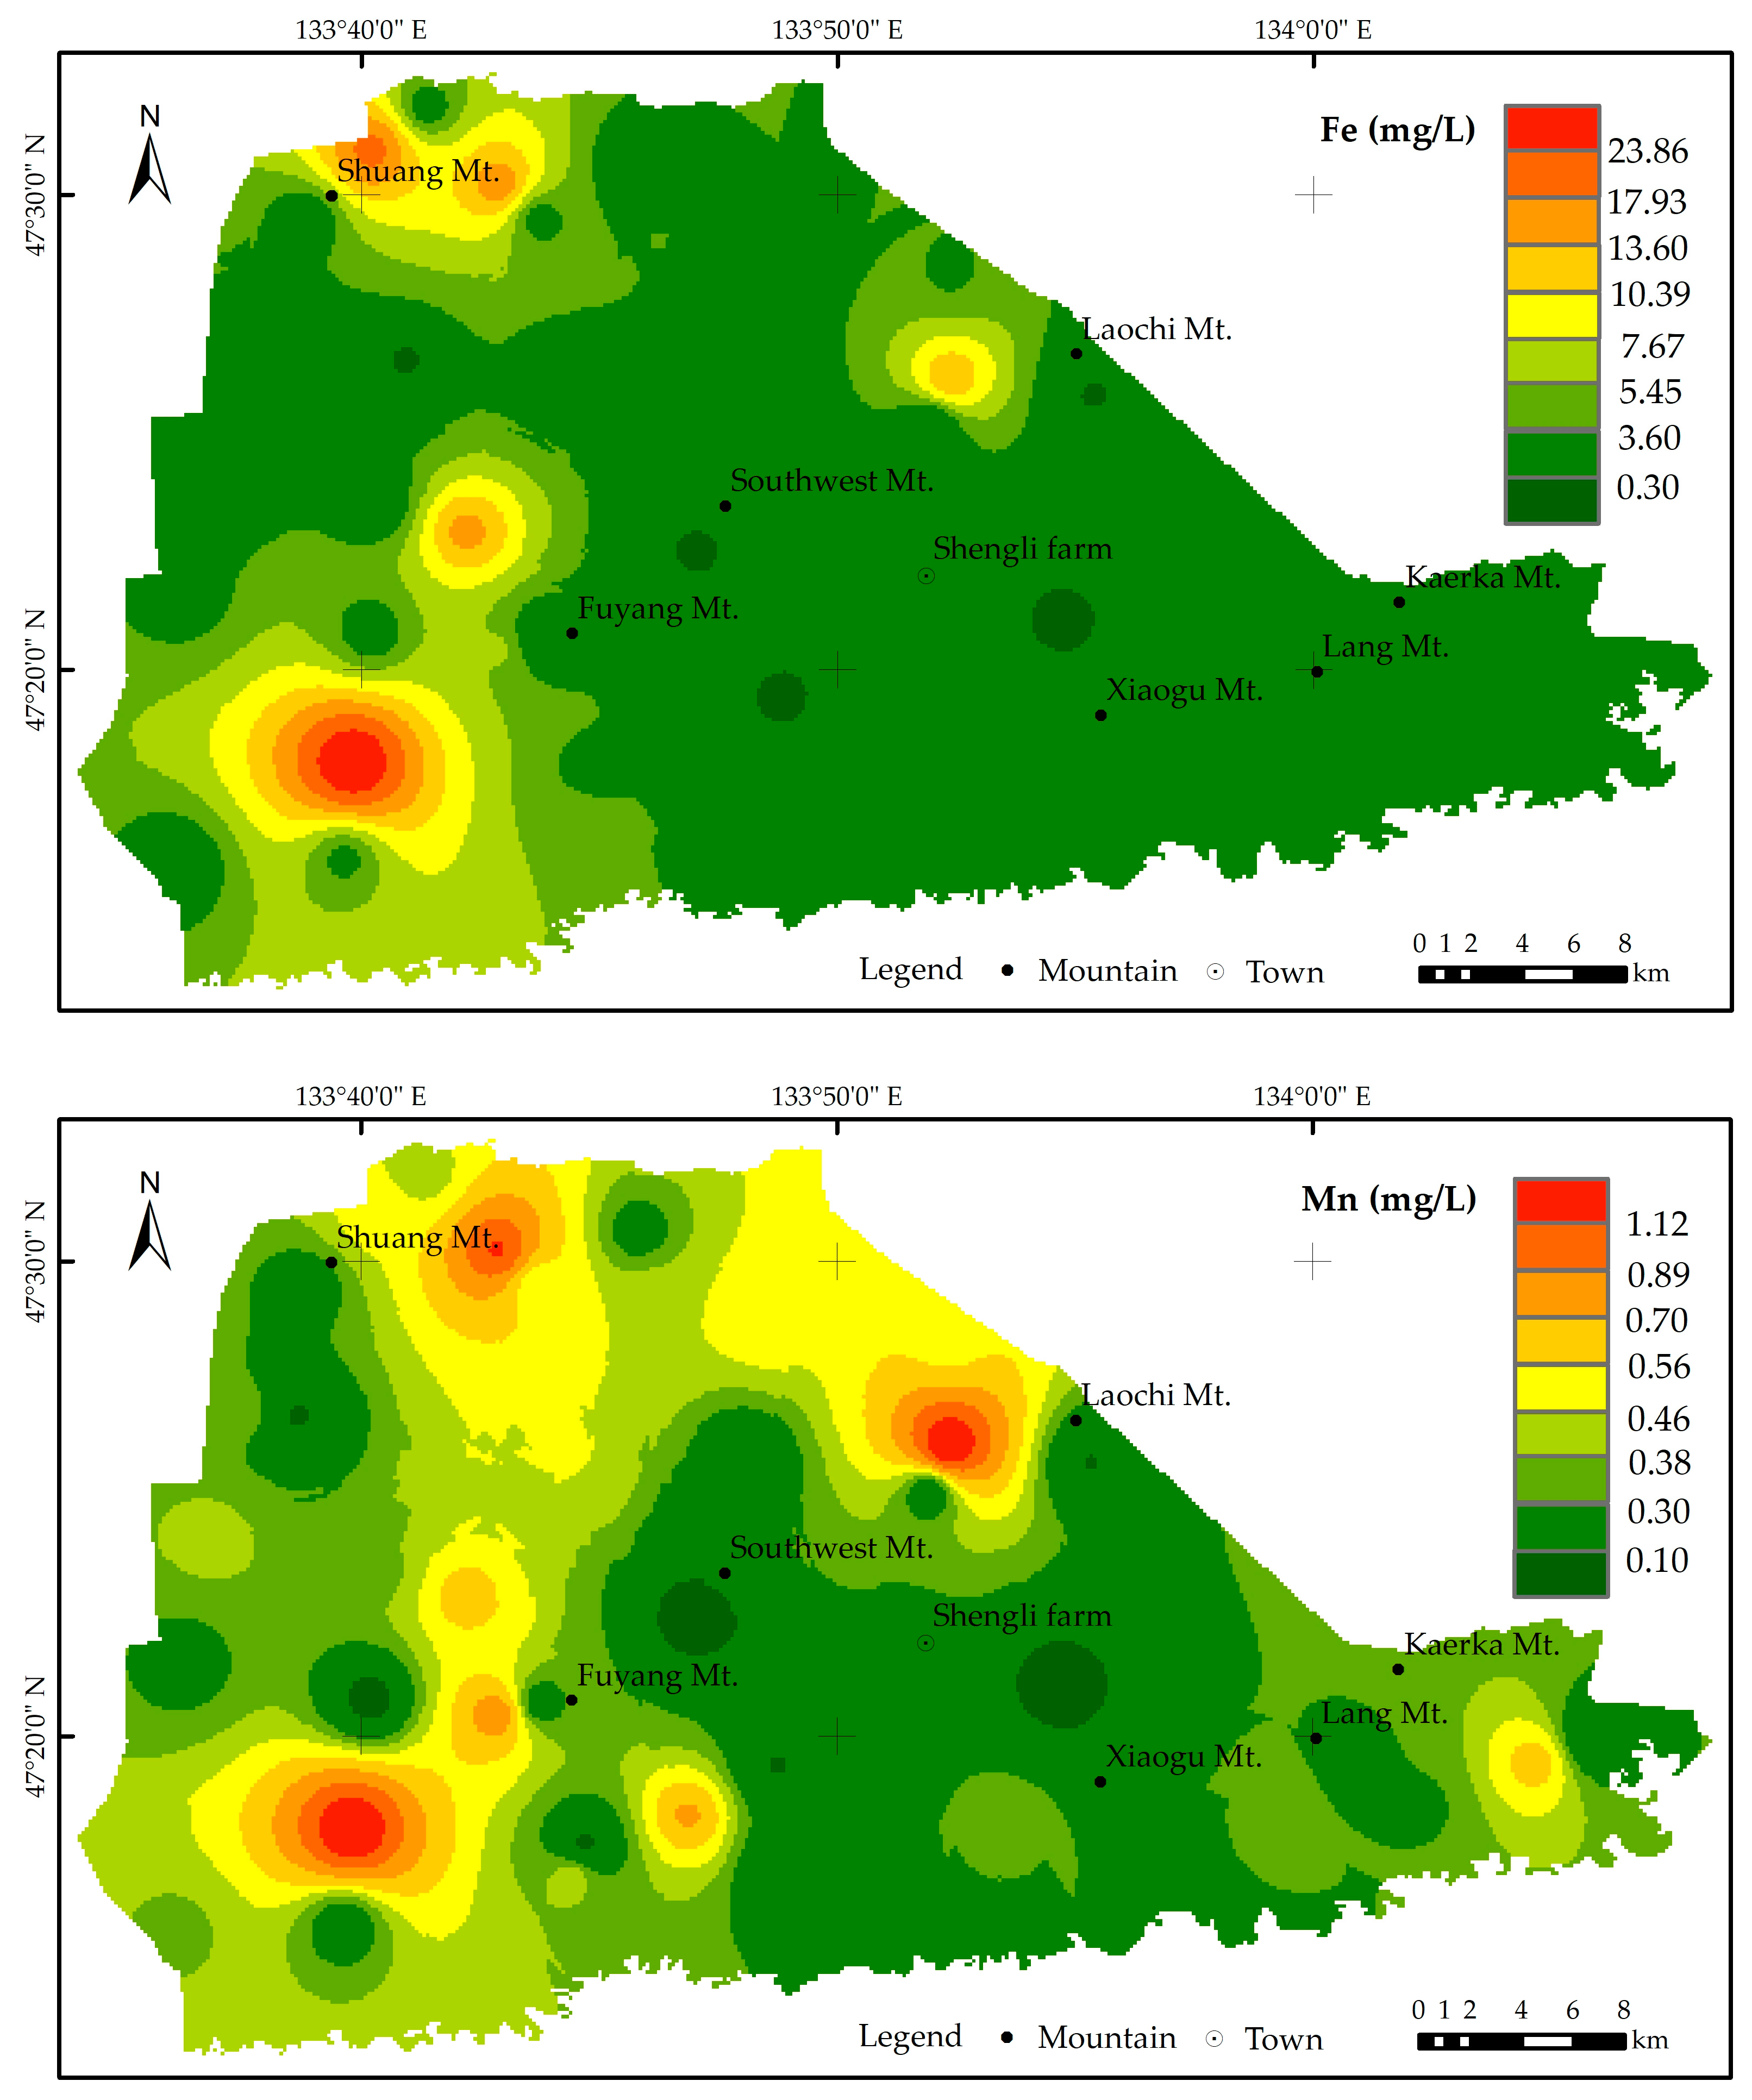
4.1. Characteristics of Iron and Manganese Contents
4.2. Cause Analysis of High-Iron and High-Manganese Groundwater in Northeastern Sanjiang Plain
4.2.1. Primary Stratigraphic Environment
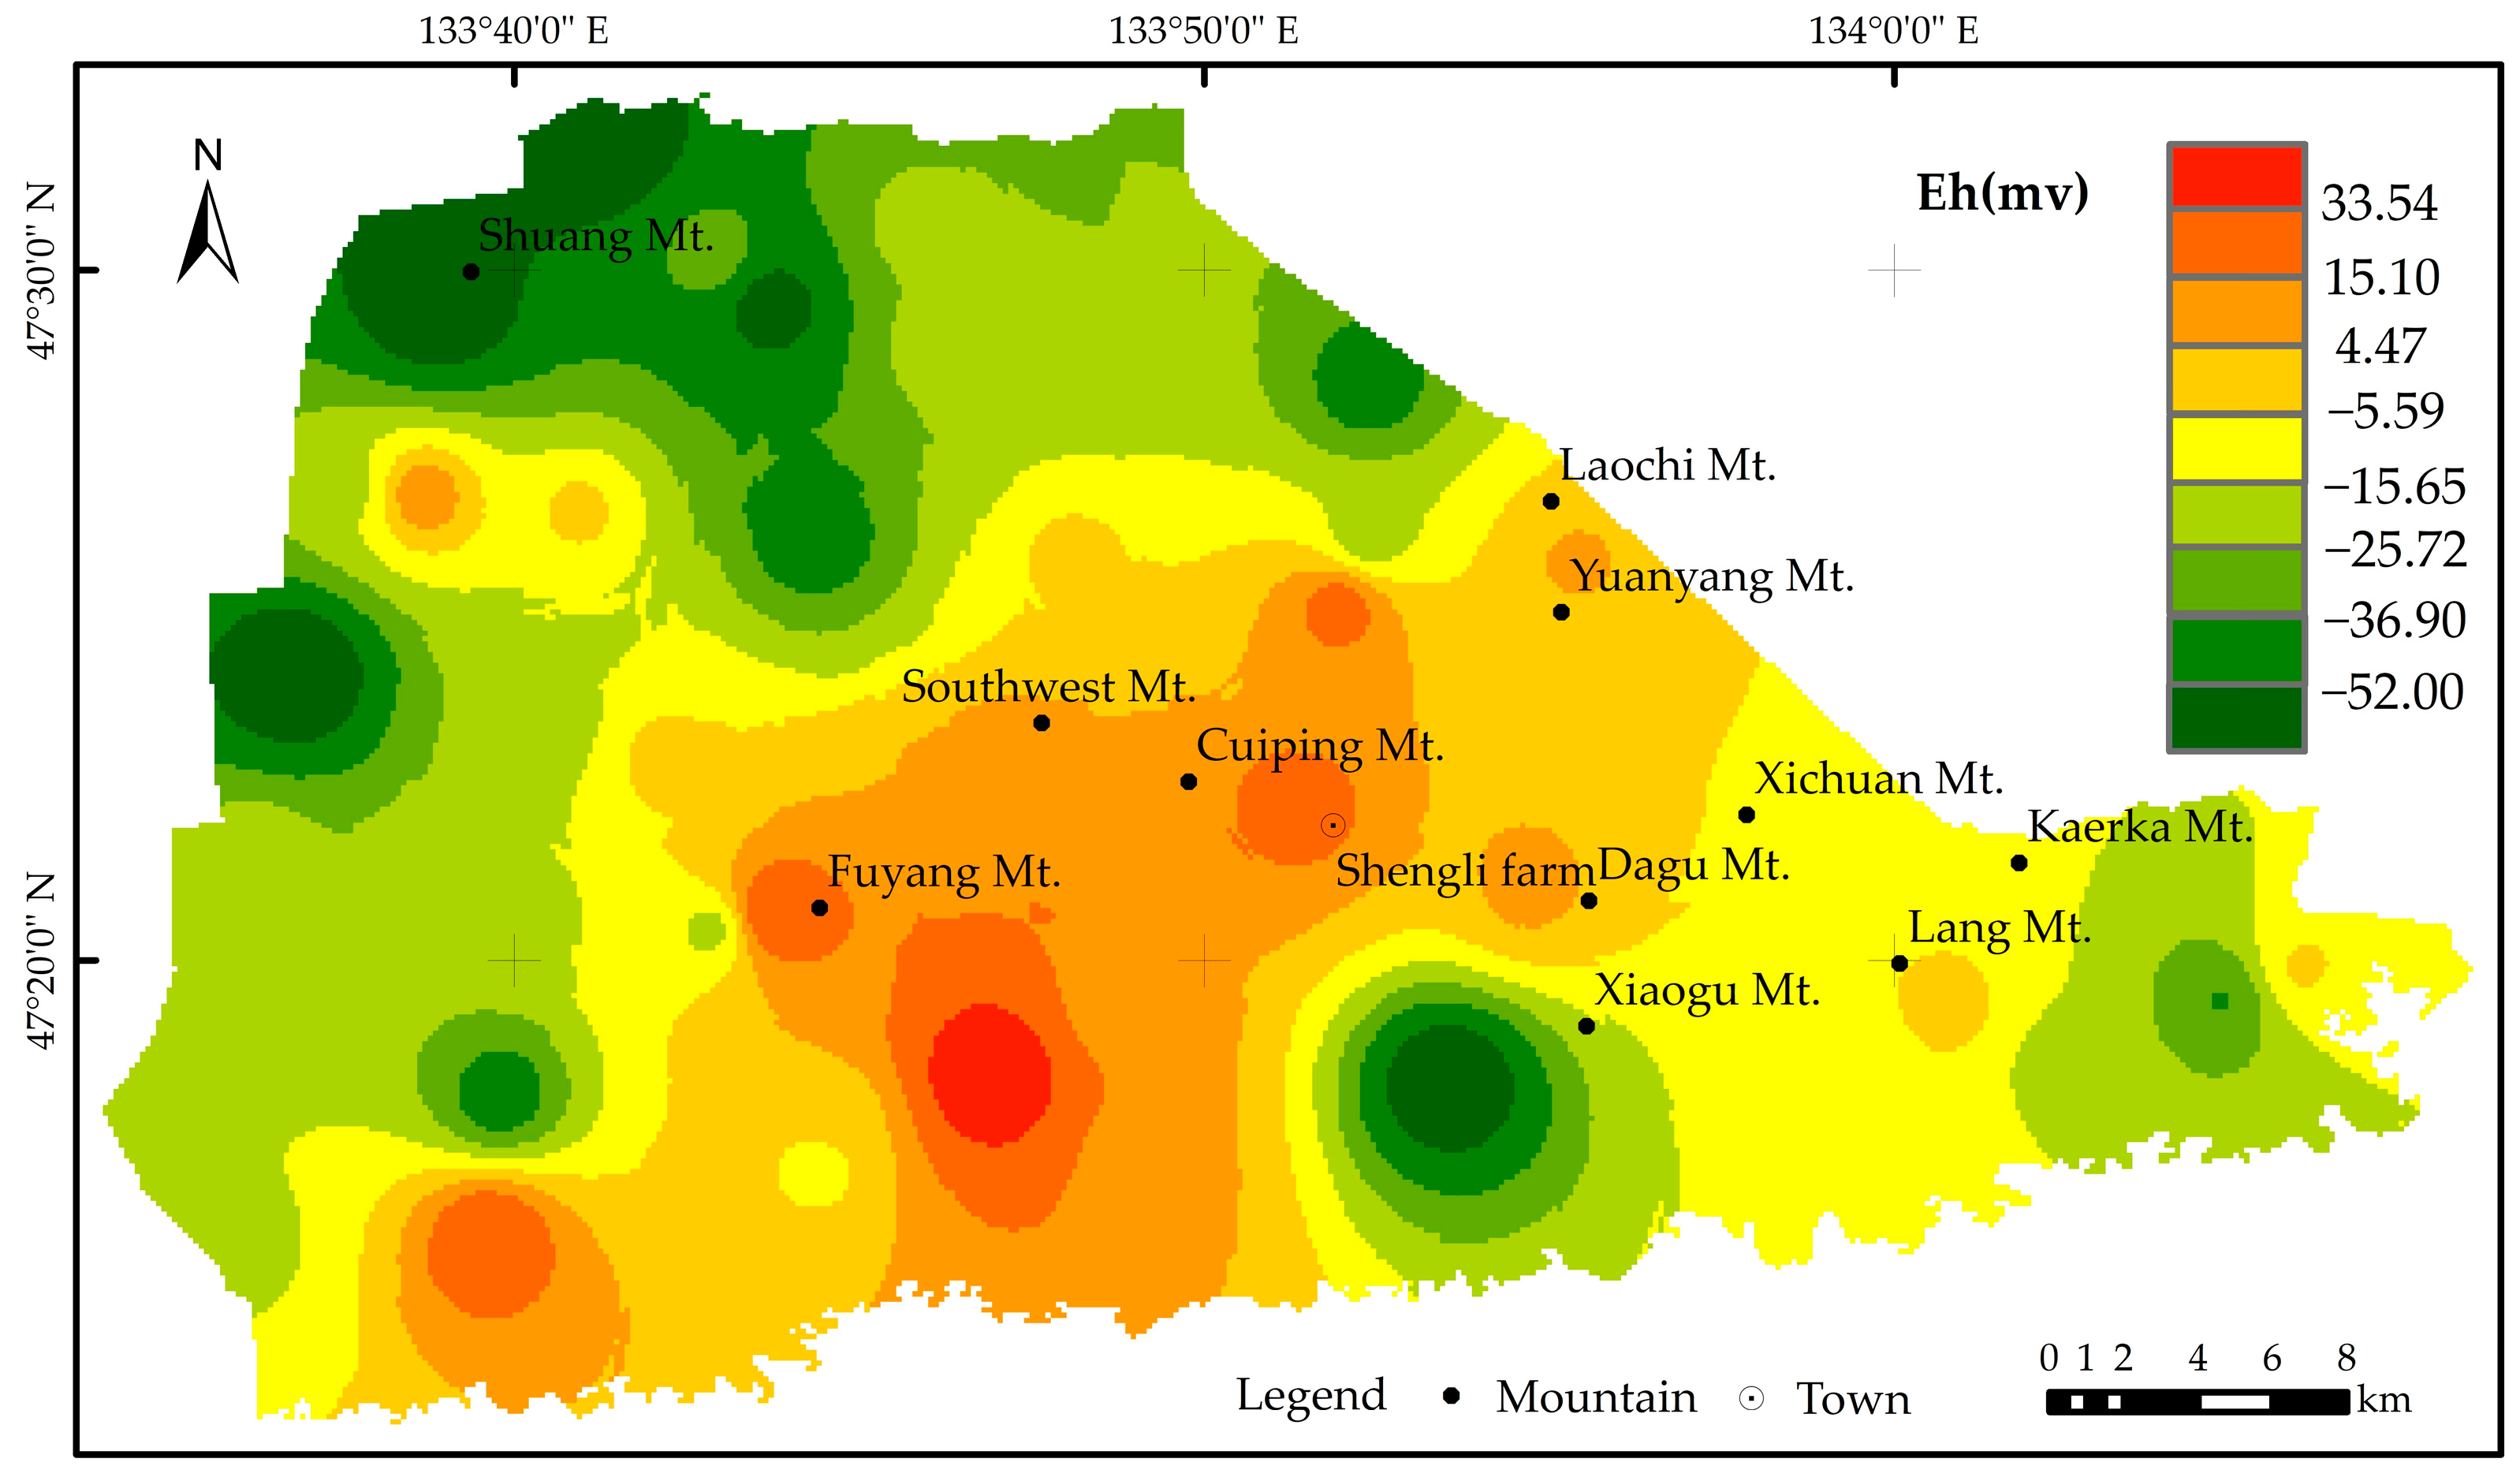
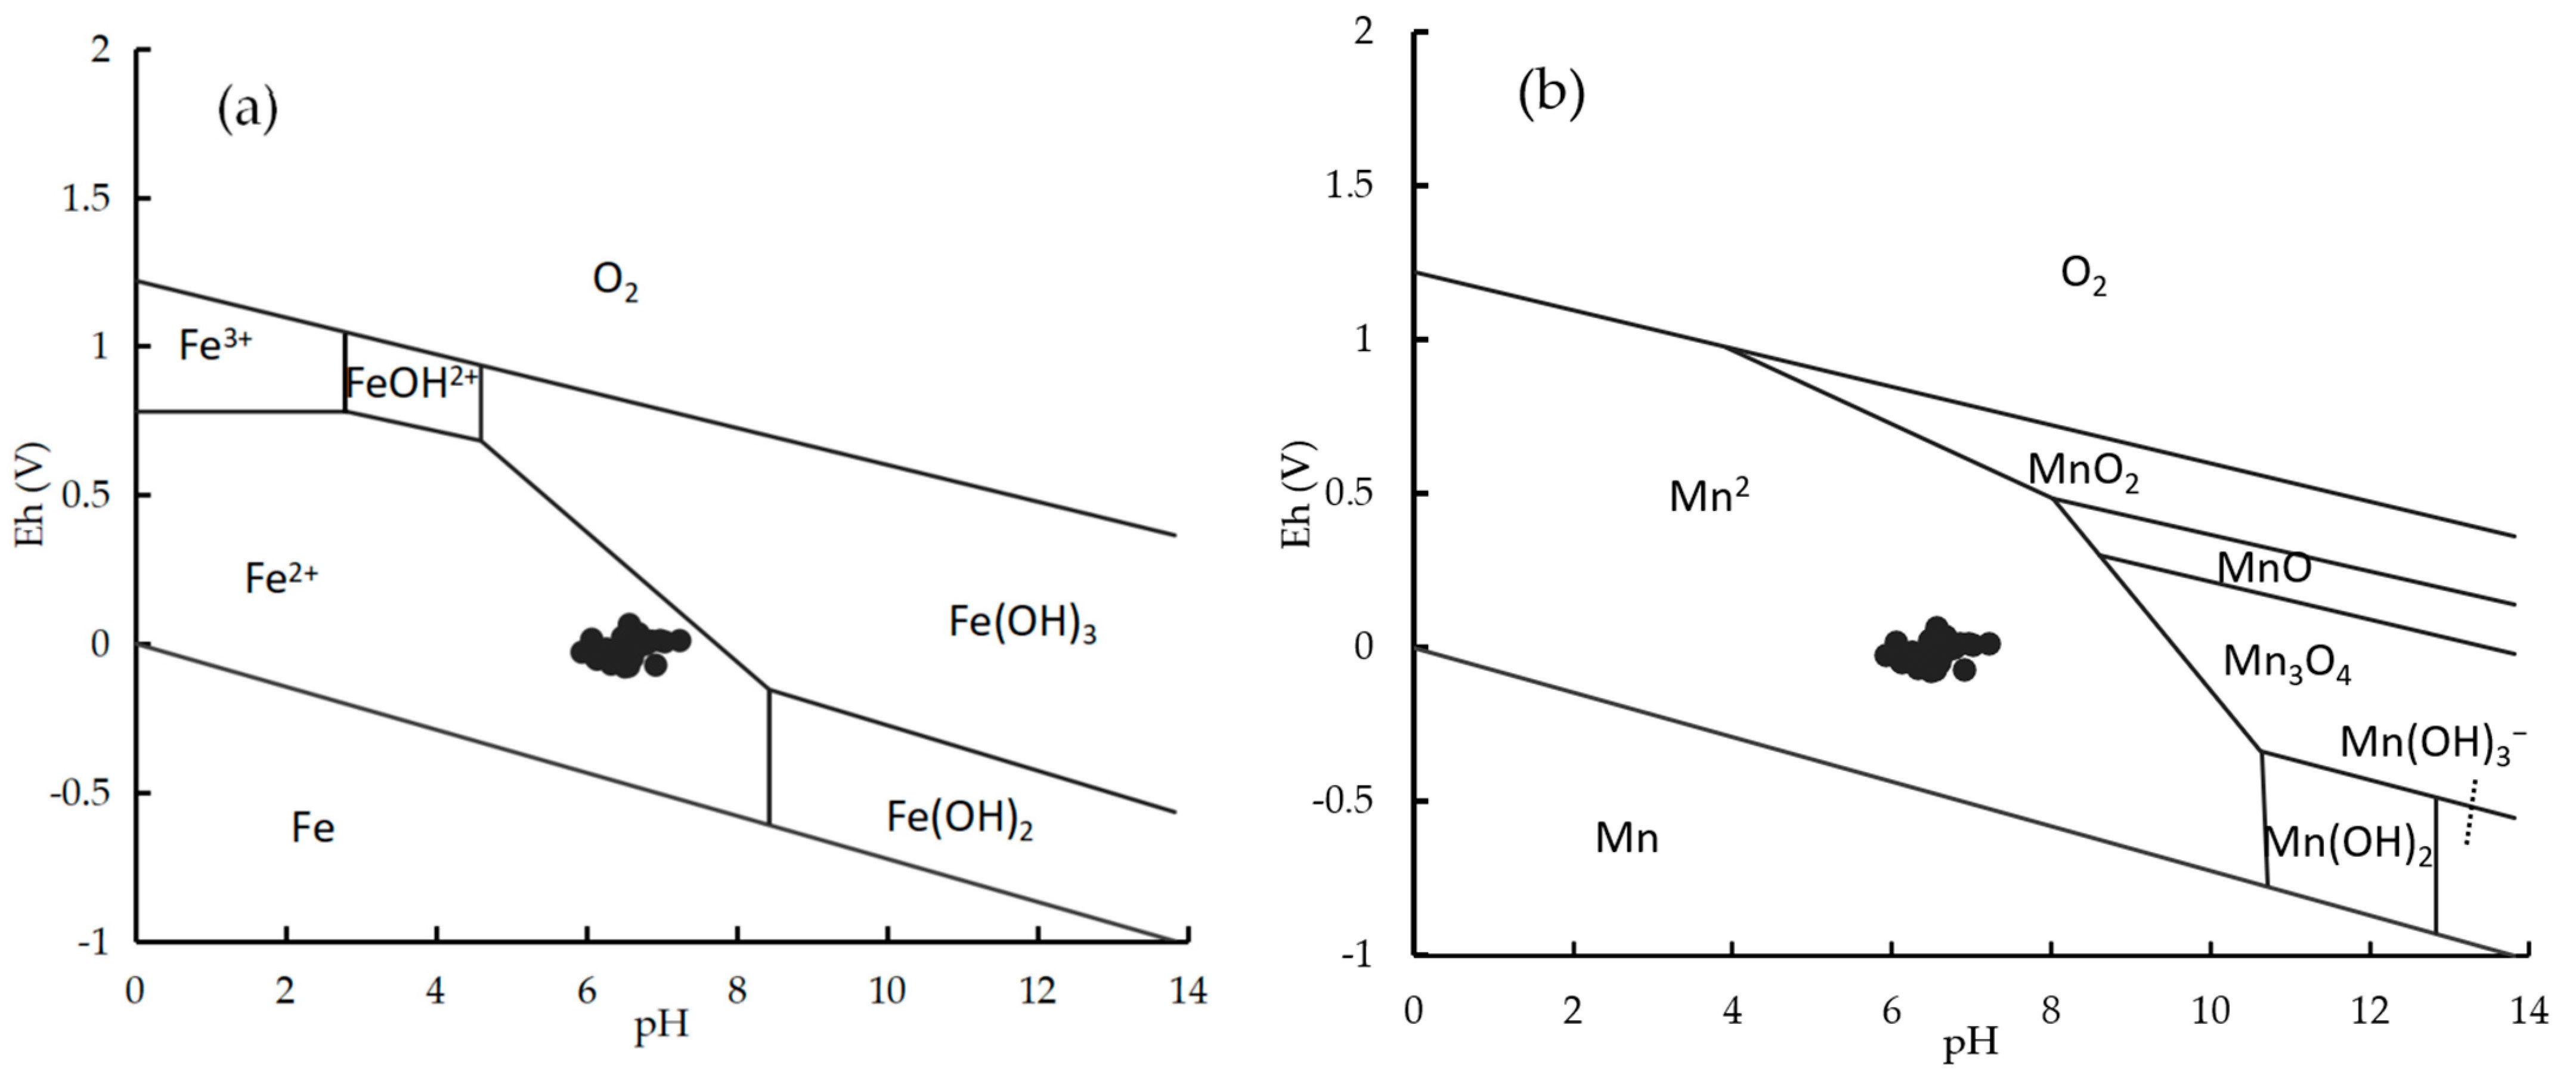
4.2.2. REDOX Condition
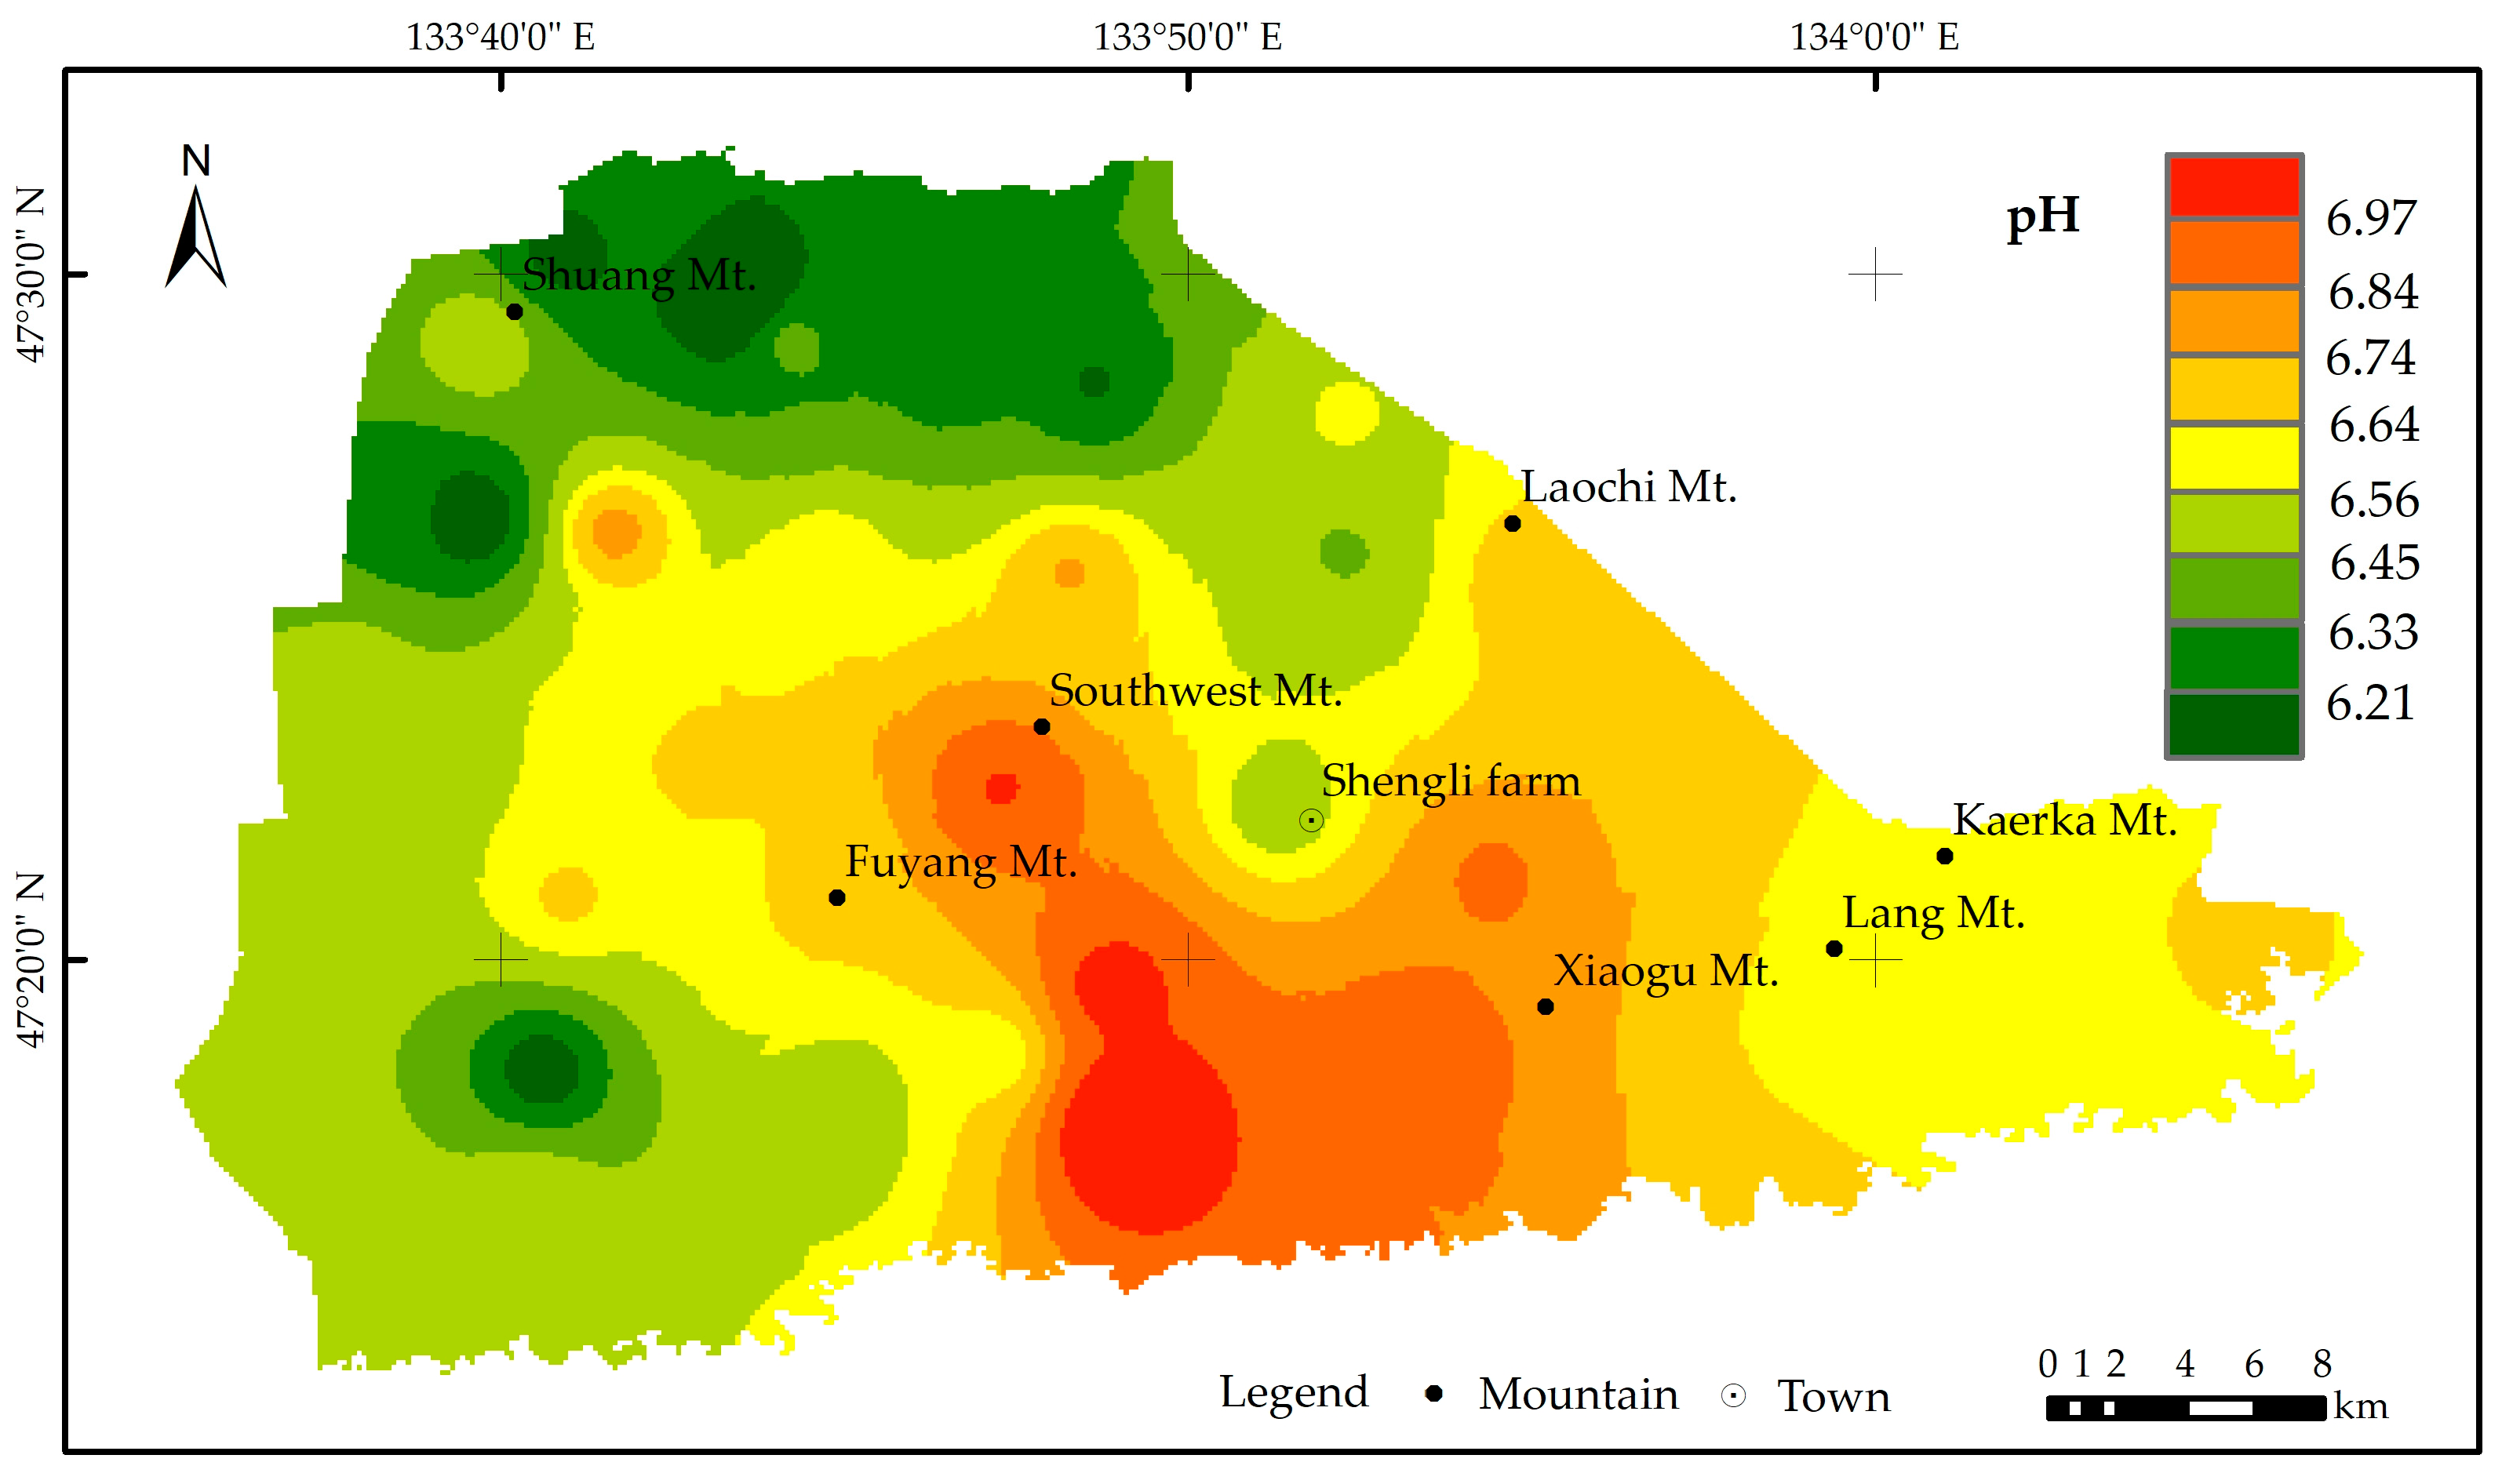
4.2.3. Acid–Base Conditions of Groundwater
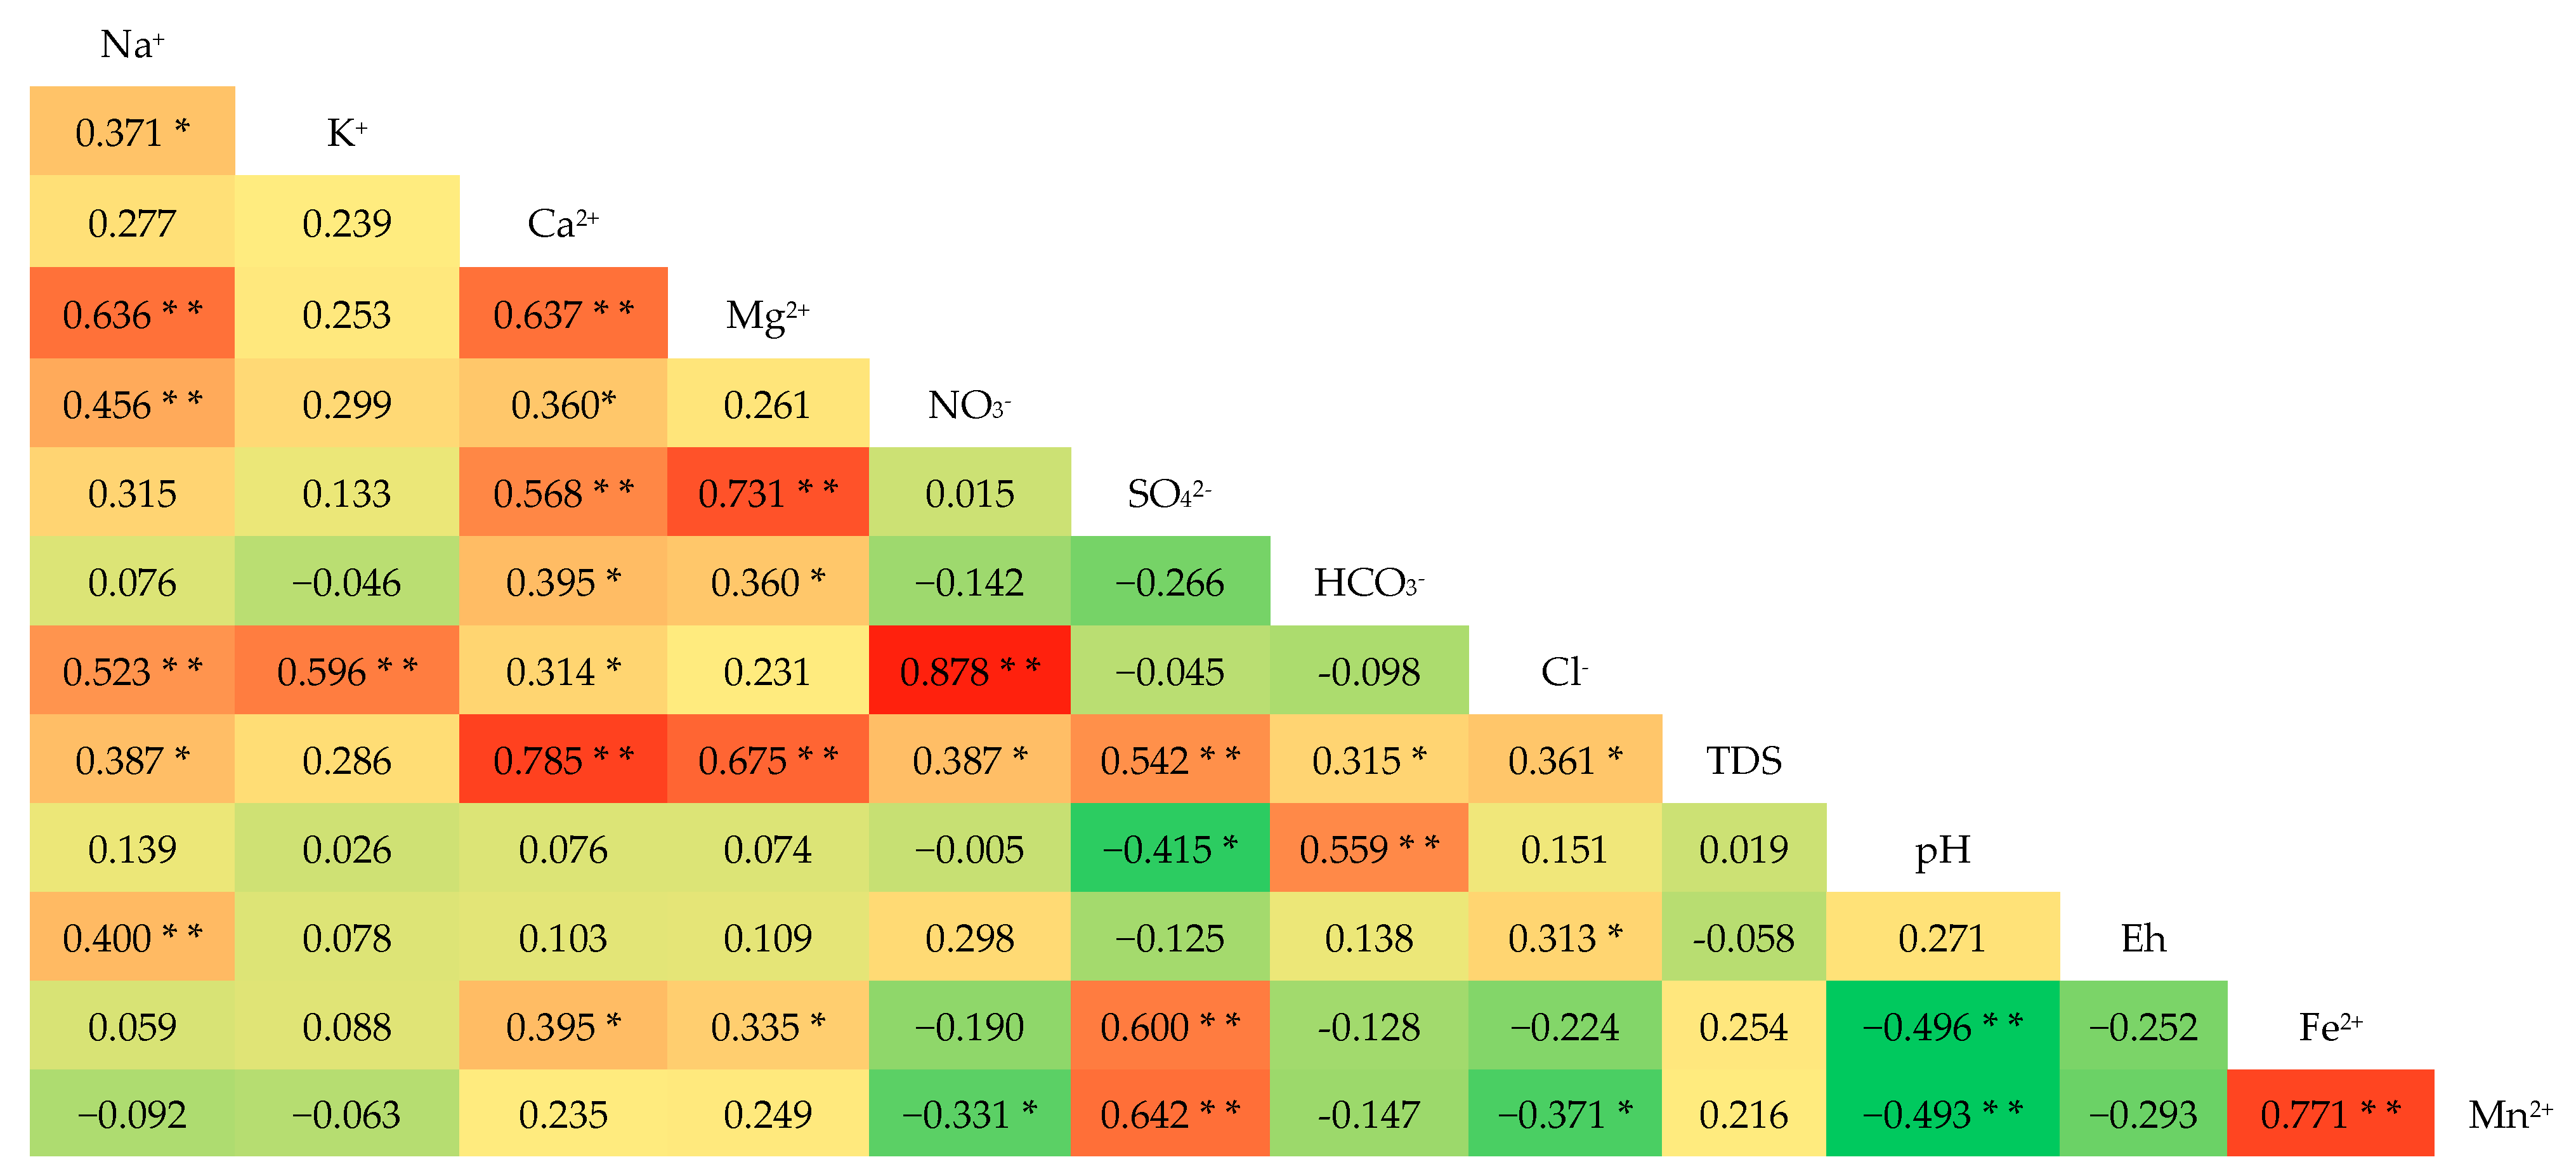
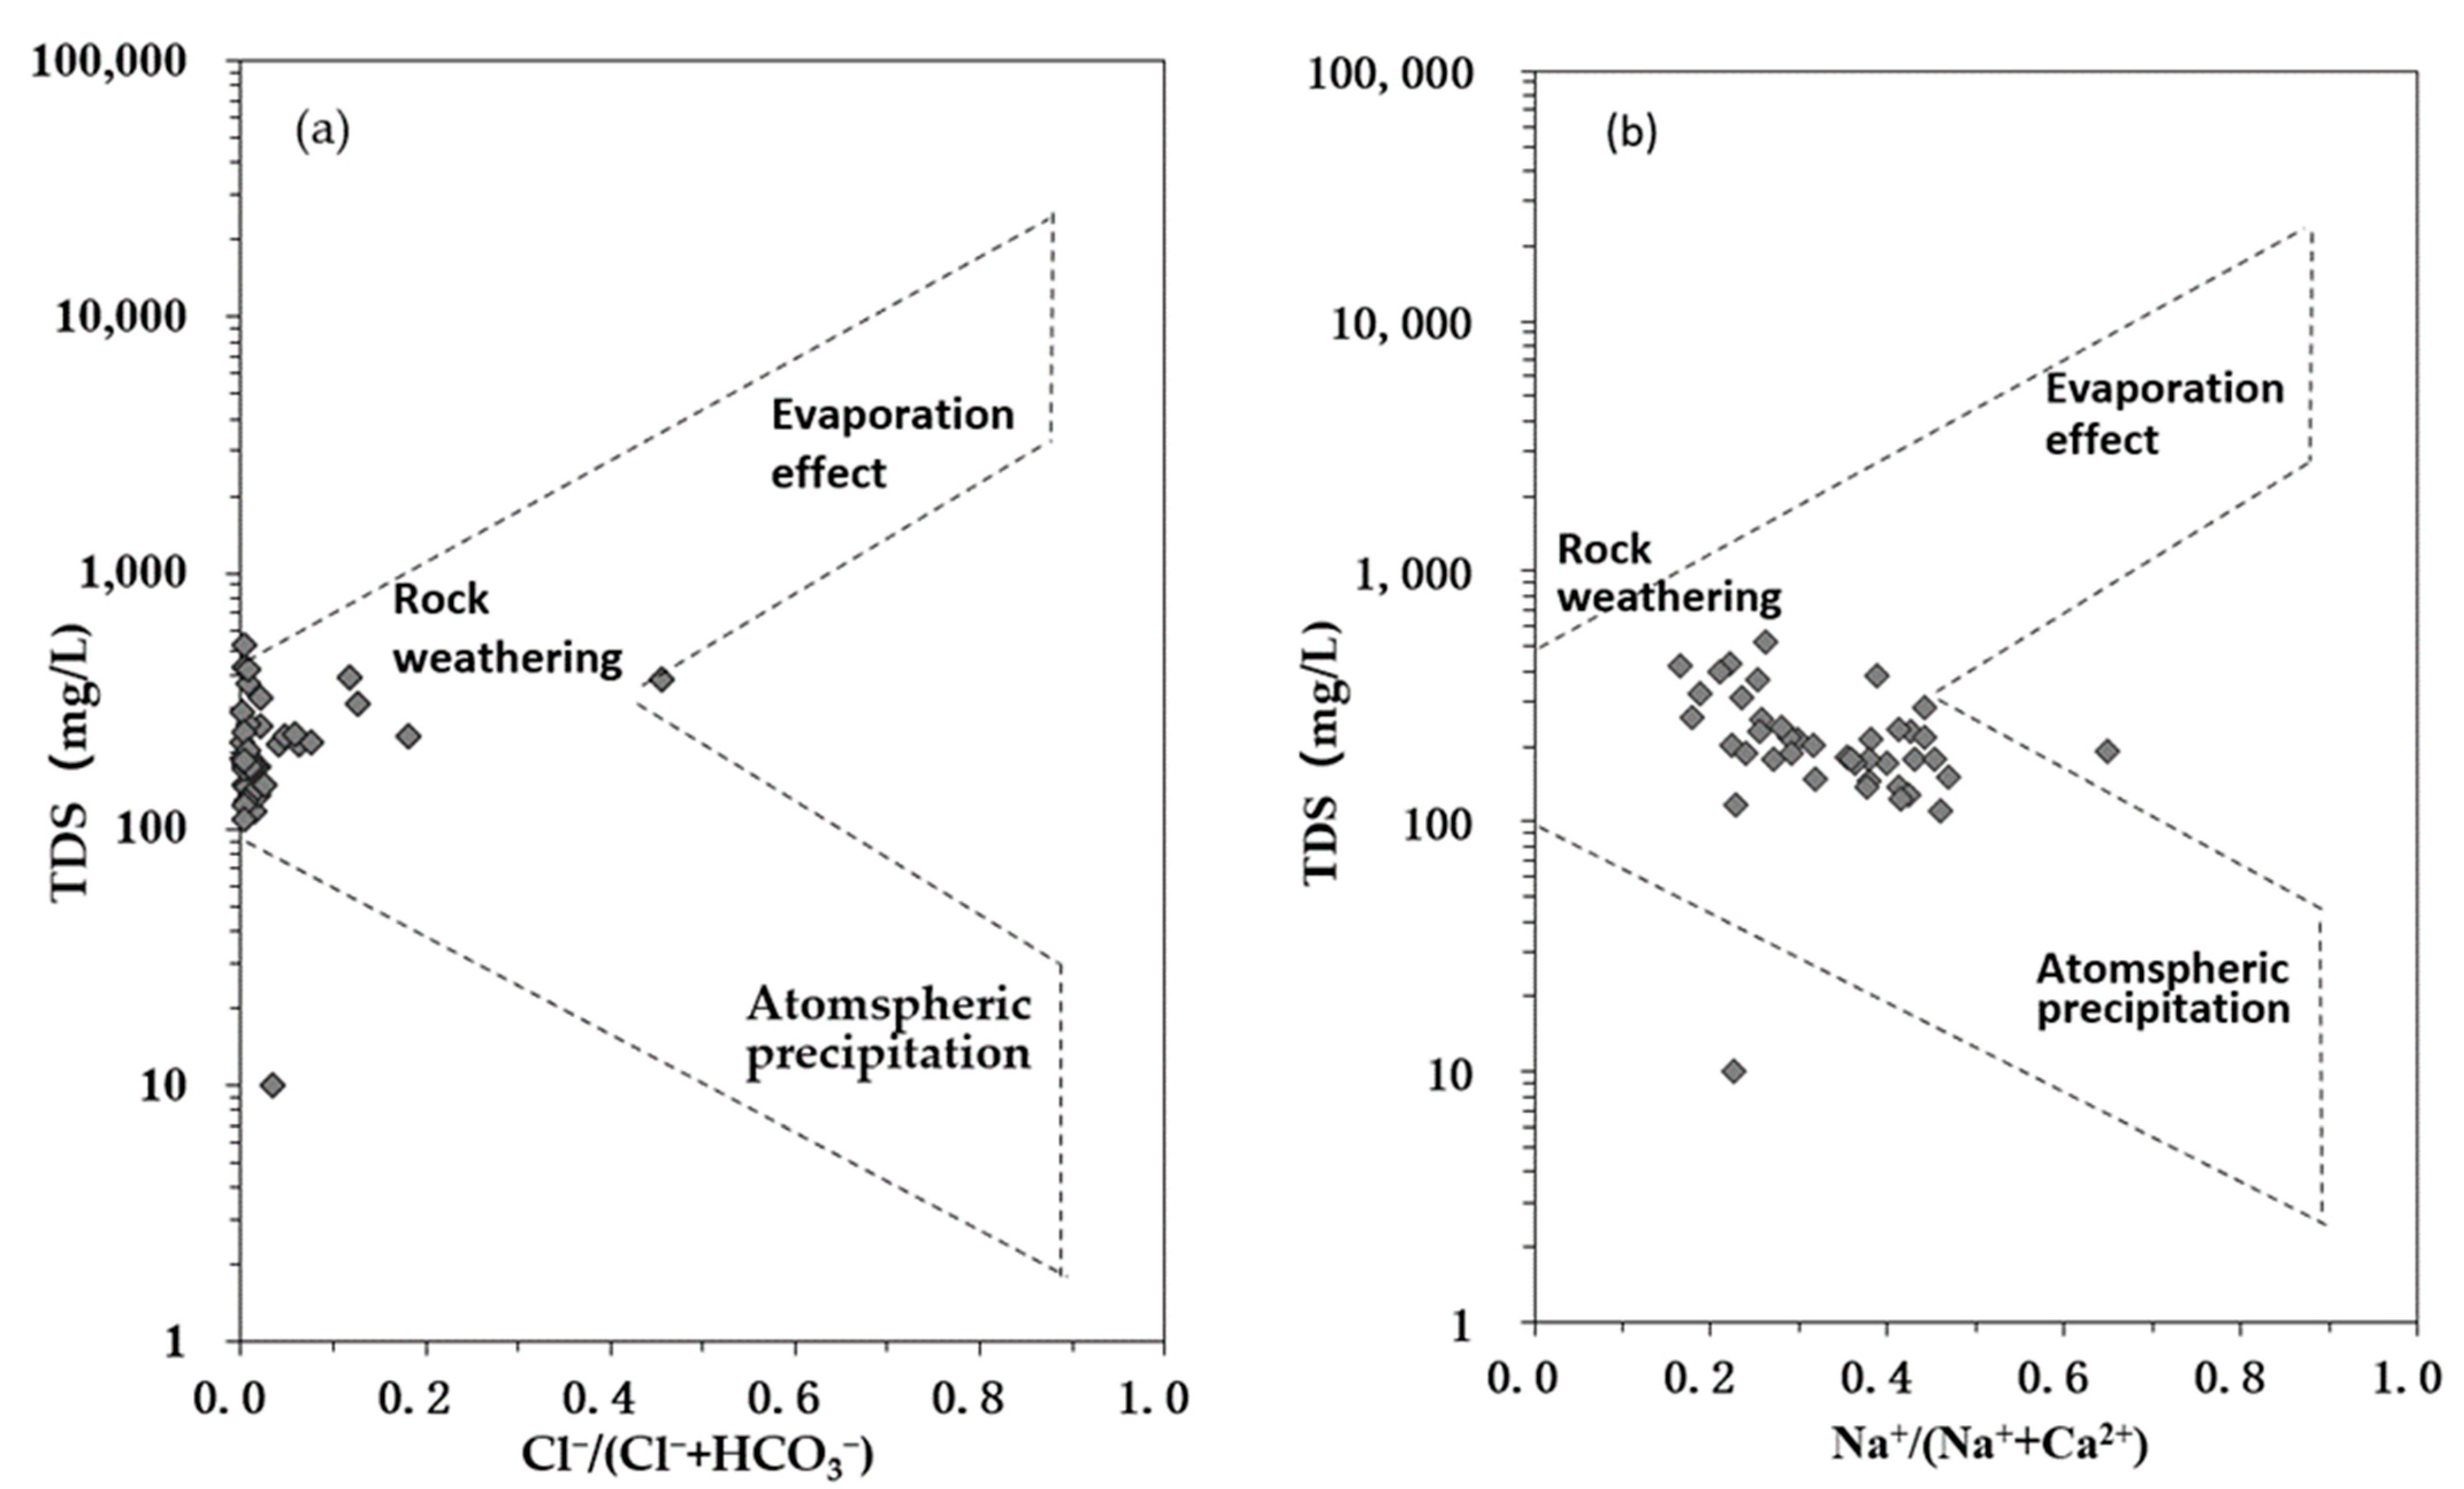
4.3. Main Ion Source Analysis
5. Conclusions
- (1)
- The range of iron content in groundwater in the study area is ND–31.55 mg/L, with a mean value of 3.78 mg/L and an excessive rate of 87.80%; the range of manganese content is ND–1.41 mg/L, with a mean value of 0.38 mg/L and an excessive rate of 82.90%; the excessive rate of iron in groundwater is higher than that of manganese, and the distribution range is wider. To ensure the safety of drinking water for residents, it is recommended that the groundwater within the area be appropriately treated before consumption.
- (2)
- The Fe and Mn in groundwater in the study area exist in the form of Fe2+ and Mn2+, respectively. The primary sources of Fe and Mn in groundwater are the Fe and Mn minerals in the original geological environment of the study area. Groundwater tends to be reduced due to surface runoff and soil organic matter, leading to excessive Fe and Mn content.
- (3)
- High mineralization and evaporation concentrations are conducive to increased Fe content, as indicated by the factor analysis results of hydrochemical indicators. There is no significant correlation between Fe2+, Mn2+ and Cl−, NO3−. The excessive content of Fe2+ and Mn2+ in groundwater is relatively less affected by human activities.
Author Contributions
Funding
Data Availability Statement
Conflicts of Interest
References
- Rushdi, M.I.; Basak, R.; Das, P.; Ahamed, T.; Bhattacharjee, S. Assessing the health risks associated with elevated manganese and iron in groundwater in Sreemangal and Moulvibazar Sadar, Bangladesh. J. Hazard. Mater. Adv. 2023, 10, 100287. [Google Scholar] [CrossRef]
- Zhai, Y.; Han, Y.; Xia, X.; Li, X.; Lu, H.; Teng, Y.; Wang, J. Anthropogenic Organic Pollutants in Groundwater Increase Releases of Fe and Mn from Aquifer Sediments: Impacts of Pollution Degree, Mineral Content, and pH. Water 2021, 13, 1920. [Google Scholar] [CrossRef]
- Podgorski, J.; Araya, D.; Berg, M. Geogenic manganese and iron in groundwater of Southeast Asia and Bangladesh—Machine learning spatial prediction modeling and comparison with arsenic. Sci. Total Environ. 2022, 833, 155131. [Google Scholar] [CrossRef]
- Guo, Y.M.; Huang, T.L.; Wen, G.; Cao, X. The simultaneous removal of ammonium and manganese from groundwater by iron-manganese co-oxide filter film: The role of chemical catalytic oxidation for ammonium removal. Chem. Eng. J. 2017, 308, 322–329. [Google Scholar] [CrossRef]
- Shvartsev, S.L. Geochemistry of fresh groundwater in the main landscape zones of the Earth. Geochem. Int. 2008, 46, 1285–1398. [Google Scholar] [CrossRef]
- Wei, M.; Huang, Q.; Dai, Y.; Zhou, H.; Cui, Y.; Song, W.; Di, D.; Zhang, R.; Li, C.; Wang, Q.; et al. Manganese, iron, copper, and selenium co-exposure and osteoporosis risk in Chinese adults. J. Trace Elem. Med. Biol. 2022, 72, 126989. [Google Scholar] [CrossRef]
- Gupta, A. Iron overload in human disease. N. Engl. J. Med. 2012, 366, 1549. [Google Scholar]
- Bhutiani, R.; Kulkarni, D.B.; Khanna, D.R.; Gautam, A. Water quality, pollution source apportionment and health risk assessment of heavy metals in groundwater of an industrial area in north India. Expo. Health 2016, 8, 3–18. [Google Scholar] [CrossRef]
- Yadav, K.K.; Kumar, S.; Pham, Q.B.; Gupta, N.; Rezania, S.; Kamyab, H.; Yadav, S.; Vymazal, J.; Kumar, V.; Tri, D.Q.; et al. Fluoride contamination, health problems and remediation methods in Asian groundwater: A comprehensive review. Ecotoxicol. Environ. Saf. 2019, 182, 109362. [Google Scholar] [CrossRef] [PubMed]
- Yunker, L.M.; Parboosingh, J.S.; Conradson, H.E.; Faris, P.; Bridge, P.J.; Buithieud, J.; Title, L.M.; Charbonneaub, F.; Verma, S.; Lonn, E.M.; et al. The effect of iron status on vascular health. Vasc. Med. 2006, 8, 3–18. [Google Scholar] [CrossRef]
- Jaafar, M.; Shrivastava, A.; Bose, S.R.; Felipe-Sotelo, M.; Ward, N.I. Transfer of arsenic, manganese and iron from water to soil and rice plants: An evaluation of changes in dietary intake caused by washing and cooking rice with groundwater from the Bengal Delta, India. J. Food Compos. Anal. 2021, 96, 103748. [Google Scholar] [CrossRef]
- Sharma, S.; Kaur, I.; Nagpal, A.K. Estimation of arsenic, manganese and iron in mustard seeds, maize grains, groundwater and associated human health risks in Ropar wetland, Punjab, India, and its adjoining areas. Environ. Monit. Assess. 2018, 190, 385. [Google Scholar] [CrossRef] [PubMed]
- GB5749-202022; Ministry of Health of the People’s Republic of China; China National Standardization Administration. Standards for Drinking Water Quality. Standard Press of China: Beijing, China, 2003. (In Chinese)
- Official J EU23.12.2020.435; Directive 2020/2184 of the European Parliament and of the Council of 16 December 2020 on the Quality of Water Intended for Human Consumption (Recast). Official Journal of the European Union: Luxembourg, 2020.
- World Health Organization. Guidelines for Drinking-Water Quality (Edition, F); World Health Organization: Geneva, Switzerland, 2011. [Google Scholar]
- Vega, M.A.; Kulkarni, H.V.; Johannesson, K.H.; Taylor, R.J.; Datta, S. Mobilization of co-occurring trace elements (CTEs) in arsenic contaminated aquifers in the Bengal Basin. Appl. Geochem. 2020, 122, 104709. [Google Scholar] [CrossRef]
- Johnson, C.; Nandi, A.; Joyner, T.; Luffman, I. Iron and Manganese in Groundwater: Using Kriging and GIS to Locate High Concentrations in Buncombe County, North Carolina. Groundwater 2017, 56, 87–95. [Google Scholar] [CrossRef]
- Sharma, G.K.L.; Jena, R.K.; Ray, P.; Yadav, K.K.; Moharana, P.C.; Cabral-Pinto, M.M.; Bordoloi, B. Evaluating the geochemistry of groundwater contamination with iron and manganese and probabilistic human health risk assessment in endemic areas of the world’s largest River Island, India. Environ. Toxicol. Pharmacol. 2021, 87, 103690. [Google Scholar] [CrossRef]
- Hu, M.; Zhou, P.; Chen, C. Spatial and temporal distribution and affecting factors of iron and manganese in the groundwater in the middle area of the Yangtze River Basin, China. Environ. Sci. Pollut. Res. Int. 2022, 29, 61204–61221. [Google Scholar] [CrossRef] [PubMed]
- Li, T.; Zhang, F.; Meng, L. Occurrence, distribution, and prediction of iron and manganese in groundwater of opencast mines: An example from Inner Mongolia, China. Environ. Monit. Assess. 2021, 193, 544. [Google Scholar]
- Zhang, Z.; Xiao, C.; Yang, W.; Adeyeye, O.A.; Liang, X. Effects of the natural environment and human activities on iron and manganese content in groundwater: A case study of Changchun city, Northeast China. Environ. Sci. Pollut. Res. Int. 2021, 28, 41109–41119. [Google Scholar] [CrossRef]
- Huang, B.; Li, Z.; Chen, Z.; Chen, G.; Zhang, C.; Huang, J.; Nie, X.; Xiong, W.; Zeng, G. Study and health risk assessment of the occurrence of iron and manganese in groundwater at the terminal of the Xiangjiang River. Environ. Sci. Pollut. Res. Int. 2015, 22, 19912–19921. [Google Scholar] [CrossRef]
- Yin, X.; Jiang, B.; Feng, Z.; Yao, B.; Shi, X.; Sun, Y.; Wu, J. Comprehensive evaluation of shallow groundwater quality in central and southern Jiangsu Province, China. Environ. Earth Sci. 2017, 76, 400. [Google Scholar] [CrossRef]
- Huang, S.; Chen, L.; Li, J.; Xu, J.; Xie, W.; Zhang, C. The effects of colloidal Fe and Mn on P distribution in groundwater system of Jianghan Plain, China. Sci. Total Environ. 2023, 854, 158739. [Google Scholar] [CrossRef]
- Zhai, Y.; Cao, X.; Xia, X.; Wang, B.; Teng, Y.; Li, X. Elevated Fe and Mn Concentrations in Groundwater in the Songnen Plain, Northeast China, and the Factors and Mechanisms Involved. Agronomy 2021, 11, 2392. [Google Scholar] [CrossRef]
- Wu, A.; Hao, A.; Guo, H.; Liu, J.; Zhang, E.; Wang, H.; Wang, X.; Wen, X.; Zhang, C. Main progress and prospect for China’s hydrogeological survey. J. Groundw. Sci. Eng. 2020, 8, 195–209. [Google Scholar]
- Wang, L.; Meng, X.; Xu, H. Analysis of Causes of Superstandard Fe and Mn Content in source water of Catchment Area in Jiamusi. Environ. Sci. Manag. 2006, 31, 152–153. (In Chinese) [Google Scholar]
- Ma, H.; Li, X.; Cui, J.; Yang, Z. A Preliminary Study on The Organic and Inorganic Pollution of Groundwater of Jiansanjiang Farm of Sanjiang Plain. Geol. Resour. 2014, 23, 38–41. (In Chinese) [Google Scholar]
- Ilyushin, Y.V.; Asadulagi, M.-A.M. Development of a Distributed Control System for the Hydrodynamic Processes of Aquifers, Taking into Account Stochastic Disturbing Factors. Water 2023, 15, 770. [Google Scholar] [CrossRef]
- Martirosyan, A.V.; Martirosyan, K.V.; Mir-Amal, A.M.; Chernyshev, A.B. Assessment of a Hydrogeological Object’s Distributed Control System Stability. In Proceedings of the 2022 Conference of Russian Young Researchers in Electrical and Electronic Engineering (ElConRus), Saint Petersburg, Russia, 25–28 January 2022; pp. 768–771. [Google Scholar]
- Liu, J.; Peng, Y.; Li, C.; Gao, Z.; Chen, S. Characterization of the hydrochemistry of water resources of the Weibei Plain, Northern China, as well as an assessment of the risk of high groundwater nitrate levels to human health. Environ. Pollut. 2021, 268, 115947. [Google Scholar] [CrossRef]
- Xing, W.; Wei, L.; Ma, W.; Li, J.; Liu, X.; Hu, J.; Wang, X. Geochemistry and Sources Apportionment of Major Ions and Dissolved Heavy Metals in a Small Watershed on the Tibetan Plateau. Water 2022, 14, 3856. [Google Scholar] [CrossRef]
- Abesser, C.; Robinson, R.; Soulsby, C. Iron and manganese cycling in the storm runoff of a Scottish upland catchment. J. Hydrol. 2006, 326, 59–78. [Google Scholar] [CrossRef]
- Palmucci, W.; Rusi, S.; Di Curzio, D. Mobilisation processes responsible for iron and manganese contamination of groundwater in Central Adriatic Italy. Environ. Sci. Pollut. Res. Int. 2016, 23, 11790–11805. [Google Scholar] [CrossRef]
- Ewusi, A.; Sunkari, E.D.; Seidu, J.; Coffie-Anum, J. Hydrogeochemical characteristics, sources and human health risk assessment of heavy metal dispersion in the mine pit water–surface water-groundwater system in the largest manganese mine in Ghana. Environ. Technol. Innov. 2022, 26, 102312. [Google Scholar] [CrossRef]
- Rizwan, K.M.; Thirukumaran, V.; Suresh, M. Assessment and source identification of heavy metal contamination of groundwater using geospatial technology in Gadilam River basin, Tamil Nadu, India. Appl. Water Sci. 2021, 11, 102. [Google Scholar] [CrossRef]
- Bacquart, T.; Frisbie, S.; Mitchell, E.; Grigg, L.; Cole, C.; Small, C.; Sarkar, B. Multiple inorganic toxic substances contaminating the groundwater of Myingyan Township, Myanmar: Arsenic, manganese, fluoride, iron, and uranium. Sci. Total Environ. 2015, 517, 232–245. [Google Scholar] [CrossRef] [PubMed]
- Solano, S.C.; Ingrid, V.-A.; Rolando, C.-M.; Huapaya, R.P.S. Multivariate data analysis applied to groundwater geochemical characterization, Central Pacific, Costa Rica. Appl. Geochem. 2023, 151, 105599. [Google Scholar] [CrossRef]
- Luo, M.; Zhang, Y.; Li, H.; Hu, W.; Xiao, K.; Yu, S.; Zheng, C.; Wang, X. Pollution assessment and sources of dissolved heavy metals in coastal water of a highly urbanized coastal area: The role of groundwater discharge. Sci. Total Environ. 2022, 807, 151070. [Google Scholar] [CrossRef]
- Zheng, Y.; Wu, Y.; Pan, X.; Qi, P.; Dai, C.; Zhang, G. Evolution characteristics of meteorological and hydrological drought in Sanjiang Plain. Res. Soil Water Conserv. 2019, 26, 177–184+189. (In Chinese) [Google Scholar]
- Shu, L.; Yin, X.; Yuan, Y.; Lu, Y.; Lu, C.; Liu, B. Temporal and spatial variation of water quantity exchange between surface water and ground water in typical district of Sanjiang Plain. Shuilixuebao 2021, 52, 1151–1162. (In Chinese) [Google Scholar]
- HJ164-2020; Ministry of Ecology and Environment of the People’s Republic of China. Technical Specifications for Environmental Monitoring of Groundwater. China Environment Publishing Group: Beijing, China, 2020. (In Chinese)
- GB5750-2006; Ministry of Health of the People’s Republic of China; China National Standardization Administration. Sanitary Standard Test Method for Drinking Water. Standard Press of China: Beijing, China, 2007. (In Chinese)
- Chakraborty, M.; Mishra, A.K.; Mukherjee, A. Influence of hydrogeochemical reactions along flow paths on contrasting groundwater arsenic and manganese distribution and dynamics across the Ganges River. Chemosphere 2022, 287, 132144. [Google Scholar] [CrossRef]
- Li, C.; Gao, X.; Wang, Y. Hydrogeochemistry of high-fluoride groundwater at Yuncheng Basin, northern China. Sci. Total Environ. 2015, 508, 155–165. [Google Scholar] [CrossRef]
- Peng, C.; Liu, Y.; Chen, H.; Yuan, Q.; Chen, Q.; Mei, S.; Wu, Z. Analysis of Hydrogeochemical Characteristics of Tunnel Groundwater Based on Multivariate Statistical Technology. Geofluids 2021, 2021, 4867942. [Google Scholar] [CrossRef]
- Sun, W.; Zhang, E.; Chen, R.; Shen, J. Lacustrine carbon cycling since the last interglaciation in northeast China: Evidence from n-alkanes in the sediments of Lake Xingkai. Quat. Int. 2019, 523, 101–108. [Google Scholar] [CrossRef]
- Khozyem, H.; Hamdan, A.; Tantawy, A.A.; Emam, A.; Elbadry, E. Distribution and origin of iron and manganese in groundwater: Case study, Balat-Teneida area, El-Dakhla Basin, Egypt. Arab. J. Geosci. 2019, 12, 523. [Google Scholar] [CrossRef]
- Carretero, S.; Kruse, E. Iron and manganese content in groundwater on the northeastern coast of the Buenos Aires Province, Argentina. Environ. Earth Sci. 2015, 73, 1983–1995. [Google Scholar] [CrossRef]
- Mao, D.H.; Wang, Z.M.; Li, L.; Miao, Z.H.; Ma, W.H.; Song, C.C.; Ren, C.Y.; Jia, M.M. Soil organic carbon in the Sanjiang Plain of China: Storage, distribution and controlling factors. Biogeosciences 2015, 12, 1635–1645. [Google Scholar] [CrossRef]
- Wang, M.; Yang, L.; Li, J.; Liang, Q. The Evaluation and Sources of Heavy Metal Anomalies in the Surface Soil of Eastern Tibet. Minerals 2023, 13, 86. [Google Scholar] [CrossRef]


| Parameter | Method | Wavelength (nm) | Detection Limit | RSD (%) | RD (%) |
|---|---|---|---|---|---|
| K+ | ICP-OES | 766.490 | 0.04 | 6.72 | 0~0.76 |
| Mg2+ | ICP-OES | 279.077 | 0.006 | 4.52 | 0~1.20 |
| Ca2+ | ICP-OES | 315.887 | 0.02 | 3.12 | 0~0.27 |
| Na+ | ICP-OES | 589.592 | 0.15 | 2.69 | 0.6~3.42 |
| Fe2+ | ICP-OES | 259.939 | 0.013 | 3.42 | 0~1.36 |
| Mn2+ | ICP-OES | 257.610 | 0.008 | 2.25 | 0~2.25 |
| Cl− | IC | 0.007 | 2.32 | 0~0.93 | |
| SO42− | IC | 0.018 | 2.10 | 0~0.91 | |
| NO3− | IC | 0.016 | 1.81 | 0~3.12 | |
| HCO3− | VOL | 5 | 2.80 | 0 |
| Parameters | PH | K+ | Na+ | Ca2+ | Mg2+ | HCO3− | SO42− | NO3− | Cl− | TDS | Fe2+ | Mn2+ | Eh |
|---|---|---|---|---|---|---|---|---|---|---|---|---|---|
| Mean | 6.54 | 1.90 | 15.92 | 34.51 | 12.28 | 178.03 | 40.28 | 9.90 | 5.93 | 227.68 | 3.78 | 0.38 | −15.76 |
| Min | 5.94 | 0.56 | 5.74 | 14.56 | 6.32 | 64.07 | 0.10 | 0.01 | 0.42 | 110.00 | 0.01 | 0.01 | −78.30 |
| Max | 7.24 | 7.89 | 30.81 | 92.71 | 32.96 | 353.92 | 217.85 | 114.60 | 53.66 | 521.00 | 31.55 | 1.41 | 64.31 |
| S.D. a | 0.26 | 1.23 | 5.13 | 17.82 | 5.58 | 63.75 | 53.45 | 22.88 | 11.64 | 96.07 | 6.39 | 0.33 | 31.71 |
| C.V. b | 0.04 | 0.65 | 0.32 | 0.52 | 0.45 | 0.36 | 1.33 | 2.31 | 1.96 | 0.42 | 1.69 | 0.86 | −2.01 |
| Element | F1 | F2 | F3 |
|---|---|---|---|
| Na+ | 0.461 | 0.385 | −0.162 |
| K+ | 0.601 | 0.448 | −0.311 |
| Mg2+ | 0.940 | −0.041 | 0.087 |
| Ca2+ | 0.837 | 0.043 | 0.427 |
| NO3− | 0.453 | 0.692 | −0.269 |
| SO42− | 0.784 | −0.453 | −0.118 |
| HCO3− | 0.074 | 0.171 | 0.926 |
| Cl− | 0.439 | 0.809 | −0.227 |
| Fe2+ | 0.543 | −0.666 | −0.043 |
| Mn2+ | 0.434 | −0.775 | −0.001 |
| pH | -0.262 | 0.572 | 0.618 |
| Eh | 0.027 | 0.560 | −0.111 |
| TDS | 0.827 | 0.075 | 0.310 |
| Initial eigenvalue | 3.393 | 2.624 | 1.385 |
| variance contribution rate/% | 33.928 | 26.243 | 13.854 |
Disclaimer/Publisher’s Note: The statements, opinions and data contained in all publications are solely those of the individual author(s) and contributor(s) and not of MDPI and/or the editor(s). MDPI and/or the editor(s) disclaim responsibility for any injury to people or property resulting from any ideas, methods, instructions or products referred to in the content. |
© 2023 by the authors. Licensee MDPI, Basel, Switzerland. This article is an open access article distributed under the terms and conditions of the Creative Commons Attribution (CC BY) license (https://creativecommons.org/licenses/by/4.0/).
Share and Cite
Wang, M.; Wang, M.; Yang, L.; Yang, T.; Li, J.; Chen, Y. Distribution Characteristics and Genesis of Iron and Manganese Ions in Groundwater of Eastern Sanjiang Plain, China. Water 2023, 15, 2068. https://doi.org/10.3390/w15112068
Wang M, Wang M, Yang L, Yang T, Li J, Chen Y. Distribution Characteristics and Genesis of Iron and Manganese Ions in Groundwater of Eastern Sanjiang Plain, China. Water. 2023; 15(11):2068. https://doi.org/10.3390/w15112068
Chicago/Turabian StyleWang, Mingguo, Min Wang, Li Yang, Tao Yang, Jingjie Li, and Yuanming Chen. 2023. "Distribution Characteristics and Genesis of Iron and Manganese Ions in Groundwater of Eastern Sanjiang Plain, China" Water 15, no. 11: 2068. https://doi.org/10.3390/w15112068
APA StyleWang, M., Wang, M., Yang, L., Yang, T., Li, J., & Chen, Y. (2023). Distribution Characteristics and Genesis of Iron and Manganese Ions in Groundwater of Eastern Sanjiang Plain, China. Water, 15(11), 2068. https://doi.org/10.3390/w15112068