Abstract
The paper proposes a method to simulate the mechanical behavior of compact rock considering hydromechanics by combining physical experiments and numerical analysis. The effectiveness of the constructed method is validated by the comparison between the numerical and physical results of triaxial shear experiments on sandstone in seepage conditions. Based on the validated method, the stability of underground water-sealed oil and gas storage caverns in surrounding compact sandstone during excavation is analyzed. The main findings are as follows: The intrinsic permeability of compact sandstone has a power function relationship with the porosity; the combination of the porous media elastic model and the modified Drucker–Prager plasticity model can preciously represent the mechanical properties of compact sandstone; the proposed method can accurately replicate the hydromechanical response of compact sandstone in seepage conditions; the effects of hydromechanical effects have significant impacts on the stability of surround compact sandstone during the excavation of underground water sealed oil and gas storage caverns, which causes the obvious increase in stress, deformation and plastic deformation zones of the surrounding compact sandstone and remarkable decrease in the stability safety factor.
1. Introduction
Compact rock is a main media in many engineering applications including underground water-sealed oil and gas storage caverns, coal mining, oil fields, and nucleolar waste storage caverns [1]. For engineering applications in compact surrounding rock, their stability is mainly controlled by the mechanical properties of the compact surrounding rock [2]. In practical engineering facilities, compact rock is inevitably under the effects of seepage, which has a significant influence on the mechanical properties of compact rock, causing detrimental impacts on the stability of relevant engineering facilities [3]. Many scholars have conducted research on the impact of fluid flow conditions on the mechanical properties of compact sandstone and found that fluid flow to some extent affects the mechanical properties of compact sandstone [4,5]. Thus, it is vital to have a deep understanding of the hydromechanical response of compact rock.
Conducting physical experiments is an important method to investigate the mechanical characteristics of compact rock, which has been adopted by many researchers [6,7,8,9,10]. However, the existing research mainly focuses on the mechanical characteristics of compact rock without considering the effects of seepage, and the investigation of the hydromechanical characteristics of compact rock is seldom. This is because compact rock has extra-low porosity and permeability, and fluid is difficult to permeate through it, causing the high difficulty and cost to measure the hydromechanical properties of compact rock in laboratory tests. Additionally, due to the limitation of experimental apparatus dimension, conducting laboratory tests cannot explore the hydromechanical response of large-scale compact rock.
Numerical techniques can simulate the mechanical properties of large-scale compact rock to provide guidance for the reasonable design of practical engineering applications [11,12,13,14,15]. However, currently, numerical research about the hydromechanical response of compact rock is rare. This is because the relationship between intrinsic permeability and porosity for compact rock is extremely difficult to determine, which is a necessary parameter to establish the numerical model that can consider hydromechanics [16,17,18,19,20,21]. Therefore, it is necessary to establish a method that can determine the relationship between intrinsic permeability and porosity for compact rock, which can provide the possibility for the numerical investigation of the hydromechanical response of large-scale compact rock.
Due to the properties of low permeability and porosity, underground compact rock is the optimum storage media for oil and gas, with the merits of high leakproofness and safety, funding and land-saving, etc. [22,23,24]. In recent years, many underground oil and gas storage caverns have been constructed in geological formations composed of compact rock around the world [25,26,27]. In petroleum engineering, the compact rock around the underground oil and gas storage caverns is usually in the saturated status via carrying out artificial water injection to further rise the leakproofness of caverns, aiming for preventing the leakage of oil and gas [28,29,30,31]. For the water-sealed underground oil and gas storage caverns, when experiencing engineering activities such as excavation of caverns, etc., the coupling effect between seepage and stress fields of the saturated surrounding compact is inevitable to occur, which has a significant influence on the stability of underground storage caverns [32,33,34,35]. Thus, correct analysis of the stability for underground water-sealed oil and gas storage caverns during engineering activities with considering hydromechanics has remarkable meaning for maintaining the safety of engineering projects.
In this paper, a method is presented for analyzing the hydromechanical properties of compact sandstone by considering the relationship between the intrinsic permeability and porosity of these rocks through a combined approach of experiments and numerical simulations. Based on the presented solution, numerical triaxial shear tests on compact sandstone in seepage conditions are conducted. Through the comparison between the results of numerical and physical triaxial shear experiments, the effectiveness of the established method to replicate the hydromechanical response of compact sandstone is validated. By using the validated method, the stability of the large-scale surrounding compact sandstone during the excavation of underground water-sealed oil and gas storage caverns is analyzed, with the effects of hydromechanics (permeability, porosity, etc.) on the stability of surrounding compact sandstone being studied. The research outcomes can provide guidance for the implementation of the excavation of underground water-sealed oil and gas storage caverns in compact sandstone.
2. Numerical Modelling
2.1. Seepage Theory
For this paper, Forchheimer seepage law is adopted to carry out the seepage analysis of compact sandstone, as shown in Equation (1) [36,37]:
where, k represents the permeability coefficient (m2); kliq represents the intrinsic permeability (m2) (The function of porosity); ks represents the saturation permeability (m2); represents the velocity coefficient (m−1) (The function of porosity); represents velocity of fluid (m/s).
According to the mass conservation equation, the fluid flow continual equation is gained, as shown in Equation (2) [1]:
where, t1 represents time (t); v represents specific discharge (m/s); S represents phreatic storativity velocity (m−1); h represents water pressure head (m).
It is assumed that the seepage is steady, namely, S equals zero. Thus, the continual equation for steady seepage is gained, as presented in Equation (3).
After that, the stable seepage equation is deduced, as shown in Equation (4).
where, kx, ky, kz represent the permeability coefficient for materials (m2) along the x, y and z axis direction (m), respectively.
The permeability of materials is assumed to be isotropic and homogeneous; the Laplace Equation can be transformed into Equation (5) [38].
The fluid flow occurs mainly in a horizontal plane, and the flow in the third dimension (i.e., the vertical direction) is negligible or can be assumed to be constant [39]. When the seepage is two-dimensional, Equation (5) can be presented as in Equation (6)
Finally, Equation (6) is transformed as in Equation (7).
2.2. Constitutive Modelling
Linearization simplifies the mathematical expressions required for the analysis and makes it easier to solve the governing equations for the system. However, it is important to note that the linearized model is only valid within the specified range of property values, and outside this range, the model will not accurately represent the behavior of the material [40]. In geotechnical engineering, the modified Drucker–Prager model is widely applied to represent the mechanical properties of geotechnical materials. However, the modified Drucker–Prager model has a main deficiency that it cannot replicate the non-linear mechanical properties of materials during the elastic stage [41]. Hence, this paper combines the porous media elasticity model and the modified Drucker–Prager model to represent the constitutive relationship for compact sandstone.
2.2.1. Porous Media Elastic Model
The porous media elastic model is adopted to simulate the non-linear mechanical properties of compact sandstone during the elastic stage in this paper [42]. In this model, the change of elastic volume (the volume of a material that is able to recover its original shape after deformation under elastic conditions) is proportioned with the logarithm of confining pressure:
where, represents logarithmic bulk modulus (MPa), which is an intrinsic property of a medium that represents its volumetric stiffness; e0 represents initial porosity; p0 represents initial confining pressure (MPa); represents the elastic portion of the porosity; represents elastic tensile strength (MPa); p represents current confining pressure (MPa), being defined in Equation (9).
where represents stress (MPa); , , represents the principle stress (MPa).
2.2.2. Modified Drucker–Prager Plasticity Model
Compared with the traditional Drucker–Prager plasticity model, the modified Drucker–Prager model has an additive cap yield surface [43], which can reflect the yielding of materials under isotropic compression and control the stress-dilatancy [44]. The failure surface FS of the model can be written as in Equation (10) [45]
where β, d represents friction angle (°) and cohesion (MPa), respectively; t represents deviatoric stress (MPa), as shown in Equation (11).
where K represents the material parameter.
2.3. Hydromechanics Theory
2.3.1. The Effects of Seepage Fields on Stress Fields
It is assumed that seepage fields are varying the seepage body force for compact rock to impact stress fields. In two-dimensional seepage conditions (assume that the fluid is incompressible and the material is anisotropic), the seepage body force for compact rock is proportional to the gradient of the water head, being expressed in Equation (12) [46]:
where f represents seepage body force (N/m3); rw represents the unit weight for fluid (N/m3); fx, fy represents the component force for seepage body force along the x and y direction, respectively (N/m3); Jx, Jy represents the water head gradient along the x and y direction, respectively (m−1).
The finite element method involves dividing the physical domain into many small geometric shapes, calculating the external loads on each element by numerical integration using equivalent nodal forces, and converting them into equivalent forces at each node [47]. By utilizing Equation (13), the seepage body force is transformed to equivalent nodal force in numerical calculation.
where represents the seepage equivalent nodal force (N); is the function of element shape.
where represents the increment of seepage equivalent nodal force (N).
Therefore, the mathematical model for stress fields that can consider the impacts of the seepage field is obtained, being expressed in Equation (15).
where is the increment of nodal load (N); represents displacement (m); represents the increment of displacement (m); Su is the known displacement boundary condition; Sa represents the known stress boundary condition.
2.3.2. The Impact of Stress Fields on Seepage Fields
Stress fields are affecting the porosity of compact rock to impact the seepage field. This is because the porosity of compact rock is controlled via stress fields, and the porosity can determine the permeability of compact rock to influence the seepage field. The mathematical model of a two-dimensional steady seepage field, which can consider the impacts of stress fields, is presented in Equation (16).
where, represents porosity; q1 represents fluid flow (m2/s); represents the hydraulic head; represents the boundary conditions with known water head (m); represents the boundary conditions with the known fluid flow (m2); represents the mixed boundary conditions, that is to say, , , represents constant values related to the mixed boundary conditions.
As shown in Equation (16), the core of ascertaining the influence of stress fields on seepage fields is to specify the relationship between porosity and intrinsic permeability for compact sandstone. As long as the relationship between the permeability and porosity is ascertained, the mathematical model for describing the hydromechanical properties of compact sandstone can be specified and the corresponding numerical analysis of the hydromechanical response of compact sandstone can be conducted.
3. Physical Experiments
3.1. Gas Permeability Experiment
3.1.1. Preparation of Gas Permeability Experiment
To ascertain the relationship between the porosity and intrinsic permeability of compact sandstone, gas permeability experiments on compact sandstone were carried out. The compact sandstone sample used in the experiment was obtained from Taoyuan Hydropower Station, which is located in Taoyuan County, Changde City, Hunan Province, China, along the main stream of the Yuanshui River. The sample is a typical tight and homogeneous sandstone with low porosity and permeability, exhibiting strong mechanical properties, and the region is situated in the Nan Yue Mountain area with mountainous and hilly terrain, within the undulating area of Jiangnan Hills. The sandstone was prepared as a cylindrical sample with a diameter of 50 mm × height of 100 mm. The physical parameters of the dried sample are shown in Table 1.

Table 1.
The parameters for samples.
The permeability of compact sandstone was measured by the permeability test system. The experimental system consists of a rock core pressure chamber, confining pressure regulation equipment, seepage pressure regulation equipment, upstream and downstream gas pressure controlling panels, a pressure monitor and a gas pressure gauge with high precision. Due to the extra-low permeability of the compact rock, when adopting fluid as the seepage media, it requires a long duration to penetrate through the compact rock sample, which may cause experimental errors due to the variation in the external environment during the long-term tests. Thus, the tests adopted Argon gas as seepage media, and the permeability for compact sandstone was calculated by using the gas flow method [48]. Additionally, according to the experimental system, the porosity of compact sandstone under different confining pressures was evaluated by using the volume expansion method. The specific experiment scheme is listed in Table 2.
Table 2.
Experiment scheme.
3.1.2. Gas Slippage Effect
Utilizing gas as the seepage media to evaluate the permeability of compact rock may induce the Gas Slippage Effect. It means that in the seepage processes of gas in low-porosity porous media, due to the collisions between gas molecules and the pore wall, the gas molecule in pore walls is in motion states to generate the non-Darcy flow (non-linear flows), causing the measured gas permeability to be greater than the intrinsic permeability [49]. The phenomenon was discovered by Klinkenberg in 1941 through experiments [50]. Some researchers proposed that the relationship between the gas-measured permeability and intrinsic permeability can be represented by Equation (17) [51].
where b represents the slippage factor, a represents the secondary slippage factor, and represents seepage pressure (MPa).
As shown in Equation (17), as long as the gas permeability for compact sandstone in diverse seepage pressure can be obtained, by combining Equation (17), the intrinsic permeability of compact sandstone can be gained. A detailed analysis is as follows.
3.1.3. The Analysis for Gas Permeability Experimental Results
According to the gas permeability experiment results, the relationship between the gas permeability of compact sandstone and seepage pressure is drawn in Figure 1. Then, Equation (17) was used to fit the relationship curves between gas permeability and seepage pressure to attain the intrinsic permeability of compact sandstone under different confining pressures. The fitting degree is listed in Table 3.
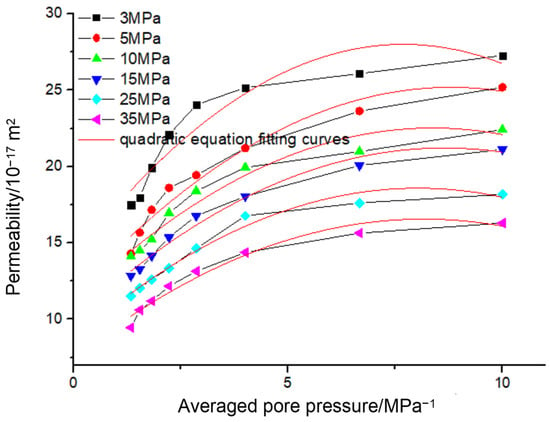
Figure 1.
The relationships between the gas permeability for compact sandstone and seepage pressure.
Table 3.
The fitting degree R2 of Equation (2).
According to Table 3, the fitting results of Equation (17) show that the fitting degrees under each confining pressure are all higher than 94%, which means that Equation (17) can describe the Gas Slippage Effect of compact sandstone accurately and the intrinsic permeability of compact sandstone under different confining pressures that is attained based on Equation (17) is reliable, as shown in Table 4.
Table 4.
Intrinsic permeability of compact sandstone under different confining pressures.
According to Figure 2, the intrinsic permeability of compact sandstone reduces with the rise in confining pressure. Chao [6] established a power model to replicate the relationship between the intrinsic permeability of compact rock and confining pressure. Thus, in the paper, the power function model is used to describe the relationship between the intrinsic permeability of compact sandstone and confining pressure quantitatively, as shown in Equation (18), and the fitting curve is depicted in Figure 2. The fitting degree and parameter are shown in Table 5.
where d1 and h1 are constants that represent the parameters of the power function model used to describe the relationship between intrinsic permeability and confining pressure for compact sandstone.
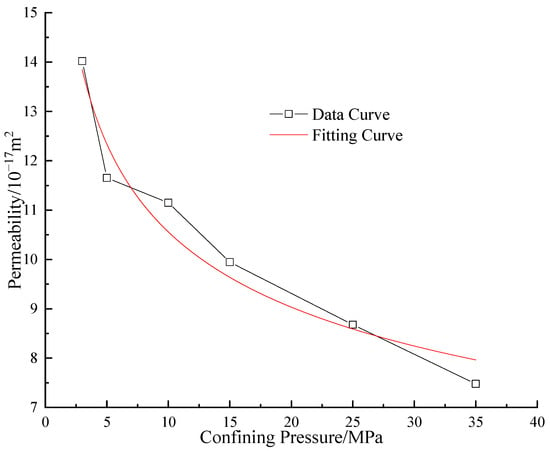
Figure 2.
Intrinsic permeability for compact sandstone under diverse confining pressures.
Table 5.
Fitting degree and parameters of the power function model.
According to Table 5, the fitting degree is 96.93%. It means that the power function model can replicate the relationship between the intrinsic permeability of compact sandstone and the confining pressure well.
According to the experimental results, the relationship between the porosity of compact sandstone and confining pressure is drawn in Figure 3.
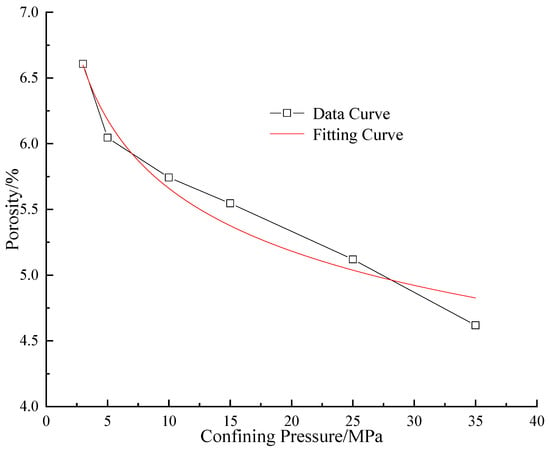
Figure 3.
The relationship curve between the porosity for compact sandstone and confining pressure.
According to Figure 3, the porosity of compact sandstone reduces with the rise in confining pressure. Wang proposed that the porosity of compact rock has an exponential relationship with confining pressure [52]. Thus, an exponential function model is adopted to describe the relationship between the porosity of compact sandstone and confining pressure quantitatively, depicted in Equation (19). The fitting degree and parameter is listed in Table 6. The fitting curve is shown in Figure 3.
where, represents the initial porosity of compact rock; i represents a constant.
Table 6.
Fitting degree and parameters of the exponential function model.
Based on Table 6, the fitting degree is 97%, which indicates that the exponential function model is able to describe the relationship between the porosity of compact rock and confining pressure preciously. By the combination of Equations (18) and (19), the relationship between intrinsic permeability and porosity for compact sandstone is obtained, as shown in Equation (20).
After the simplification of Equation (20), the relationship between the intrinsic permeability and porosity of compact sandstone is expressed in Equation (21).
According to Equation (21), the intrinsic permeability and porosity of compact sandstone is a power function relationship. Based on Table 5 and Table 6, the value for parameters d1, h1, i and is substituted into Equation (21), as shown in Equation (22).
Thus, according to the obtained relationship between the porosity and intrinsic permeability of compact sandstone, Equation (22) is substituted into Equation (16) to determine the impact of stress fields on seepage fields. The mathematical model for a two-dimensional stable seepage field that can consider the impact of stress fields is presented in Equation (23).
where represents the hydraulic head (water pressure) in the seepage field (m), represents the second normal stress difference, and represents the third normal stress difference.
The mathematical model for describing the hydromechanical characteristics of compact sandstone is then obtained by combining the mathematical models of stress fields and seepage fields, as shown in Equation (24).
where, represents the stiffness matrix (N/m2); represents the incremental displacement vector (m); represents the incremental force vector (N) represents the incremental force vector due to the stress fields represents (N); the ratio of the volume of void space to the total volume of the rock (%); represents the water head distribution function for seepage fields (m/s2); represents the permeability of the rock (m2).
3.2. Triaxial Shear Experiment
3.2.1. Numerical Tests
Based on the proposed method for describing the hydromechanical properties of compact sandstone, Finite Element Method (FEM) numerical triaxial shear experiments on compact sandstone were carried out. In finite element analysis, meshing is the process of dividing the solution domain into small discrete elements. The use of meshing can improve the computational accuracy and efficiency of the model by dividing the large computation domain into small elements to approximate complex geometries, making numerical calculations and simulations more feasible [46]. The stress-strain relationship of compact sandstone is replicated by combining the porous media elastic model and the modified Drucker–Prager plasticity model. The numerical model parameters are listed in Table 7. The numerical compact sandstone has a diameter of 50 mm × length 100 mm. On the top and bottom end, there is a rigid plate fixing on it, respectively. During the numerical shear stage, the displacement of the bottom rigid plate is fixed, and the upper rigid plate moves downwards vertically at a certain velocity to simulate the real shearing process in laboratory triaxial tests. Meanwhile, the central nodal point of the model is used as the deformation and stress monitoring point. The experimental scheme is listed in Table 8. The obtained experimental outcomes are depicted in Figure 4.
Table 7.
The parameters for the numerical model.
Table 8.
Triaxial shear test scheme.
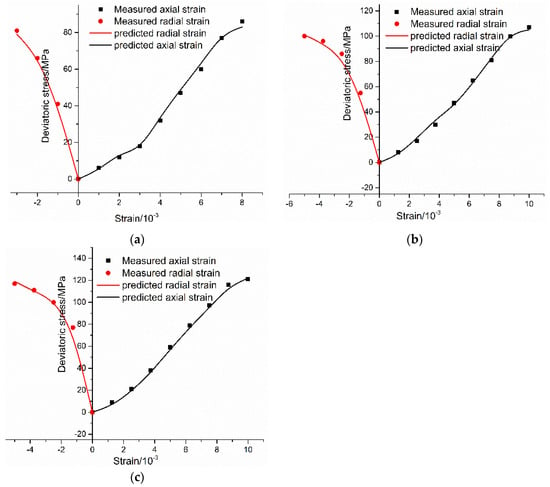
Figure 4.
The comparison of the numerical and physical triaxial experiment results: (a) Confining pressure 4 MPa; (b) Confining pressure 6 MPa; (c) Confining pressure 8 MPa.
3.2.2. Physical Tests
To verify the applicability of the established method, laboratory triaxial shear tests on compact sandstone were implemented to verify the correctness of the obtained hydromechanical response of the compact sandstone in the numerical triaxial shear tests. The physical triaxial shear tests were performed on a static triaxial shear system. This system consists of a pressure chamber, loading equipment, a voltage stabilizer, fluid pressure and water pressure systems, and a data acquisition computer system. The largest sample dimension for the triaxial pressure cell is 50 mm × 100 mm. The largest confining pressure of the cell is 60 MPa. The range of the imposed axial pressure is 0–100 MPa. In the laboratory tests, all the experimental parameters and schemes are consistent with those in the numerical simulation. The axial strain, radial strain and volumetric strain for the rock specimen were recorded in the shearing process.
3.2.3. Analysis of Experimental Results
According to the experimental results, the relationship curves between stress and strain of compact sandstone under diverse confining pressure in seepage conditions are obtained, and the laboratory experiment results are compared with the results of numerical simulation, as shown in Figure 4.
Under diverse confining pressure, the relationship between strain and stress of compact sandstone in seepage conditions obtained by the numerical simulation is generally consistent with that gained in the physical experiments. It indicates that the proposed solution can describe the hydromechanical response of compact sandstone correctly, which lays the foundation for the numerical analysis of the hydromechanical properties of large-scale compact sandstone. It also proves that the combination of the porous media elastic model and the modified Drucker–Prager model plasticity model is able to represent the mechanical properties of compact sandstone accurately.
4. Engineering Application
4.1. Numerical Modelling
Mathematical models such as Darcy’s law and more complex models such as dual-porosity models or flow models are often used to accurately describe the water flow behavior in compact sandstone, which involves a lot of calculations and simulations. Oil and gas storage caverns are often constructed underground below the groundwater level, with the water curtain system being installed above the roofs of the caverns to improve the sealing performance and avoid the leakage of oil [53]. This results in the underground oil and gas storage caverns being surrounded with water during the construction and operation period, and the seepage effects of water are inevitable to induce the hydromechanical response of surrounding compact rock and influence the stability of storage caverns. Once the instability of underground storage caverns occurs, the leakage of oil can cause huge contamination in the surrounding environment and endanger the health of the public. Thus, by using the proposed method, the stability of the surrounding compact sandstone during the excavation of caverns in seepage conditions was numerically analyzed. The numerical simulation outcomes can provide suggestions for the safe excavation and operation of underground water-sealed oil storage caverns in surrounding compact sandstone.
A FEM numerical model for the surrounding compact sandstone of underground water-sealed oil storage caverns was built by adopting the established approach, considering the effect of gravity. Four storage caverns were excavated during the numerical simulation, numbered from 1 to 4. The dimension of storage caverns is the same, with a width of 20 m and a height of 30 m. The anisotropic properties of compact sandstone are similar at different scales, and the permeomechanical properties are close. Previous studies have shown that the choice of model scale has exceeded the volume of its representative elementary unit [54,55]. The geometry, layout and number of the four storage caverns are shown in Figure 5. A water curtain tunnel is formed at 30 m above the caverns in the model, which determines the height of the groundwater level. The mechanical characteristics of the simulated surrounding compact sandstone are replicated by combining the porous media elastic model and modified Drucker–Prager plasticity model, with the model parameters listed in Table 7.
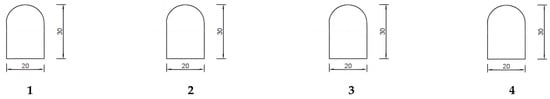
Figure 5.
The schematic diagrams for the water-sealed storage cavern (unit: m).
The FEM numerical model is partitioned as 20,009 elements and 30,009 nodes, as shown in Figure 6. To guarantee computational precision, finer meshes are used around the caverns. To simulate the actual situation of underground water-sealed oil and gas storage caverns, the horizontal displacement for the left and right boundary and the vertical displacement for the bottom boundary of the model is fixed. Meanwhile, the bottom, left and right boundary of the model is set as impermeable, and the top boundary for the model is set as permeable, with the pore pressure being 0 kPa. The seepage is induced by the groundwater, and the groundwater level is located at a height of 30 m above the roof of caverns. After the excavation of the caverns, the pore water pressure for the boundary of the caverns and the bottom boundary for the water curtain tunnel is set as 0 kPa. Additionally, around the boundaries of each cavern, eight monitoring points are set to record the deformation and stress of the surrounding sandstone during the excavation, numbering from A to F, as shown in Figure 7. The stability of underground water-sealed oil storage caverns in non-seepage conditions during the excavation stage was also analyzed, which did not consider the influence of groundwater seepage. For other model parameters of the numerical models in non-seepage conditions, they are the same as those of the model in seepage conditions. Additionally, the strength reduction method was applied to acquire the stability safety factor of underground oil storage caverns in seepage conditions and in non-seepage conditions, respectively, for analyzing the overall stability of surrounding sandstone quantitatively. In this model, the instability condition of the strength reduction method is the mis-convergence of the established numerical models or the formation of consecutive plastic zones in surrounding rock.
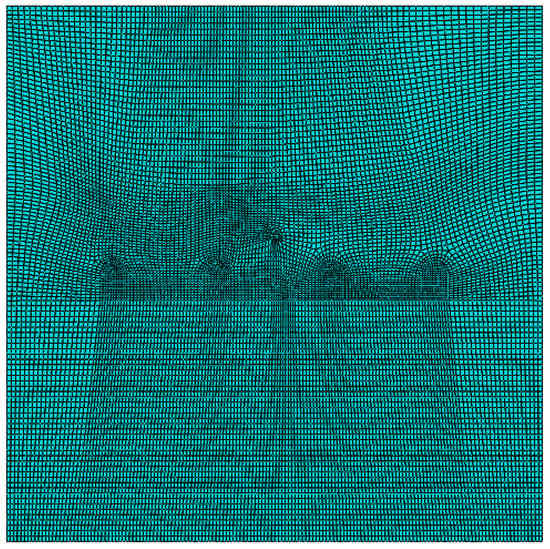
Figure 6.
The meshes of the numerical model.
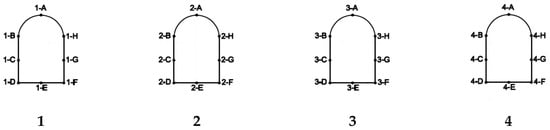
Figure 7.
The monitoring points around caverns.
4.2. The Analysis of Numerical Simulation Results
4.2.1. Deformation Analysis
Based on the outcomes of numerical simulation, the deformation distribution and deformation vector diagrams of the surrounding compact sandstone of underground oil storage caverns in seepage conditions and non-seepage conditions are presented in Figure 8, respectively.
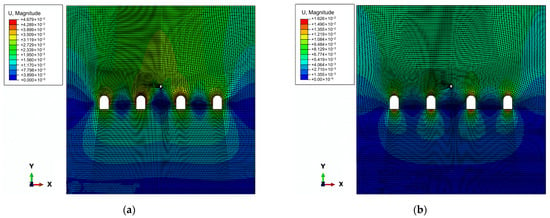
Figure 8.
The deformation diagram: (a) The deformation distribution diagram in seepage conditions; (b) The deformation distribution diagram in non-seepage conditions.
According to Figure 8, in seepage conditions, large deformation mainly occurs around the boundary of caverns during excavation. The vertical deformation in the top and bottom boundary of caverns occurs while the horizontal deformation in the side walls takes place. Additionally, there is obvious deformation in the area above the storage caverns, and the deformation extended to the top of the model. In comparison, in non-seepage conditions, the deformation mainly locates at the top and bottom boundary of the caverns, which is in the vertical direction. There is no obvious deformation in the side walls of the caverns and the area above the caverns. This indicates that the hydromechanical effect significantly increases the area of large deformation in surrounding compact sandstone. In practical underground water-sealed storage caverns, attention and corresponding measures should be adopted to control the deformation in the boundaries of caverns and the area above the caverns.
To analyze the deformation of surrounding rock quantitatively, the average deformation recorded by different monitoring points in each cavern under seepage and non-seepage conditions is drawn in Figure 9. In Figure 9, 1 to 4 means the number of caverns.
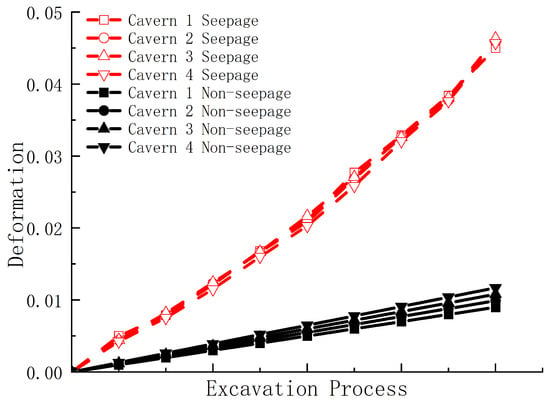
Figure 9.
Average deformation recorded by different monitoring points in caverns.
As shown in Figure 9, the average deformation recorded by the different monitoring points around the boundary of caverns in seepage conditions and non-seepage conditions all rises during the excavation, indicating the excavation has a notable influence on the deformation of surrounding sandstone. Additionally, in general, the average deformation in seepage conditions is almost two or three times larger than that in non-seepage conditions after excavation. It means that hydromechanical effects raise the deformation magnitude of surrounding compact sandstone remarkably during excavation.
4.2.2. Stress Analysis
According to the outcomes of numerical simulation, the distribution and magnitude of Mises equivalent stress (Mises equivalent stress is a measure used to describe the strength and stress state of a material, also known as von Mises stress or Mises stress [56,57,58,59,60]) for the surrounding compact sandstone in seepage conditions and non-seepage conditions are shown in Figure 10.
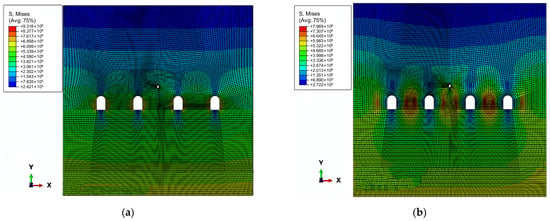
Figure 10.
The Mises equivalent stress diagram: (a) Seepage conditions; (b) Non-seepage conditions.
As shown in Figure 10, in seepage conditions, the stress in the boundaries of caverns is larger than in other areas of the surrounding compact sandstone during the excavation. Among the boundaries, the stress in the side walls of caverns is higher than the value in the top and bottom boundaries. In comparison, in non-seepage conditions, the maximum stress is located in the middle area between caverns, which is higher than the stress around the boundaries of the caverns. Overall, the maximum stress of the surrounding compact sandstone in seepage conditions is higher than that in non-seepage conditions, and at the same location, the stress in seepage conditions is higher than that in non-seepage conditions. This demonstrates that hydromechanical effects can increase the stress of the surrounding compact sandstone during excavation.
To analyze the stress of surrounding rock quantitatively, the average Mises equivalent stress recorded via using diverse monitoring points around caverns in seepage and non-seepage conditions are drawn in Figure 11.
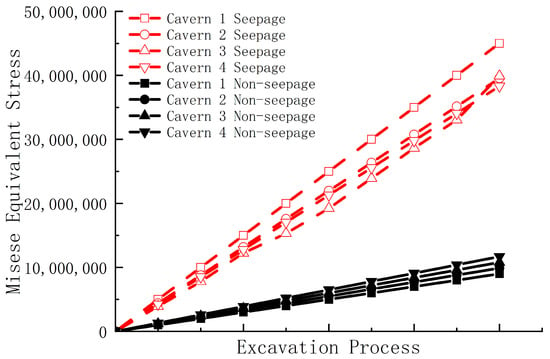
Figure 11.
The average Mises stress recorded by using diverse monitoring points.
As shown in Figure 11, the average Mises equivalent stress recorded via using diverse monitoring points in seepage conditions and non-seepage conditions all rises during the excavation, indicating excavation has a high impact on the stress field for surrounding compact sandstone. Moreover, overall, the Mises equivalent stress in seepage conditions is two or three times higher than that in non-seepage conditions. It means the hydromechanical effects raise the stress of surrounding compact sandstone remarkably during excavation.
4.2.3. Plastic Deformation Analysis
According to the outcomes for numerical simulation, the distribution of plastic zones in the surrounding compact sandstone in seepage conditions and non-seepage conditions is demonstrated in Figure 12.
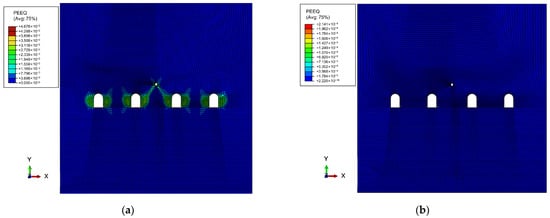
Figure 12.
The distribution of the plastic zones: (a) Seepage conditions; (b) Non-seepage conditions.
As shown in Figure 12, in seepage conditions, there are obvious plastic zones in the surrounding compact sandstone during excavation, mainly concentrating around the side walls of storage caverns and the water curtain channel. In comparison, in non-seepage conditions, there is no apparent plastic zone to be observed in the surrounding compact sandstone. It indicates that hydromechanical effects significantly enlarge the area of plastic zones surrounding compact sandstone during excavation.
As shown in Figure 13, in seepage conditions, the plastic deformation of the surrounding compact sandstone around the caverns gradually increases during the excavation. In comparison, in non-seepage conditions, the plastic deformation during excavation keeps stable, without notable rise. Overall, the plastic deformation in seepage conditions is remarkably larger than that in non-seepage conditions, which means the hydromechanical effects can evidentially increase the plastic deformation of surrounding compact sandstone during excavation.
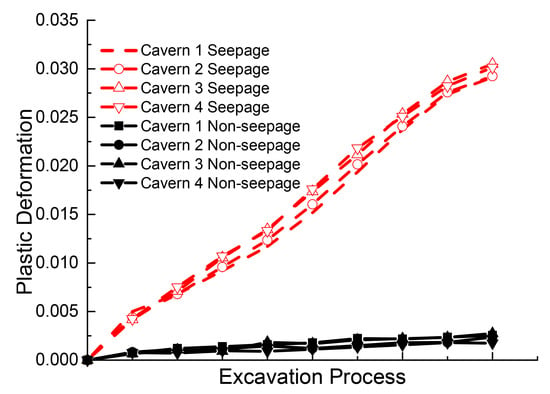
Figure 13.
The average plastic deformation.
4.2.4. Stability Analysis
By using the strength reduction method, the stability safety factor of the surrounding compact sandstone (shear strength, tensile strength, etc.) during the excavation of underground oil storage caverns is calculated. The factors are 2.04 in non-seepage conditions and 1.36 in seepage conditions, which has a notable reduction due to the hydromechanical effect. Combined with the aforementioned analysis, the hydromechanical effect significantly rises the deformation, stress and the area of plastic zones in surrounding compact sandstone during the excavation of caverns. It indicates the stability analysis from the adopted hydromechanical method has evident differences compared to the non-seepage method, and for practical underground water-sealed oil storage caverns, it is suitable to apply the hydromechanical method to analyze their stability.
5. Discussion
Previous studies on compact sandstone have mainly focused on its mechanical properties, with little consideration given to the influence of fluid flow. In other words, the hydromechanical behavior of compact sandstone has rarely been investigated, and the intrinsic relationship between the permeability and porosity of compact sandstone, which is a necessary parameter for establishing numerical models that consider fluid mechanics, is extremely difficult to determine. Therefore, there have been few numerical studies on the hydromechanical response of compact sandstone. In this paper, a combined approach of experiments and numerical simulations is employed to propose a method for analyzing the hydromechanical behavior of compact sandstone.
Based on the findings presented in the paper, it can be concluded that the proposed method for simulating the hydromechanical behavior of compact sandstone using a combination of physical experiments and numerical analysis is effective. This was demonstrated through the comparison of numerical and physical results from triaxial shear experiments on sandstone under seepage conditions.
Using the validated method, the stability of underground water-sealed oil and gas storage caverns surrounding compact sandstone during excavation was analyzed. The results showed that hydromechanical effects have a significant impact on the stability of the surrounding compact sandstone during excavation. This leads to an increase in stress, deformation, and plastic deformation zones, as well as a remarkable decrease in the stability safety factor.
Several important conclusions were drawn from the study. First, the intrinsic permeability of compact sandstone has a power function relationship with porosity. Second, the combination of the porous media elastic model and modified Drucker–Prager plasticity model accurately represents the mechanical properties of compact sandstone. Third, the proposed method can accurately replicate the hydromechanical response of compact sandstone under the effect of seepage.
Overall, these findings can be used to guide the implementation of underground water-sealed oil and gas storage cavern excavations in compact sandstone and highlight the importance of considering hydromechanical effects in such projects.
6. Conclusions
This paper proposes a solution to describe the hydromechanical properties of compact sandstone by combing experimental and numerical methods. Then, the effectiveness of the presented solution is validated by comparing the numerical and physical results of triaxial shear experiments on compact sandstone under seepage conditions. After that, the validated solution is adopted to analyze the stability of underground water-sealed oil storage caverns during excavations with considering the hydromechanical effects.
- The intrinsic permeability of compact sandstone has a power function relationship with the porosity;
- The combination of the porous media elastic model and the modified Drucker–Prager model plasticity model is able to represent the mechanical properties of compact sandstone accurately;
- The established method can correctly replicate the hydromechanical response of compact sandstone under the effect of seepage;
- Hydromechanical effects can significantly increase the stress, deformation and plastic deformation of surrounding compact sandstone during the excavation of underground oil storage caverns and reduce the stability safety factor remarkably.
Author Contributions
Conceptualization, Z.C. and W.Z.; methodology, Z.C. and W.Z.; software, Z.C. and P.T.; validation, J.Z., formal analysis, Z.C.; investigation, W.Z.; writing—original draft preparation, Z.C. and P.T.; writing—review and editing H.W.; visualization, Y.D.; supervision, H.W.; project administration, Z.C.; funding acquisition, Z.C. All authors have read and agreed to the published version of the manuscript.
Funding
This article was funded by the 2022 Open Project of Failure Mechanics and Engineering Disaster Prevention, Key Laboratory of Sichuan Province (FMEDP202209). It is also sponsored by the Shanghai Sailing Program (22YF1415800; 23YF1416100), the Youth Project of Shanghai Soft Science (23692119700), the General Project of Shanghai Natural Science Foundation (23ZR1426200), and the Open Subject of Key Laboratory of Estuarine and Coastal Transportation in the Ministry of Transport (KLECE202302).
Data Availability Statement
Data available upon request.
Conflicts of Interest
The authors declare no conflict of interest.
References
- Belmokhtar, M.; Delage, P.; Ghabezloo, S.; Conil, N. Drained triaxial tests in low-permeability shales: Application to the Callovo-Oxfordian claystone. Rock. Mech. Rock. Eng. 2018, 51, 1979–1993. [Google Scholar] [CrossRef]
- Chao, Z.M.; Ma, G.T.; Wang, M. Experimental and numerical modelling of the mechanical behaviour of low-permeability sandstone considering hydromechanics. Mech. Mater. 2020, 148, 103454. [Google Scholar] [CrossRef]
- Chao, Z.M.; Fowmes, G. Modified stress and temperature-controlled direct shear apparatus on soil-geosynthetics interfaces. Geotext. Geomembr. 2021, 49, 825–841. [Google Scholar] [CrossRef]
- Zeng, L.B.; Gao, C.Y.; Qi, J.F.; Wang, L.L.; Qu, X.F. The distribution rule and seepage effect of the fractures in the ultra-low permeability sandstone reservoir in east Gansu Province, Ordos Basin. Sci. China Ser. D Earth Sci. 2008, 51, 44–52. [Google Scholar] [CrossRef]
- Feng, M.; Wu, J.; Ma, D.; Ni, X.Y.; Yu, B.Y.; Chen, Z.Q. Experimental investigation on the seepage property of saturated broken red sandstone of continuous gradation. Bull. Eng. Geol. Environ. 2018, 77, 1167–1178. [Google Scholar] [CrossRef]
- Chao, Z.M.; Ma, G.T.; Hu, X.W.; Luo, G. Research on anisotropic permeability and porosity of columnar jointed rock masses during cyclic loading and unloading based on physical model experiments. Bull. Eng. Geol. Environ. 2020, 79, 5433–5454. [Google Scholar] [CrossRef]
- Chao, Z.M.; Ma, G.T.; He, K.; Wang, M. Investigating low-permeability sandstone based on physical experiments and predictive modeling. Undergr. Space 2021, 6, 364–378. [Google Scholar] [CrossRef]
- Roberts, L.A.; Buchholz, S.A.; Mellegard, K.D.; Düsterloh, U. Cyclic loading effects on the creep and dilation of salt rock. Rock. Mech. Rock. Eng. 2015, 48, 2581–2590. [Google Scholar] [CrossRef]
- Wang, H.L.; Xu, W.Y. Permeability evolution laws and equations during the course of deformation and failure of brittle rock. J. Eng. Mech. Asce. 2013, 139, 1621–1626. [Google Scholar] [CrossRef]
- Kohlstedt, D.L.; Evans, B.; Mackwell, S.J. Strength of the lithosphere: Constraints imposed by laboratory experiments. J. Geophys. Res. Solid Earth 1995, 100, 17587–17602. [Google Scholar] [CrossRef]
- Hao, Y.; Smith, M.; Sholokhova, Y.; Carroll, S. CO2-induced dissolution of low permeability carbonates. Part II: Numerical modeling of experiments. Adv. Water. Resour. 2013, 62, 388–408. [Google Scholar] [CrossRef]
- Yang, Z.M.; Yu, R.; Su, Z.X.; Zhang, Y.; Cui, D. Numerical simulation of the nonlinear flow in ultra-low permeability reservoirs. Petrol. Explor. Dev. 2010, 37, 94–98. [Google Scholar]
- Chen, Y.F.; Hong, J.M.; Zheng, H.K.; Li, Y.; Hu, R.; Zhou, C.B. Evaluation of groundwater leakage into a drainage tunnel in Jinping-I arch dam foundation in southwestern China: A case study. Rock. Mech. Rock. Eng. 2016, 49, 961–979. [Google Scholar] [CrossRef]
- Ju, Y.; Xi, C.D.; Zhang, Y.; Mao, L.T.; Gao, F.; Xie, H.P. Laboratory in situ CT observation of the evolution of 3D fracture networks in coal subjected to confining pressures and axial compressive loads: A novel approach. Rock. Mech. Rock. Eng. 2018, 51, 3361–3375. [Google Scholar] [CrossRef]
- Zhang, W.B.; Shi, D.D.; Shen, Z.Z.; Wang, X.H.; Gan, L.; Shao, W.; Tang, P.; Zhang, H.W.; Yu, S.Y. Effect of calcium leaching on the fracture properties of concrete. Constr. Build. Mater. 2023, 365, 130018. [Google Scholar] [CrossRef]
- Chen, S.K.; Yang, T.H.; Ranjith, P.G.; Wei, C.H. Mechanism of the two-phase flow model for water and gas based on adsorption and desorption in fractured coal and rock. Rock. Mech. Rock. Eng. 2017, 50, 571–586. [Google Scholar] [CrossRef]
- Rathnaweera, T.D.; Ranjith, P.G.; Perera, M.S.A. Effect of salinity on effective CO2 permeability in reservoir rock determined by pressure transient methods: An experimental study on Hawkesbury sandstone. Rock. Mech. Rock. Eng. 2015, 48, 2093–2110. [Google Scholar] [CrossRef]
- Lee, M.Y.; Bauer, S.J. Development of helium-mass-spectrometry-permeameter for the measurement of permeability of near-impermeable rock. Rock. Mech. Rock. Eng. 2016, 49, 4661–4665. [Google Scholar] [CrossRef]
- Wang, H.L.; Xu, W.Y.; Cai, M.; Xiang, Z.P.; Kong, Q. Gas permeability and porosity evolution of a porous sandstone under repeated loading and unloading conditions. Rock. Mech. Rock. Eng. 2017, 50, 2071–2083. [Google Scholar] [CrossRef]
- Zhang, W.B.; Shi, D.D.; Shen, Z.Z.; Shao, W.; Gan, L.; Yuan, Y.; Tang, P.; Zhao, S.; Chen, Y.S. Reduction of the calcium leaching effect on the physical and mechanical properties of concrete by adding chopped basalt fibers. Constr. Build. Mater. 2023, 365, 130080. [Google Scholar] [CrossRef]
- Chao, Z.M.; Fowmes, G. The short-term and creep mechanical behaviour of clayey soil-geocomposite drainage layer interfaces subjected to environmental loadings. Geotext. Geomembr. 2022, 50, 238–248. [Google Scholar] [CrossRef]
- Xiong, J.; Huang, X.L.; Ma, H.L. Gas leakage mechanism in bedded salt rock storage cavern considering damaged interface. Petroleum. 2015, 1, 366–372. [Google Scholar] [CrossRef]
- Yang, C.H.; Wang, T.T.; Qu, D.A.; Ma, H.L.; Li, Y.P.; Shi, X.L.; Daemen, J.J.K. Feasibility analysis of using horizontal caverns for underground gas storage: A case study of Yunying salt district. J. Nat. Gas. Sci. Eng. 2016, 36, 252–266. [Google Scholar] [CrossRef]
- Liu, W.; Zhang, Z.X.; Chen, J.; Jiang, D.Y.; Wu, F.; Fan, J.Y.; Li, Y.P. Feasibility evaluation of large-scale underground hydrogen storage in bedded salt rocks of China: A case study in Jiangsu province. Energy 2020, 198, 117348. [Google Scholar] [CrossRef]
- Xiao, N.; Liang, W.G.; Zhang, S.L. Feasibility analysis of a single-well retreating horizontal cavern for natural gas storage in bedded salt rock. J. Nat. Gas. Sci. Eng. 2020, 99, 104446. [Google Scholar] [CrossRef]
- Jeanne, P.; Zhang, Y.Q.; Rutqvist, J. Influence of hysteretic stress path behavior on seal integrity during gas storage operation in a depleted reservoir. J. Rock Mech. Geotech. Eng. 2020, 12, 886–899. [Google Scholar] [CrossRef]
- Ma, C.H.; Yang, J.; Cheng, L.; Ran, L. Research on slope reliability analysis using multi-kernel relevance vector machine and advanced first-order second-moment method. Eng. Comput. 2021, 38, 3057–3068. [Google Scholar] [CrossRef]
- Ma, C.H.; Yang, J.; Zenz, G.; Staudacher, E.J.; Cheng, L. Calibration of the microparameters of the discrete element method using a relevance vector machine and its application to rockfill materials. Adv. Eng. Softw. 2020, 147, 102833. [Google Scholar] [CrossRef]
- Liu, W.; Li, Y.P.; Yang, C.H.; Daemen, J.J.K.; Yang, Y.; Zhang, G.M. Permeability characteristics of mudstone cap rock and interlayers in bedded salt formations and tightness assessment for underground gas storage caverns. Eng. Geol. 2015, 193, 212–223. [Google Scholar] [CrossRef]
- Ma, C.H.; Gao, Z.Y.; Yang, J.; Cheng, L.; Zhao, T.H. Calibration of adjustment coefficient of the viscous boundary in particle discrete element method based on water cycle algorithm. Water 2022, 14, 439. [Google Scholar] [CrossRef]
- Ma, C.H.; Zhao, T.H.; Li, G.C.; Zhang, A.A.; Cheng, L. Intelligent anomaly identification of uplift pressure monitoring data and structural diagnosis of concrete dam. Appl. Sci. 2022, 12, 612. [Google Scholar] [CrossRef]
- Ma, C.H.; Gao, Z.Y.; Yang, J.; Cheng, L.; Chen, L. Operation performance and seepage flow of impervious body in blast-fill dams using discrete element method and measured data. Water 2022, 14, 1443. [Google Scholar] [CrossRef]
- Maldal, T.; Tappel, I.M. CO2 underground storage for Snøhvit gas field development. Energy 2004, 29, 1403–1411. [Google Scholar] [CrossRef]
- Xu, X.Y.; Yang, J.; Ma, C.H.; Qu, X.D.; Chen, J.M.; Cheng, L. Segmented modeling method of dam displacement based on BEAST time series decomposition. Measurement 2022, 202, 111811. [Google Scholar] [CrossRef]
- Cheng, L.; Ma, C.H.; Yuan, X.N.; Yang, J.; Hu, L.C.; Zheng, D.J. A literature review and result interpretation of the system identification of arch dams using seismic monitoring data. Water 2022, 14, 3207. [Google Scholar] [CrossRef]
- Pakzad, R.; Wang, S.Y.; Sloan, S.W. Numerical simulation of hydraulic fracturing in low-/high-permeability, quasi-brittle and heterogeneous rocks. Rock Mech. Rock Eng. 2018, 51, 1153–1171. [Google Scholar] [CrossRef]
- Kirkham, D. Explanation of paradoxes in Dupuit-Forchheimer seepage theory. Water Resour. 1967, 3, 609–622. [Google Scholar] [CrossRef]
- Zhao, X.L.; Huang, B.X.; Wang, Z. Experimental investigation on the basic law of directional hydraulic fracturing controlled by dense linear multi-hole drilling. Rock. Mech. Rock. Eng. 2018, 51, 1739–1754. [Google Scholar] [CrossRef]
- Yan, C.; Fan, H.; Huang, D.; Wang, G. A 2D mixed fracture–pore seepage model and hydromechanical coupling for fractured porous media. Acta Geotech 2021, 16, 3061–3086. [Google Scholar] [CrossRef]
- Oliger, J.; Sundström, A. Theoretical and practical aspects of some initial boundary value problems in fluid dynamics. Siam J. Appl. Math. 1978, 35, 419–446. [Google Scholar] [CrossRef]
- Cerfontaine, B.; Charlier, R.; Collin, F.; Taiebat, M. Validation of a new elastoplastic constitutive model dedicated to the cyclic behaviour of brittle rock materials. Rock. Mech. Rock. Eng. 2017, 50, 2677–2694. [Google Scholar] [CrossRef]
- Zhou, X.P.; Xiao, N. 3D numerical reconstruction of porous sandstone using improved simulated annealing algorithms. Rock. Mech. Rock. Eng. 2018, 51, 2135–2151. [Google Scholar] [CrossRef]
- Hu, M.M.; Veveakis, M.; Poulet, T.; Regenauer-Lieb, K. The role of temperature in shear instability and bifurcation of internally pressurized deep boreholes. Rock. Mech. Rock. Eng. 2017, 50, 3003–3017. [Google Scholar] [CrossRef]
- Shin, H.; Kim, J.B.; Kim, S.J.; Rhee, K.Y. A simulation-based determination of cap parameters of the modified Drucker–Prager cap model by considering specimen barreling during conventional triaxial testing. Comp. Mater. Sci. 2015, 100, 31–38. [Google Scholar] [CrossRef]
- Jiang, H.; Xie, Y.L. A note on the Mohr–Coulomb and Drucker–Prager strength criteria. Mech. Res. Commun. 2011, 38, 309–314. [Google Scholar] [CrossRef]
- Bhavikatti, S.S. Finite Element Analysis; New Age International: Delhi, India, 2005. [Google Scholar]
- Liu, J.J.; Liu, X.G.; Hu, Y.R.; Zhang, Z.S. Study of fluid-solid coupling flow in low permeablable oil reservoir. Chin. J. Rock. Mechan. Eng. 2002, 21, 48–54. [Google Scholar]
- Chaki, S.; Takarli, M.; Agbodjan, W.P. Influence of thermal damage on physical properties of a granite rock: Porosity, permeability and ultrasonic wave evolutions. Constr. Build. Mater. 2008, 22, 1456–1461. [Google Scholar] [CrossRef]
- Meng, Q.B.; Zhang, M.W.; Han, L.J.; Pu, H.; Chen, Y.L. Acoustic emission characteristics of red sandstone specimens under uniaxial cyclic loading and unloading compression. Rock. Mech. Rock. Eng. 2018, 51, 969–988. [Google Scholar] [CrossRef]
- Zhu, G.Y.; Liu, X.G.; Li, S.T.; Huang, Y.Z.; Hao, M.Q. A study of slippage effect of gas percolation in low permeability gas pools. Nat. Gas. Ind. 2007, 5, 44–47+150. [Google Scholar]
- Meng, T.; You, Y.C.; Chen, J.; Hu, Y.Q. Investigation on the permeability evolution of gypsum interlayer under high temperature and triaxial pressure. Rock. Mech. Rock. Eng. 2017, 50, 2059–2069. [Google Scholar]
- Wang, H.L.; Xu, W.Y.; Shao, J.F.; Skoczylas, F. The gas permeability properties of low-permeability rock in the process of triaxial compression test. Mater. Lett. 2014, 116, 386–388. [Google Scholar] [CrossRef]
- Shi, H.B.; Liu, B.G. Design and seepage discharge analysis of artificial water curtains for water sealed underground petroleum storage caverns in rock. Chin. J. Geotech. 2010, 32, 130–137. [Google Scholar]
- Baud, P.; Zhu, W.; Wong, T. Failure mode and weakening effect of water on sandstone. J. Geophys. Res. Solid Earth 2000, 105, 16371–16389. [Google Scholar] [CrossRef]
- Bakar, M.Z.A.; Gertsch, L.S. Evaluation of saturation effects on drag pick cutting of a brittle sandstone from full scale linear cutting tests. Tunn. Undergr. Space Technol. Tech. 2013, 34, 124–134. [Google Scholar] [CrossRef]
- Zhang, Z.; Zhang, Y.Q.; Zheng, Y.; Zhang, J.S.; Emmanuel, F.R.; Zang, W.; Ji, R.W. Power fluctuation and wake characteristics of tidal stream turbine subjected to wave and current interaction. Energy 2023, 264, 126185. [Google Scholar] [CrossRef]
- Zhao, G.W.; Zhu, Z.; Ren, G.Z.; Wu, T.; Ju, P.; Ding, S.J.; Shi, M.; Fan, H.H. Utilization of recycled concrete powder in modification of the dispersive soil: A potential way to improve the engineering properties. Constr. Build. Mater. 2023, 389, 131626. [Google Scholar] [CrossRef]
- Zhang, Y.; Zang, W.; Zheng, J.H.; Lorenzo, C.; Zhang, J.S.; Zheng, Y.; Fernandez-Rodriguez, E. The influence of waves propagating with the current on the wake of a tidal stream turbine. Appl. Energy 2021, 290, 116729. [Google Scholar] [CrossRef]
- Zang, W.; Zheng, Y.; Zhang, Y.; Lin, X.; Li, Y.; Fernandez-Rodriguez, E. Numerical Investigation on a Diffuser-Augmented Horizontal Axis Tidal Stream Turbine with the Entropy Production Theory. Mathematics 2023, 11, 116. [Google Scholar] [CrossRef]
- Zhao, G.W.; Wu, T.; Ren, G.Z.; Zhu, Z.; Gao, Y.; Shi, M.; Ding, S.J.; Fan, H.H. Reusing waste coal gangue to improve the dispersivity and mechanical properties of dispersive soil. J. Clean Prod. 2023, 404, 136993. [Google Scholar] [CrossRef]


Disclaimer/Publisher’s Note: The statements, opinions and data contained in all publications are solely those of the individual author(s) and contributor(s) and not of MDPI and/or the editor(s). MDPI and/or the editor(s) disclaim responsibility for any injury to people or property resulting from any ideas, methods, instructions or products referred to in the content. |
© 2023 by the authors. Licensee MDPI, Basel, Switzerland. This article is an open access article distributed under the terms and conditions of the Creative Commons Attribution (CC BY) license (https://creativecommons.org/licenses/by/4.0/).