Article

Flood Simulations Using a Sensor Network and Support Vector Machine Model

Department of Physical Geography and Geoecology, Faculty of Science, Charles University, Albertov 6, 128 43 Prague, Czech Republic
Water 2023, 15(11), 2004; https://doi.org/10.3390/w15112004
Submission received: 5 April 2023 / Revised: 15 May 2023 / Accepted: 23 May 2023 / Published: 25 May 2023
(This article belongs to the Special Issue Advance in Flood Risk Management and Assessment Research)

Abstract

:
This study aims to couple the support vector machine (SVM) model with a hydrometeorological wireless sensor network to simulate different types of flood events in a montane basin. The model was tested in the mid-latitude montane basin of Vydra in the Šumava Mountains, Central Europe, featuring complex physiography, high dynamics of hydrometeorological processes, and the occurrence of different types of floods. The basin is equipped with a sensor network operating in headwaters along with the conventional long-term monitoring in the outlet. The model was trained and validated using hydrological observations from 2011 to 2021, and performance was assessed using metrics such as R2, NSE, KGE, and RMSE. The model was run using both hourly and daily timesteps to evaluate the effect of timestep aggregation. Model setup and deployment utilized the KNIME software platform, LibSVM library, and Python packages. Sensitivity analysis was performed to determine the optimal configuration of the SVR model parameters (C, N, and E). Among 125 simulation variants, an optimal parameter configuration was identified that resulted in improved model performance and better fit for peak flows. The sensitivity analysis demonstrated the robustness of the SVR model, as different parameter variations yielded reasonable performances, with NSE values ranging from 0.791 to 0.873 for a complex hydrological year. Simulation results for different flood scenarios showed the reliability of the model in reconstructing different types of floods. The model accurately captured trend fitting, event timing, peaks, and flood volumes without significant errors. Performance was generally higher using a daily timestep, with mean metric values R2 = 0.963 and NSE = 0.880, compared to mean R2 = 0.913 and NSE = 0.820 using an hourly timestep, for all 12 flood scenarios. The very good performance even for complex flood events such as rain-on-snow floods combined with the fast computation makes this a promising approach for applications.

1. Introduction

Flood forecasting is a challenging discipline in hydrological science because it aims to provide accurate, reliable, and timely forecasts of highly dynamic phenomena in complex environmental contexts [1,2,3]. Conventional hydrodynamic models are based on proven physical principles and known equations, providing a clear and intuitive understanding of the simulated process and system. This makes it easy to understand the simulation results and to identify and correct potential errors in the model setup or data sources. Using proven theoretical principles enables the design of models for universal use, facilitates interpretation of their results, and makes the modeling process transparent [4]. On the other hand, hydrodynamic models typically require specific and detailed input data describing the physical properties of the simulated system, whose availability is often limited or burdened by uneven levels of detail or quality [4,5,6]. Especially in remote areas, such as montane basins, information on channel cross-sections, bed material properties, roughness coefficients, soil properties, etc. may be lacking, sparse, generalized, or outdated. Demanding and complex model setup, calibration, and long computation times make the use of conventional hydrological and hydrodynamic models cumbersome for operational forecasts, especially in highly dynamic environments. With the rising variability of hydrometeorological processes, the need for timely hydrological forecasts has opened a niche for the application of data-driven models [7,8].
Machine learning (ML) is a dynamic and rapidly evolving area of research with significant potential in the field of hydrologic and hydrodynamic modeling [7,8,9]. Over the past decade, the use of ML models has rapidly matured from an experimental research endeavor to a mainstream approach encompassing a wide range of tools and applications [8,10,11]. Among the most widely used ML methods in hydrology are artificial neural networks (ANNs), long short-term memory (LSTM) networks, and support vector machines (SVMs). ML models have proven to be effective in situations where conventional models fail due to the complexity of the system or changing environmental conditions [12,13]. The choice of a particular model depends mainly on the nature of the task, the input data, the complexity of the environment, and the associated uncertainties.
SVM models are considered to be advantageous over ANN and LSTM networks in specific conditions, particularly when dealing with small datasets or datasets with high-dimensional features where overfitting can be a problem [14]. SVM models can efficiently handle nonlinear relationships between input and output variables, which is particularly useful in hydrological applications where nonlinear relationships are often present.
Such properties meet the needs of hydrological modeling based on inputs from wireless sensor networks. While the density of monitoring data is high compared to conventional monitoring, the time series from sensor networks are relatively short compared to the long-term studies. Sensor-based data are often burdened by uncertainties stemming from the nature of monitoring or complex environments that lead to nonlinearity in the inputs [15,16], where the robustness of SVM models can be beneficial.
SVM models have demonstrated their capability in hydrology in various environments and applications [14,17,18,19]. Due to promising results in a pilot study [20], an SVM-based model was chosen as the basis for this study.
Machine learning models can benefit from the rapidly growing availability of data, both from new sensors and from digitized historical archives. Machine learning (ML) models, employing a wide range of machine learning algorithms, can achieve high accuracy in predictions and forecasts, especially when trained on large and diverse datasets [7]. This can be particularly useful in complex and nonlinear systems, as represented by hydrological processes. ML models, however, remain black-box tools that are not rooted in the laws of physics, hydrology, or meteorology [21]. The quality of the models depends largely on the quality and structure of the input data; thus, responsible curation of the data sources is crucial for understanding the model behavior and assessing the risk of model overfitting or fitting to a false signal in data [22].
For hydrological research, the accurate and reliable monitoring of water levels is important for correctly determining discharge values, enabling analysis and modeling runoff. The potential of water level measurement techniques has been significantly enhanced in the last two decades by new sensing technologies. Distributed sensors, offering automated monitoring, provide measurements with unprecedented precision and a high frequency of monitoring [15,16]. In addition to water level monitoring, networks can collect data on a wide range of hydrometeorological variables, such as precipitation, air temperature, wind speed, solar radiation, snow depth, soil moisture, or hydrochemistry [23,24,25,26]. An important aspect of sensor networks for hydrological forecasting is their ability to provide near-real-time data availability due to digital mobile network (GSM), radio, or satellite data transfer [6].
Sensor networks are particularly important for secure monitoring in remote areas with limited coverage of conventional data sources [26]. Automated monitoring of water levels is frequently used in urbanized environments, where rapid runoff generation requires timely detection and the issuance of potential warning messages [27]. Sensor networks are also of particular importance in remote areas, such as river headwaters in montane or protected areas [15], which are decisive for runoff generation but often feature sparse networks of conventional monitoring, often limited to gauging stations at the outlets of principal basins due to the physical inaccessibility of the basin.
Conceptual models used for complex hydrological forecasting depend on a number of variables for which data are often not available with sufficient accuracy. This is typically the case for complex events such as rain-on-snow floods. The complex simulations that are run over large catchments are often time-consuming. For predictions in small catchments with rapid flood evolution, the combination of inaccuracy and slow prediction times results in high uncertainty and limited usability of the model predictions. Therefore, the use of sensor networks to automatically monitor rainfall–runoff processes in the peripheral parts of catchments, with near-real-time data access, could help fill the gap in the ability to provide flood forecasts with adequate timeliness and reliability.
The principal research questions of this study were (i) whether an automated sensor network distributed in the catchment headwaters can be used for reliable prediction of discharge in a montane basin outlet, (ii) whether an SVM machine learning model can accurately predict flood discharges in a basin with complex physiography and for a variety of flood types, and (iii) whether the aggregation of the timestep of the observations from the sensor network has an effect on the model performance and the robustness of the simulation.
The study was conducted in the mid-latitude montane basin of Vydra in the Šumava Mountains, which features frequent flooding. Most of the basin area is located in a National Park with restricted access and is equipped with only one long-term discharge monitoring station in the outlet. In the headwaters, there is an experimental wireless sensor network operated by Charles University in Prague, providing automated hydrometeorological monitoring in nested sub-catchments with online access. On the basis of a preceding pilot study [20], a machine learning model using a support vector machine (SVM) algorithm was used to simulate discharge. Using the SVM model, the sensor network data from headwaters were used to simulate discharge in the basin outlet, with the long-term official monitoring data as a reference.
The principal types of flood situations occurring in the region were simulated, including floods from regional-scale frontal precipitation, floods from convective storms, floods from spring snowmelt, and floods from rain-on-snow events.

2. Materials and Methods

2.1. Study Area

The study area was the upper Vydra basin, located in the headwaters of the Šumava Mountains (Bohemian Forest), a mountain range at the border between the Czech Republic and Germany in Central Europe (Figure 1). The basin, with an area of 90.1 km2, is located at an average altitude of 1112 m, with the outlet at Modrava (49°1′30.0216″ N, 13°29′47.1624″ E). The annual total precipitation reaches 1378 mm, with approximately 40% occurring in the form of snow [28]. The drainage network is formed by small streams with a rapid runoff response to initial precipitation [29].
The selection of this study area was motivated by the combination of suitable characteristics reflecting the needs of the study, specifically, the complexity of physiography and high variability of hydrometeorological processes, along with the appropriate setup of monitoring in the form of nested catchments, long-term operating hydrometeorological station at the outlet, and existing experimental wireless sensor network, as well as studies on the dynamics of hydrometeorological processes in the broader context [28,30,31].
The upper Vydra River basin is the source zone of frequent flooding, including large floods such as the flood in August 2002 [30]. The feature diversity of physiographic conditions and their recent alteration resulted in variable dynamics of the runoff response across the basin. Due to its position at the divide of a mountain range and variable topography, the basin has an uneven rainfall distribution, with an important effect of a precipitation shadow toward the inland part. The basin has large headwater areas covered by peatlands, significantly affecting the speed of runoff generation. Specifically, the Rokytka peatbog in the southwestern part of the basin represents the largest montane peatland complex in Central Europe [32]. The basin has undergone extensive forest disturbance due to repeated waves of bark beetle outbreaks after windstorms since the 1990s [28] and has experienced an increase in air temperatures since the mid-1980s, affecting evapotranspiration, seasonality, and runoff variability [33]. The physiography of the basin and the recent transition of its environmental conditions have contributed to rapid runoff generation and the unreliable predictability of peak flows.

2.2. Sensor Network

Data for this study were acquired from the long-term official gauging station at the basin outlet, operated by the Czech Hydrometeorological Institute, and from monitoring at selected experimental catchments, operated by Charles University at the basin headwaters. The outlet station of the Vydra basin, located at Modrava (MOD), is a part of the official hydrological monitoring and flood forecasting service. The station provides daily observations of water levels and discharges since 1933. Since 2002, the data are provided using an hourly timestep [34], allowing them to be used as a reference dataset and target for the model network in the simulated period.
Since 2005, a network of experimental sub-catchments has been established in the basin, built and operated by Charles University and comprising 10 catchments with areas of 2–5 km2, located in the selected parts of the basin [28]. The experimental catchments are comparable in terms of size and basic topographic parameters, but differ in terms of patterns of forest vegetation, land-cover structure, management practices, and levels of forest disturbance. The network consists of water level gauges using ultrasonic and hydrostatic pressure sensors and automatic meteorological stations (Figure 2). Regular direct discharge measurements are carried out to obtain accurate and up-to-date rating curves for each station.
The experimental sub-catchments of the Ptačí (PTA), Březnický (BRE), and Rokytka (ROK) brooks in the basin headwaters (Figure 1) were used as the principal data sources for short-interval automated monitoring of hydrometeorological processes. The sensor network here monitors water levels, snow depth, precipitation, and air temperatures (Table 1). The monitoring is performed automatically using a 10 min timestep, with daily data transmission via GSM to the central cloud storage, enabling online access to data. The sensor network was built and has been operated by Charles University (CU) since 2005 [28]. The water level data monitoring system employs Fiedler US1200/US3500 [35] ultrasonic water level meters and Fiedler M4016-G3 telemetric stations [36]. Water levels are observed at the outlets of the PTA, BRE, and ROK catchments. Monitoring at the outlet from the Vydra basin at Modrava (MOD) is secured by the Czech Hydrometeorological Institute (CHMI) using the same devices as in the experimental catchments (Table 1).
Precipitation is observed at ROK, BRE, PTA, and MOD by a Fiedler SR03 rain gauge [37], coupled with automatic weather stations connected with cloud data storage using the same M4016-G3 stations as the water level stations (Table 1). Snowpack measurements are performed at stations located at the outlets of MOD, PTA, and ROK. In all locations, ultrasonic snow depth measurements are performed using a Fiedler US3500 ultrasonic sensor [36] with central cloud data storage. All devices operate in a 10 min interval of measurement.

2.3. Input Data

From the monitoring data, a dataset covering the monitoring period 2011–2021, when all observed hydrometeorological parameters overlapped and were consistent, was prepared for the model setup. The observed data were aggregated in two levels of granularity. The hourly timestep was used to unify the timestep of experimental observations with the interval of monitoring at the reference CHMI station (MOD), which was used as the target for the prediction model. The daily timestep was then used to test the effect of data aggregation on model performance and to fit to the long-term official reference data provided using a daily step. In both cases, the same structure of input data was used.
On the basis of the observed data, there were calculated addition indices providing supplementary information about the basin conditions, such as the potential evapotranspiration (PET), baseflow index (BFI), and antecedent precipitation index (API) (Table 2).
Potential evapotranspiration was calculated using the Oudin formula [40]. In the mountain area where the study was conducted, other PET calculation techniques necessitated direct evapotranspiration measurements or auxiliary data, which were unavailable. Despite relying solely on air temperature as a determinant variable, the method demonstrated reliability in different geographic conditions [41,42]. For PET calculation, the PE-Oudin Python package [43] was used. The baseflow index (BFI), as an important index of basin preconditions for runoff generation, was calculated using a digital recursive filter [38] using the Python package hydrogeo/hydro [44]. The antecedent precipitation index (API) was calculated in two timespans, for 30 and 7 days. The 30 day API is a de facto standard for the determination of basin wetness preconditions on a longer timescale. The 7 day interval reflects the preconditions in a small basin with a rapid runoff response [30]. API calculation was performed using a generic formula proposed by Kohler and Linsley [39] with an evapotranspiration constant value of C = 0.93, as used by the CHMI for official calculations [45].
Prior to application in the model, the input parameters were tested for cross-correlations to avoid inclusion of redundant parameters, duplicating the same signal, and some parameters were, thus, excluded on this basis. Specifically, the calculated values of PET and BFI were retained for only one station (PTA) because of very high correlations among the stations. The resulting list of variables used as input for model training is given in Table 1 and Table 2. Prior to model training, all variables were normalized to reduce the impact of features with large variances and to improve the convergence of the optimization algorithm [46].

2.4. Model Setup

The support vector machine (SVM) algorithm was chosen as the modeling approach in this study because of its robustness, computational performance, and efficiency, which has been demonstrated in a number of studies from different environments [14,17,20]. The SVM is considered to be among the most robust prediction methods because it seeks to minimize an upper bound of the generalization error rather than the training error [47]. In addition, the solution is globally optimal under conditions that can often be met, while other machine learning algorithms, such as ANNs, can converge to local minima [48]. The applicability of the SVM model to data from a hydrometeorological sensor network was also successfully tested in a pilot study [20].
SVMs differ from neural networks and have recently become the most commonly used machine learning technique in many disciplines [49]. The SVM is a non-probabilistic classifier based on the separation of cases into distinct classes, applicable to both static and dynamic data.
The main principle of SVM classification is to transform the original input space into a higher-dimensional representation [50] By increasing the dimensionality of the data space, SVM becomes capable of finding a linear solution to separate data that may not be discernible in the original data space. It is assumed that, if the data are mapped into a space with a sufficient number of dimensions, a linear plane, i.e., a hyperplane, capable of separating the samples should be identifiable [51].
In SVM models, this dimensionality transformation is achieved by the kernel, which operates on different principles such as linear, polynomial, radial basis, or sigmoid [52]. The position of the separating hyperplane is determined according to of the location of certain points, called support vectors, which define the boundaries of the plane. The optimal solution then aims to maximize the margin around the separating hyperplane [53].
The training phase of the model is based on a complex dataset with marked samples of selected categories. For such a sample, augmentation of the data space dimensionality is performed to find a hyperplane that separates the data into categories. Complex coverage of the distinguished categories in the training sample is essential for the ability of the model to recognize them in the simulation dataset. In this study, support vector regression was used for the classification of time series data. Specifically, the nu-SVR algorithm from the LibSVM library [52] was used for model training and forecasting.
Model setup, training, and simulations were performed using the KNIME 4.7.1 Analytics Platform (Berthold et al., 2009), providing a complex environment for data science, scientific calculations, and modeling. The KNIME platform uses workflows based on visual programming and Python 3 for further integrations. The SVM model was calculated using the LibSVM library. The LibSVM learner was deployed using the nu-SVR type of SVM for regression learning on time series and with the generic parameters of kernel. The SVR parameters of Cost, Nu, and Epsilon were derived on the basis of the results of the sensitivity analysis, which tested the model performance under varying parameter values.
The modeling network consists of several interlinked blocks: (i) input data preprocessing, including nodes for data import, joining of data from different sources, computation of derived indices, selection of variables, and data normalization; (ii) the definition of validation periods and simulation scenarios, defining several events for each type of flood in the time series; (iii) the LibSVM model trainer; (iv) the LibSVM model predictor using the validation and simulation scenarios; (v) postprocessing and visualization results using Python scripting for the calculation of model performance metrics and visualization. The workflow was deployed using KNIME Analytics Platform 4.7.1. All calculations were performed on an iMac Pro workstation with an Intel Xeon eight-core 3.2 GHz processor, with 128 GB of RAM and a GPU Radeon Pro Vega 64 16 GB HBM2 for CUDA computing acceleration.
To assess the model performance, four standard metrics were calculated for each simulation: the Nash–Sutcliffe efficiency (NSE), Kling–Gupta efficiency (KGE), coefficient of determination (R2), and root-mean-square Error (RMSE). All these metrics, calculating the goodness of fit between the simulated and observed time series, are widely used in assessing model performance, while NSE and KGE specifically belong to the most popular metrics in hydrologic research [54,55]. The applied metrics have similar common underlying principles, but they handle the measures of data variability and noise differently, thus featuring different sensitivities to the scale of the data, which is important, especially if there are large differences in the magnitudes of the observed and simulated data. Not relying on a single metric is important for complex testing of the model performance and for understanding model uncertainties [55]. Calculation of the goodness of fit between the simulated and observed values was performed in Python using Hydroeval library [56], baseflow separation was calculated using the Hydrograph-py library [57], general statistical calculations were performed using the NumPy and SciPy [58] libraries, and visualization was performed using the Matplotlib library [59].

2.5. Model Training, Validation, and Simulation Scenarios

For model training, a sample covering a complex set of events typical for runoff situations and covering the principal typological categories of runoff events in the region was selected, including floods from frontal precipitation and floods from convective storms, snowmelt, and rain-on-snow events. The period of the hydrological years from 1.11.2013 to 31.10.2015 was used for model training.
For model validation, the approach of complete separation of training and test data was used to secure unbiased performance of validation [60]. The validation period was then the hydrological years of 2012 and 2015, covering the periods of 1.11.2011 to 31.10.2012. These periods comprise a complex set of hydrological situations with different intensities of hydrometeorological processes and, thus, magnitudes of the events.
A total of 12 scenarios were defined for the simulations, selected from events with flows above Q90 (90th percentile of daily flows) that occurred during the monitoring period. The simulation scenarios covered the principal types of flood events resulting from different initial situations, including (i) spring snowmelt, (ii) rain-on-snow events, (iii) frontal precipitation, and (iv) convective storms. For each of the major flood types, three events were selected, including a high-magnitude event that occurred during the observed period. These events were supplemented by events with different patterns of hydrometeorological situations to test the ability of the model to cope with complex situations.
Floods from frontal precipitation were represented by the events from spring 2013, fall 2017, and fall 2020. The most intense flood from frontal precipitation was the event from June 2013, resulting from an extensive low-pressure zone that developed over a large part of Europe. The precipitation totals in the period 1–3 June 2013 corresponded to a 20 year precipitation return period [61]. The flood crest at the MOD station was reached on 2 June at 54.6 m3·s−1, corresponding to a 5–10 year flood with amplified effects in lowlands, where it exceeded the magnitude of a 100 year flood [61]. The other simulated floods from frontal precipitation were from October 2017, which represented a single-peak event, and from November 2020, which represented a flood from lasting frontal precipitation, resulting in a series of recurrent peak flows.
For floods from convective storms, events from July 2014, June 2016, and June 2018 were selected. The most extreme event was the flood from 25 June 2016. This convective storm formed in a humid and unstable air mass with daily air temperatures exceeding 30 °C and resulted in a series of thunderstorms with torrential rain, strong winds, and hail. The precipitation during the event exceeded 75 mm in 24 h and turned into a flashflood with a sudden rise and a short duration, which is an event that is typically difficult to predict with conventional models in montane environments. The other simulated events were a storm on dry preconditions from June 2018 and a series of convective storms in July 2014.
For snowmelt floods, events from the springs of 2016 and 2020 were selected. The flood from spring 2016 represented a complex event with multiple peaks. This situation represents a common type of spring flood resulting from gradual snowmelt at the end of the winter season. In such situations, snowmelt is driven by rising temperatures and accelerated by liquid precipitation of low intensity. The period of high flows, used for the scenario representing a snowmelt flood, lasted for 25 days. As another example of the flood from spring snowmelt, the event from April 2020 was selected, when the snowmelt was relatively fast and resulted in a single-peak flood.
Rain-on-snow floods were represented by the two events from the winters of 2015 and 2020. The most extreme event was the flood from December 2015, which was one of the most intense winter floods in recent decades. The basin saturation by preceding precipitation and the frozen surface layer of the soil profile set the conditions for extreme runoff response to rapid snowmelt. The fresh snowpack of 20–30 cm depth was washed out in 1 day by heavy rainfall and triggered a flood of a magnitude corresponding to a return period of 20 years [62]. With climate warming, there is more liquid precipitation in winter, which does not result in complete snowmelt in all cases. Such an event of a flood from rainfall in the middle of winter, occurring on a snowpack layer that predated the event, was represented by the event from February 2020.

2.6. Sensitivity Analysis and Model Parametrization

The accuracy of support vector regression (SVR) models is significantly affected by parameterization, where three parameters—Cost, Nu, and Epsilon—have a principal effect. Cost (C) is the regularization parameter that controls the tradeoff between achieving a low training error minimizing model complexity to avoid overfitting [53]. A large C value means that the model will try to fit the training data as accurately as possible, which can lead to overfitting [63]. Epsilon (ε) represents the width of the boundary between the support vectors, which determines the error margin [64]. A smaller value of ε will result in a narrower margin, which may cause the model to overfit, while a larger ε will provide a more robust model but may be less accurate. A smaller value of Nu parameter allows the model to be more flexible, potentially resulting in better generalization performance on unseen data [65].
A sensitivity analysis was performed to find the optimum configuration of the three parameters and to test the robustness of the model. In the initial configuration, the model used the default parameter values, where C = 1, Nu = 0.5, and ε = 0.001. These parameter values were proven to be robust in a previous pilot study (Langhammer & Cesak, 2016). The sensitivity analysis used a matrix of variations of the C, Nu, and Epsilon values, while each parameter was used in the initial state, with a variation of ±10% and ±25%. As a result, a total of 125 scenarios with different parameter combinations were defined. For each scenario, a model training based on the same 2 year long training period used in the model run was performed. Then, a simulation of the hydrological year of 2015, covering a complex set of runoff events and later used for validation, was conducted, and the performance metrics of R2, NSE, KGE, and RMSE were calculated for each model variant and simulation run.

3. Results

3.1. Sensitivity Analysis and Model Validation

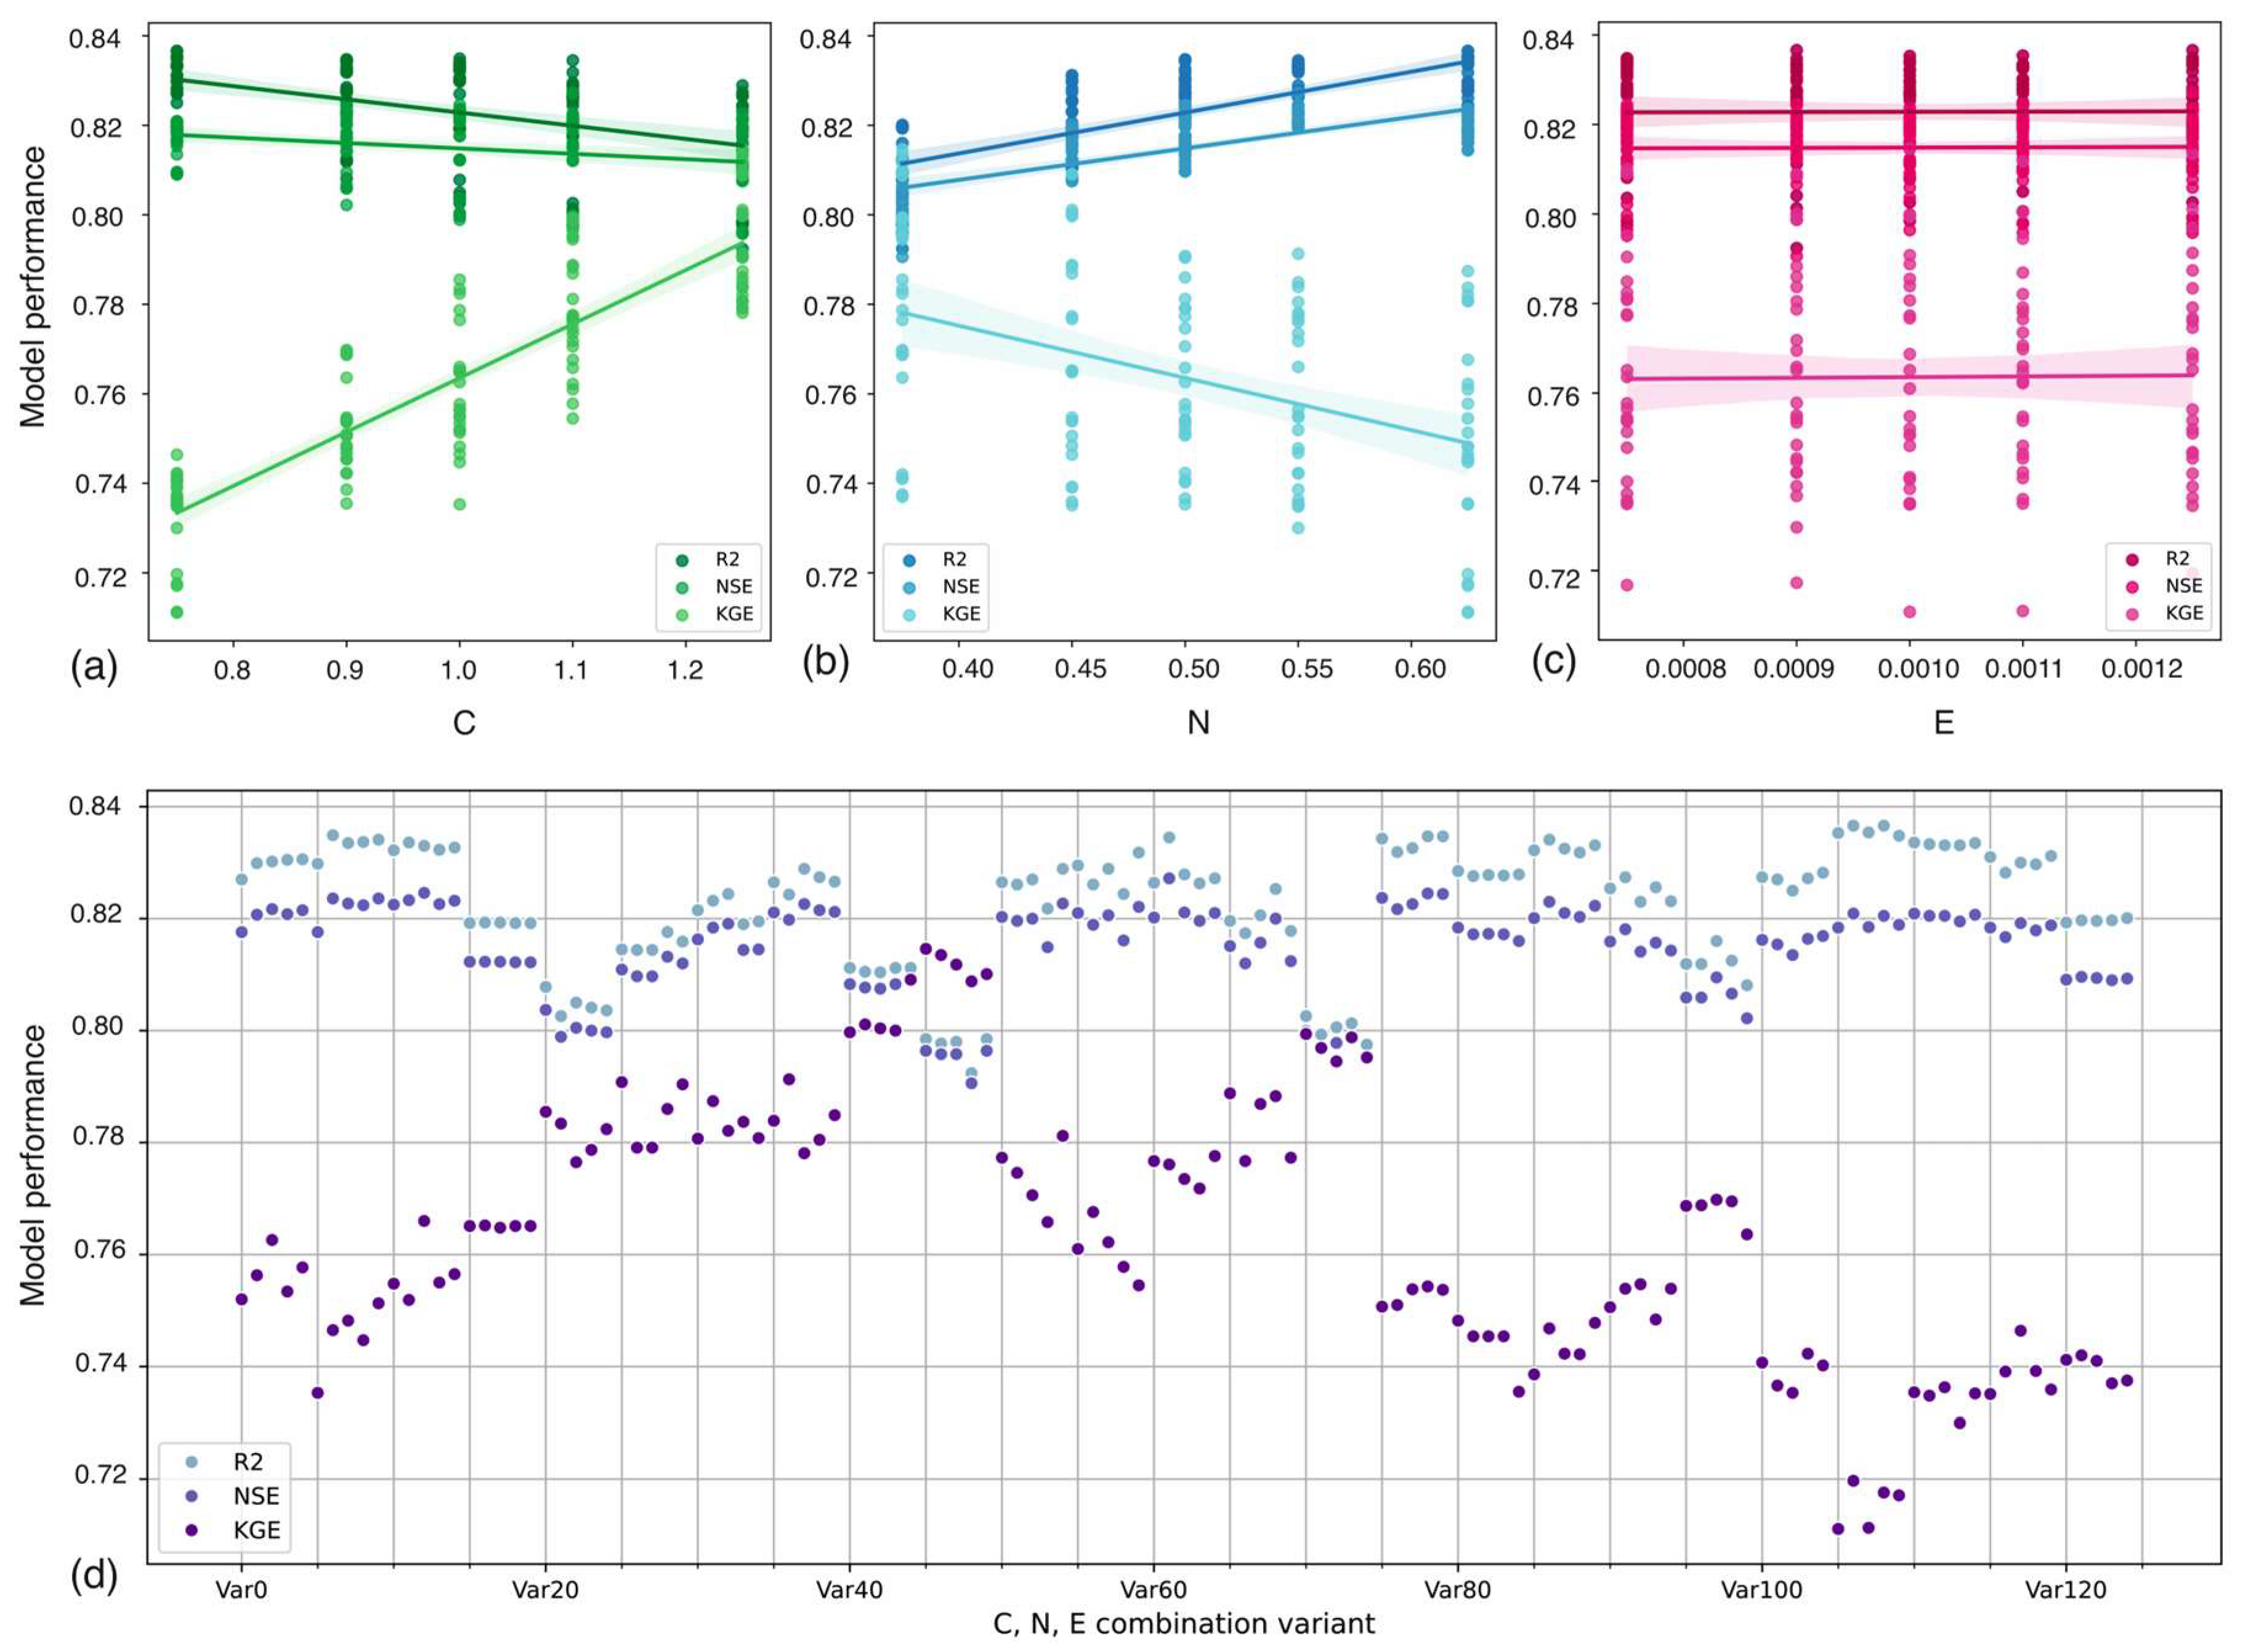
The sensitivity analysis results indicated the general stability of performance parameters (Table A1). With some exceptions, most configurations of parameters resulted in acceptable values of performance metrics. However, it is apparent that the metrics responded differently to parameter changes. Specifically, higher Cost values resulted in decreasing R2 and NSE metrics but increasing KGE values (Figure 3a). On the other hand, rising Nu values resulted in better model performance in R2 and NSE metrics but lower performance in KGE (Figure 3b). Changes in Epsilon had only limited effects on model performance (Figure 3c). Across the set of 125 model variations, there were only a limited number of variants when all three key model performance parameters agreed and featured high scores (Figure 3d).
There was no configuration in which all three metrics reached their highest scores simultaneously, whether in absolute score values or according to their ranking (Table A1). As the optimum configuration, Variant 61 was selected, featuring the values of parameters C and N increased by 10% and E increased by 25% (C = 1.1, N = 0.55, and E = 0.00125). In such a parameter configuration, all metrics featured above-average performance, while NSE reached the best value across the variants (0.827). The R2 score (0.8345) belonged among the 10 best values, while the KGE score (0.776) reached an above-average value across the tested variants (Table A1). The C, N, and E parameter values from this variant were, thus, used for model validation and simulations of all scenarios using both daily and hourly timesteps.
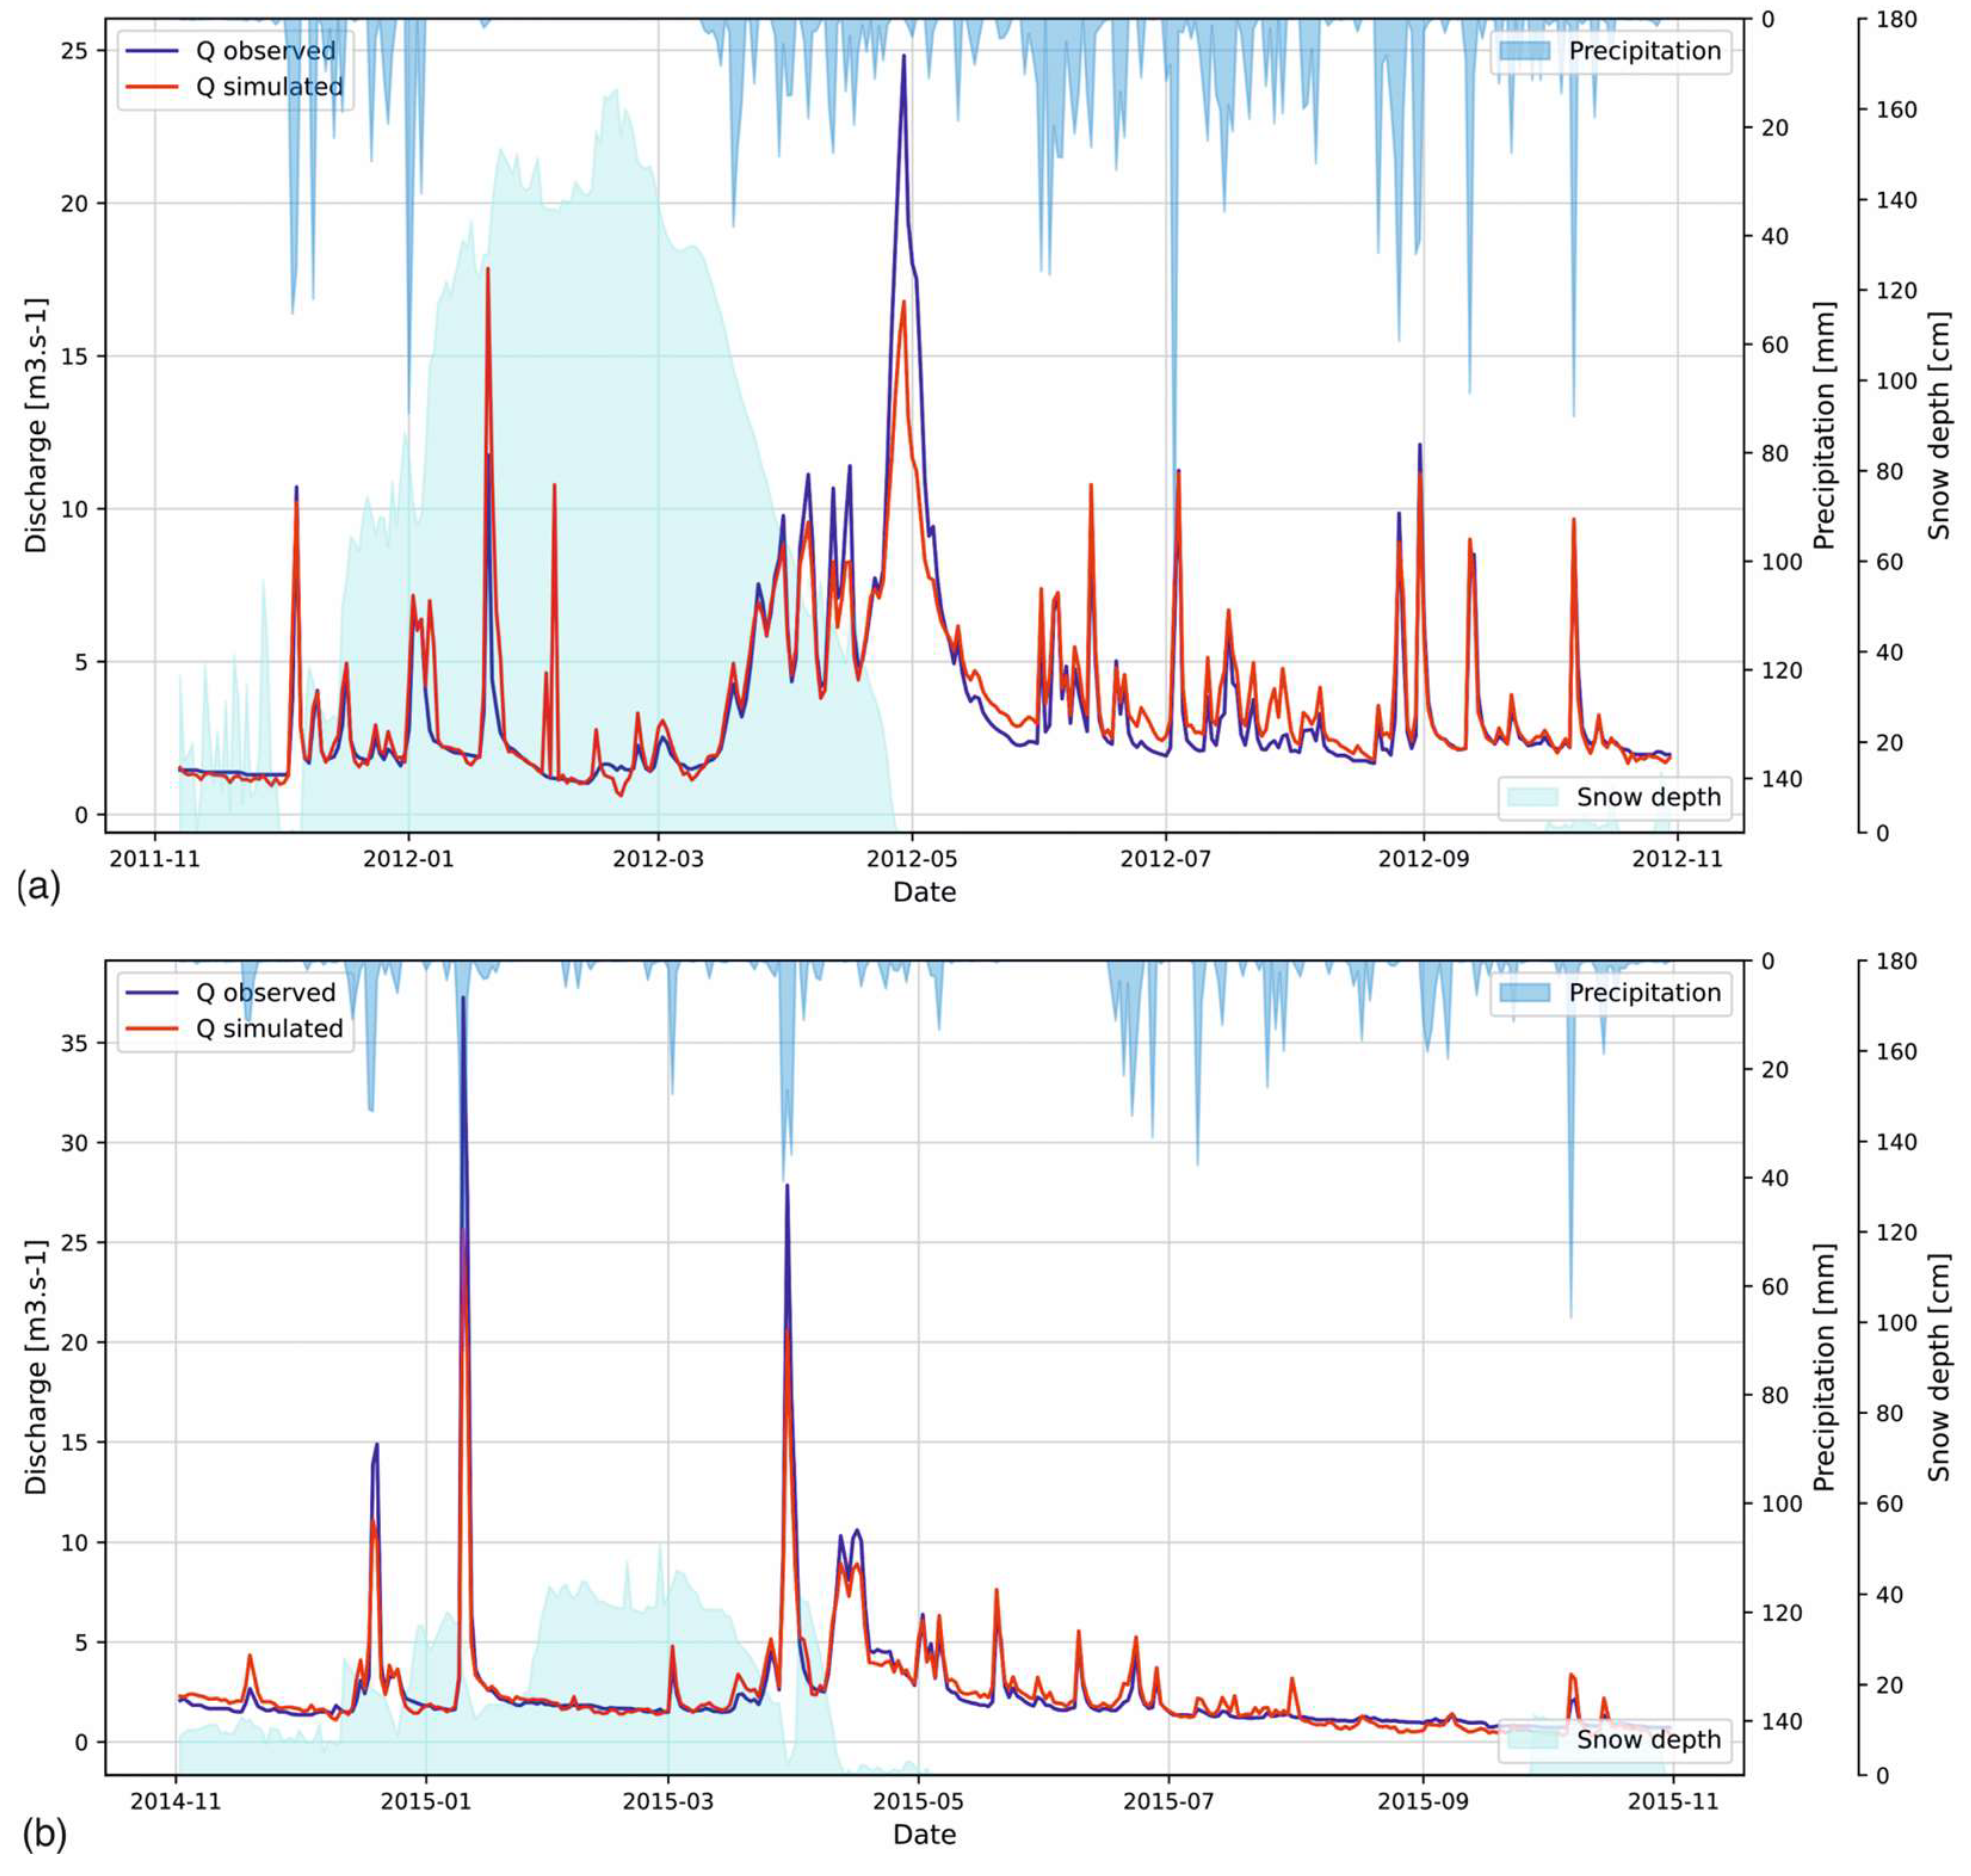
Model validation was performed on the independent part of the time series, not overlapping with the training period. This covered the hydrological years of 2012 and 2015, both featuring a complex set of events but with different dynamics of hydrometeorological processes. Model validation indicated a very close relationship fit of the simulated and observed discharge values. All principal peak flow events were captured by the model, while the simulation maintained the correct timing of the events, as well as the shape of the simulated hydrograph. For the most extreme events, the forecasted peak flows were below the observed values; in some cases, there was, in contrast, an apparent slight overestimation of discharge values (Figure 4). Despite the heterogeneity of physiographic conditions, because of the source of variable contributions of individual headwater sub-catchments during the events, the validation can be considered reliable.
The model performance for the validation periods of hydrological years 2012 and 2015 was high, reaching daily discharge simulation values of NSE = 0.831 for 2012 and 0.904 for 2015. The values for simulation using an hourly timestep were lower, reaching NSEs of 0.758 for 2012 and 0.827 for 2015 (Table 3). As the model indicated the ability to reliably reconstruct the complex set of hydrological events with satisfactory performance scores, the trained network was used to simulate the selected scenarios of individual flood events.

3.2. Floods from Frontal Precipitation

In the study region, floods from regional-scale frontal systems present the most intense type of flood risk, resulting in long-lasting events, often featuring multiple peaks. As a reference example of this type, the flood from June 2013 was selected, resulting in a 20–50 year flood and a subsequent flood wave from recurrent precipitation. The whole flood situation was simulated in a timespan of a month to capture the whole event.
Using the daily step, the SVM model was able to reliably simulate the key parameters of the flood. The model correctly simulated the number of peak flows, the generalized shape of the flood waves, and the peak flows (Figure 5a). The model performance for daily values was very high at R2 = 0.983 and NSE = 0.944 (Table 4).
Simulations using an hourly step (Figure 5c) proved the ability to reliably reconstruct all critical parameters of the flood. The number, timing, and shape of the flow peaks corresponded to the observations. The discharge of the principal flood wave reached slightly lower peak flows compared to the simulation using a daily step. However, the overall model performance remained high, with R2 = 0.970 and NSE = 0.865 (Table 4).
The simulation of the single-peak flood in October 2017 showed that the SVM model reliably predicted the shape and timing of the flood wave, with a partial underestimation of the peak discharge (Figure 5e). The hourly model of the October 2017 flood produced a small spurious peak flow in the simulation in response to the precipitation before the main event but with no effect on the rest of the simulation. However, this illustrates a typical feature of machine learning models, which tend to propagate fluctuations in the input signal into the simulation. Such artefacts are not present in the observations due to the complexity of the basin conditions, which are not understood by the machine learning model. However, this has no significant effect on the model performance, which is very high, with R2 = 0.881 and NSE = 0.844 (Table 4) for the hourly step model.

3.3. Convective Storms

Convective storm floods are the most frequent type of flooding in the study area, occurring in the warm half of the year. For the simulations, events with different preconditions and different courses were selected. The single-peak storm of June 2016 was a significant storm that reached the basin saturated by the previous rainfall. The flood from August 2014 then represented a series of four consecutive storms that repeatedly reached the basin within a 2 week period.
The SVM model of the flood from June 2016 using an hourly step displayed a very good fit to the simulated values in all simulated cases. The shape and timing of the peak flows were accurate with only negligible differences (Figure 6). The statistical performance of the model using the hourly step was high, with R2 = 0.893 and NSE = 0.87 (Table 4). The model running using a daily step indicated significant simplification of the hydrograph (Figure 6a), but with even higher model performance, with R2 = 0.922 and NSE = 0.876 (Table 4).
The simulation results of other simulated convective storms, one in dry preconditions and a series of recurrent storms, demonstrated good performance of the SVM model in predicting key event parameters but also exhibited some limitations. For instance, in a single-peak flood simulation from June 2016, the model failed to accurately reproduce the first small runoff peak prior to the flood (Figure 6c). Additionally, in a simulation of a series of floods occurring in August 2014, the model generated small runoff fluctuations in direct response to precipitation that did not appear in the observed runoff (Figure 6e). These phenomena can be attributed to the limited spatial impact of convective storms, which only affect some sub-catchments within a basin. Precipitation monitoring, although using sensors located in basin headwaters, cannot reflect the heterogeneity of precipitation distribution. Therefore, the model, which lacked a physical basis and lacked input data reflecting the spatial heterogeneity of precipitation, could not reproduce such phenomena with adequate precision. Despite the above-discussed imperfections, the model performance using an hourly timestep was higher, evidenced by R2 = 0.887 and NSE = 0.879 for the convective storm in June 2016 and an NSE of 0.818 for the series of storms from July 2014 (Table 4). The model retained its reliable forecasting capability even throughout a complex event involving four consecutive storms. Although the performance of the model decreases slightly during such complex events, it remains robust, as evidenced by an NSE of 0.875 for hourly timesteps.

3.4. Snowmelt Floods

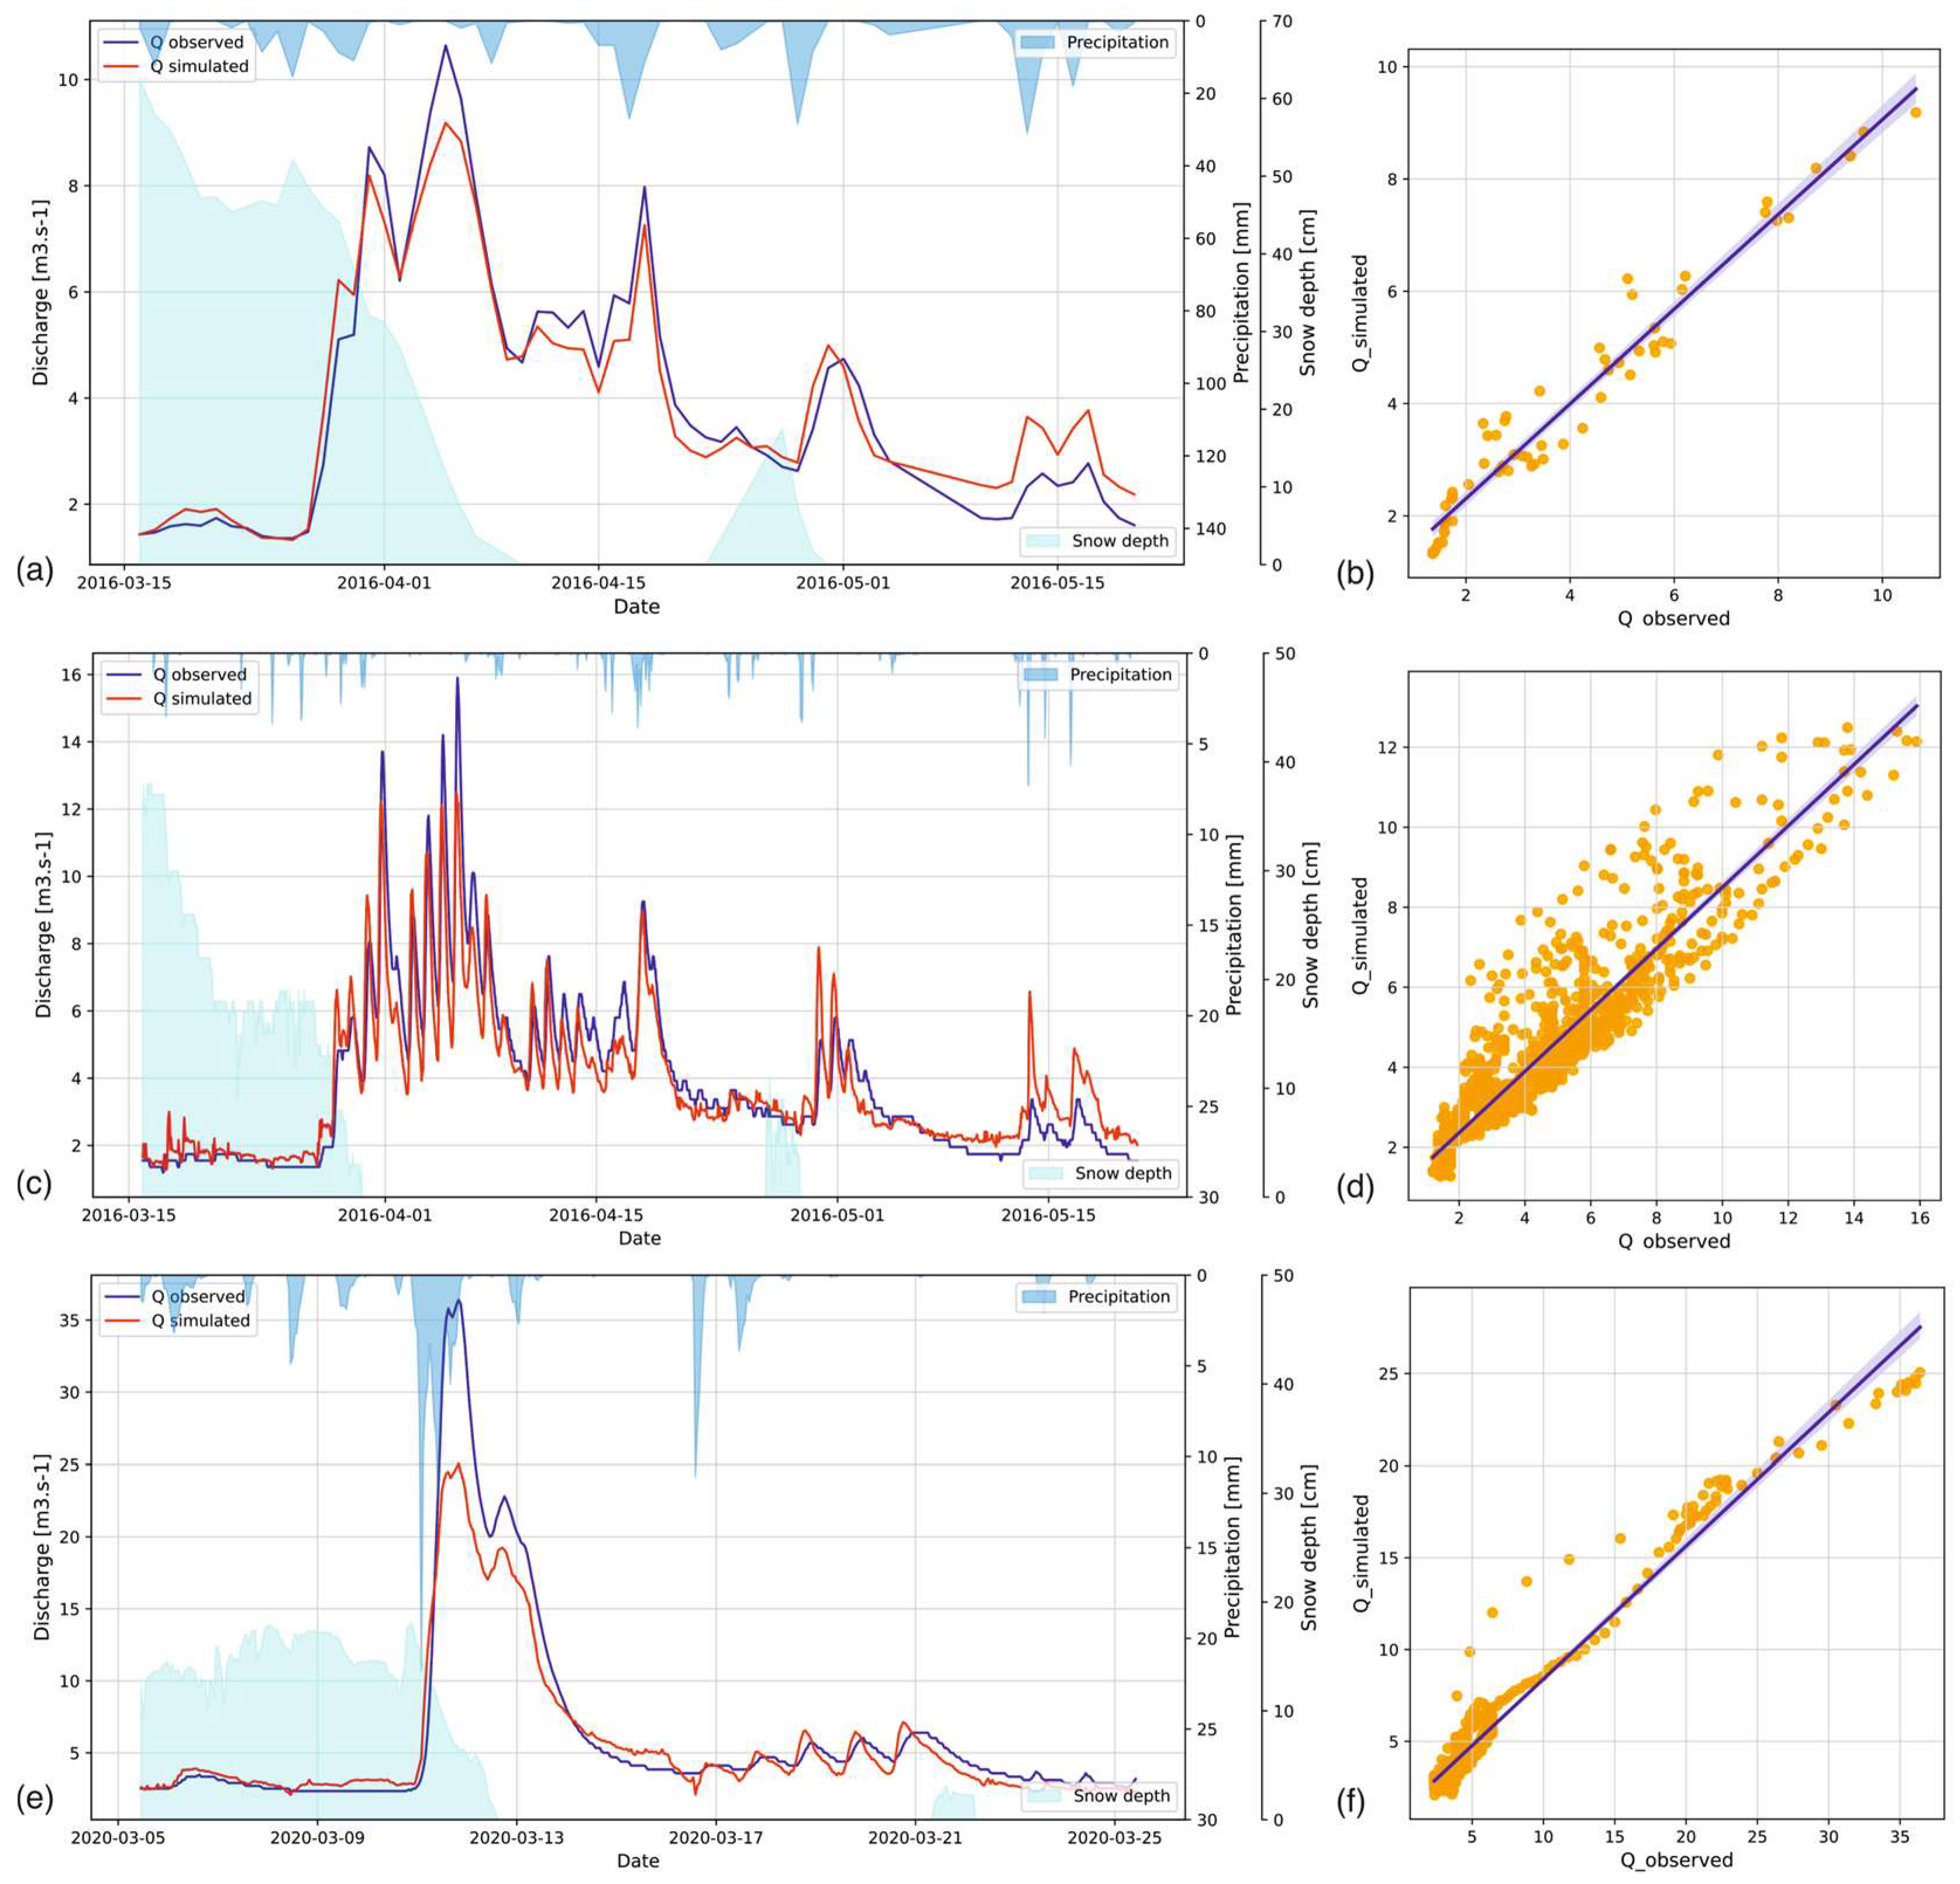
Spring snowmelt is the principal source of high flows in montane areas, while the events feature different lengths and courses. Floods from spring 2016 represented a multipeak event with complex conditions. In every subpeak, the precipitation driving the generation of surface runoff reached different conditions, from the existing snowpack in March through the frozen and saturated soil surface causing a rapid response in the beginning of April to the dry surface in May. The SVM model proved the ability to handle such complex and changing conditions using both daily and hourly steps (Figure 7a,b). The precipitation in April and May, which reached the same intensity and even slightly higher totals, resulted in a lower discharge compared with the preceding events. The model performance for snowmelt floods was very high using both daily and hourly timesteps. For the spring 2016 snowmelt flood, this was demonstrated by values of R2 = 0.953 and NSE = 0.941 using a daily step and R2 = 0.867 and NSE = 0.855 using an hourly step (Table 4).
A close fit of snowmelt flooding simulations to the observations was repeated in other scenarios (Table 4). A single-peak flood from a rapid snowmelt in March 2020 (Figure 7c) was reproduced with only marginal differences and a very high fit of simulated to observed values using the daily and hourly timesteps, as indicated by R2 values of 0.981 and 0.959, respectively (Table 4).

3.5. Rain-On-Snow Floods

Rain-on-snow events are frequent in mid-latitude montane catchments; in these conditions, they have the potential to generate extreme runoff responses. As such, the flood from December 2015 was included among the simulated floods to test the ability of the SVM model to correctly simulate this type of event. This rain-on-snow flood from 1 December 2015 was of very high intensity and short duration.
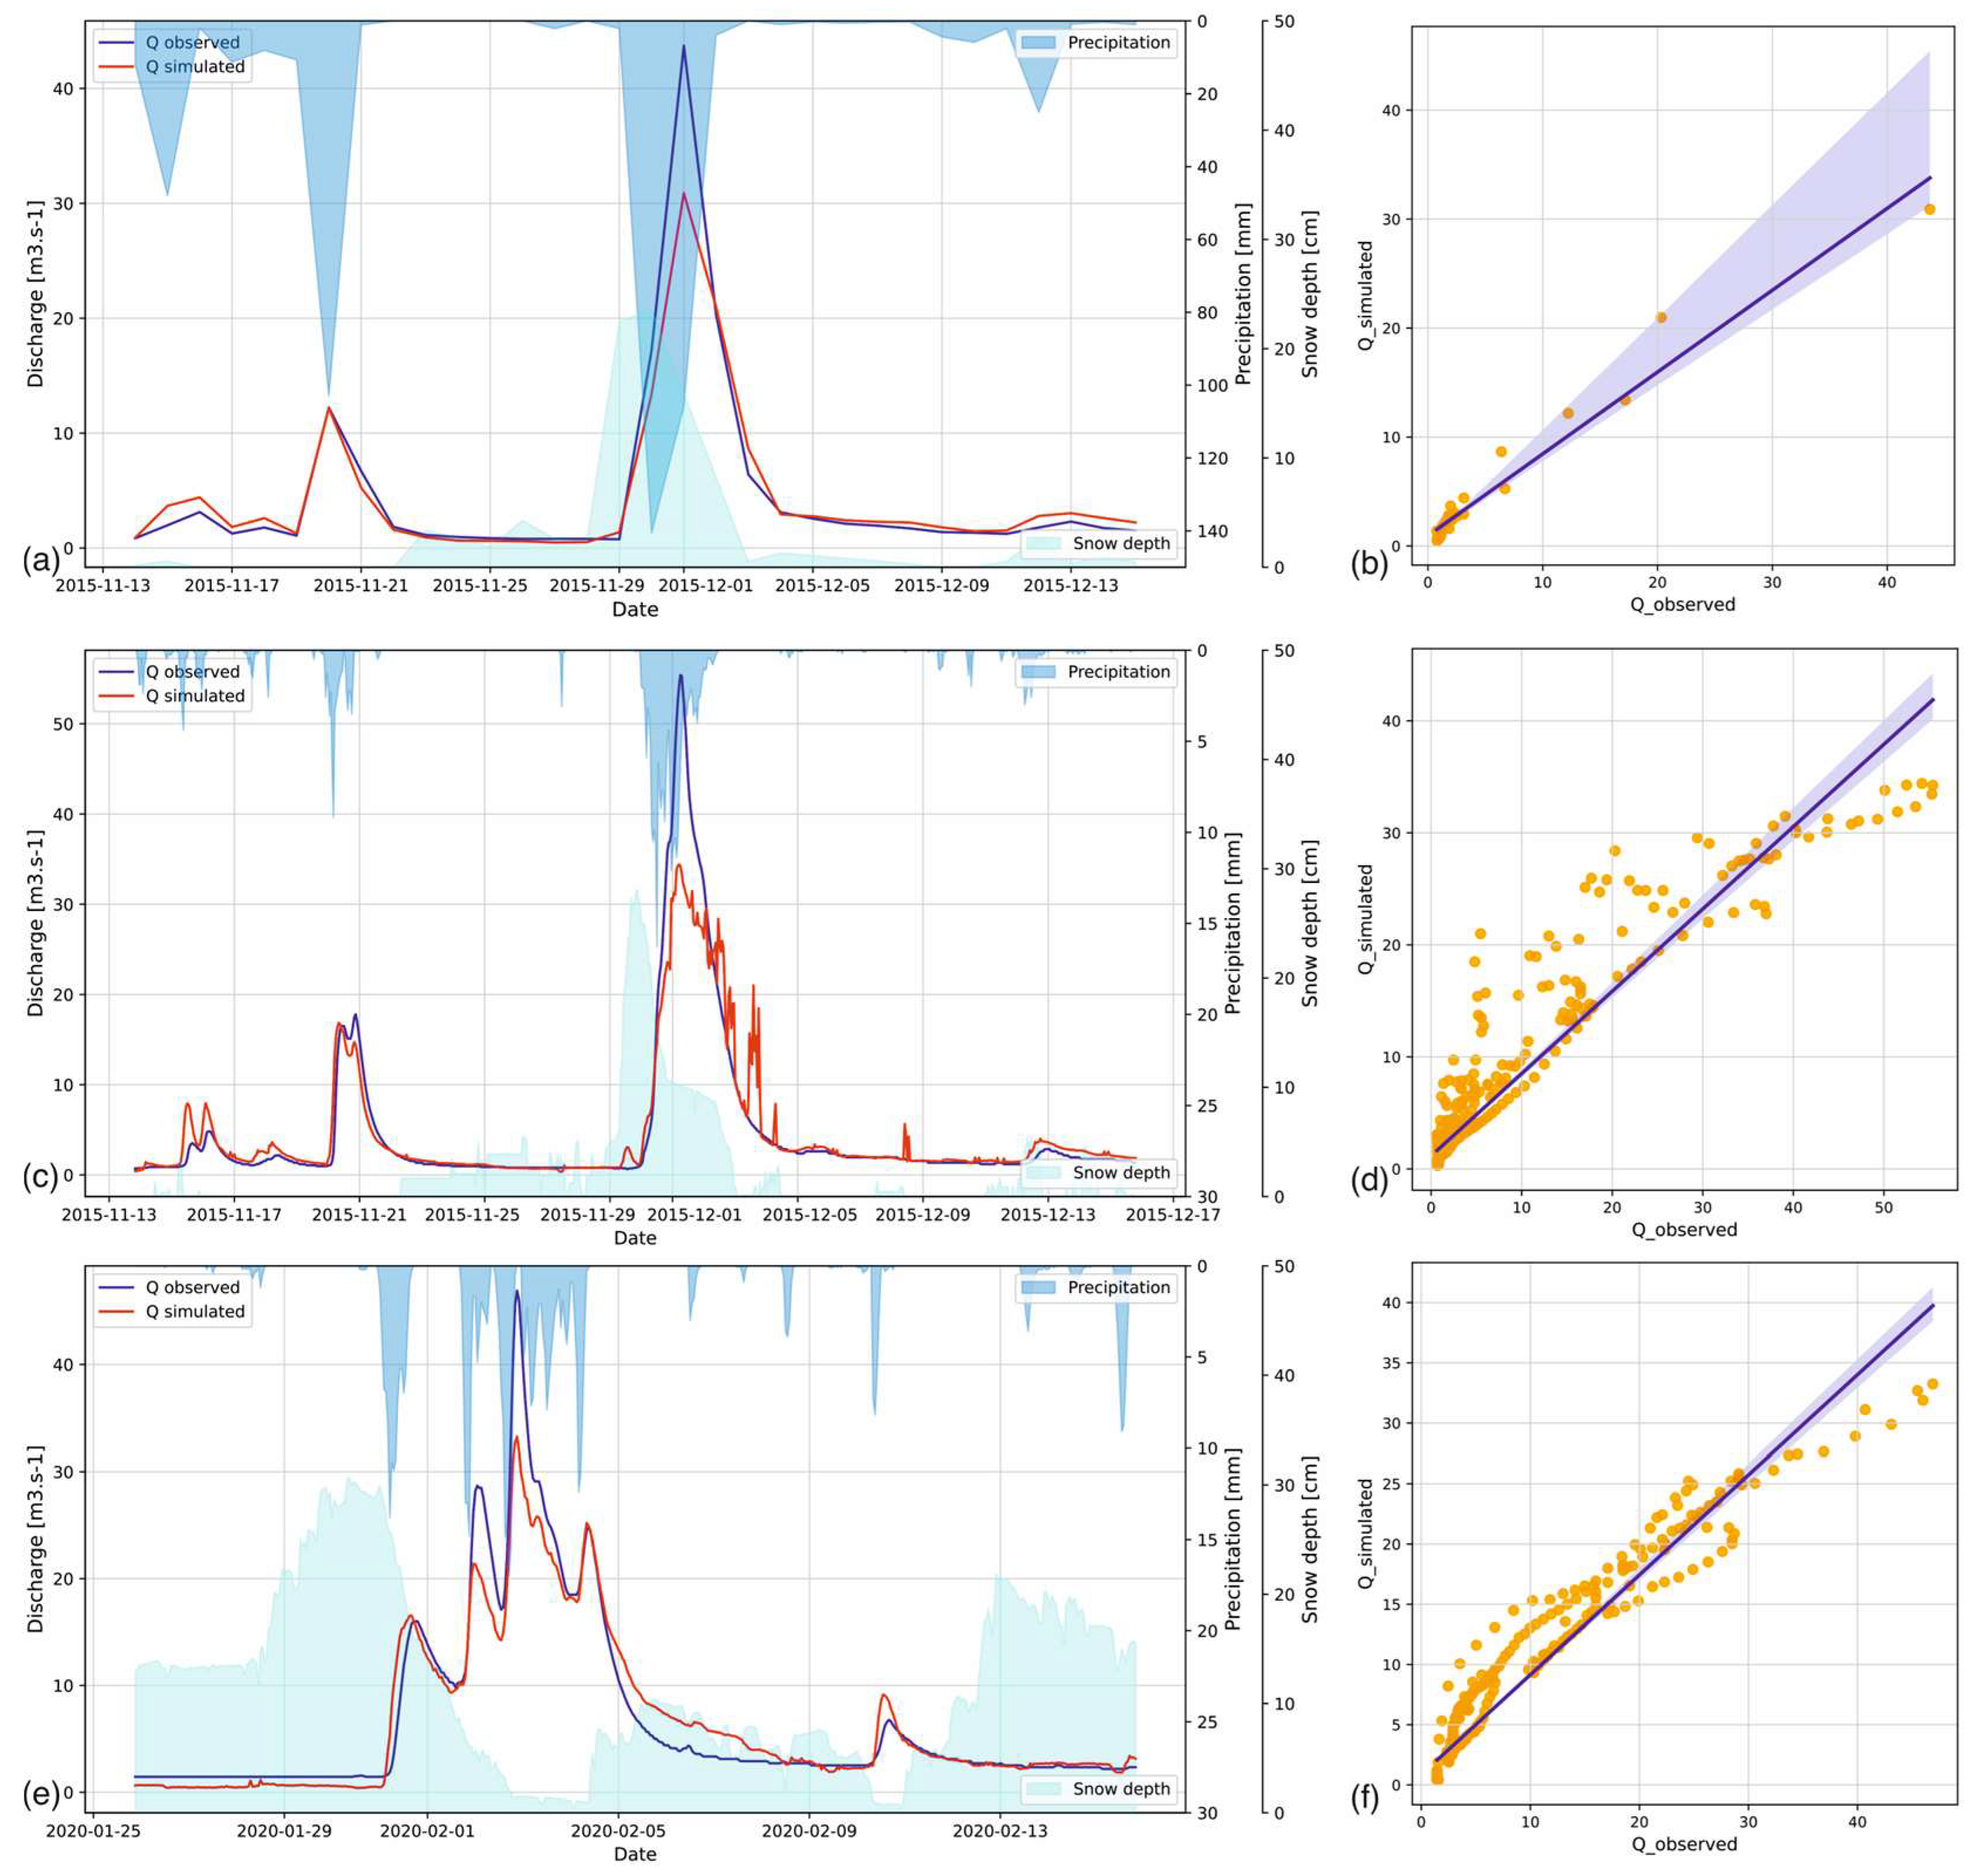
The simulation using the SVM model from hourly data indicated a very close fit of the simulated values to the observation in terms of the appropriate number of flow peaks, good fit of shape, and good timing of peaks (Figure 8). In the simulation using a daily step, the model showed a slight underestimation of the major peak, with a very solid fit of the overall course of the event and very high statistical values of model performance (R2 = 0.958, NSE = 0.913; Table 4). The simulation using an hourly step indicated an elevated sensitivity to the inputs (Figure 8c). The initial peak flow values were slightly overestimated, while the peak flow of the principal flood wave was underestimated, but with the correct timing and shape of the wave.
Simulations of the event from February 2020, when the robust snow cover was not completely washed out by the intense precipitation, resulted in reliable forecasts with realistic estimates of the shape and timing of the events (Figure 8e, Table 4). In the simulation, there was an apparent fit of the flood shape and timing of the flood waves, with a partial underestimation of peak flow values for the principal peak flow event.

4. Discussion

The data-driven model based on the SVM algorithm model demonstrated robustness and an ability to predict all types of flood events in the outlet of a complex basin, using data from a wireless senor network, placed in basin headwaters.
Hydrological models are subject to uncertainty stemming from manifold sources and affecting the quality and reliability of predictions. Hydrological systems are complex, dynamic, and nonlinear, occurring in highly heterogeneous environments; despite progress in monitoring, the available information on the processes is still incomplete and generalized [66]. For machine learning models, uncertainty is a critical aspect, as the noise in input can propagate through the model and significantly affect the model results and quality. As the principal sources of uncertainty in machine learning models, the following aspects are considered critical: (i) data availability and quality, (ii) natural variability of the simulated hydrological system, (iii) input data structure, (iv) model choice, and (iv) model calibration and validation [7,67,68].
The choice of modeling approach should reflect the specific modeling objectives, the structure, density, and quality of the data, and the constraints imposed by the specific characteristics of the given environment. In hydrological forecasting, all principal ML approaches have recently been used, ranging from artificial neural networks (ANNs) to deep learning models, such as convolutional neural networks (CNNs), long short-term memory (LSTM) networks, support vector machines (SVMs and SVRs), decision trees, and random forests [8,10,21,67]. Each of the approaches has its specific characteristics, justifying its use for flood modeling in the given context [69,70]. The LSTM and ANN models have proven their ability to capture temporal dependencies and flexibility and provide simulation over long time periods; however, they typically require complex and large datasets for training [7,68]. SVR models have proven their robustness to outliers and noise and good performance with small datasets [14,17]. Compared to the other ML methods, SVR models provide fast simulation estimates of the flood events [71].
In addition to the choice of model, the quantity, quality, and structure of input data are the most critical aspects for the accuracy and reliability of the simulation [72,73].
The use of data from sensor network monitoring enables the gaps in data availability, typically in remote areas, to be bridged and brings a new quality of monitoring by providing data with high temporal resolution and near-real-time availability [15,74]. Expert-based selection and curation of input variables, ensuring their physical meaning, as well as their variability in space and time in the given environment, and checking for potential cross-correlations among the parameters, are critical to reducing model uncertainty [20,75,76].
As for practical applications, it is important that, on the basis of the characteristics of the basin, online available data from wireless sensor networks in the headwaters of the basin can provide a similar lead time to radar estimates, which are typically used in flood forecasting [18,75]. With the fast computation provided by the SVR model, such an approach can provide readily available iterations of flood stage estimates according to the progress of events in the headwater areas, which can contribute to more accurate and timely flood risk management decisions.

4.1. Uncertainties Due to the Physiography

Data from sensor networks can be affected by noise or uncertainties due to various factors, including the role of physiographic characteristics of the given environment. Regarding the effect of physiographic characteristics, the heterogeneity of natural conditions in different parts of the watershed is particularly important.
One of the main causes of heterogeneity in runoff generation is the uneven spatial distribution of precipitation [77,78,79,80]. In mountainous watersheds with variable topography, convective storms may affect only a limited portion of the watershed, resulting in uneven contributions from headwater sub-catchments [81]. Placing wireless monitoring sensors in remote areas allows for a denser spatial network of both runoff and precipitation measurements, resulting in more accurate forecasts.
A major source of uncertainty in hydrologic models is the inhomogeneity of simulated environment physiographic properties [82,83]. A higher homogeneity of the environment results in a higher ability of the model to accurately reproduce the processes occurring within it [82,83].
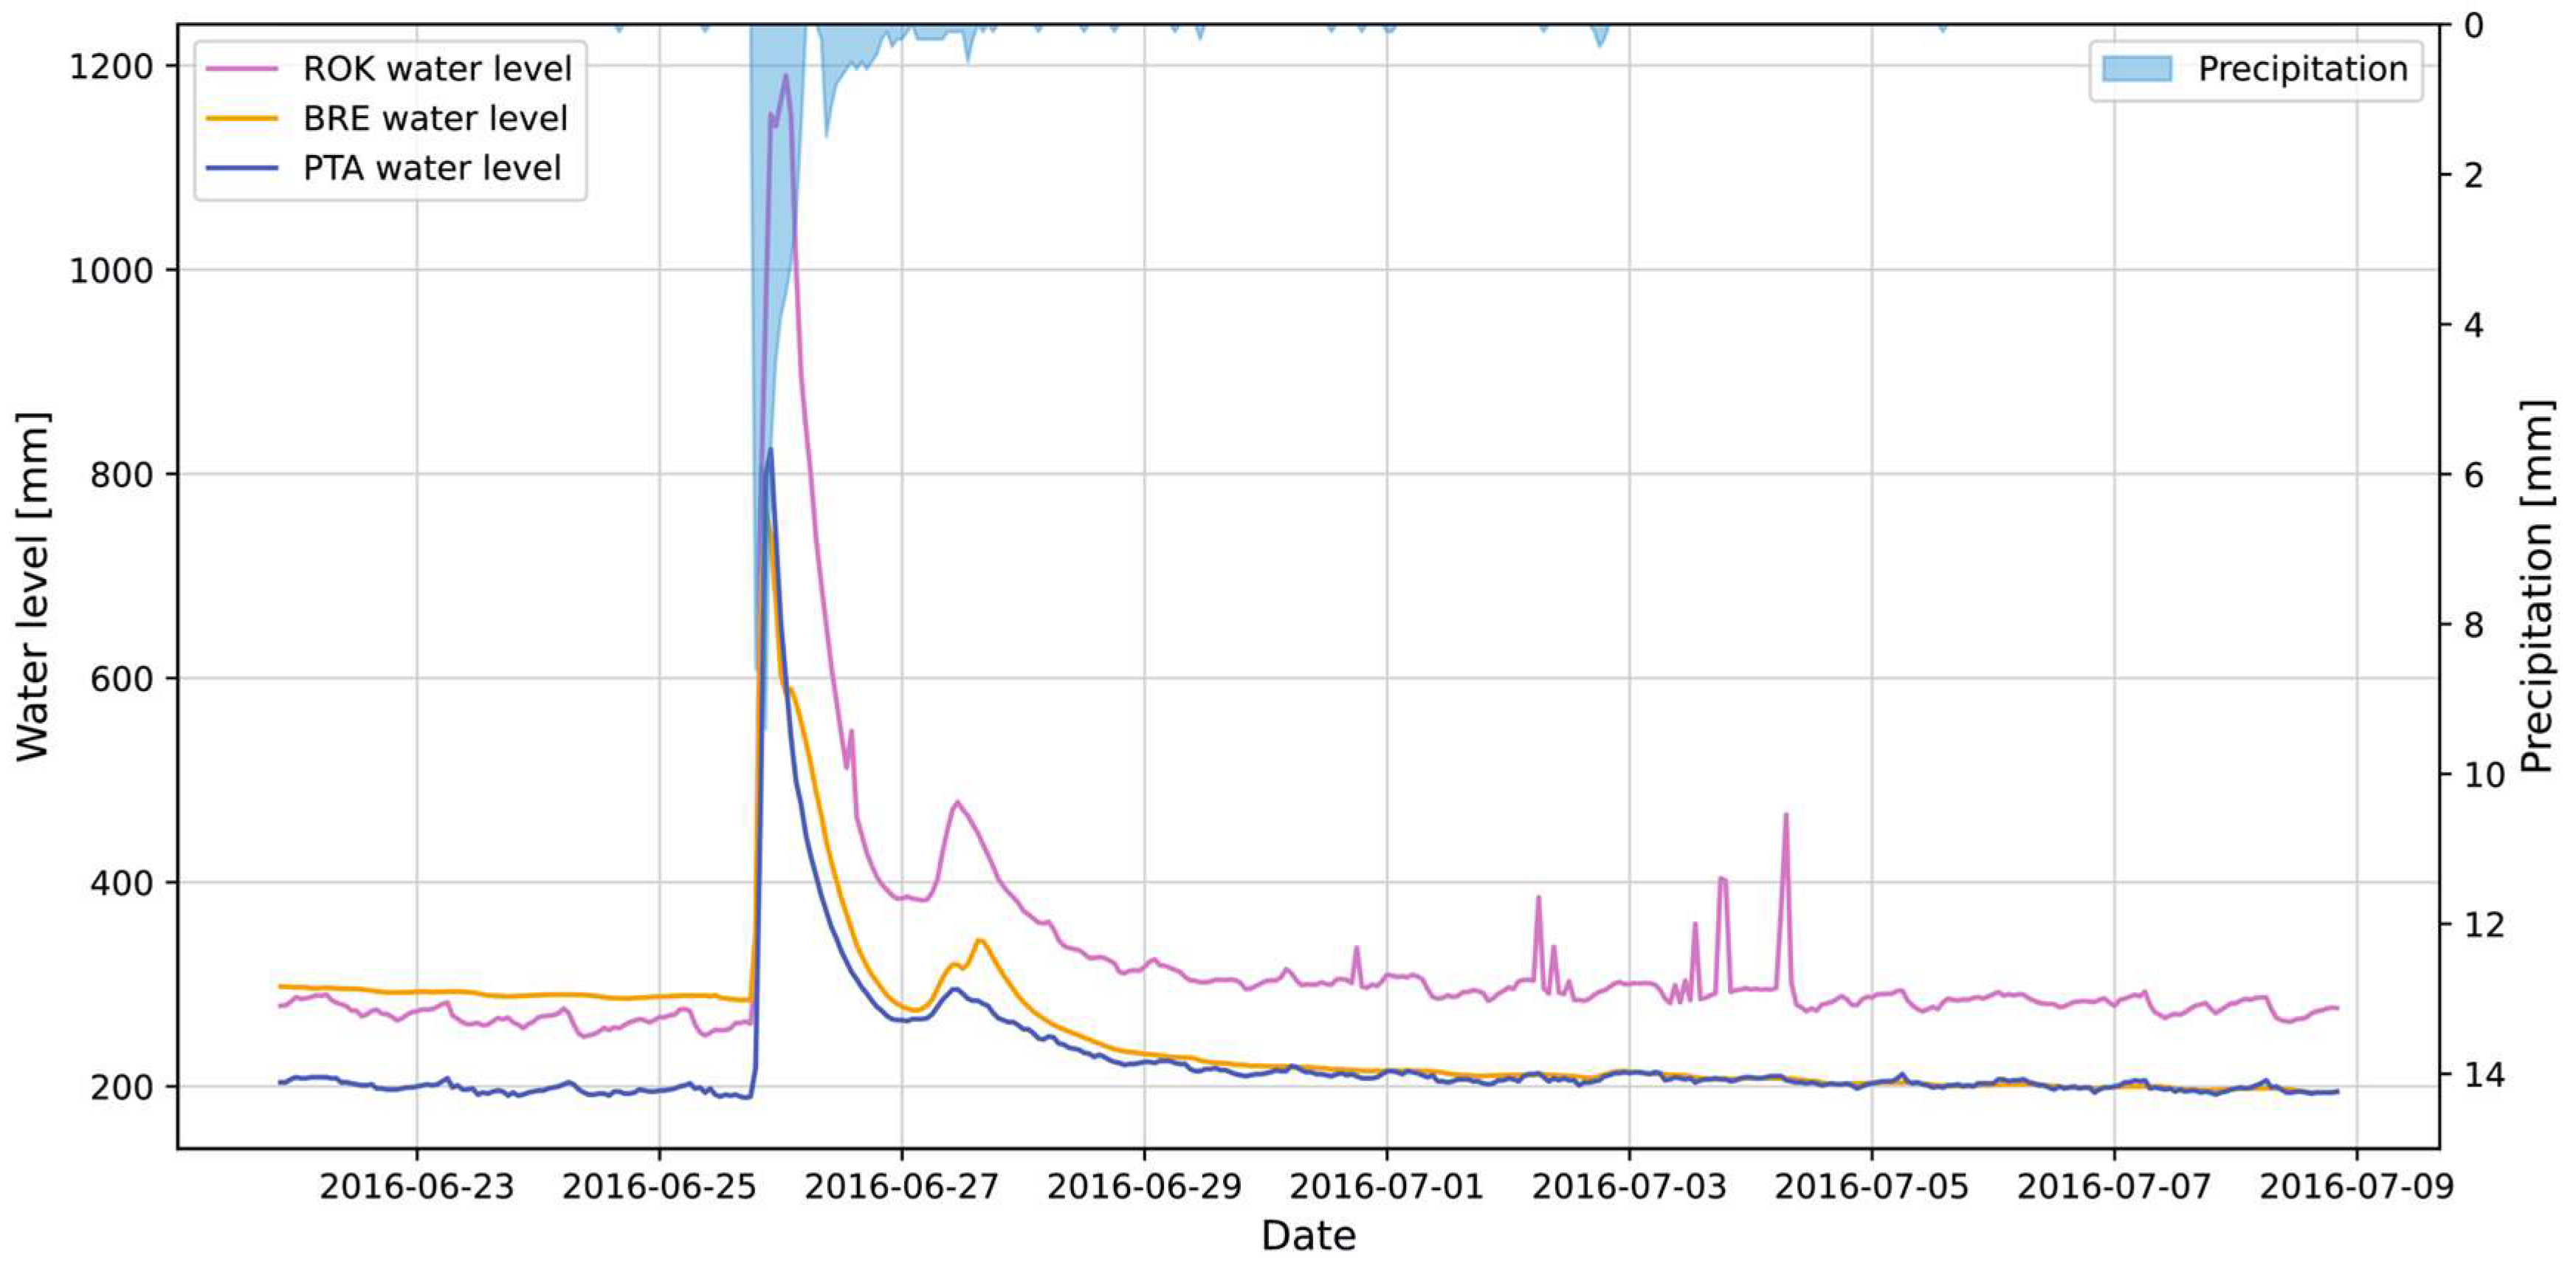
In this study, this effect could be illustrated in the case of the ROK headwater sub-catchment, which has a significantly higher proportion of peatlands compared to the other sub-catchments. [30]. As a result, due to the faster runoff generation in a peatland-dominated environment, ROK exhibited a more volatile response of discharge to precipitation (Figure 9). Such volatility in one of the inputs was subsequently propagated into the model and could lead to the generation of a false signal in the forecast in certain situations.

4.2. Limitations of Sensor Network Monitoring

The local aspects of the sensor network setup can also contribute to the occurrence of irregularities in the monitoring data [15,16]. An example of such an effect is the clogging of the outflow at the PTA monitoring station during high flows (Figure 10). During high flows, the bridge culvert where the ultrasonic sensor is mounted can become clogged with woody debris, causing the sensor beam to detect the debris instead of the water level. The gradual disintegration of the barrier is then reflected as water level fluctuations. A similar effect occurs during summer droughts, when the shallow streambed is overgrown with vegetation that can interfere with the sensor’s measurements. Such measurement artefacts, when used as model input, can cause false signals to propagate into the model.

4.3. Effect of Timestep Aggregation

The water level fluctuations discussed above result from the effects of stochastic hydrometeorological situations in catchments with complex physiography. Under such conditions, random irregularities and fluctuations occur in the signal. However, the resulting noise in the data is not of a systematic nature, which makes its reduction difficult.
Aggregating data into longer timesteps is an effective way to reduce such irregularities and noise while preserving the signal and improving model performance [84]. In our study, we tested different data granularities by comparing simulations conducted using daily and hourly timesteps. The higher generalization of the timestep resulted in a very high model agreement for all metrics. The average values of the performance metrics for all 12 scenarios reached average values of R2 = 0.963 and NSE = 0.880 using the daily timestep and average values of R2 = 0.913 and NSE = 0.820 using the hourly timestep (Table 4).
However, data aggregation not only modifies records containing noise but also affects the accurate signal. Therefore, a balance must be struck to ensure that the information value is not compromised [76]. In dynamic mountain streams, as observed in this study, the hourly timestep seemed to provide an optimal balance between level of detail and aggregation. Aggregation to longer timesteps reduces the advantages of using sensor network data, such as high-frequency monitoring and timely availability. While model performance may be high, simulations using a daily timestep oversimplify the flood hydrograph, including flood shape, flood crest timing, and lag. In addition, the delay in data delivery caused by the aggregation of daily timesteps can significantly affect the timeliness of forecasts.

4.4. Impact of Sensitivity Analysis on Model Performance

Support vector regression (SVR) models require proper parameterization for accuracy, which is primarily influenced by the Cost, Nu, and Epsilon parameters. A sensitivity analysis was performed to identify the optimal parameter configuration and to assess the robustness of the model.
The sensitivity analysis based on 125 variants of parameter combinations showed the robustness of the model, as all tested model variants showed generally acceptable results in terms of model performance metrics (Table A1).
Specifically, for the simulation of hydrological year 2015, R2 values ranged from 0.792 to 0.836, and NSE values ranged from 0.791 to 0.8727 (Table A1). The low variance of all performance metrics values indicated a robust performance of the model setup.
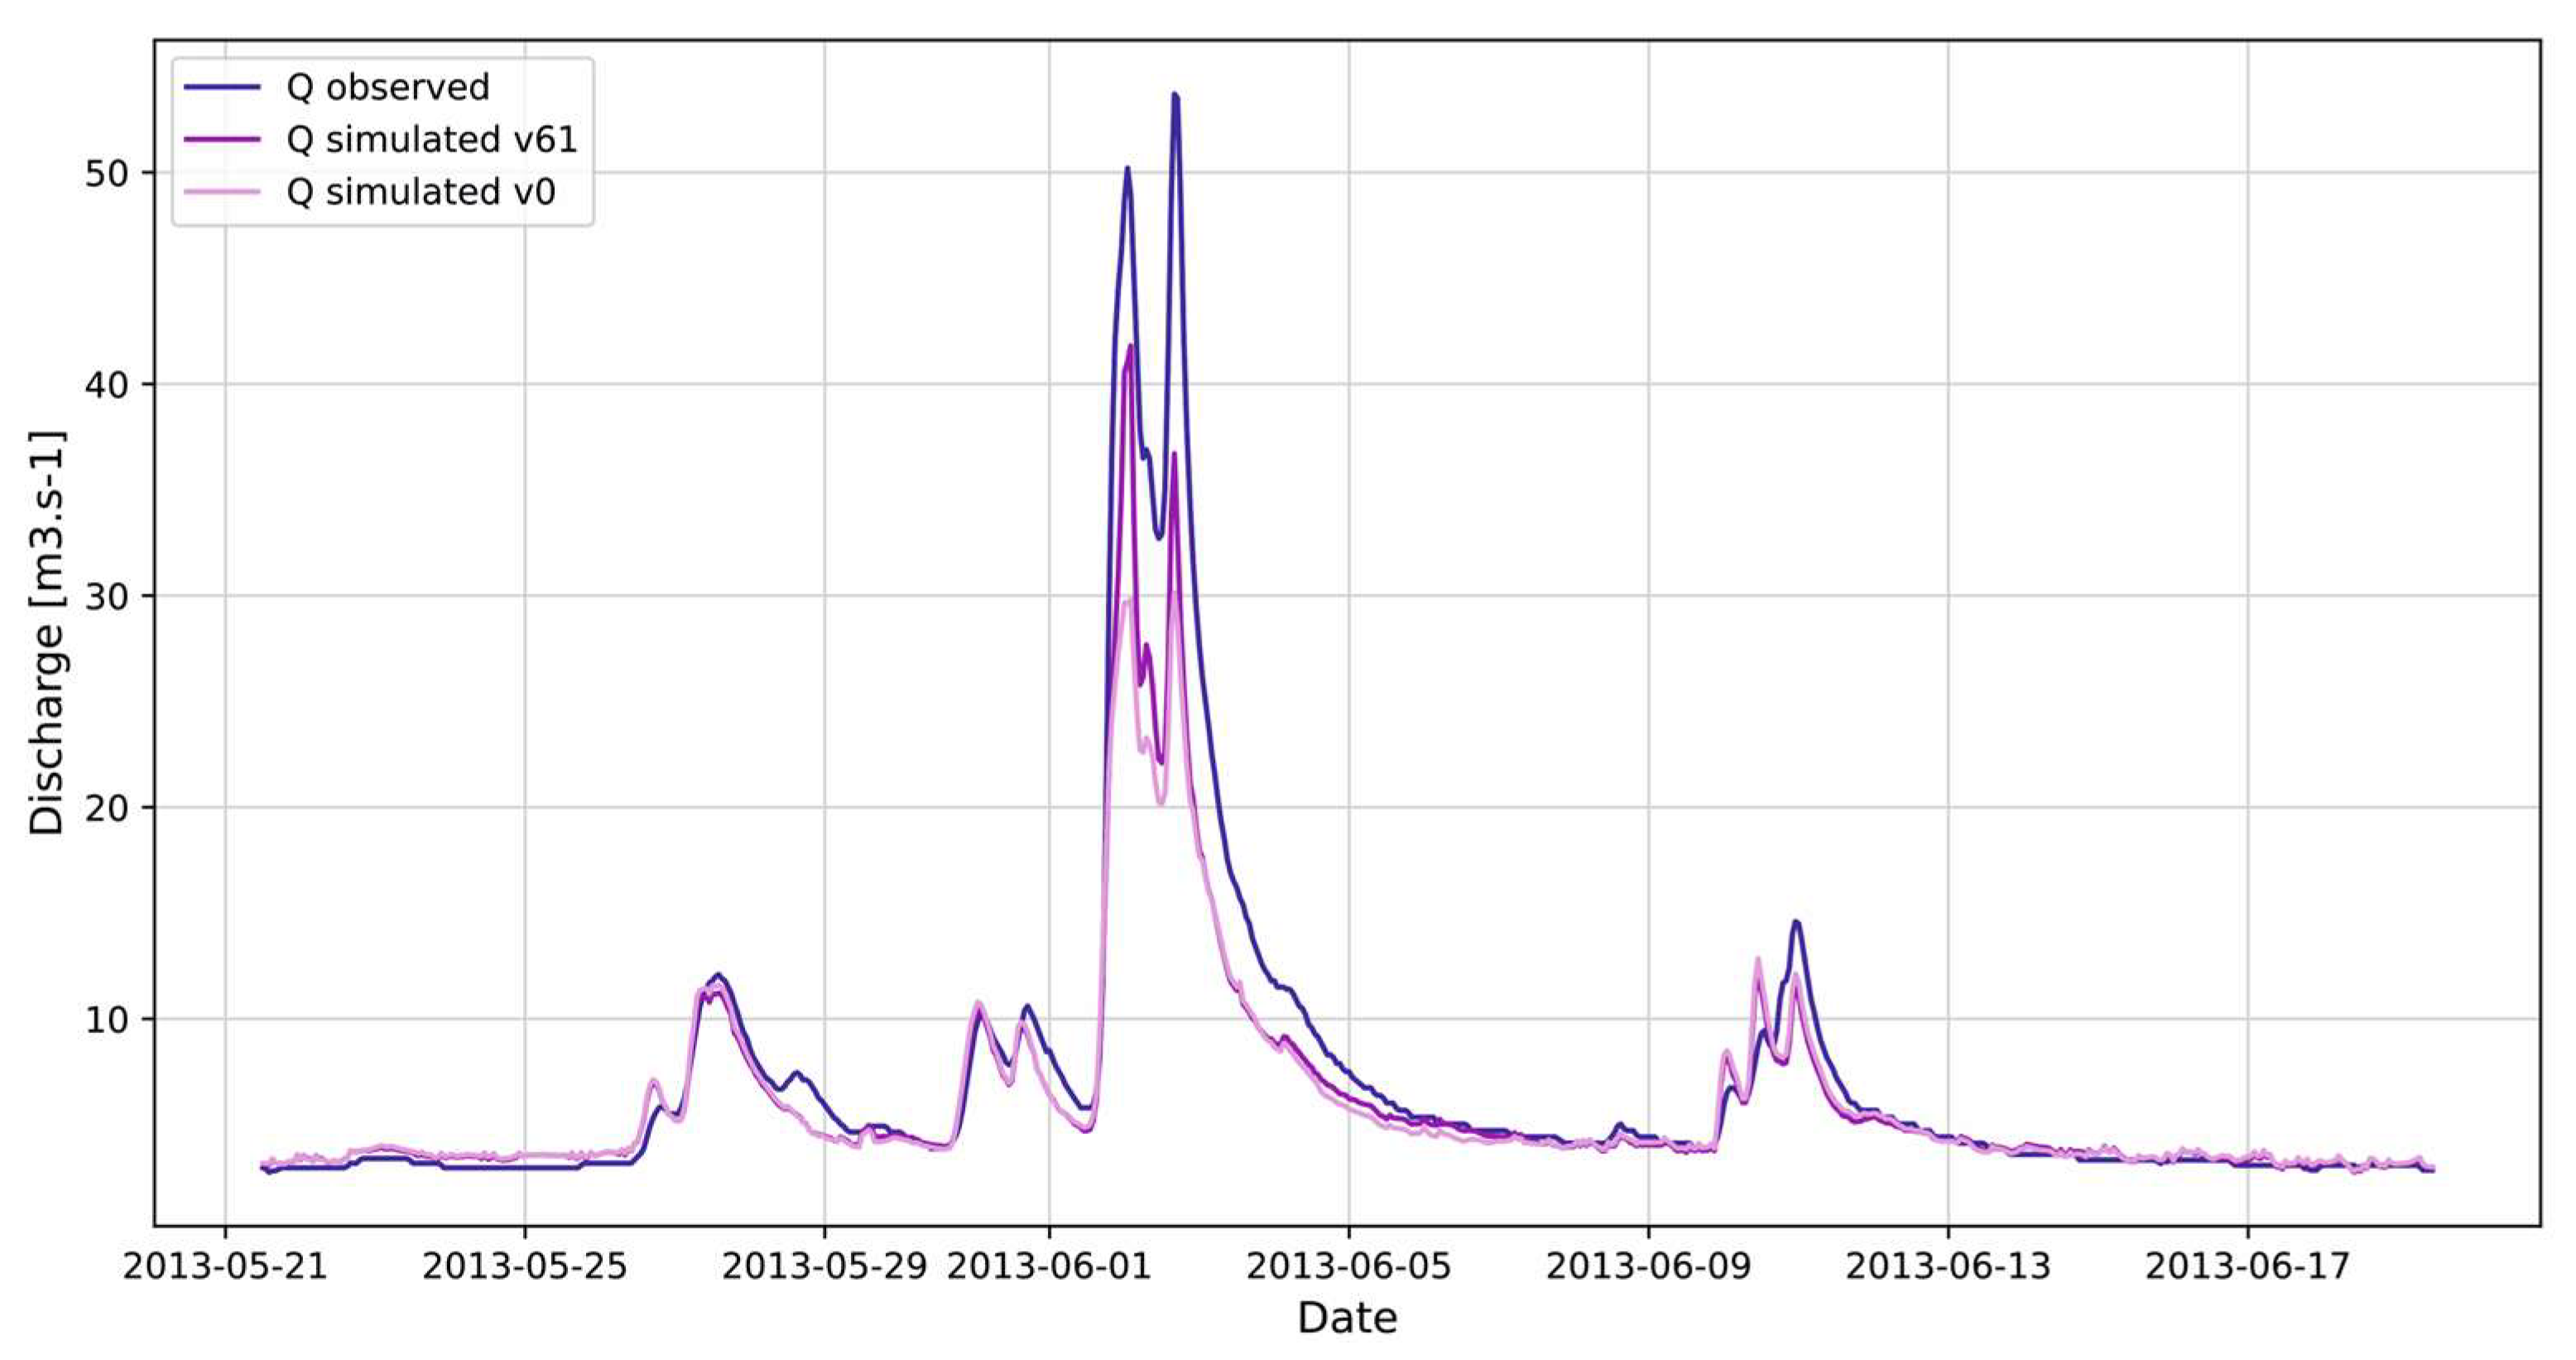
Comparing the results for the variant selected as optimal (Var61: C = 1.1, Nu = 0.55, and ε = 0.00125) with the results for the default parameter values (C = 1, Nu = 0.5, and ε = 0.001), there was a slight but clear improvement in all metrics. R2 increased from 0.827 to 0.835, NSE increased from 0.817 to 0.827, and KGE increased from 0.752 to 0.776 (Table A1). In addition to the increase in metric values, there was a significant improvement in the fit of the simulation of the peak flows of the flood events. This effect can be seen in the example of the flood caused by frontal precipitation in June 2013, where the optimization resulted in a much better fit only in the peak values, while the good fit in the other aspects of the flood hydrograph, such as its shape or the timing of the peak flows, remained unaffected (Figure 11). The results, thus, indicate that parameter optimization based on sensitivity analysis was crucial for both overall model performance, particularly for a more accurate simulation of flood peak flows.

5. Conclusions

This study tested the potential of coupling the support vector machine (SVM) model with data from a hydrometeorological wireless sensor network in a montane headwater basin to predict different types of flood events.
The model was tested in the mid-latitude montane basin of Vydra in the Šumava Mountains, Central Europe, which is characterized by complex physiography, high dynamics of hydrometeorological processes, and the occurrence of different types of floods. As input, the model uses a sensor network located in three catchments in the upper reaches of the basin. Long-term monitoring at the basin outlet serves as the reference station and model target. Automated hydrological stations in the headwaters operated in the study area from 2011 to 2021, recording water levels at 10 min intervals with online access to the data. Meteorological stations monitor air temperature, precipitation, and snow depth using the same timestep. The observed data were supplemented with calculated indices such as BFI, PET and API. The input data were aggregated at two levels of granularity using hourly and daily timesteps to verify the effect of data aggregation on model performance.
Model training was based on a 2 year period (2013–2014) covering all major types of hydrological situations, and model validation then covered two independent hydrological years. The simulated scenarios covered the main types of flood events that occurred in the region, such as flooding from regional-scale frontal precipitation, convective storms, spring snowmelt, and rain-on-snow events. Model performance was evaluated using metrics such as R2, NSE, KGE, and RMSE. The model was run using both hourly and daily timesteps to evaluate the effect of timestep aggregation. Model construction and deployment utilized the KNIME software platform, the LibSVM library, and Python programming.
Sensitivity analysis was performed to determine the optimal configuration of the main SVR model parameters (C, N, and E). Among 125 simulated parameter combinations, an optimal variant was identified with parameter values of C = 1.1, N = 0.55, and E = 0.00125. The optimization resulted in improved values of the model performance metrics compared to the default values, and a better fit of the simulations to the observations in terms of peak flows. Sensitivity analysis demonstrated the robustness of the SVR model, while simulations for a complex hydrologic year achieved solid performance for all variations of the C, N, and E parameters, with R2 values ranging from 0.793 to 0.867, and NSE values ranging from 0.791 to 0.873.
Testing the effect of timestep aggregation showed the positive effect of a longer timestep on model performance. The values of the performance metrics were generally higher using a daily timestep, with mean metric values of R2 = 0.963 and NSE = 0.880, compared to mean values of R2 = 0.913 and NSE = 0.820 achieved using an hourly timestep, for all 12 flood scenarios. However, despite better performance, aggregation to longer timesteps reduces the advantages of using sensor network data, such as high-frequency monitoring and timely availability. Thus, the hourly timestep seemingly provides an optimal balance between performance and level of detail.
The model demonstrated the robustness and good performance of the data-driven SVM model to simulate hydrological time series. The very good performance even for complex flood events such as rain-on-snow floods combined with the fast computation makes this a promising approach to provide reliable and timely forecasts.

Funding

The research was funded by the Czech Science Foundation project 22-12837S: Hydrological and hydrochemical responses of montane peat bogs to climate change. The Technology Agency of the Czech Republic project SS02030040 is gratefully acknowledged.

Data Availability Statement

Original datasets are available from the author upon request.

Conflicts of Interest

The author declares no conflict of interest.

Appendix A

Table A1. Model performance for variants of sensitivity analysis, varying the C, N, and E parameters of the SVR model.
SVR Parameter ValuesPerformance Metrics Values
VariantCNER2NSEKGERMSE
Var01.000.5000.001000.8270.8180.7521.624
Var11.000.5000.001250.8300.8210.7561.610
Var21.000.5000.001100.8300.8220.7631.605
Var31.000.5000.000900.8310.8210.7531.609
Var41.000.5000.000750.8310.8220.7581.606
Var51.000.6250.001000.8300.8180.7351.624
Var61.000.6250.001250.8350.8240.7471.597
Var71.000.6250.001100.8340.8230.7481.601
Var81.000.6250.000900.8340.8220.7451.602
Var91.000.6250.000750.8340.8240.7511.596
Var101.000.5500.001000.8320.8230.7551.602
Var111.000.5500.001250.8340.8230.7521.598
Var121.000.5500.001100.8330.8250.7661.592
Var131.000.5500.000900.8320.8230.7551.601
Var141.000.5500.000750.8330.8230.7571.599
Var151.000.4500.001000.8190.8120.7651.647
Var161.000.4500.001250.8190.8120.7651.647
Var171.000.4500.001100.8190.8120.7651.647
Var181.000.4500.000900.8190.8120.7651.647
Var191.000.4500.000750.8190.8120.7651.647
Var201.000.3750.001000.8080.8040.7851.684
Var211.000.3750.001250.8030.7990.7831.705
Var221.000.3750.001100.8050.8010.7771.698
Var231.000.3750.000900.8040.8000.7791.700
Var241.000.3750.000750.8040.8000.7821.701
Var251.250.5000.001000.8150.8110.7911.653
Var261.250.5000.001250.8140.8100.7791.658
Var271.250.5000.001100.8140.8100.7791.658
Var281.250.5000.000900.8180.8130.7861.643
Var291.250.5000.000750.8160.8120.7901.648
Var301.250.6250.001000.8220.8160.7811.629
Var311.250.6250.001250.8230.8180.7871.620
Var321.250.6250.001100.8240.8190.7821.617
Var331.250.6250.000900.8190.8140.7841.638
Var341.250.6250.000750.8200.8150.7811.637
Var351.250.5500.001000.8270.8210.7841.608
Var361.250.5500.001250.8240.8200.7911.614
Var371.250.5500.001100.8290.8230.7781.601
Var381.250.5500.000900.8270.8210.7801.606
Var391.250.5500.000750.8270.8210.7851.608
Var401.250.4500.001000.8110.8080.8001.664
Var411.250.4500.001250.8110.8080.8011.667
Var421.250.4500.001100.8100.8070.8001.668
Var431.250.4500.000900.8110.8080.8001.664
Var441.250.4500.000750.8110.8090.8091.662
Var451.250.3750.001000.7980.7960.8151.715
Var461.250.3750.001250.7980.7960.8141.718
Var471.250.3750.001100.7980.7960.8121.718
Var481.250.3750.000900.7920.7910.8091.740
Var491.250.3750.000750.7980.7960.8101.715
Var501.100.5000.001000.8270.8200.7771.611
Var511.100.5000.001250.8260.8200.7751.614
Var521.100.5000.001100.8270.8200.7711.613
Var531.100.5000.000900.8220.8150.7661.636
Var541.100.5000.000750.8290.8230.7811.601
Var551.100.6250.001000.8300.8210.7611.608
Var561.100.6250.001250.8260.8190.7681.618
Var571.100.6250.001100.8290.8210.7621.610
Var581.100.6250.000900.8240.8160.7581.630
Var591.100.6250.000750.8320.8220.7551.603
Var601.100.5500.001000.8260.8200.7771.612
Var611.100.5500.001250.8340.8270.7761.580
Var621.100.5500.001100.8280.8210.7731.608
Var631.100.5500.000900.8260.8200.7721.615
Var641.100.5500.000750.8270.8210.7781.608
Var651.100.4500.001000.8200.8150.7891.635
Var661.100.4500.001250.8170.8120.7771.648
Var671.100.4500.001100.8210.8160.7871.632
Var681.100.4500.000900.8250.8200.7881.613
Var691.100.4500.000750.8180.8120.7771.647
Var701.100.3750.001000.8030.8000.7991.700
Var711.100.3750.001250.7990.7970.7971.714
Var721.100.3750.001100.8010.7980.7941.710
Var731.100.3750.000900.8010.7990.7991.705
Var741.100.3750.000750.7980.7950.7951.721
Var750.900.5000.001000.8340.8240.7511.596
Var760.900.5000.001250.8320.8220.7511.605
Var770.900.5000.001100.8330.8230.7541.601
Var780.900.5000.000900.8350.8250.7541.592
Var790.900.5000.000750.8350.8240.7541.593
Var800.900.6250.001000.8280.8180.7481.620
Var810.900.6250.001250.8280.8170.7451.625
Var820.900.6250.001100.8280.8170.7451.625
Var830.900.6250.000900.8280.8170.7451.625
Var840.900.6250.000750.8280.8160.7351.631
Var850.900.5500.001000.8320.8200.7391.612
Var860.900.5500.001250.8340.8230.7471.599
Var870.900.5500.001100.8330.8210.7421.608
Var880.900.5500.000900.8320.8200.7421.611
Var890.900.5500.000750.8330.8220.7481.603
Var900.900.4500.001000.8250.8160.7511.631
Var910.900.4500.001250.8270.8180.7541.622
Var920.900.4500.001100.8230.8140.7551.639
Var930.900.4500.000900.8260.8160.7481.632
Var940.900.4500.000750.8230.8140.7541.638
Var950.900.3750.001000.8120.8060.7691.675
Var960.900.3750.001250.8120.8060.7691.675
Var970.900.3750.001100.8160.8100.7701.659
Var980.900.3750.000900.8130.8070.7691.672
Var990.900.3750.000750.8080.8020.7641.691
Var1000.750.5000.001000.8270.8160.7411.630
Var1010.750.5000.001250.8270.8150.7371.633
Var1020.750.5000.001100.8250.8140.7351.642
Var1030.750.5000.000900.8270.8160.7421.629
Var1040.750.5000.000750.8280.8170.7401.626
Var1050.750.6250.001000.8350.8180.7111.620
Var1060.750.6250.001250.8370.8210.7201.609
Var1070.750.6250.001100.8350.8180.7111.620
Var1080.750.6250.000900.8370.8210.7181.610
Var1090.750.6250.000750.8350.8190.7171.618
Var1100.750.5500.001000.8340.8210.7351.609
Var1110.750.5500.001250.8330.8210.7351.610
Var1120.750.5500.001100.8330.8210.7361.610
Var1130.750.5500.000900.8330.8200.7301.615
Var1140.750.5500.000750.8340.8210.7351.609
Var1150.750.4500.001000.8310.8180.7351.620
Var1160.750.4500.001250.8280.8170.7391.628
Var1170.750.4500.001100.8300.8190.7461.616
Var1180.750.4500.000900.8300.8180.7391.622
Var1190.750.4500.000750.8310.8190.7361.618
Var1200.750.3750.001000.8190.8090.7411.661
Var1210.750.3750.001250.8200.8100.7421.659
Var1220.750.3750.001100.8200.8090.7411.660
Var1230.750.3750.000900.8200.8090.7371.661
Var1240.750.3750.000750.8200.8090.7381.660

References

  1. Beven, K. Searching for the Holy Grail of Scientific Hydrology. Hydrol. Earth Syst. Sci. 2006, 10, 609–618. [Google Scholar] [CrossRef]
  2. Hall, J.; Arheimer, B.; Borga, M.; Brázdil, R.; Claps, P.; Kiss, A.; Kjeldsen, T.R.; Kriaučiūnienė, J.; Kundzewicz, Z.W.; Lang, M.; et al. Understanding Flood Regime Changes in Europe: A State-of-the-Art Assessment. Hydrol. Earth Syst. Sci. 2014, 18, 2735–2772. [Google Scholar] [CrossRef]
  3. Merz, B.; Aerts, J.; Arnbjerg-Nielsen, K.; Baldi, M.; Becker, A.; Bichet, A.; Blöschl, G.; Bouwer, L.M.; Brauer, A.; Cioffi, F.; et al. Floods and Climate: Emerging Perspectives for Flood Risk Assessment and Management. Nat. Hazards Earth Syst. Sci. Discuss. 2014, 2, 1559–1612. [Google Scholar] [CrossRef]
  4. Wagener, T.; Boyle, D.P.; Lees, M.J.; Wheater, H.S.; Gupta, H.V.; Sorooshian, S. A Framework for Development and Application of Hydrological Models. Hydrol. Earth Syst. Sci. 2001, 5, 13–26. [Google Scholar] [CrossRef]
  5. Kirchner, J.W. Getting the Right Answers for the Right Reasons: Linking Measurements, Analyses, and Models to Advance the Science of Hydrology. Water Resour. Res. 2006, 42, W03S04. [Google Scholar] [CrossRef]
  6. Kurtz, W.; Lapin, A.; Schilling, O.S.; Tang, Q.; Schiller, E.; Braun, T.; Hunkeler, D.; Vereecken, H.; Sudicky, E.; Kropf, P.; et al. Integrating Hydrological Modelling, Data Assimilation and Cloud Computing for Real-Time Management of Water Resources. Environ. Model. Softw. 2017, 93, 418–435. [Google Scholar] [CrossRef]
  7. Nevo, S.; Morin, E.; Gerzi Rosenthal, A.; Metzger, A.; Barshai, C.; Weitzner, D.; Voloshin, D.; Kratzert, F.; Elidan, G.; Dror, G.; et al. Flood Forecasting with Machine Learning Models in an Operational Framework. Hydrol. Earth Syst. Sci. 2022, 26, 4013–4032. [Google Scholar] [CrossRef]
  8. Lange, H.; Sippel, S. Machine Learning Applications in Hydrology. In Forest-Water Interactions; Levia, D.F., Carlyle-Moses, D.E., Iida, S., Michalzik, B., Nanko, K., Tischer, A., Eds.; Springer International Publishing: Cham, Switzerland, 2020; pp. 233–257. ISBN 9783030260866. [Google Scholar]
  9. Anaraki, M.V.; Farzin, S.; Mousavi, S.-F.; Karami, H. Uncertainty Analysis of Climate Change Impacts on Flood Frequency by Using Hybrid Machine Learning Methods. Water Resour. Manag. 2021, 35, 199–223. [Google Scholar] [CrossRef]
  10. Xu, T.; Liang, F. Machine Learning for Hydrologic Sciences: An Introductory Overview. WIREs Water 2021, 8, e1533. [Google Scholar] [CrossRef]
  11. Maier, H.; Dandy, G. Neural Networks for the Prediction and Forecasting of Water Resources Variables: A Review of Modelling Issues and Applications. Environ. Modell. Softw. 2000, 15, 101–124. [Google Scholar] [CrossRef]
  12. Ghobadi, F.; Kang, D. Multi-Step Ahead Probabilistic Forecasting of Daily Streamflow Using Bayesian Deep Learning: A Multiple Case Study. Water 2022, 14, 3672. [Google Scholar] [CrossRef]
  13. Forghanparast, F.; Mohammadi, G. Using Deep Learning Algorithms for Intermittent Streamflow Prediction in the Headwaters of the Colorado River, Texas. Water 2022, 14, 2972. [Google Scholar] [CrossRef]
  14. Raghavendra, N.S.; Deka, P.C. Support Vector Machine Applications in the Field of Hydrology: A Review. Appl. Soft Comput. 2014, 19, 372–386. [Google Scholar] [CrossRef]
  15. Chacon-Hurtado, J.C.; Alfonso, L.; Solomatine, D.P. Rainfall and Streamflow Sensor Network Design: A Review of Applications, Classification, and a Proposed Framework. Hydrol. Earth Syst. Sci. 2017, 21, 3071–3091. [Google Scholar] [CrossRef]
  16. Mao, F.; Clark, J.; Buytaert, W.; Krause, S.; Hannah, D.M. Water Sensor Network Applications: Time to Move beyond the Technical? Hydrol. Process. 2018, 32, 2612–2615. [Google Scholar] [CrossRef]
  17. Lin, J.-Y.; Cheng, C.-T.; Chau, K.-W. Using Support Vector Machines for Long-Term Discharge Prediction. Hydrol. Sci. J. 2006, 51, 599–612. [Google Scholar] [CrossRef]
  18. Yu, P.-S.; Yang, T.-C.; Chen, S.-Y.; Kuo, C.-M.; Tseng, H.-W. Comparison of Random Forests and Support Vector Machine for Real-Time Radar-Derived Rainfall Forecasting. J. Hydrol. 2017, 552, 92–104. [Google Scholar] [CrossRef]
  19. Han, D.; Chan, L.; Zhu, N. Flood Forecasting Using Support Vector Machines. J. Hydroinform. 2007, 9, 267–276. [Google Scholar] [CrossRef]
  20. Langhammer, J.; Česák, J. Applicability of a Nu-Support Vector Regression Model for the Completion of Missing Data in Hydrological Time Series. Water 2016, 8, 560. [Google Scholar] [CrossRef]
  21. Nearing, G.S.; Kratzert, F.; Sampson, A.K. What Role Does Hydrological Science Play in the Age of Machine Learning? Water Resour. 2021, 57, e2020WR028091. [Google Scholar] [CrossRef]
  22. Piotrowski, A.P.; Napiorkowski, J.J. A Comparison of Methods to Avoid Overfitting in Neural Networks Training in the Case of Catchment Runoff Modelling. J. Hydrol. 2013, 476, 97–111. [Google Scholar] [CrossRef]
  23. Cruz, K.M.S.D.; Ella, V.B.; Suministrado, D.C.; Pereira, G.S.; Agulto, E.S. A Low-Cost Wireless Sensor for Real-Time Monitoring of Water Level in Lowland Rice Field under Alternate Wetting and Drying Irrigation. Water 2022, 14, 4128. [Google Scholar] [CrossRef]
  24. Bogena, H.R.; Huisman, J.A.; Oberdörster, C.; Vereecken, H. Evaluation of a Low-Cost Soil Water Content Sensor for Wireless Network Applications. J. Hydrol. 2007, 344, 32–42. [Google Scholar] [CrossRef]
  25. Shahmirnoori, A.; Saadatpour, M.; Rasekh, A. Using Mobile and Fixed Sensors for Optimal Monitoring of Water Distribution Network under Dynamic Water Quality Simulations. Sustain. Cities Soc. 2022, 82, 103875. [Google Scholar] [CrossRef]
  26. Langhammer, J.; Bernsteinová, J.; Miřijovský, J. Building a High-Precision 2D Hydrodynamic Flood Model Using UAV Photogrammetry and Sensor Network Monitoring. Water 2017, 9, 861. [Google Scholar] [CrossRef]
  27. Rashid, B.; Rehmani, M.H. Applications of Wireless Sensor Networks for Urban Areas: A Survey. J. Netw. Comput. Appl. 2016, 60, 192–219. [Google Scholar] [CrossRef]
  28. Langhammer, J.; Su, Y.; Bernsteinová, J. Runoff Response to Climate Warming and Forest Disturbance in a Mid-Mountain Basin. Water 2015, 7, 3320–3342. [Google Scholar] [CrossRef]
  29. Su, Y.; Langhammer, J.; Jarsjö, J. Geochemical Responses of Forested Catchments to Bark Beetle Infestation: Evidence from High Frequency in-Stream Electrical Conductivity Monitoring. J. Hydrol. 2017, 550, 635–649. [Google Scholar] [CrossRef]
  30. Čurda, J.; Janský, B.; Kocum, J. The Effects of Physical-Geographic Factors on Flood Episodes Extremity in the Vydra River Basin. Geogr.-Sb. CGS 2011, 116, 335–353. [Google Scholar] [CrossRef]
  31. Jenicek, M.; Ledvinka, O. Importance of Snowmelt Contribution to Seasonal Runoff and Summer Low Flows in Czechia. Hydrol. Earth Syst. Sci. 2020, 24, 3475–3491. [Google Scholar] [CrossRef]
  32. Vlček, L.; Kocum, J.; Šefrna, L.; Janský, B.; Kučerová, A. Retention Potential and Hydrological Balance of a Peat Bog: Case Study of Rokytka Moors, Otava River Headwaters, Sw. Czechia. Geografie 2012, 117, 395–414. [Google Scholar] [CrossRef]
  33. Langhammer, J.; Bernsteinová, J. Which Aspects of Hydrological Regime in Mid-Latitude Montane Basins Are Affected by Climate Change? Water 2020, 12, 2279. [Google Scholar] [CrossRef]
  34. Czech Hydrometeorological Institute. Surface Water Monitoring Network; Czech Hydrometeorological Institute: Prague, Czech Republic, 2019; Available online: http://portal.chmi.cz/ (accessed on 6 March 2023).
  35. Fiedler US1200, US3200, US4200 Ultrasonic Level Meters. Available online: https://www.fiedler-magr.cz/en/products/water-level-meters/ultrasonic-level-meters/us1200-us3200-us4200-ultrasonic-level-meters (accessed on 4 February 2023).
  36. Fiedler M4016-G3 Gauge Stations. Available online: https://www.fiedler-magr.cz/en/solutions/monitoring-surface-water/gagin-stations (accessed on 4 February 2023).
  37. Fiedler SR03 Rain Gauge. Available online: https://www.fiedler-magr.cz/en/products/meteorological-stations-and-measuring-sensors/rain-gauges/sr03-rain-gauge-500cm2 (accessed on 4 February 2023).
  38. Eckhardt, K. How to Construct Recursive Digital Filters for Baseflow Separation. Hydrol. Process. 2005, 19, 507–515. [Google Scholar] [CrossRef]
  39. Kohler, M.A.; Linsley, R.K. Predicting the Runoff from Storm Rainfall; U.S. Department of Commerce: Washington, DC, USA, 1951. [Google Scholar]
  40. Oudin, L.; Hervieu, F.; Michel, C.; Perrin, C.; Andréassian, V.; Anctil, F.; Loumagne, C. Which Potential Evapotranspiration Input for a Lumped Rainfall–Runoff Model?: Part 2—Towards a Simple and Efficient Potential Evapotranspiration Model for Rainfall–Runoff Modelling. J. Hydrol. 2005, 303, 290–306. [Google Scholar] [CrossRef]
  41. Flores, N.; Rodríguez, R.; Yépez, S.; Osores, V.; Rau, P.; Rivera, D.; Balocchi, F. Comparison of Three Daily Rainfall-Runoff Hydrological Models Using Four Evapotranspiration Models in Four Small Forested Watersheds with Different Land Cover in South-Central Chile. Water 2021, 13, 3191. [Google Scholar] [CrossRef]
  42. Gharbia, S.S.; Smullen, T.; Gill, L.; Johnston, P.; Pilla, F. Spatially Distributed Potential Evapotranspiration Modeling and Climate Projections. Sci. Total Environ. 2018, 633, 571–592. [Google Scholar] [CrossRef]
  43. Paz, D. PE-Oudin. 2020. Available online: https://pypi.org/project/PE-Oudin/ (accessed on 10 February 2023).
  44. Pruitt, C. Hydrogeog/Hydro Package. 2017. Available online: https://github.com/hydrogeog/hydro (accessed on 10 February 2023).
  45. Czech Meteorological Society Meteorological dictionary—Antecedent Precipitation Index. Available online: http://slovnik.cmes.cz/heslo/1196 (accessed on 25 January 2023).
  46. Huang, C.-L.; Wang, C.-J. A GA-Based Feature Selection and Parameters Optimizationfor Support Vector Machines. Expert Syst. Appl. 2006, 31, 231–240. [Google Scholar] [CrossRef]
  47. Vapnik, V. The Nature of Statistical Learning Theory; Springer Science & Business Media: Berlin/Heidelberg, Germany, 1999; Volume 38, p. 314. [Google Scholar]
  48. Bisgin, H.; Bera, T.; Ding, H.; Semey, H.G.; Wu, L.; Liu, Z.; Barnes, A.E.; Langley, D.A.; Pava-Ripoll, M.; Vyas, H.J.; et al. Comparing SVM and ANN Based Machine Learning Methods for Species Identification of Food Contaminating Beetles. Sci. Rep. 2018, 8, 6532. [Google Scholar] [CrossRef]
  49. Huang, R.; Ma, C.; Ma, J.; Huangfu, X.; He, Q. Machine Learning in Natural and Engineered Water Systems. Water Res. 2021, 205, 117666. [Google Scholar] [CrossRef]
  50. Müller, K.R.; Smola, A.J.; Rätsch, G.; Schölkopf, B.; Kohlmorgen, J.; Vapnik, V. Predicting Time Series with Support Vector Machines. In International Conference on Artificial Neural Networks; Springer: Berlin/Heidelberg, Germany, 1997; pp. 999–1004. [Google Scholar]
  51. Dibike, Y.B.; Velickov, S.; Solomatine, D.; Abbott, M.B. Model Induction with Support Vector Machines: Introduction and Applications. J. Comput. Civ. Eng. 2001, 15, 208–216. [Google Scholar] [CrossRef]
  52. Chang, C.-C.; Lin, C.-J. LIBSVM: A Library for Support Vector Machines. ACM Trans. Intell. Syst. Technol. 2011, 2, 1–27. [Google Scholar] [CrossRef]
  53. Scholkopf, B.; Smola, A.J. Learning with Kernels: Support Vector Machines, Regularization, Optimization, and Beyond; MIT Press: Cambridge, MA, USA, 2018; ISBN 9780262536578. [Google Scholar]
  54. Ritter, A.; Muñoz-Carpena, R. Performance Evaluation of Hydrological Models: Statistical Significance for Reducing Subjectivity in Goodness-of-Fit Assessments. J. Hydrol. 2013, 480, 33–45. [Google Scholar] [CrossRef]
  55. Clark, M.P.; Vogel, R.M.; Lamontagne, J.R.; Mizukami, N.; Knoben, W.J.M.; Tang, G.; Gharari, S.; Freer, J.E.; Whitfield, P.H.; Shook, K.R.; et al. The Abuse of Popular Performance Metrics in Hydrologic Modeling. Water Resour. Res. 2021, 57, e2020WR029001. [Google Scholar] [CrossRef]
  56. Hallouin, T. Hydroeval: An Evaluator for Streamflow Time Series in Python. 2021. Available online: https://doi.org/10.5281/zenodo.4709652 (accessed on 10 March 2023).
  57. Terink, W. Hydrograph-Py. 2019. Available online: https://github.com/WilcoTerink/Hydrograph-py (accessed on 10 March 2023).
  58. Virtanen, P.; Gommers, R.; Oliphant, T.E.; Haberland, M.; Reddy, T.; Cournapeau, D.; Burovski, E.; Peterson, P.; Weckesser, W.; Bright, J.; et al. SciPy 1.0: Fundamental Algorithms for Scientific Computing in Python. Nat. Methods 2020, 17, 261–272. [Google Scholar] [CrossRef] [PubMed]
  59. Hunter, J.D. Matplotlib: A 2D Graphics Environment. Comput. Sci. Eng. 2007, 9, 90–95. [Google Scholar] [CrossRef]
  60. Vabalas, A.; Gowen, E.; Poliakoff, E.; Casson, A.J. Machine Learning Algorithm Validation with a Limited Sample Size. PLoS ONE 2019, 14, e0224365. [Google Scholar] [CrossRef]
  61. CHMI. Floods in the Czech Republic in June 2013; Daňhelka, J., Kubát, J., Šercl, P., Čekal, R., Eds.; CHMI: Prague, Czech Republic, 2014; ISBN 9788087577424. [Google Scholar]
  62. Vlasák, T. Report on the Flood in Upper Vltava River Basin—December 2015; CHMI: Prague, Czech Republic, 2015. [Google Scholar]
  63. Gunn, S. Support Vector Machines for Classification and Regression; University of Southampton: Southampton, UK, 1998. [Google Scholar]
  64. Smola, A.; Vapnik, V. Support Vector Regression Machines. Adv. Neural Inf. Process. Syst. 1997, 9, 155–161. [Google Scholar]
  65. Schölkopf, B.; Smola, A.J.; Williamson, R.C.; Bartlett, P.L. New Support Vector Algorithms. Neural Comput. 2000, 12, 1207–1245. [Google Scholar] [CrossRef]
  66. Beven, K. Environmental Modelling: An Uncertain Future? CRC Press: Boca Raton, FL, USA, 2010; ISBN 9780203932483. [Google Scholar]
  67. Kratzert, F.; Klotz, D.; Herrnegger, M. Toward Improved Predictions in Ungauged Basins: Exploiting the Power of Machine Learning. Water Resour. 2019, 55, 11344–11354. [Google Scholar] [CrossRef]
  68. Cloke, H.L.; Pappenberger, F. Ensemble Flood Forecasting: A Review. J. Hydrol. 2009, 375, 613–626. [Google Scholar] [CrossRef]
  69. Gharib, A.; Davies, E.G.R. A Workflow to Address Pitfalls and Challenges in Applying Machine Learning Models to Hydrology. Adv. Water Resour. 2021, 152, 103920. [Google Scholar] [CrossRef]
  70. Le, X.-H.; Ho, H.V.; Lee, G.; Jung, S. Application of Long Short-Term Memory (LSTM) Neural Network for Flood Forecasting. Water 2019, 11, 1387. [Google Scholar] [CrossRef]
  71. Dazzi, S.; Vacondio, R.; Mignosa, P. Flood Stage Forecasting Using Machine-Learning Methods: A Case Study on the Parma River (Italy). Water 2021, 13, 1612. [Google Scholar] [CrossRef]
  72. Wagener, T.; Montanari, A. Convergence of Approaches toward Reducing Uncertainty in Predictions in Ungauged Basins. Water Resour. Res. 2011, 47, W06301. [Google Scholar] [CrossRef]
  73. Blöschl, G.; Bierkens, M.F.P.; Chambel, A.; Cudennec, C.; Destouni, G.; Fiori, A.; Kirchner, J.W.; McDonnell, J.J.; Savenije, H.H.G.; Sivapalan, M.; et al. Twenty-Three Unsolved Problems in Hydrology (UPH)—A Community Perspective. Hydrol. Sci. J. 2019, 64, 1141–1158. [Google Scholar] [CrossRef]
  74. Kotamäki, N.; Thessler, S.; Koskiaho, J.; Hannukkala, A.O.; Huitu, H.; Huttula, T.; Havento, J.; Järvenpää, M. Wireless In-Situ Sensor Network for Agriculture and Water Monitoring on a River Basin Scale in Southern Finland: Evaluation from a Data User’s Perspective. Sensors 2009, 9, 2862–2883. [Google Scholar] [CrossRef]
  75. Mosavi, A.; Ozturk, P.; Chau, K.-W. Flood Prediction Using Machine Learning Models: Literature Review. Water 2018, 10, 1536. [Google Scholar] [CrossRef]
  76. Mediero, L.; Soriano, E.; Oria, P.; Bagli, S.; Castellarin, A.; Garrote, L.; Mazzoli, P.; Mysiak, J.; Pasetti, S.; Persiano, S.; et al. Pluvial Flooding: High-Resolution Stochastic Hazard Mapping in Urban Areas by Using Fast-Processing DEM-Based Algorithms. J. Hydrol. 2022, 608, 127649. [Google Scholar] [CrossRef]
  77. Emmanuel, I.; Andrieu, H.; Leblois, E.; Janey, N.; Payrastre, O. Influence of Rainfall Spatial Variability on Rainfall–Runoff Modelling: Benefit of a Simulation Approach? J. Hydrol. 2015, 531, 337–348. [Google Scholar] [CrossRef]
  78. Sitterson, J.; Knightes, C.; Parmar, R.; Wolfe, K.; Avant, B.; Muche, M. An Overview of Rainfall-Runoff Model Types. In Proceedings of the International Congress on Environmental Modelling and Software, Fort Collins, CO, USA, 24–28 June 2018; Available online: https://scholarsarchive.byu.edu/cgi/viewcontent.cgi?article=3977&context=iemssconference (accessed on 15 March 2023).
  79. Berger, K.P.; Entekhabi, D. Basin Hydrologic Response Relations to Distributed Physiographic Descriptors and Climate. J. Hydrol. 2001, 247, 169–182. [Google Scholar] [CrossRef]
  80. Lacroix, M.P.; Martz, L.W.; Kite, G.W.; Garbrecht, J. Using Digital Terrain Analysis Modeling Techniques for the Parameterization of a Hydrologic Model. Environ. Model. Softw. 2002, 17, 125–134. [Google Scholar] [CrossRef]
  81. Razavi, T.; Coulibaly, P. Streamflow Prediction in Ungauged Basins: Review of Regionalization Methods. J. Hydrol. Eng. 2013, 18, 958–975. [Google Scholar] [CrossRef]
  82. Gao, H.; Sabo, J.L.; Chen, X.; Liu, Z.; Yang, Z.; Ren, Z.; Liu, M. Landscape Heterogeneity and Hydrological Processes: A Review of Landscape-Based Hydrological Models. Landsc. Ecol. 2018, 33, 1461–1480. [Google Scholar] [CrossRef]
  83. Abatzoglou, J.T.; Ficklin, D.L. Climatic and Physiographic Controls of Spatial Variability in Surface Water Balance over the Contiguous U Nited S Tates Using the B Udyko Relationship. Water Resour. Res. 2017, 53, 7630–7643. [Google Scholar] [CrossRef]
  84. Van Loon, A.F.; Van Lanen, H.A.J. A Process-Based Typology of Hydrological Drought. Hydrol. Earth Syst. Sci. 2012, 16, 1915–1946. [Google Scholar] [CrossRef]
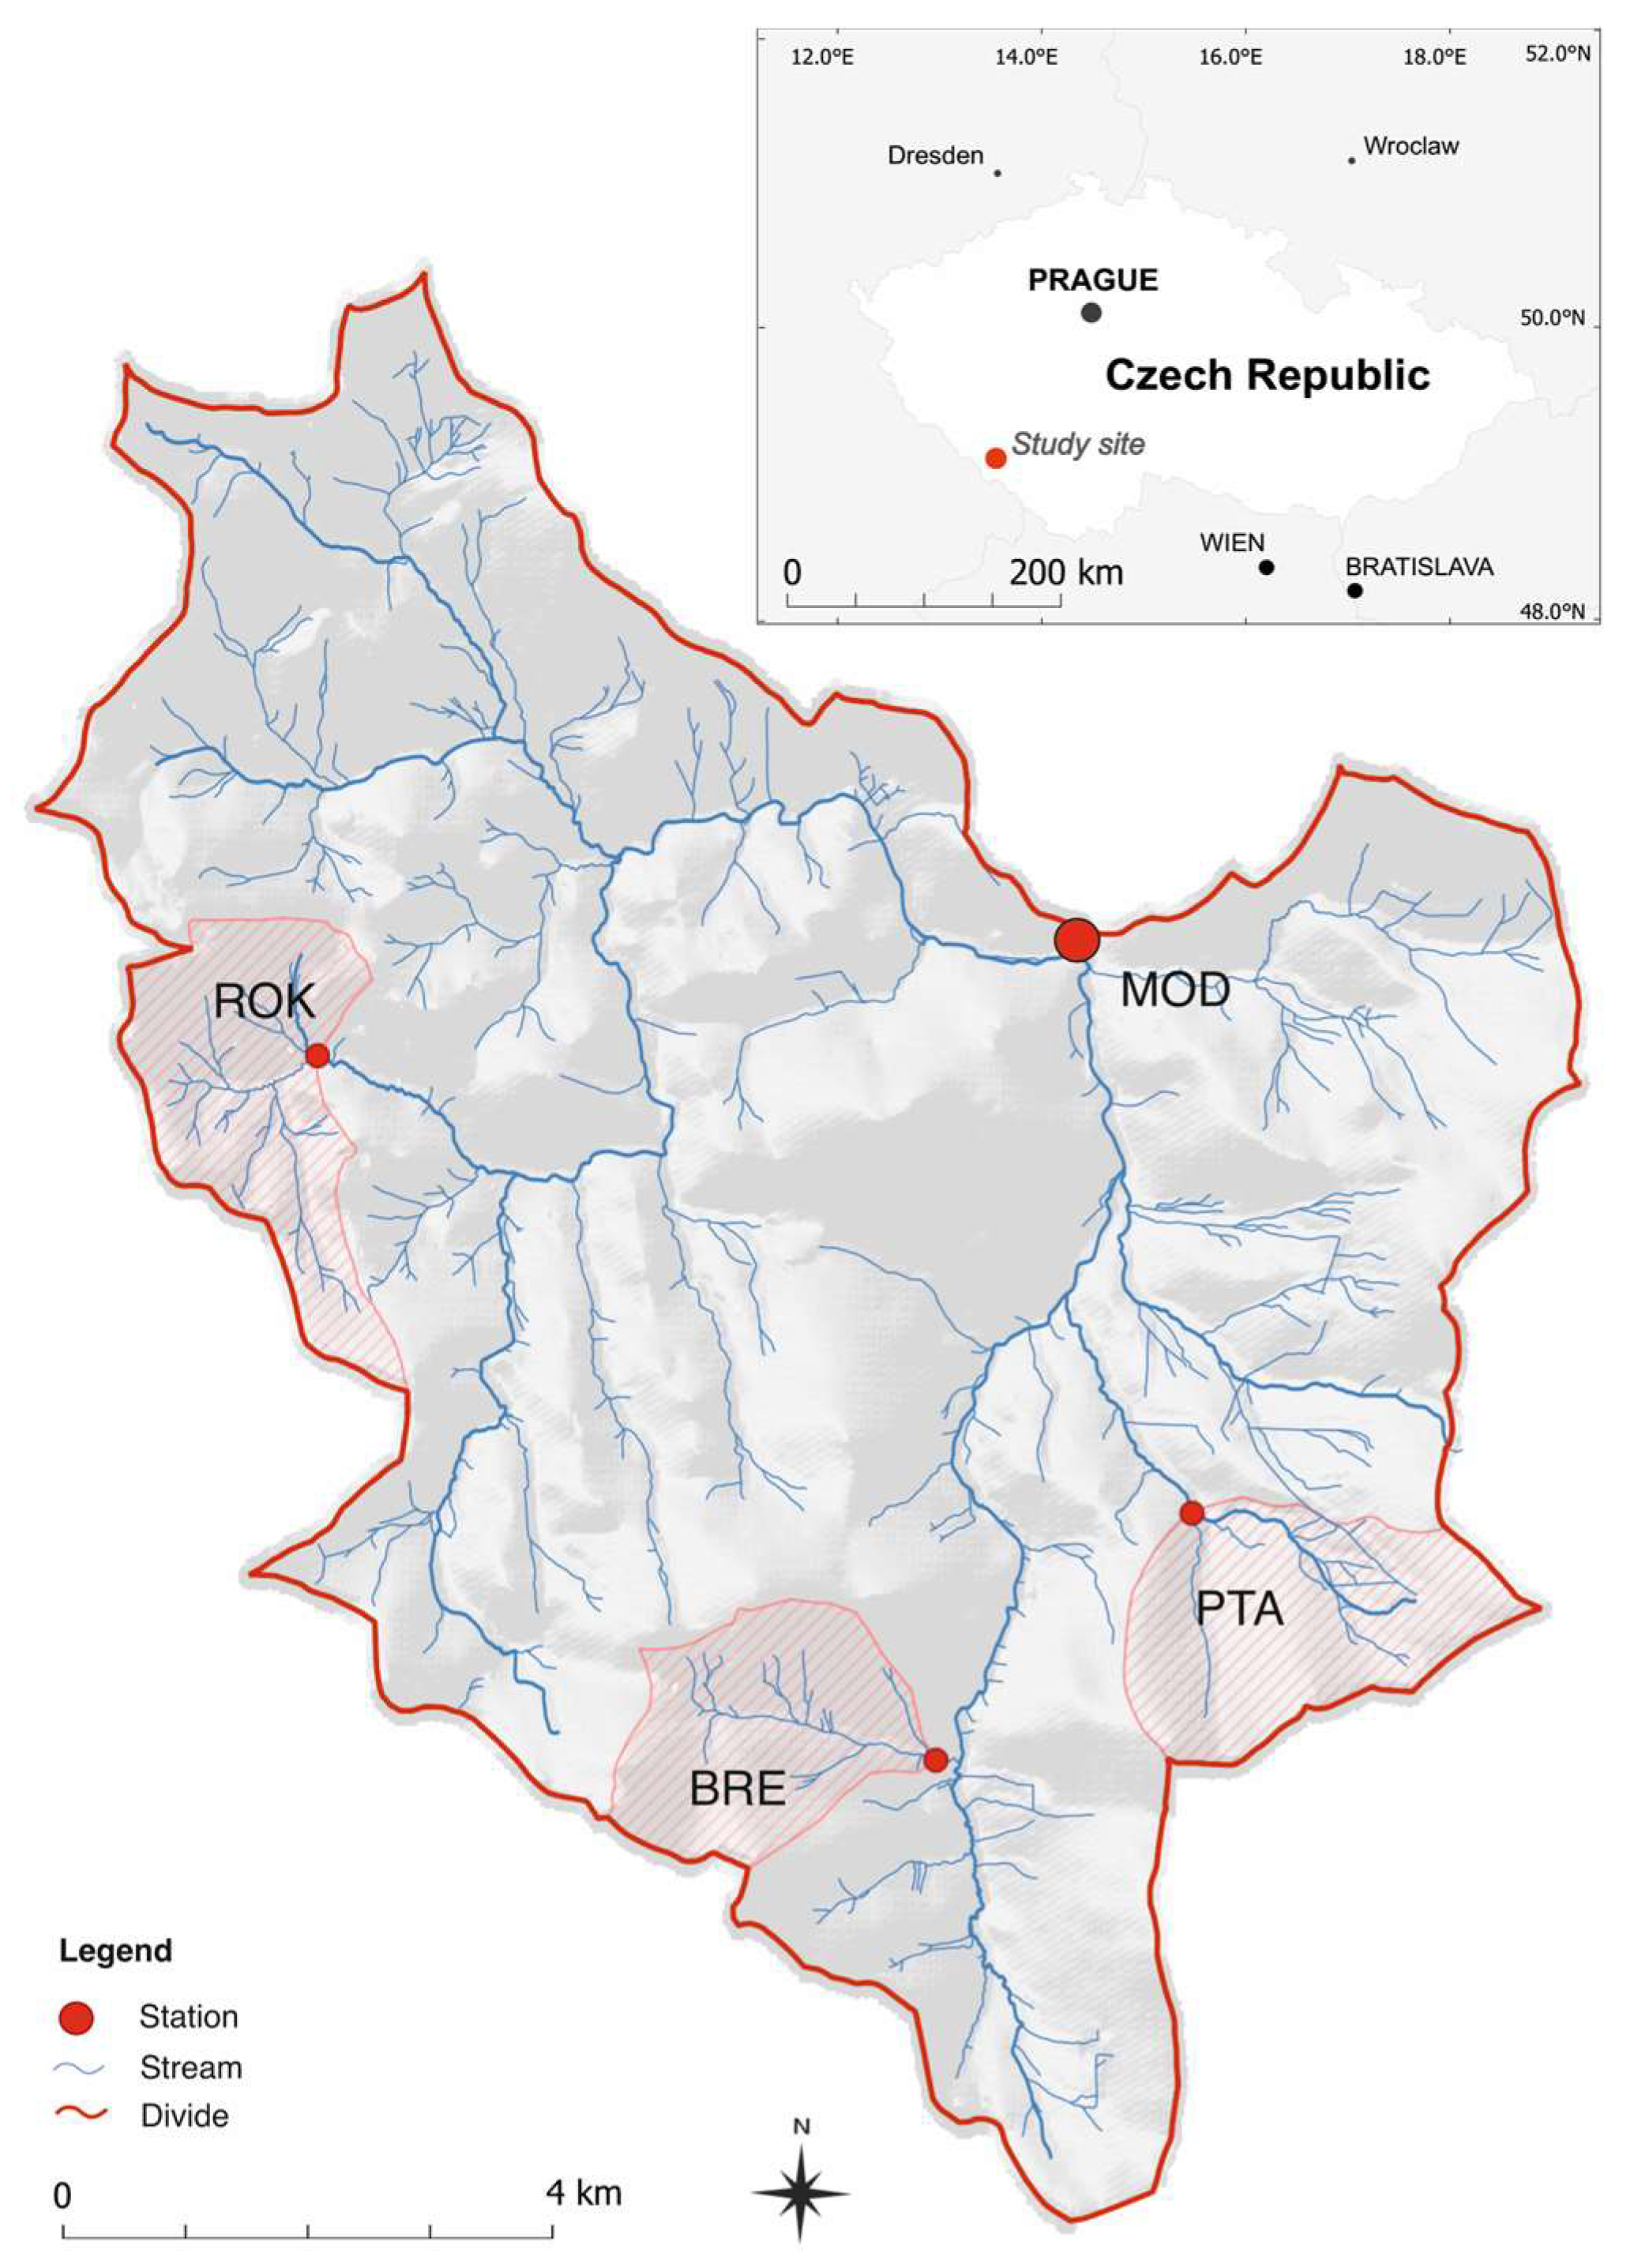
Figure 1. Study area of upper Vydra basin with the outlet at Modrava station (MOD), and sub-catchments of Roklanský (ROK), Březnický (BRE), and Ptačí (PTA) brooks.
Water 15 02004 g001
Figure 2. Selected elements of the sensor network in experimental sub-catchments of upper Vydra basin: (a) BRE station with water level monitoring; (b) rain gauge at MOD; (c) snow pillow and meteorological station at ROK. Photos by J. Langhammer.
Water 15 02004 g002
Figure 3. Sensitivity analysis and model performance: effects of changing values of parameters (a) C, (b) N, and (c) E on model performance in terms of R2, NSE, and KGE metrics; (d) plots of model performance for different combinations of C, N, and E parameters.
Water 15 02004 g003
Figure 4. Model validation for the hydrological years of (a) 2012 and (b) 2015.
Water 15 02004 g004
Figure 5. Floods from frontal precipitation: the 50 year flood in June 2013, simulated using (a,b) a daily step and (c,d) an hourly step; (e,f) the single-peak flood in October 2017, simulated using an hourly step.
Water 15 02004 g005
Figure 6. Floods from convective storms. (a,b) convective storm on a saturated basin in June 2016 simulated using a daily step and (c,d) an hourly step; (e,f) recurrent convective storms in July 2014.
Water 15 02004 g006
Figure 7. Simulation of spring snowmelt floods: (a,b) gradual snowmelt in April 2016 simulated using a daily step and (c,d) an hourly step; (e,f) rapid spring snowmelt in March 2020.
Water 15 02004 g007
Figure 8. Simulation of a rain-on-snow floods. (a,b) flood in December 2015 simulated in a daily step and (c,d) in hourly step; (e,f) flood in February 2020.
Water 15 02004 g008
Figure 9. Effect of peatbogs on the volatility of runoff signal. Different response of three sub-catchments to summer storms in June/July 2016, indicating a significantly higher volatility of water levels in the peatland-dominated ROK catchment.
Water 15 02004 g009
Figure 10. Effect of the flood debris on the water level monitoring by an ultrasonic sensor, resulting in a false signal on water level fluctuation in PTA station during the flood in December 2015.
Water 15 02004 g010
Figure 11. Effect of optimization of SVR model parameters based on sensitivity analysis, comparing observed water levels with default parameters (Var0) and the optimal configuration of parameters used for simulation (Var61) on the example of flood in June 2013.
Water 15 02004 g011
Table 1. Sensor network and observed parameters.
ParameterStationsStart of MonitoringMonitoring
Interval
Data Provider
Water levelsROK, BRE, PTA200610 minCU
MOD19331 hCHMI
PrecipitationROK, BRE, PTA, MOD200810 minCU
Snow coverROK, BRE, PTA201110 minCU
Air TemperatureROK, BRE, PTA200810 minCU
Table 2. Calculated indices.
IndicatorStationsSource DataTimestepMethod
Baseflow indexROK, BRE, PTA, MODHourly discharges at stations1 hDigital recursive filter [38]
API 30
API 7
MOD, BRE, ROKHourly precipitation at stations1 hAntecedent precipitation index [39]
PETMOD, BRE, ROKHourly air temperatures at stations1 hPotential evapotranspiration, Oudin method [40].
Table 3. Model performance for training and validation periods using coefficient of determination (R2), Nash–Sutcliffe efficiency (NSE), Kling–Gupta Efficiency (KGE), and root-mean-square error (RMSE) metrics.
Daily Step Hourly Step
PeriodR2NSEKGERMSER2NSEKGERMSE
Training 2014–20160.9200.9000.7751.0090.8570.8340.6981.440
Validation 20120.8400.8310.7731.3520.7650.7580.7121.758
Validation 20150.9480.9040.6901.0220.9030.8270.5161.511
Table 4. Model performance for simulated parameters, using the metrics of R2, NSE, KGE, and RMSE.
Simulation PeriodDaily StepHourly Step
ScenarioFromToR2NSEKGERMSER2NSEKGERMSE
Convective storms 201418.07.201410.08.20140.8480.8250.7840.6950.8380.8190.7660.953
Convective storm 201608.06.201608.07.20160.9220.8760.6770.9740.8930.8270.5461.749
Convective storm 201805.06.201803.07.20180.9860.8600.5211.4850.8880.8800.8631.688
Frontal precipitation 201321.05.201319.06.20130.9820.9440.7431.7150.9700.8650.5112.902
Frontal precipitation 201725.10.201705.11.20170.9900.9210.6941.2680.8810.8440.7052.289
Frontal precipitation 202026.10.202012.11.20200.9830.9650.8500.6420.8990.5920.5862.123
Rain on snow 201513.11.201515.12.20150.9580.9130.6932.4750.9020.8700.7013.229
Rain on snow 201615.02.201601.03.20160.9960.8800.5402.6760.9790.8780.5413.176
Rain on snow 202025.01.202015.02.20200.9790.8780.5832.7630.9330.9200.8232.398
Snowmelt 201209.04.201215.05.20120.9720.6940.2283.0310.9460.5940.0413.768
Snowmelt 201615.03.201620.05.20160.9530.9410.8410.5830.8670.8550.7740.951
Snowmelt 202005.03.202030.03.20200.9810.8680.5142.0270.9600.8990.6481.995
Minimum 0.8480.6940.2280.5830.8380.5920.0410.951
Maximum 0.9960.9650.8503.0310.9790.9200.8633.768
Mean 0.9630.8800.6391.6940.9130.8200.6252.268
Median 0.9800.8790.6851.6000.9000.8600.6742.206
Disclaimer/Publisher’s Note: The statements, opinions and data contained in all publications are solely those of the individual author(s) and contributor(s) and not of MDPI and/or the editor(s). MDPI and/or the editor(s) disclaim responsibility for any injury to people or property resulting from any ideas, methods, instructions or products referred to in the content.