Article

Identification of Extreme Droughts Based on a Coupled Hydrometeorology Index from GRACE-Derived TWSA and Precipitation in the Yellow River and Yangtze River Basins

1
College of Hydrology and Water Resources, Hohai University, Nanjing 210098, China
2
Department of Agricultural and Biological Engineering, Indian River Research and Education Center, University of Florida, Fort Pierce, FL 34945, USA
3
Zhejiang Institute of Hydraulics and Estuary, Hangzhou 310020, China
*
Author to whom correspondence should be addressed.
Water 2023, 15(11), 1990; https://doi.org/10.3390/w15111990
Submission received: 20 February 2023 / Revised: 14 April 2023 / Accepted: 20 May 2023 / Published: 24 May 2023
(This article belongs to the Section Hydrology)

Abstract

:
Global climate change and human activities have exacerbated droughts’ environmental and socioeconomic threats. However, there is still a lack of effective techniques to consider their combined impacts on drought identification. Therefore, a new copula-based multivariate standardized drought index (CMSDI) was proposed, which integrates precipitation data and terrestrial water storage anomaly (TWSA) data observed by Gravity Recovery and Climate Experiment (GRACE) satellites. The applicability of the CMSDI was assessed compared with the water storage deficits index (WSDI), the self-calibration Palmer drought severity index (sc-PDSI), the standardized precipitation evapotranspiration index (SPEI), and the standardized precipitation index (SPI) in the Yellow River Basin (YRB) and the Yangtze River Basin (YZRB) for 2002–2020. The assessments were conducted regarding both temporal evolution and spatial distribution. The results showed that the CMSDI was more synchronized with the WSDI and SPI than with the other two indices and presented different trends and correlations in the YRB and YZRB. The CMSDI outperformed the other drought indices due to the limitations of the sc-PDSI, SPEI, and SPI in detecting certain drought events, and the greater inaccuracy of the WSDI in identifying extreme droughts. Furthermore, the CMSDI revealed a clear upward trend in parts of the middle and lower YRB and a clear downward trend in the upper YZRB, emphasizing the need for more attention to droughts in the YRB. This study presents a new perspective on the integrated use of satellite and measured data in drought monitoring across different regions.

1. Introduction

Drought severely affects agriculture, ecosystems, and water supply security worldwide [1,2]. Climate change and intensified human activities have contributed immensely to the increase in the frequency, intensity, and scope of droughts, posing severe challenges to the sustainable development of the global economy [3,4,5]. According to the World Resources Institute, a quarter of the world’s population suffered from water shortages caused by droughts in 2019. In 2020, 6.69 million people and 15.27 million hectares of crops in China were affected by drought disasters, with a direct economic loss of USD 2.62 billion. Drought conditions also increase the risk of wildfires and land degradation [6]. Many climate models predict that drought severity will be enhanced globally, with a larger area affected, potentially altering the environmental system’s vulnerability and increasing the impact of drought [6,7,8]. Hence, it is an essential and challenging task to effectively assess drought to aid in mitigating damages caused by droughts.
Drought is a complex phenomenon involving multiple components, including precipitation, temperature, soil moisture, water flow, and evaporation [9], making it difficult to define a single indicator for drought characteristics. The definition of a standard for drought conditions in a region or globally is a challenge due to its variability in space and time. Different fields, such as agriculture, hydrology, and meteorology, may have disparate drought definitions and indicators [10]. In some areas, particularly in developing countries, accurate and timely data on drought conditions may be limited, which increases the difficulty in precisely evaluating the extent and severity of drought.
Nowadays, droughts are usually described quantitatively in terms of drought characteristic variables by drought intensity, influenced area, and drought duration. Droughts can be divided into different categories, i.e., agricultural, meteorological, hydrological, and socioeconomic drought [4,11,12]. Many researchers have proposed various drought indices for measuring drought severity at different scales, such as the SPI [13,14] for characterizing meteorological drought, the standardized soil moisture index (SSMI) [15,16] for agricultural drought, the standardized runoff index (SRI) [17,18] for hydrological drought, etc. An accurate and complete reflection of the complex drought effects is challenging, although drought situations can be identified by using drought indices for specific variables (e.g., precipitation, surface runoff, or soil moisture) [19,20]. Considerable efforts are made to establish drought indices using multiple drought-related variables, such as the sc-PDSI [21,22], the SPEI [23,24], etc.
Since a single index is not able to reflect joint actions of various hydrometeorological factors, it is important to conduct comprehensive monitoring of droughts from various perspectives. Copulas offer a flexible structure for coupling correlated random variables with a univariate distribution, whereas traditional multivariate analysis methods often tend to make assumptions about the normality or other distributional properties of the variables. Copulas are popular approaches to solving multivariate problems in hydrometeorology since they can simulate the dependence structure of different variables, disregarding their marginal distribution functions. Wang et al. [20] proposed a copula-based drought index with SPEI and SSI (standardized streamflow index). Won et al. [25] combined SPI and EDDI (evaporative demand drought index) based on copula to develop an integrated drought index. Nevertheless, human impacts are not yet well reflected in current multivariate drought monitoring.
The majority of conventional monitoring techniques rely on ground-based meteorological and hydrological observations, which have limited their applicability when ground observation stations are sparse or the scale of the watershed is extensive [26]. With the advance of remote sensing techniques, remote sensing observation data are increasingly being utilized to assess large-scale droughts instead. In March 2002, the National Aeronautics and Space Administration (NASA) and the German space agency jointly launched the first GRACE satellites. The GRACE Follow-On (GRACE-FO) mission, which was launched in May 2018, took over after the mission ended in October 2017. The GRACE satellite time-varying gravity field enables direct measurements of the monthly terrestrial water storage in a catchment [27,28,29]. It overcomes the constraints of conventional ground-based observation at both temporal and spatial scales, providing a new way of tracking extreme drought events [30]. GRACE-derived TWSA data integrate the whole water storage changes, including groundwater, surface water, soil moisture, canopy water, and snow water equivalent [31,32]. The GRACE satellites can detect changes in the Earth’s gravity field caused by alterations in the distribution of water on and beneath the Earth’s surface, which enables it to identify changes in TWSA caused by human activities, such as groundwater pumping, irrigation, and reservoir storage [33,34]. The GRACE/GRACE-FO data can be obtained from the Center for Space Research (CSR), the German Research Centre for Geosciences (GFZ), and the Jet Propulsion Laboratory (JPL). They use the same raw measured satellite data and nearly identical processing standards and background models [35]. However, the mathematical methods vary among the three centers, slightly differing the data quality and accuracy [36]. Each dataset has its strengths and weaknesses, and it is important to carefully consider the characteristics of each dataset when analyzing GRACE data.
To evaluate the ability of GRACE in drought monitoring, Zhao et al. [37] introduced a GRACE-based drought severity index (DSI) in 2017. Yirdaw et al. [38] confirmed the potential of the GRACE-based techniques for characterizing the recorded droughts in the Canadian prairies. Based on the results of GRACE satellites, Sinha et al. [39] proposed a combined climatologic deviation index (CCDI), which had a good consistency with PDSI. For drought assessment in northern China, Wang et al. [40] utilized a GRACE groundwater drought index (GGDI). Nigatu et al. [41] introduced the WSDI in the Nile River Basin, verifying the ability of GRACE/GRACE-FO satellites in capturing drought events in data-scarce hydro-meteorology sites. Sun et al. [42] compared the WSDI with the PDSI, SPI, SPEI, and SRI in the YRB and validated its ability to indicate large-scale drought. Although these efforts have demonstrated GRACE’s ability to identify drought characteristics, most of them have only used it as a single variable, and few have further explored the accuracy of GRACE-derived drought indices in jointly predicting drought disasters.
In this study, a novel drought index referred to as the copula-based multivariate standardized drought index was developed, based on precipitation and GRACE-derived TWSA, to consider the combined effects of climate change and human activities. The primary purposes include the following: (1) to copula the GRACE-derived TWSA with precipitation to construct the CMSDI in the YRB and the YZRB; (2) to assess the feasibility of the CMSDI for analyzing drought conditions in these regions in comparison with commonly used drought indices, such as SPEI and sc-PDSI, along with a purely GRACE-based index such as the WSDI; and (3) to explore the capability of the CMSDI in discerning drought disaster occurrences in the YZRB and the YRB.

2. Materials and Methods
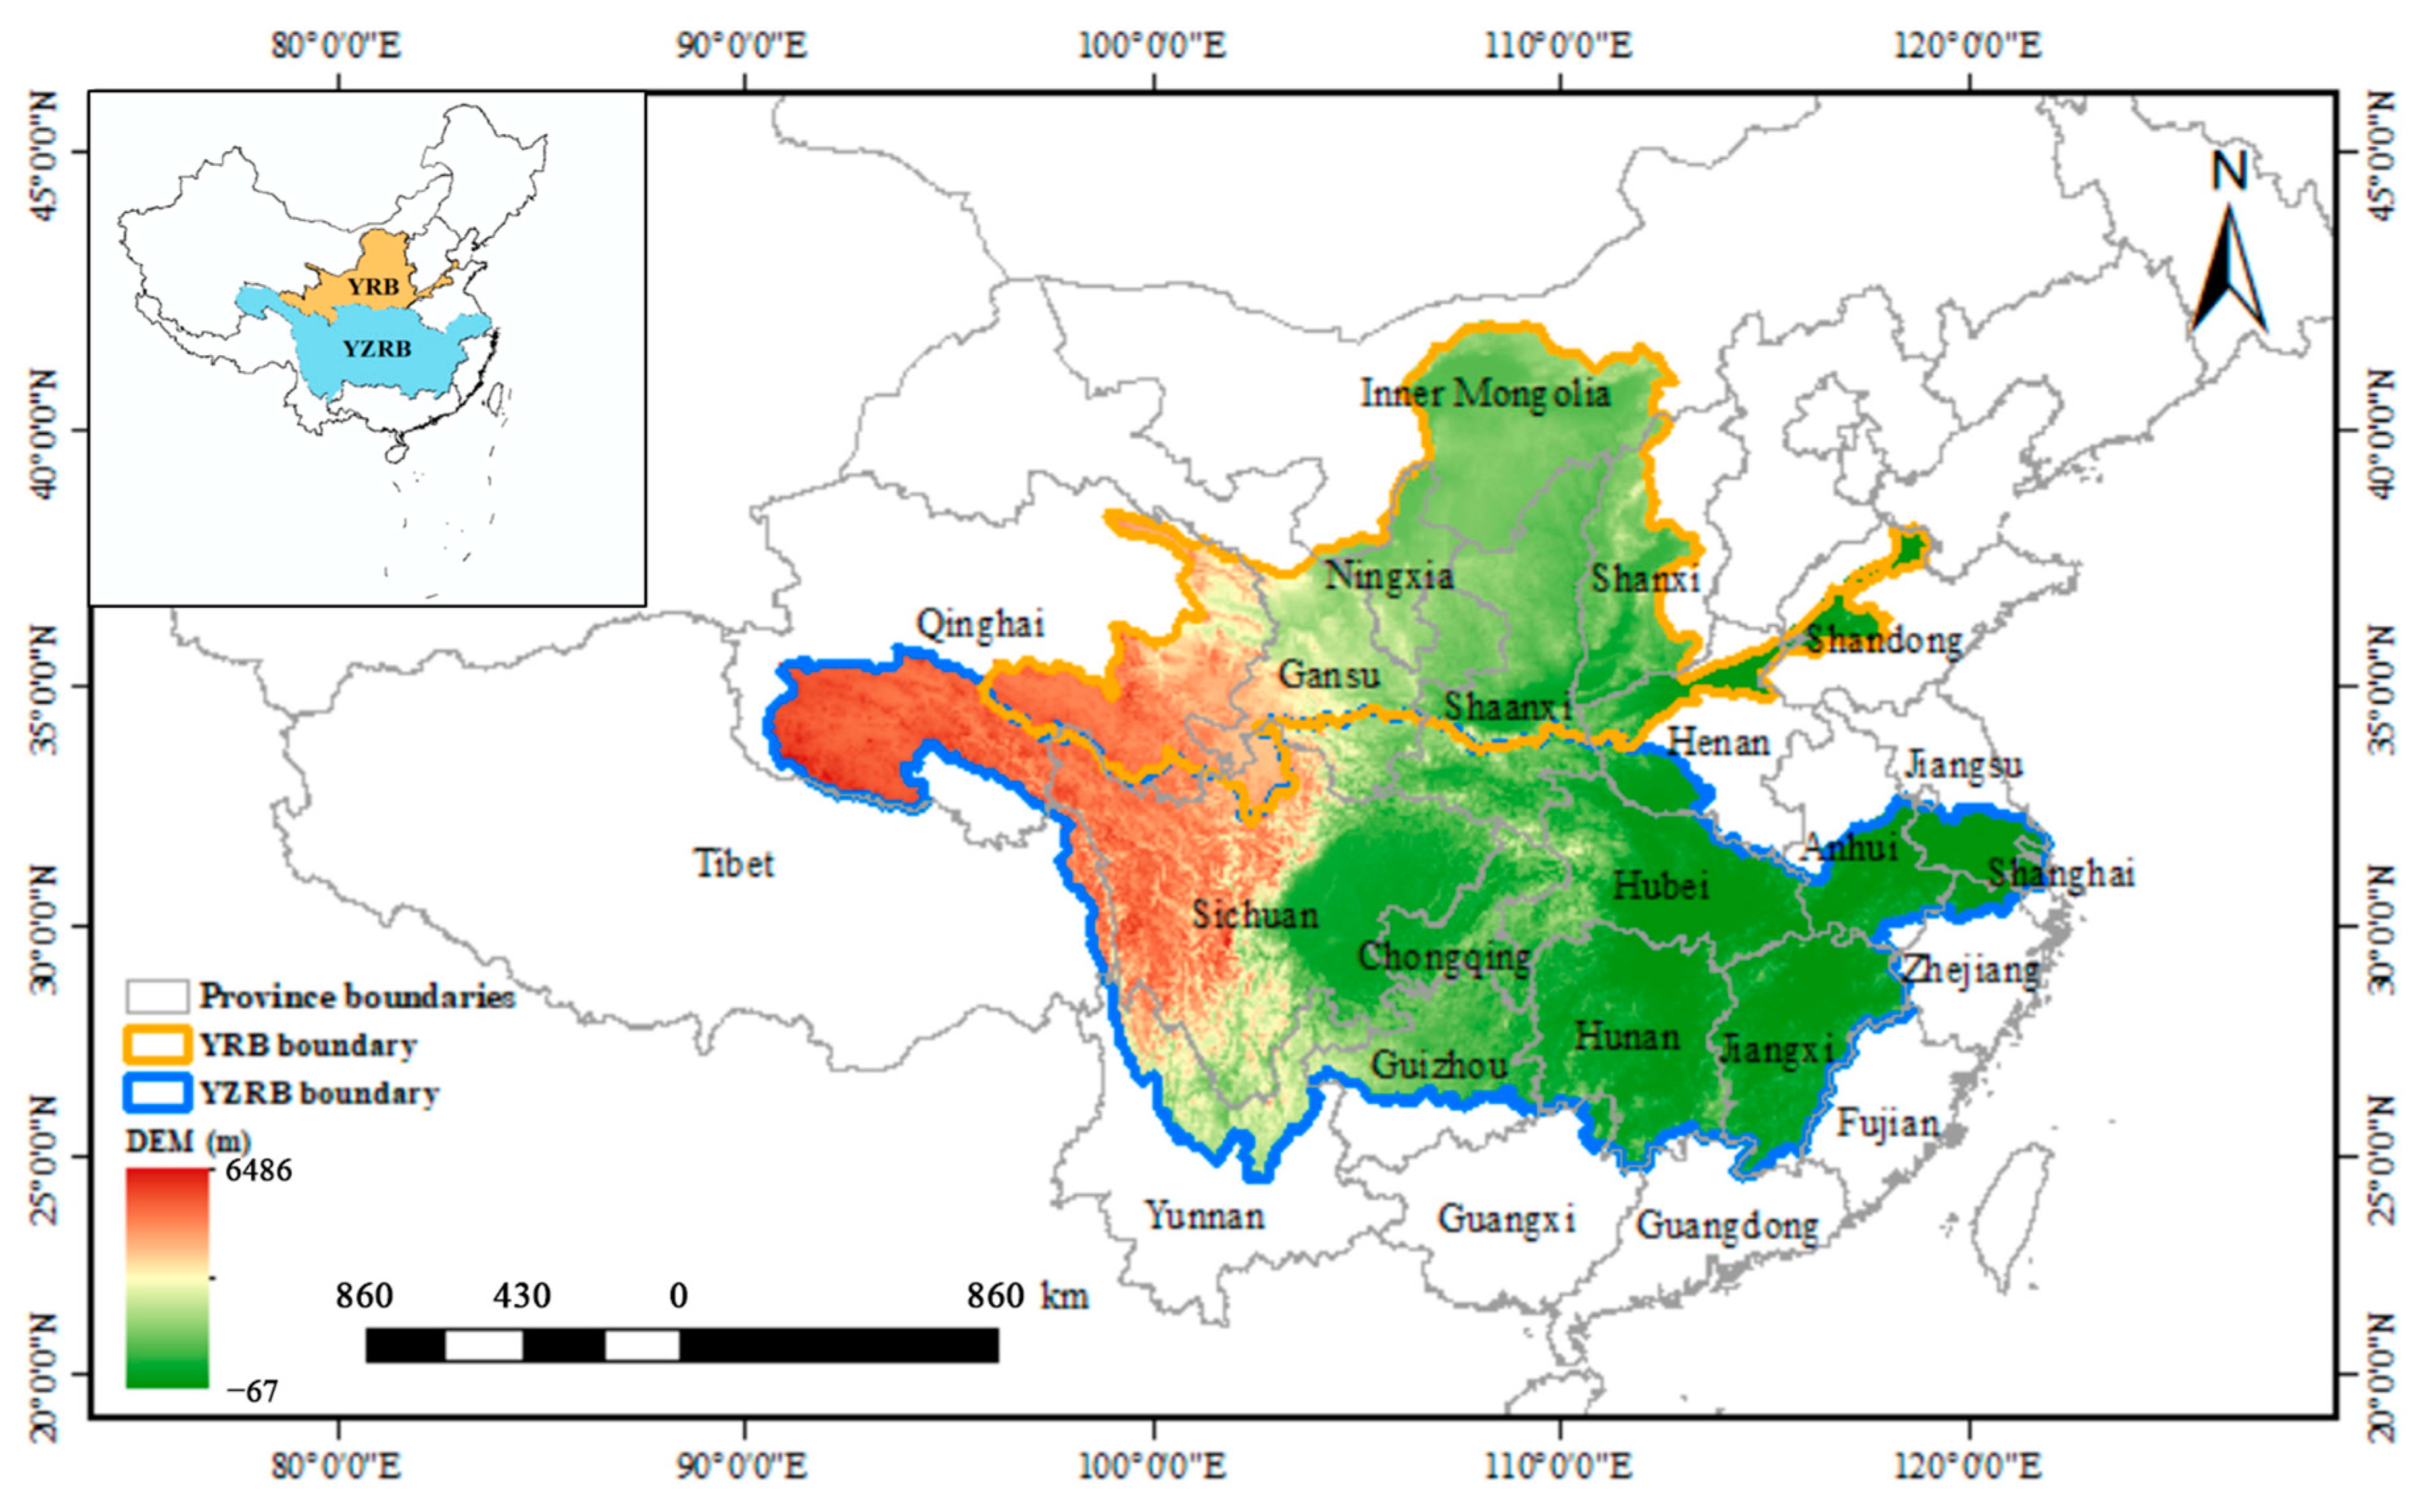
2.1. Study Area

Both study areas originated from the Qinghai-Tibet Plateau. The Yangtze River (YZRB) and Yellow River (YRB) are the two most essential Chinese rivers, ranking as the third- and fifth-longest rivers around the world, respectively. The YZRB and the YRB are adjacent to each other from south to north (Figure 1), covering a total area of approximately 2.6 million km2 [43]. These two basins encompass all of Ningxia, Shaanxi, Sichuan, Chongqing, Hubei, Hunan, and Jiangxi Provinces and part of fourteen other provinces, including inner Mongolia, Qinghai, Gansu, Shanxi, etc. Over 510 million people live there, approximately 40% of the Chinese population [44]. As important economic zones and agricultural production bases in China, the YZRB and YRB are vulnerable to extreme weather events [45], with historically frequent and serious drought disasters, especially in the YRB [46]. The YZRB and YRB differ in topography, climatic zone, and ecology. Most areas of the YRB belong to arid and semiarid areas, with an inherent lack of water resources and an annual precipitation of 200–650 mm [47]. The YZRB spans the Qinghai-Tibetan alpine climate zone, the southwest tropical monsoon climate zone, and the central China subtropical monsoon climate zone from west to east [48]. The average annual precipitation of the YZRB is around 1067 mm [43].
The adjacent YRB and YZRB, located in different climate zones [49,50,51], have undergone several extreme droughts in recent decades due to climate change and human activities [46,52], which have negative influences on local socioeconomic systems. A comprehensive study on identifying drought disasters over the whole YRB and the YZRB is missing. Thus, it is considered significant and practical to explore a drought index which is more sensitive to drought disasters in the study area over different climate zones.

2.2. Datasets

2.2.1. GRACE/GRACE-FO Data

The GRACE and GRACE-FO satellites can measure the Earth’s gravity field changes and monitor terrestrial water changes [53,54]. Herein, the release 6 (RL06) version 2 data derived from GRACE Mascon Solutions were utilized, which were provided by the Jet Propulsion Laboratory (JPL) in the form of equivalent water thickness with the CRI (coastline resolution improvement) filter applied (from April 2002 to December 2020; 0.5° × 0.5° grid-scale spatial accuracy; available at https://grace.jpl.nasa.gov/, accessed on 21 February 2021) [55,56,57]. The provided data had already been removed of the anomalous changes in the tidal and non-tidal ocean and atmosphere. Each monthly grid data represented the surface mass deviation for that month relative to the baseline average from January 2004 to December 2009. The missing data were filled using the spline interpolation method.

2.2.2. Precipitation Data

Monthly gridded precipitation data at 0.5° spatial resolution were obtained from the China Meteorological Administration (CMA) (http://data.cma.cn/, accessed on 22 September 2021). The data were generated by spatial interpolation with the thin disk sample strip method based on actual precipitation measurements from high-density stations on the ground in China. The time series of precipitation data was 2002–2020 with the missing data interpolated using the spline method.

2.2.3. Drought Indices Data

The SPI is a meteorological drought index based on long-term precipitation data conforming to a probability distribution. The drawback of the SPI is that it merely considers precipitation, ignoring other meteorological factors [42]. In this study, the SPI was calculated using monthly precipitation obtained from CMA. The precipitation records were first fitted to a gamma distribution and then converted to a normal distribution by means of an equal probability function to calculate the SPI.
The SPEI is an extension of SPI that considers precipitation in conjunction with potential evapotranspiration. The SPEI Global Drought Monitor (https://spei.csic.es/map/maps.html, accessed on 8 May 2021) offers near real-time calibrated information on global drought conditions, with a 1-degree spatial resolution and a 1-month time resolution, based on the Thornthwaite equation to calculate potential evapotranspiration.
The sc-PDSI (https://crudata.uea.ac.uk/cru/data/, accessed on 16 February 2021) is a variant of the original PDSI of Palmer, calculated from precipitation and temperature data, together with fixed parameters related to the surface characteristics. The sc-PDSI data have a spatial resolution of 0.5 degrees and span the period of 1901–2020 with monthly resolution.

2.3. Methodology

2.3.1. GRACE/GRACE-FO-Derived Water Storage Deficit Index (WSDI)

WSDI is introduced to explore the ability of GRACE-derived TWSA in identifying extreme drought disasters. According to Thomas et al. [58], a consecutive water storage deficit (WSD) for more than three months will result in drought events. WSD is the difference between the TWSA time series and the mean values of monthly TWSA. The equation is as follows:
W S D i , j = T W S A i , j T W S A j ¯
where WSDi,j and TWSAi,j represent the TWSA residual and TWSA in the year i and month j, respectively; TWSAj is the long-term mean TWSA in the month j for the study period from April 2002 to December 2020.
To compare WSD with other drought indices, WSD is normalized into the WSDI by the zero-mean normalized method as follows:
W S D I = W S D μ σ
where µ is the mean and σ is the standard deviation of the WSD time series. The magnitude of WSDI indicates the drought intensity.

2.3.2. Copula-Based Multivariate Standardized Drought Index (CMSDI)

The CMSDI is a drought index that combines GRACE-derived TWSA and precipitation. The CMSDI integrates information from both meteorology and hydrology perspectives to monitor droughts caused by a lack of rainfall replenishment and a shortage of terrestrial water storage. The copula function was used to construct the joint marginal distribution of precipitation and TWSA. Although many drought analyses have been carried out using copula, studies in combination with precipitation and TWSA are limited.
It is proved that there is a unique two-dimensional copula for continuous random variables X and Y with marginal cumulative distribution functions F(x) and G(y) [59]. If the sample size is large enough, a joint probability distribution can be constructed with empirical copula functions [60]. In this study, variable x was set as precipitation and variable y as TWSA. Seven common distributions (generalized Pareto, exponential, normal, log-normal, gamma, Weibull, and Nakagami distributions) [61] were selected to determine the marginal distribution functions of precipitation and TWSA. These copula functions have been extensively utilized in analyzing the frequency [62,63,64]. Meanwhile, we made use of the K–S (Kolmogorov–Smirnov) test [65] method to decide the optimal marginal distribution function. As shown in Table 1, Gaussian-copula, Clayton-copula, Frank-copula, and Gumbel-copula were chosen as joint functions of the marginal distribution of precipitation and TWSA. The u (u = F(x)) and v (v = G(y)) are the cumulative distribution functions of precipitation and TWSA, respectively. The parameters are estimated based on the maximum likely estimation method, and the root mean square error (RMSE), Akaike information criterion (AIC), and the Bayesian information criterion (BIC) were used to evaluate the binary joint distribution function of precipitation and TWSA in the study area.
P x X , y Y = C F x , G y = p
where x and y are the random variables of the precipitation sequence (x) and TWSA sequence (y); F(x) and G(y) are their corresponding marginal distribution functions; and p is the cumulative joint probability of precipitation and TWSA.
Finally, the CMSDI was calculated by applying this cumulative probability to the inverse cumulative standard normal distribution function:
C M S D I = φ - 1 p
where φ−1 is the inverse standard normal distribution. As the calculation principle of CMSDI is similar to that of the SPEI, both developed from a joint probability of relevant variables; the CMSDI adopts the same ranking criteria as the SPEI (Table 2). The main information about these different indices is shown in Table 3.

3. Results

3.1. Construction of the CMSDI

The TWSA and precipitation data were used to propose the novel drought index, CMSDI. Figure 2 illustrates the temporal evolution of basin-averaged TWSA and precipitation in the YRB and YZRB from April 2002 to December 2020. Generally, the TWSA is correlated with precipitation, with consistent peaks and troughs each year. Based on the linear fitting analysis, the precipitation of the YRB and YZRB increased at a rate of 0.004 mm/year and 0.012 mm/year during the study period, respectively. The TWSA of the YRB declined at a rate of 0.192 mm/year, while the TWSA of the YZRB declined less significantly, at a rate of 0.012 mm/year.
Seven common distributions (generalized Pareto, exponential, normal, log-normal, gamma, Weibull, and Nakagami distributions) were adopted to determine the optimal marginal distribution functions of monthly TWSA and precipitation. Figure 3 and Figure 4 show the marginal distributions of TWSA and precipitation in the YRB and YZRB. The quantile–quantile (Q–Q) plots of TWSA (Figure 3b and Figure 4b) and precipitation (Figure 3d and Figure 4d) are almost one line, indicating that the chosen distribution functions can fit TWSA and precipitation well. It deserves to note that the optimal distributions of TWSA and precipitation were different in the YRB and YZRB. The Nakagami and normal distributions fitted TWSA and precipitation in the YRB, respectively, while the generalized Pareto was more suitable for the TWSA and precipitation of the YZRB.
After calculating the marginal distribution of TWSA and precipitation, the CMSDI was constructed according to Equations (3) and (4). The RMSE, AIC, and BIC values between empirical and theoretical copula functions were computed to perform the Goodness of Fit (GOF) test of the copula function. The optimally fitted copula function was selected on the basis of the minimum RMSE, AIC, and BIC values. The optimal copula function was Gumbel-copula for the YRB and Frank-copula for the YZRB, as presented in Table 4.

3.2. Comparison of CMSDI with Four Commonly Used Drought Indices

To evaluate the performance of the CMSDI in assessing drought conditions, Figure 5a,b show the comparison between the CMSDI and four other drought indices, including the WSDI, sc-PDSI, 1-month SPEI, and 1-month SPI in the YRB and YZRB. The comparisons were made in the corresponding period from April 2002 to December 2020. No significant trends were observed in the SPEI and SPI time series, while the CMSDI, WSDI, and sc-PDSI time series showed an obvious decreasing trend (Figure 5a). Compared with the YRB, the five drought indices in the YZRB showed higher consistency (Figure 5b). Direct comparisons of these five indices were made more complicated due to the different calculation methods and wide range of values related to various drought intensities. To achieve a better comparison result, all indices were standardized using the z-score standardization method. Therefore, the mean of all indices was zero, and the standard deviation was one. As shown in Figure 5c,d, high-frequency variation was observed in the SPI time series, followed by the CMSDI and WSDI. The observed performance of the CMSDI and its response to climate anomalies is consistent with the performance and response of other indices, exhibiting similar peaks and troughs. In general, the CMSDI series is more synchronized with the WSDI and SPI series than the other two indices.
Figure 6 presents the correlations of the CMSDI, WSDI, sc-PDSI, SPEI, and SPI from April 2002 to December 2020 in the YRB and YZRB. The estimated Pearson’s correlation coefficients between the average CMSDI and WSDI, SPEI, and SPI in the YRB were 0.614, 0.175 and 0.296, significant at a 95% confidence level. The CMSDI was well correlated with the WSDI (0.693), followed by the SPI (0.379) in the YZRB. To further analyze the spatial correlation of these five drought indices, we calculated the spatial distributions of the correlations between the CMSDI and WSDI, sc-PDSI, SPEI, and SPI. The correlations between the CMSDI and WSDI in the YRB and the YZRB were the most significant, ranging from 0.315 to 0.965 and 0.423 to 0.977, respectively. As Figure 7 shows, the CMSDI and sc-PDSI in the YRB and YZRB exhibit a higher correlation compared to the CMSDI and SPEI, lower than the CMSDI and SPI. The correlations between the CMSDI and the other four drought indices are generally higher in the YZRB than in the YRB. Notably, a high correlation between the CMSDI and WSDI is observed in the middle and lower reaches of the YRB, while the correlations between the CMSDI and sc-PDSI, SPEI, and SPI are considerably lower. This phenomenon indicates that the CMSDI, proposed based on TWSA and precipitation, is mainly influenced by TWSA in the middle and lower reaches of the YRB. According to the 2020 China Water Resources Bulletin, the middle and lower reaches of the YRB (mainly involving Shannxi, Shanxi, Shandong, and Henan Provinces) used a large amount of groundwater, accounting for more than a third of the total water supply, resulting in the TWS deficit. Consequently, the TWSA in the middle and lower reaches of the YRB is more vigorously variable and more sensitive to drought events.

3.3. Performance Assessment of Identifying Drought Events

Comparisons of monthly average drought severity identified by the CMSDI, WSDI, sc-PDSI, SPEI, and SPI are presented in Figure 8 to assess the performance of drought event identification. The sc-PDSI and CMSDI present higher drought frequency than the SPI, SPEI, and WSDI in the YRB (Figure 8a). The SPEI and sc-PDSI failed to identify drought events for 19 months and 2 months, respectively, when the other 4 indices, other than themselves, indicated droughts. Figure 8b shows that the SPEI, WSDI, and CMSDI identified more drought events than the SPI and sc-PDSI in the YZRB. The synchronization of the WSDI and CMSDI is stronger in the YZRB than in the YRB. The sc-PDSI, SPEI, and SPI failed to identify drought events for 7 months, 8 months, and 1 month when the other 4 indices indicated droughts. In contrast, the WSDI and CMSDI recognized all droughts. The cumulative months of severe droughts and extreme droughts identified by each index were calculated in the YRB and YZRB, respectively. In the YRB, the SPI, SPEI, sc-PDSI, and CMSDI exhibited 18, 4, 2, and 23 months of severe droughts, while the WSDI exhibited none. For the YZRB, the SPEI and CMSDI recognized 18 and 34 severe drought months; meanwhile, the SPI, sc-PDSI, and WSDI failed to recognize any severe droughts which were against reality. As recorded from October to December 2010, the precipitation in the whole YRB was generally below 50 mm, 50–80 percent less than that in the historical period. The entire basin suffered from severe drought, with some areas reaching extreme drought. It was identified as an extreme drought event by the SPI and CMSDI and a mild drought by the sc-PDSI, although the WSDI and SPEI misidentified it as no drought (Figure 8a). As recorded in the Chinese Yearbook of Meteorological Disasters, a severe drought occurred in the middle and lower reaches of the YZRB from January to May 2004. Due to the rapid development and long duration of the drought, it influenced 94.5 percent of the middle and lower YRB, with some areas suffering from the worst drought in almost 60 years. The CMSDI and SPEI successfully identified the severe drought, while the WSDI identified it as a moderate drought; however, the SPI incorrectly identified it as a short-term mild drought, and the sc-PDSI failed to identify the drought (Figure 8b). In addition, it can be found in Figure 8 that there is a gap between the onset time of drought events as detected by the WSDI and that detected by the CMSDI, which indicates that there is an obvious propagation time from meteorological drought to hydrological drought in these two basins.
To further explore the ability of the CMSDI for spatial drought identification, Figure 9 presents the spatial comparisons of the monthly CMSDI with WSDI, sc-PDSI, SPEI, and SPI during recorded drought events in the YRB and YZRB. For example, in October 2004, the areal average precipitation in the middle and lower YZRB was less than 10 mm, less than 1/5 of the long-term monthly average precipitation for the same period. The eastern Hubei Province, Jiangxi Province, southern Hunan Province, southern Jiangsu Province, and southern Anhui Province suffered from severe drought, with some areas experienced extreme drought. The CMSDI identified the severe drought in the corresponding area and major parts of southern Hunan Province, Jiangxi Province, southern Anhui, and Jiangsu Province as extreme drought (Figure 9a). The WSDI failed to identify the severe drought in the middle and lower YZRB (Figure 9b), and the sc-PDSI incorrectly identified the Hubei province as having no drought (Figure 9c). The SPEI and SPI underestimated the drought severity, with the SPEI identified the existence of moderate drought and some areas of severe drought (Figure 9d), and SPI identified mild drought and parts with moderate and severe drought (Figure 9e).
Similarly, in January 2009 (Figure 9f–j), drought affected the main areas of the YRB, especially in the eastern Gansu Province, Shannxi Province, Shanxi Province, Henan Province, western Shandong Province, and northern Hubei Province. Nearly 9 million hectares were affected, and more than 1 million people had difficulty with drinking water during this drought event. The CMSDI reflected the severe drought in the five provinces above, while the WSDI performed the worst among all the indices. The other three indices underestimated the drought severity in the five provinces to different degrees. From December 2008 to February 2009, precipitation was consistently low throughout the YZRB. The CMSDI was optimal for identifying the moderate to severe drought in the Yunnan Province and south-central Sichuan Province. It is noteworthy that all five indices recognized droughts in the Hunan Province and Jiangxi Province in February 2009, which were not reported. It may be due to the short drought duration or influences of severe and extreme droughts in the neighboring provinces (i.e., Guangxi Province, Guangdong Province, and Fujian Province).
Figure 9k–o illustrate that, in March 2015, there was a moderate to severe drought in the central Inner Mongolia Province, Shanxi Province, and northern Shaanxi Province, a moderate drought in Shandong Province, and a mild to moderate drought in Qinghai Province and Gansu Province in the YRB. Compared with the YRB, the YZRB was less affected by drought, except for moderate to severe drought that occurred in the western Sichuan Province at the border with the Tibet Province and eastern Sichuan Province at the border with the Chongqing Province. The CMSDI, SPEI, and SPI were more accurate in identifying the drought area and severity in the YRB and the YZRB, while the WSDI and sc-PSDI grossly underestimated the severity of the drought. For a more detailed comparison, the SPI failed to reflect the mild to moderate drought in the YRB of the Qinghai Province and Shandong Province. The SPEI overestimated the drought area and severity in the YZRB, especially in the Guizhou and Hunan provinces. In conclusion, compared to the drought indices that only consider meteorological or hydrological drought, the CMSDI performs better at identifying drought events, especially for the drought events controlled by multiple factors.

3.4. Variation Characteristics of Drought Identified by CMSDI

Figure 10 shows the spatial map of the trend characteristics of monthly the CMSDI calculated using the MMK trend test method. When Zs > 0 indicates a downward drought trend, and Zs < 0 is the opposite. Absolute values of Zs over 1.96 and 2.58 indicate that the trend passes the α = 0.05 and 0.01 significance test, respectively. Drought showed a significant increasing trend in the middle and lower YRB and parts of the upper reach of the YZRB (i.e., mainly covering the Shanxi Province, Shannxi Province, middle Inner Mongolia Province, eastern Tibet Province, and western Sichuan Province), as well as a clear downward trend in the major parts of the upper reach of the YZRB (i.e., mainly covering the Sichuan Province, Chongqing Province, northern Guizhou Province, western Hunan Province) (Figure 10a). The Sen’s slope varied from −0.0672 to 0.0065 and −0.0207 to 0.0081 in the YRB and YZRB, respectively (Figure 10b). The extent of the area exhibiting a decreasing trend was similar to that indicated by the Zs values. Generally, more attention should be paid to the drought in the middle YRB.
The red bar charts in Figure 11 show the percentage of areas with droughts detected with the CMDSI, while the blue bar charts present the percentage of areas with no drought events. Droughts in the YRB (Figure 11a) and YZRB (Figure 11b) showed a clear seasonality. The YRB and YZRB both had the largest drought area in the autumn and winter, as well as the smallest in the summer. The percentage of the drought area in the YRB was larger than that in the YZRB and tended to increase.

4. Discussion

4.1. Analysis of CMSDI and Other Drought Indices

In this study, the effectiveness of the CMSDI in indicating drought events was compared with four commonly used drought indices, including the WSDI, sc-PDSI, SPEI, and SPI. The results revealed that the CMSDI combination of precipitation and TWSA was a valuable tool for monitoring droughts in different regions.
Compared to the four common drought indices, the CMSDI has a distinct advantage, as it could reflect the impacts of lack of precipitation as well as the excessive use of water storage on drought severity. In contrast, other indices, such as the SPI and SPEI, take no consideration of water stored in the soil or groundwater. While the sc-PDSI considers the initial surficial soil moisture conditions, it lacks an estimation of groundwater. Due to the time lag effects of climate factors on TWSA [66,67], it is hard for the completely TWSA-derived WSDI to instantly reflect the short-term drought events caused by a lack of precipitation. The CMSDI compensated for this drawback, as evidenced in Section 3.3, where the recorded drought event in the YRB in 2010 was mainly attributed to an extreme shortage of precipitation. The CMSDI accurately identified this drought event, but the WSDI failed.
These drought indices behaved differently in the YRB and the YZRB. The average SPI and SPEI showed high correlations in both basins, while the sc-PDSI had no significant correlations with other indices (Figure 6). Compared to the SPI, the CMSDI and WSDI presented higher correlations, especially in the YZRB (Figure 7). It was consistent with the higher agreement between the drought month identification results in the YZRB. Apart from the impacts of the averaging process, the discrepancies between these two indices in detecting drought months can be attributed to the relative contribution of meteorological and hydrological factors to drought conditions in the studied areas and the time scale of drought development. Compared with the YZRB, the YRB has lower average precipitation and greater intra- and inter-annual precipitation variability. The droughts in the YRB are more directly influenced by precipitation. Since the precipitation-related CMSDI was more sensitive to short-term drought events caused by meteorological factors than the merely TWSA-based WSDI, the CMSDI drought index proved to be more effective in detecting drought months in the YRB.
As the TWSA data can reflect the variations of snow water and glacier water storage, it can be inferred that the CMSDI and WSDI can capture part of their impacts on drought events. The other drought indices, including the sc-PDSI, SPI, and SPEI, imprecisely assume that all precipitation immediately becomes rainfall and do not account for the snow water. This can lead to overestimations of water availability during winter precipitation and underestimations during spring snowmelt in cold and snowy regions. Additionally, water released from snow and glaciers can be used for evapotranspiration, which can also lead to errors in the SPEI.

4.2. Limitations and Prospects

The study has shown the feasibility of the CMSDI for drought indication. However, it should be noted that the CMSDI still has some limitations. The mascon solutions rather than the standard spherical harmonic approach were used to better process the noise of GRACE satellite observations and those uncertainties in solving the global gravity field model. Nonetheless, there are some uncertainties in the mascon solutions published by different institutions caused by their data processing strategies. The JPL mason solutions selected in this study are provided with their scaled uncertainty estimates. The uncertainty estimates are considered to be conservative, as the solutions for both the month at the beginning and the end of the time series have slightly greater uncertainty than those in the middle [56].
Currently, reliable GRACE data with high resolutions are still lacking, posing a great challenge to the calculation of the CMSDI. To be consistent with the spatial resolution of the precipitation data, JPL-RL06M data at 0.5° × 0.5° were used to obtain the CMSDI. Although the data are represented at a 0.5-degree grid, they represent the equal-area caps of 3 × 3 degrees, and it is the current original JPL-RL06M resolution. As a result, the spatial CMSDI results shown in this paper are not smooth enough, with significant variations at the edges of some raster. This may introduce certain uncertainties in the CMSDI results, limiting the index accuracy.
The GRACE/GRACE-FO satellites data, dating back to April 2002, are published with numerous missing data, including the short-term data gaps (1–2 months) due to instrument malfunctions and the long data gap (July 2017 to May 2018) between the two GRACE missions [68]. Although many studies have been conducted on the interpolation of missing values for GRACE data based on some artificial neural networks [69,70], there is still a lack of a well-accepted interpolation processing method. The linear interpolation method is widely used in processing the missing data of the GRACE/GRACE-FO satellites due to its simplicity and applicability, despite its lack of precision [40,42]. There is no denying that linear interpolation will introduce errors and misunderstandings. Overall, the CMSDI offers a valuable tool for drought analysis, but further improvements must be needed to enhance its accuracy and reliability.
To improve the accuracy and reliability of the CMSDI in identifying droughts in the future, we can investigate from the following two aspects: (1) downscaling the spatial resolution of the GRACE satellite data based on machine learning algorithms; and (2) extending the GRACE data series and fulfill the missing data with GLDAS data or historically measured groundwater data. The CMSDI based on TWSA and precipitation can effectively reflect the surplus and deficit in terrestrial water storage. Evaporation is not considered in this paper due to its difficulty in collecting situ data. More variables (i.e., evaporation and land use) and multidimensional copula functions are necessary to be integrated into future research. Furthermore, climate change and human activities have influenced drought propagation. It remains a question of how to separate and qualify the effects of climate change and human activities.

5. Conclusions

This study proposed a novel copula-based multivariate standardized drought index based on the GRACE-derived TWSA and measured precipitation, which could reflect the combined influence of human activities and climate change. During the period between 2002 and 2020, the drought characteristics were assessed using the CMSDI, WSDI, sc-PDSI, SPEI, and SPI in the Yellow River basin and Yangtze River basin. The main conclusions are as follows:
  • The CMSDI, WSDI, and sc-PDSI time series presented a significant declining trend in the YRB, while the SPEI and SPI time series had no significant variations. Compared with the YRB, the five drought indices in the YZRB were more consistent. The response of the CMSDI to climate anomalies was synchronized with other indices after normalization.
  • In terms of correlation and sensitivity, the proposed CMSDI showed notable differences between the YRB and YZRB. High correlations were observed between the CMSDI and WSDI, sc-PDSI, and SPI in the YRB, while it showed better correlations with the WSDI and SPEI in the YZRB.
  • The CMSDI and sc-PDSI indicated a higher frequency of drought events in the YRB, whereas in the YZRB, the CMSDI, SPEI, and WSDI identified more drought events than SPI and sc-PDSI. In a comparative analysis of recorded severe drought events, the CMSDI was able to identify actual recorded drought events more accurately in the YRB and YZRB.
  • Droughts showed a clear seasonal characteristic in the YRB and YZRB, being frequent in autumn and winter. The droughts identified with the CMSDI presented a significant increasing trend in parts of the middle and lower YRB, with a clear downward trend in a major part of the upper YZRB.
In general, this study explored the capability of drought monitoring using GRACE satellite data and measured precipitation data. The proposed CMSDI, based on the TWSA and precipitation, outperformed the other four common drought indices in identifying drought events in the YRB and YZRB. The CMSDI is sensitive to drought loss events resulting from the high variability of TWSA caused by human activities, coupled with precipitation deficits. According to the results, more attention should be paid to the droughts in the YRB, especially in the middle reaches.

Author Contributions

Conceptualization, S.W. and C.C.; methodology, S.W.; software, S.W.; validation, Y.S.; formal analysis, J.M.; resources, S.W., S.Z. and Z.D.; data curation, S.Z.; writing—original draft preparation, S.W.; writing—review and editing, C.C. and G.E.A.; visualization, S.W.; supervision, Z.D.; project administration, Z.D.; funding acquisition, Z.D. All authors have read and agreed to the published version of the manuscript.

Funding

This research was funded by the China Scholarship Council, grant number 202206710030, and the Water Conservancy Science and Technology Project of Hunan Province, China (No.XSKJ2021000-05).

Data Availability Statement

The China Meteorological Administration (http://data.cma.cn/, accessed on 22 September 2021) shares the meteorological data. GRACE/GRACE-FO Mascon data are available at http://grace.jpl.nasa.gov (accessed on 21 February 2021). Similarly, the SPEI was retrieved freely from https://spei.csic.es/map/maps.html (accessed on 8 May 2021) and sc-PDSI from https://crudata.uea.ac.uk/cru/data/ (accessed on 16 February 2021). The data used in this study are freely available from the above-mentioned respective websites.

Acknowledgments

The authors would like to thank the China Meteorological Administration for providing the meteorological data, the Jet Propulsion Laboratory for providing the GRACE/GRACE-FO Mascon data, the Laboratory of Climate Services and Climatology for providing the SPEI data and the University of East Anglia for providing the sc-PDSI data.

Conflicts of Interest

The authors declare no conflict of interest.

References

  1. Schwalm, C.R.; Anderegg, W.R.L.; Michalak, A.M.; Fisher, J.B.; Biondi, F.; Koch, G.; Litvak, M.; Ogle, K.; Shaw, J.D.; Wolf, A.; et al. Global patterns of drought recovery. Nature 2017, 548, 202–205. [Google Scholar] [CrossRef] [PubMed]
  2. Mishra, A.K.; Singh, V.P. A review of drought concepts. J. Hydrol. 2010, 391, 202–216. [Google Scholar] [CrossRef]
  3. Liu, X.; Guo, P.; Tan, Q.; Zhang, F.; Huang, Y.; Wang, Y. Drought disaster risk management based on optimal allocation of water resources. Nat. Hazards 2021, 108, 285–308. [Google Scholar] [CrossRef]
  4. Montaseri, M.; Amirataee, B.; Rezaie, H. New approach in bivariate drought duration and severity analysis. J. Hydrol. 2018, 559, 166–181. [Google Scholar] [CrossRef]
  5. Svoboda, M.D.; Fuchs, B.A.; Poulsen, C.C.; Nothwehr, J.R. The drought risk atlas: Enhancing decision support for drought risk management in the United States. J. Hydrol. 2015, 526, 274–286. [Google Scholar] [CrossRef]
  6. Vicente-Serrano, S.M.; Quiring, S.M.; Peña-Gallardo, M.; Yuan, S.; Domínguez-Castro, F. A review of environmental droughts: Increased risk under global warming? Earth-Sci. Rev. 2020, 201, 102953. [Google Scholar] [CrossRef]
  7. Abbasian, M.S.; Najafi, M.R.; Abrishamchi, A. Increasing risk of meteorological drought in the Lake Urmia basin under climate change: Introducing the precipitation–temperature deciles index. J. Hydrol. 2021, 592, 125586. [Google Scholar] [CrossRef]
  8. Wen, J.; Hua, Y.; Cai, C.; Wang, S.; Wang, H.; Zhou, X.; Huang, J.; Wang, J. Probabilistic Forecast and Risk Assessment of Flash Droughts Based on Numeric Weather Forecast: A Case Study in Zhejiang, China. Sustainability 2023, 15, 3865. [Google Scholar] [CrossRef]
  9. Chandler, M.A. Depiction of modern and Pangean deserts: Evaluation of GCM hydrological diagnostics for paleoclimate studies. Geol. Soc. Am. Spec. Pap. 1994, 288, 117–138. [Google Scholar]
  10. Bachmair, S.; Stahl, K.; Collins, K.; Hannaford, J.; Acreman, M.; Svoboda, M.; Knutson, C.; Smith, K.H.; Wall, N.; Fuchs, B. Drought indicators revisited: The need for a wider consideration of environment and society. Wiley Interdiscip. Rev. Water 2016, 3, 516–536. [Google Scholar] [CrossRef]
  11. Vishwakarma, B.D. Monitoring Droughts From GRACE. Front. Environ. Sci. 2020, 8, 584690. [Google Scholar] [CrossRef]
  12. Mishra, A.K.; Singh, V.P. Analysis of drought severity-area-frequency curves using a general circulation model and scenario uncertainty. J. Geophys. Res. 2009, 114, D06120. [Google Scholar] [CrossRef]
  13. McKee, T.; Doesken, N.; Kleist, J. The relationship of drought frequency and duration to time scales. In Proceedings of the 8th Conference on Applied Climatology, Anaheim, CA, USA, 17–22 January 1993; Volume 17, pp. 179–183. [Google Scholar]
  14. Agnew, C. Using the SPI to identify drought. Drought Netw. News 2020, 12, 6–12. [Google Scholar]
  15. Hongkui, Z.; Jianjun, W.; Xiaohan, L.; Leizhen, L.; Jianhua, Y.; Xinyi, H. Suitability of assimilated data-based standardized soil moisture index for agricultural drought monitoring. Acta Ecol. Sin. 2019, 39, 2191–2202. [Google Scholar]
  16. Han, Z.; Huang, Q.; Huang, S.; Leng, G.; Bai, Q.; Liang, H.; Wang, L.; Zhao, J.; Fang, W. Spatial-temporal dynamics of agricultural drought in the Loess Plateau under a changing environment: Characteristics and potential influencing factors. Agric. Water Manag. 2021, 244, 106540. [Google Scholar] [CrossRef]
  17. Shukla, S.; Wood, A.W. Use of a standardized runoff index for characterizing hydrologic drought. Geophys. Res. Lett. 2008, 35, L02405. [Google Scholar] [CrossRef]
  18. Wu, J.; Miao, C.; Tang, X.; Duan, Q.; He, X. A nonparametric standardized runoff index for characterizing hydrological drought on the Loess Plateau, China. Glob. Planet. Chang. 2018, 161, 53–65. [Google Scholar] [CrossRef]
  19. Salvadori, G.; De Michele, C. Multivariate real-time assessment of droughts via copula-based multi-site Hazard Trajectories and Fans. J. Hydrol. 2015, 526, 101–115. [Google Scholar] [CrossRef]
  20. Wang, F.; Wang, Z.; Yang, H.; Di, D.; Zhao, Y.; Liang, Q. A new copula-based standardized precipitation evapotranspiration streamflow index for drought monitoring. J. Hydrol. 2020, 585, 124793. [Google Scholar] [CrossRef]
  21. Wells, N.; Goddard, S.; Hayes, M.J. A self-calibrating Palmer Drought Severity Index. J. Clim. 2004, 17, 2335–2351. [Google Scholar] [CrossRef]
  22. Zhong, Z.; He, B.; Guo, L.; Zhang, Y. Performance of various forms of the Palmer Drought Severity Index in China from 1961 to 2013. J. Hydrometeorol. 2019, 20, 1867–1885. [Google Scholar] [CrossRef]
  23. Vicente-Serrano, S.M.; Beguería, S.; López-Moreno, J.I. A Multiscalar Drought Index Sensitive to Global Warming: The Standardized Precipitation Evapotranspiration Index. J. Clim. 2010, 23, 1696–1718. [Google Scholar] [CrossRef]
  24. Stagge, J.H.; Tallaksen, L.M.; Xu, C.Y.; Van Lanen, H.A. Standardized precipitation-evapotranspiration index (SPEI): Sensitivity to potential evapotranspiration model and parameters. In Proceedings of the Hydrology in a Changing World, Montpellier, France, 7–10 October 2014; pp. 367–373. [Google Scholar]
  25. Won, J.; Choi, J.; Lee, O.; Kim, S. Copula-based Joint Drought Index using SPI and EDDI and its application to climate change. Sci. Total Environ. 2020, 744, 140701. [Google Scholar] [CrossRef] [PubMed]
  26. Zheng, J.; Zhao, T.; Lü, H.; Shi, J.; Cosh, M.H.; Ji, D.; Jiang, L.; Cui, Q.; Lu, H.; Yang, K. Assessment of 24 soil moisture datasets using a new in situ network in the Shandian River Basin of China. Remote Sens. Environ. 2022, 271, 112891. [Google Scholar] [CrossRef]
  27. Riegger, J.; Tourian, M.J. Characterization of runoff-storage relationships by satellite gravimetry and remote sensing. Water Resour. Res. 2014, 50, 3444–3466. [Google Scholar] [CrossRef]
  28. Long, D.; Shen, Y.; Sun, A.; Hong, Y.; Longuevergne, L.; Yang, Y.; Li, B.; Chen, L. Drought and flood monitoring for a large karst plateau in Southwest China using extended GRACE data. Remote Sens. Environ. 2014, 155, 145–160. [Google Scholar] [CrossRef]
  29. Mohamed, A.; Abdelrady, A.; Alarifi, S.S.; Othman, A. Geophysical and Remote Sensing Assessment of Chad’s Groundwater Resources. Remote Sens. 2023, 15, 560. [Google Scholar] [CrossRef]
  30. Mohamed, A.; Faye, C.; Othman, A.; Abdelrady, A. Hydro-geophysical Evaluation of the Regional Variability of Senegal’s Terrestrial Water Storage Using Time-Variable Gravity Data. Remote Sens. 2022, 14, 4059. [Google Scholar] [CrossRef]
  31. Zhang, Y.; He, B.; Guo, L.; Liu, D. Differences in Response of Terrestrial Water Storage Components to Precipitation over 168 Global River Basins. J. Hydrometeorol. 2019, 20, 1981–1999. [Google Scholar] [CrossRef]
  32. Scanlon, B.R.; Rateb, A.; Pool, D.R.; Sanford, W.; Save, H.; Sun, A.; Long, D.; Fuchs, B. Effects of climate and irrigation on GRACE-based estimates of water storage changes in major US aquifers. Environ. Res. Lett. 2021, 16, 094009. [Google Scholar] [CrossRef]
  33. Yang, X.; Wang, N.; Liang, Q.; Chen, A.a.; Wu, Y. Impacts of Human Activities on the Variations in Terrestrial Water Storage of the Aral Sea Basin. Remote Sens. 2021, 13, 2923. [Google Scholar] [CrossRef]
  34. Liu, B.; Zou, X.; Yi, S.; Sneeuw, N.; Cai, J.; Li, J. Identifying and separating climate- and human-driven water storage anomalies using GRACE satellite data. Remote Sens. Environ. 2021, 263, 112559. [Google Scholar] [CrossRef]
  35. Ince, E.S.; Barthelmes, F.; Reißland, S.; Elger, K.; Förste, C.; Flechtner, F.; Schuh, H. ICGEM–15 years of successful collection and distribution of global gravitational models, associated services, and future plans. Earth Syst. Sci. Data 2019, 11, 647–674. [Google Scholar] [CrossRef]
  36. Chen, J.; Tapley, B.; Tamisiea, M.E.; Save, H.; Wilson, C.; Bettadpur, S.; Seo, K.W. Error Assessment of GRACE and GRACE Follow-On Mass Change. J. Geophys. Res. Solid Earth 2021, 126, e2021JB022124. [Google Scholar] [CrossRef]
  37. Zhao, M.; Geruo, A.; Velicogna, I.; Kimball, J.S. Satellite Observations of Regional Drought Severity in the Continental United States Using GRACE-Based Terrestrial Water Storage Changes. J. Clim. 2017, 30, 6297–6308. [Google Scholar] [CrossRef]
  38. Yirdaw, S.Z.; Snelgrove, K.R.; Agboma, C.O. GRACE satellite observations of terrestrial moisture changes for drought characterization in the Canadian Prairie. J. Hydrol. 2008, 356, 84–92. [Google Scholar] [CrossRef]
  39. Sinha, D.; Syed, T.H.; Reager, J.T. Utilizing combined deviations of precipitation and GRACE-based terrestrial water storage as a metric for drought characterization: A case study over major Indian river basins. J. Hydrol. 2019, 572, 294–307. [Google Scholar] [CrossRef]
  40. Wang, F.; Wang, Z.; Yang, H.; Di, D.; Zhao, Y.; Liang, Q. Utilizing GRACE-based groundwater drought index for drought characterization and teleconnection factors analysis in the North China Plain. J. Hydrol. 2020, 585, 124849. [Google Scholar] [CrossRef]
  41. Nigatu, Z.M.; Fan, D.; You, W.; Melesse, A.M. Hydroclimatic Extremes Evaluation Using GRACE/GRACE-FO and Multidecadal Climatic Variables over the Nile River Basin. Remote Sens. 2021, 13, 651. [Google Scholar] [CrossRef]
  42. Sun, Z.; Zhu, X.; Pan, Y.; Zhang, J.; Liu, X. Drought evaluation using the GRACE terrestrial water storage deficit over the Yangtze River Basin, China. Sci. Total Environ. 2018, 634, 727–738. [Google Scholar] [CrossRef]
  43. Xu, H.; Taylor, R.G.; Xu, Y. Quantifying uncertainty in the impacts of climate change on river discharge in sub-catchments of the Yangtze and Yellow River Basins, China. Hydrol. Earth Syst. Sci. 2011, 15, 333–344. [Google Scholar] [CrossRef]
  44. Orimoloye, I.R.; Belle, J.A.; Ololade, O.O. Drought disaster monitoring using MODIS derived index for drought years: A space-based information for ecosystems and environmental conservation. J. Environ. Manag. 2021, 284, 112028. [Google Scholar] [CrossRef] [PubMed]
  45. Niu, Z.; Wang, L.; Fang, L.; Li, J.; Yao, R. Analysis of spatiotemporal variability in temperature extremes in the Yellow and Yangtze River basins during 1961–2014 based on high-density gauge observations. Int. J. Climatol. 2020, 40, 1–21. [Google Scholar] [CrossRef]
  46. Jiang, W.; Niu, Z.; Wang, L.; Yao, R.; Gui, X.; Xiang, F.; Ji, Y. Impacts of Drought and Climatic Factors on Vegetation Dynamics in the Yellow River Basin and Yangtze River Basin, China. Remote Sens. 2022, 14, 930. [Google Scholar] [CrossRef]
  47. Wang, H.; Yang, Z.; Saito, Y.; Liu, J.P.; Sun, X. Interannual and seasonal variation of the Huanghe (Yellow River) water discharge over the past 50 years: Connections to impacts from ENSO events and dams. Glob. Planet. Chang. 2006, 50, 212–225. [Google Scholar] [CrossRef]
  48. Chen, X.; Wang, Y.; Zhang, L.; Han, X.; Zhang, J.; Bechmann, M. Effects of integrated fertilizer application on nitrogen use efficiency of spring maize and soil nitrogen content on black soil in Harbin. Acta Agric. Scand. Sect. B—Soil Plant Sci. 2014, 63, 139–145. [Google Scholar] [CrossRef]
  49. Fang, L.; Wang, L.; Chen, W.; Sun, J.; Cao, Q.; Wang, S.; Wang, L. Identifying the impacts of natural and human factors on ecosystem service in the Yangtze and Yellow River Basins. J. Clean. Prod. 2021, 314, 127995. [Google Scholar] [CrossRef]
  50. Wu, C.; Ma, G.; Yang, W.; Zhou, Y.; Peng, F.; Wang, J.; Yu, F. Assessment of ecosystem service value and its differences in the Yellow River Basin and Yangtze River Basin. Sustainability 2021, 13, 3822. [Google Scholar] [CrossRef]
  51. Saito, Y.; Yang, Z.; Hori, K. The Huanghe (Yellow River) and Changjiang (Yangtze River) deltas: A review on their characteristics, evolution and sediment discharge during the Holocene. Geomorphology 2001, 41, 219–231. [Google Scholar] [CrossRef]
  52. Omer, A.; Zhuguo, M.; Zheng, Z.; Saleem, F. Natural and anthropogenic influences on the recent droughts in Yellow River Basin, China. Sci. Total Environ. 2020, 704, 135428. [Google Scholar] [CrossRef]
  53. Sun, Z.; Long, D.; Yang, W.; Li, X.; Pan, Y. Reconstruction of GRACE data on changes in total water storage over the global land surface and 60 basins. Water Resour. Res. 2020, 56, e2019WR026250. [Google Scholar] [CrossRef]
  54. Dong, N.; Wei, J.; Yang, M.; Yan, D.; Yang, C.; Gao, H.; Arnault, J.; Laux, P.; Zhang, X.; Liu, Y.; et al. Model Estimates of China’s Terrestrial Water Storage Variation Due To Reservoir Operation. Water Resour. Res. 2022, 58, e2021WR031787. [Google Scholar] [CrossRef]
  55. Watkins, M.M.; Wiese, D.N.; Yuan, D.N.; Boening, C.; Landerer, F.W. Improved methods for observing Earth’s time variable mass distribution with GRACE using spherical cap mascons. J. Geophys. Res. Solid Earth 2015, 120, 2648–2671. [Google Scholar] [CrossRef]
  56. Wiese, D.N.; Landerer, F.W.; Watkins, M.M. Quantifying and reducing leakage errors in the JPL RL05M GRACE mascon solution. Water Resour. Res. 2016, 52, 7490–7502. [Google Scholar] [CrossRef]
  57. Landerer, F.W.; Flechtner, F.M.; Save, H.; Webb, F.H.; Bandikova, T.; Bertiger, W.I.; Bettadpur, S.V.; Byun, S.H.; Dahle, C.; Dobslaw, H. Extending the global mass change data record: GRACE Follow-On instrument and science data performance. Geophys. Res. Lett. 2020, 47, e2020GL088306. [Google Scholar] [CrossRef]
  58. Thomas, A.C.; Reager, J.T.; Famiglietti, J.S.; Rodell, M. A GRACE-based water storage deficit approach for hydrological drought characterization. Geophys. Res. Lett. 2014, 41, 1537–1545. [Google Scholar] [CrossRef]
  59. Sklar, M. Fonctions de repartition an dimensions et leurs marges. Publ. Inst. Stat. Univ. Paris 1959, 8, 229–231. [Google Scholar]
  60. Nelsen, R.B. An Introduction to Copulas; Springer Science & Business Media: Berlin/Heidelberg, Germany, 2007. [Google Scholar]
  61. Crooks, G.E. Field Guide to Continuous Probability Distributions; Berkeley Institute for Theoretical Science: Berkeley, CA, USA, 2019. [Google Scholar]
  62. Amirataee, B.; Montaseri, M.; Rezaie, H. Regional analysis and derivation of copula-based drought Severity-Area-Frequency curve in Lake Urmia basin, Iran. J. Environ. Manag. 2018, 206, 134–144. [Google Scholar] [CrossRef]
  63. Wang, F.; Wang, Z.; Yang, H.; Zhao, Y.; Zhang, Z.; Li, Z.; Hussain, Z. Copula-Based Drought Analysis Using Standardized Precipitation Evapotranspiration Index: A Case Study in the Yellow River Basin, China. Water 2019, 11, 1298. [Google Scholar] [CrossRef]
  64. Guo, Y.; Huang, S.; Huang, Q.; Wang, H.; Wang, L.; Fang, W. Copulas-based bivariate socioeconomic drought dynamic risk assessment in a changing environment. J. Hydrol. 2019, 575, 1052–1064. [Google Scholar] [CrossRef]
  65. Massey Jr, F.J. The Kolmogorov-Smirnov test for goodness of fit. J. Am. Stat. Assoc. 1951, 46, 68–78. [Google Scholar] [CrossRef]
  66. Hu, Z.; Chen, X.; Zhou, Q.; Yin, G.; Liu, J. Dynamical variations of the terrestrial water cycle components and the influences of the climate factors over the Aral Sea Basin through multiple datasets. J. Hydrol. 2022, 604, 127270. [Google Scholar] [CrossRef]
  67. Soni, A.; Syed, T.H. Diagnosing land water storage variations in major Indian river basins using GRACE observations. Glob. Planet. Chang. 2015, 133, 263–271. [Google Scholar] [CrossRef]
  68. Sun, A.Y.; Scanlon, B.R.; Save, H.; Rateb, A. Reconstruction of GRACE Total Water Storage Through Automated Machine Learning. Water Resour. Res. 2021, 57, e2020WR028666. [Google Scholar] [CrossRef]
  69. Lai, Y.; Zhang, B.; Yao, Y.; Liu, L.; Yan, X.; He, Y.; Ou, S. Reconstructing the data gap between GRACE and GRACE follow-on at the basin scale using artificial neural network. Sci. Total Environ. 2022, 823, 153770. [Google Scholar] [CrossRef]
  70. Zhang, B.; Yao, Y.; He, Y. Bridging the data gap between GRACE and GRACE-FO using artificial neural network in Greenland. J. Hydrol. 2022, 608, 127614. [Google Scholar] [CrossRef]
Figure 1. Location of the Yangtze River and Yellow River.
Water 15 01990 g001
Figure 2. Time series of TWSA and precipitation in the YRB (a) and the YZRB (b) from April 2002 to December 2020.
Water 15 01990 g002
Figure 3. Marginal distributions of TWSA and precipitation in the YRB. (a) Marginal distribution of TWSA, (b) Q–Q plot of TWSA, (c) marginal distribution of precipitation, and (d) Q–Q plot of precipitation.
Water 15 01990 g003
Figure 4. Marginal distributions of TWSA and precipitation in the YZRB. (a) Marginal distribution of TWSA, (b) Q–Q plot of TWSA, (c) marginal distribution of precipitation, and (d) Q–Q plot of precipitation.
Water 15 01990 g004
Figure 5. Comparisons between CMSDI and other drought indices in the YRB (a) and the YZRB (b). Z-score standardization of all the indices of the YRB (c) and the YZRB (d).
Water 15 01990 g005
Figure 6. Correlations of CMSDI, WSDI, sc-PDSI, SPEI, and SPI computed for the YRB (a) and YZRB (b). “×” denotes non-significant at a 95% confidence level.
Water 15 01990 g006
Figure 7. Spatial correlations between CMSDI and (a) WSDI, (b) sc-PDSI, (c) SPEI, and (d) SPI in the YRB and YZRB.
Water 15 01990 g007
Figure 8. Comparison of monthly CMSDI, WSDI, sc-PDSI, SPEI, and SPI in the YRB (a) and YZRB (b). The legend shows the drought categories in Table 2. The gray shading overlays the data gap between the GRACE and GRACE-FO missions (i.e., July 2017 to May 2018).
Water 15 01990 g008
Figure 9. Spatial comparison of monthly CMSDI, WSDI, sc-PDSI, SPEI, and SPI during recorded major drought events in the YRB and YZRB. Subfigures (ae) represent the CMSDI, WSDI, sc-PDSI, SPEI, and SPI for the drought event in October 2004. Subfigures (fj) display the same indices for the drought event in January 2009. Subfigures (ko) show these indices for the drought event in March 2015. The legend shows the drought categories in Table 2.
Water 15 01990 g009
Figure 10. Zs values (a) and Sen’s slope (b) of CMSDI in the YRB and YZRB from April 2002 to December 2020.
Water 15 01990 g010
Figure 11. Area percentages of the YRB (a) and YZRB (b) subjected to droughts at different levels of severity levels based on CMSDI from April 2002 to December 2020.
Water 15 01990 g011
Table 1. The four Copula functions that were employed.
FunctionMathematical DescriptionParameter Range
Gaussian - Φ - 1 u Φ 1 v 1 2 π 1 θ 2 exp 2 θ x y x 2 y 2 2 1 θ 2 d x d y θ [ 1 , 1 ]
Clayton u θ + v θ 1 1 / θ θ ( 0 , + )
Frank 1 θ ln ( 1 + e θ u 1 e θ v 1 e θ 1 ) θ R \ 0
Gumbel exp ( ( ( ln u ) θ + ( l n v ) θ ) 1 / θ ) θ [ 1 , + )
Table 2. Drought classification and corresponding thresholds for several drought indices.
GradeClassificationsc-PDSIWSDISPEI/SPI/CMSDI
1No drought 1.0 , + 0 , + 0.5 , +
2Mild drought 2.0 , 1.0 1.0 , 0 1.0 , 0.5
3Moderate drought 3.0 , 2.0 2.0 , 1.0 1.5 , 1.0
4Severe drought 4.0 , 3.0 3.0 , 2.0 2.0 , 1.5
5Extreme drought , 4.0 , 3.0 , 2.0
Table 3. Drought categories and forcing variables for several drought indices.
Drought IndicesDrought CategoriesForcing Variables
SPIMeteorological droughtprecipitation
SPEIMeteorological droughtprecipitation, potential evapotranspiration
sc-PDSIMeteorological droughtprecipitation, temperature, soil/surface characteristics
WSDIHydrological droughtTWSA
CMSDIHydrometeorological droughtTWSA, precipitation
Table 4. GOF test of different copula functions in the YRB and YZRB.
FunctionYRBYZRB
RMSEAICBICRMSEAICBIC
Gaussian0.146−2081.574−2078.1580.279−1790.756−1787.340
Clayton0.147−2079.005−2075.5890.545−1489.713−1486.297
Frank0.147−2079.250−2075.8340.230−1878.538−1875.122
Gumbel0.146−2082.356−2078.9390.256−1830.310−1826.894
Disclaimer/Publisher’s Note: The statements, opinions and data contained in all publications are solely those of the individual author(s) and contributor(s) and not of MDPI and/or the editor(s). MDPI and/or the editor(s) disclaim responsibility for any injury to people or property resulting from any ideas, methods, instructions or products referred to in the content.

