3.1.1. Phytoplankton Composition, Density, and Biomass
A total of 133 species were recorded in two lakes: 51 Chlorophyta, 48 Bacillariophyta, 16 Cyanobacteria, 11 Euglenophyta, 2 Dinophyta, 2 Cryptophyta, 2 Xanthophyta, and 1 Chrysophyta. Chlorophyta were the most abundant phytoplankton taxa in Lake L, comprising 42.6% of total species. This was followed by Bacillariophyta (29.7%) and Cyanobacteria (13.9%). Chlorophyta comprised 33.3% of phytoplankton species in Lake Q, while Bacillariophyta was the most abundant phytoplankton taxa (38.2%). Cyanobacteria comprised 13.7% and was similar to Lake L. The mean density was 123.99 ± 149.65 × 10⁴ ind/L, and the total density was 991.89 × 10⁴ ind/L in the two lakes. Chlorophyta were the most abundant taxon and contributed 46% of the total phytoplankton density, followed by Cyanobacteria (17.2%), Bacillariophyta (15.7%), Xanthophyta (12%), Cryptophyta (5.7%), Euglenophyta (3.1%), Dinophyta (0.2%), and Chrysophyta (0.1%). The mean biomass was 1.1552 ± 1.0437 mg/L, and the total biomass was 9.2418mg/L in the two lakes. Bacillariophyta was the highest in biomass and contributed 33.3% of the total phytoplankton biomass, followed by Cyanobacteria (21%), Euglenophyta (15.1%), Chlorophyta (13.7%), Cryptophyta (13%), Xanthophyta (2.8%), Dinophyta (1%), and Chrysophyta (0.1%).
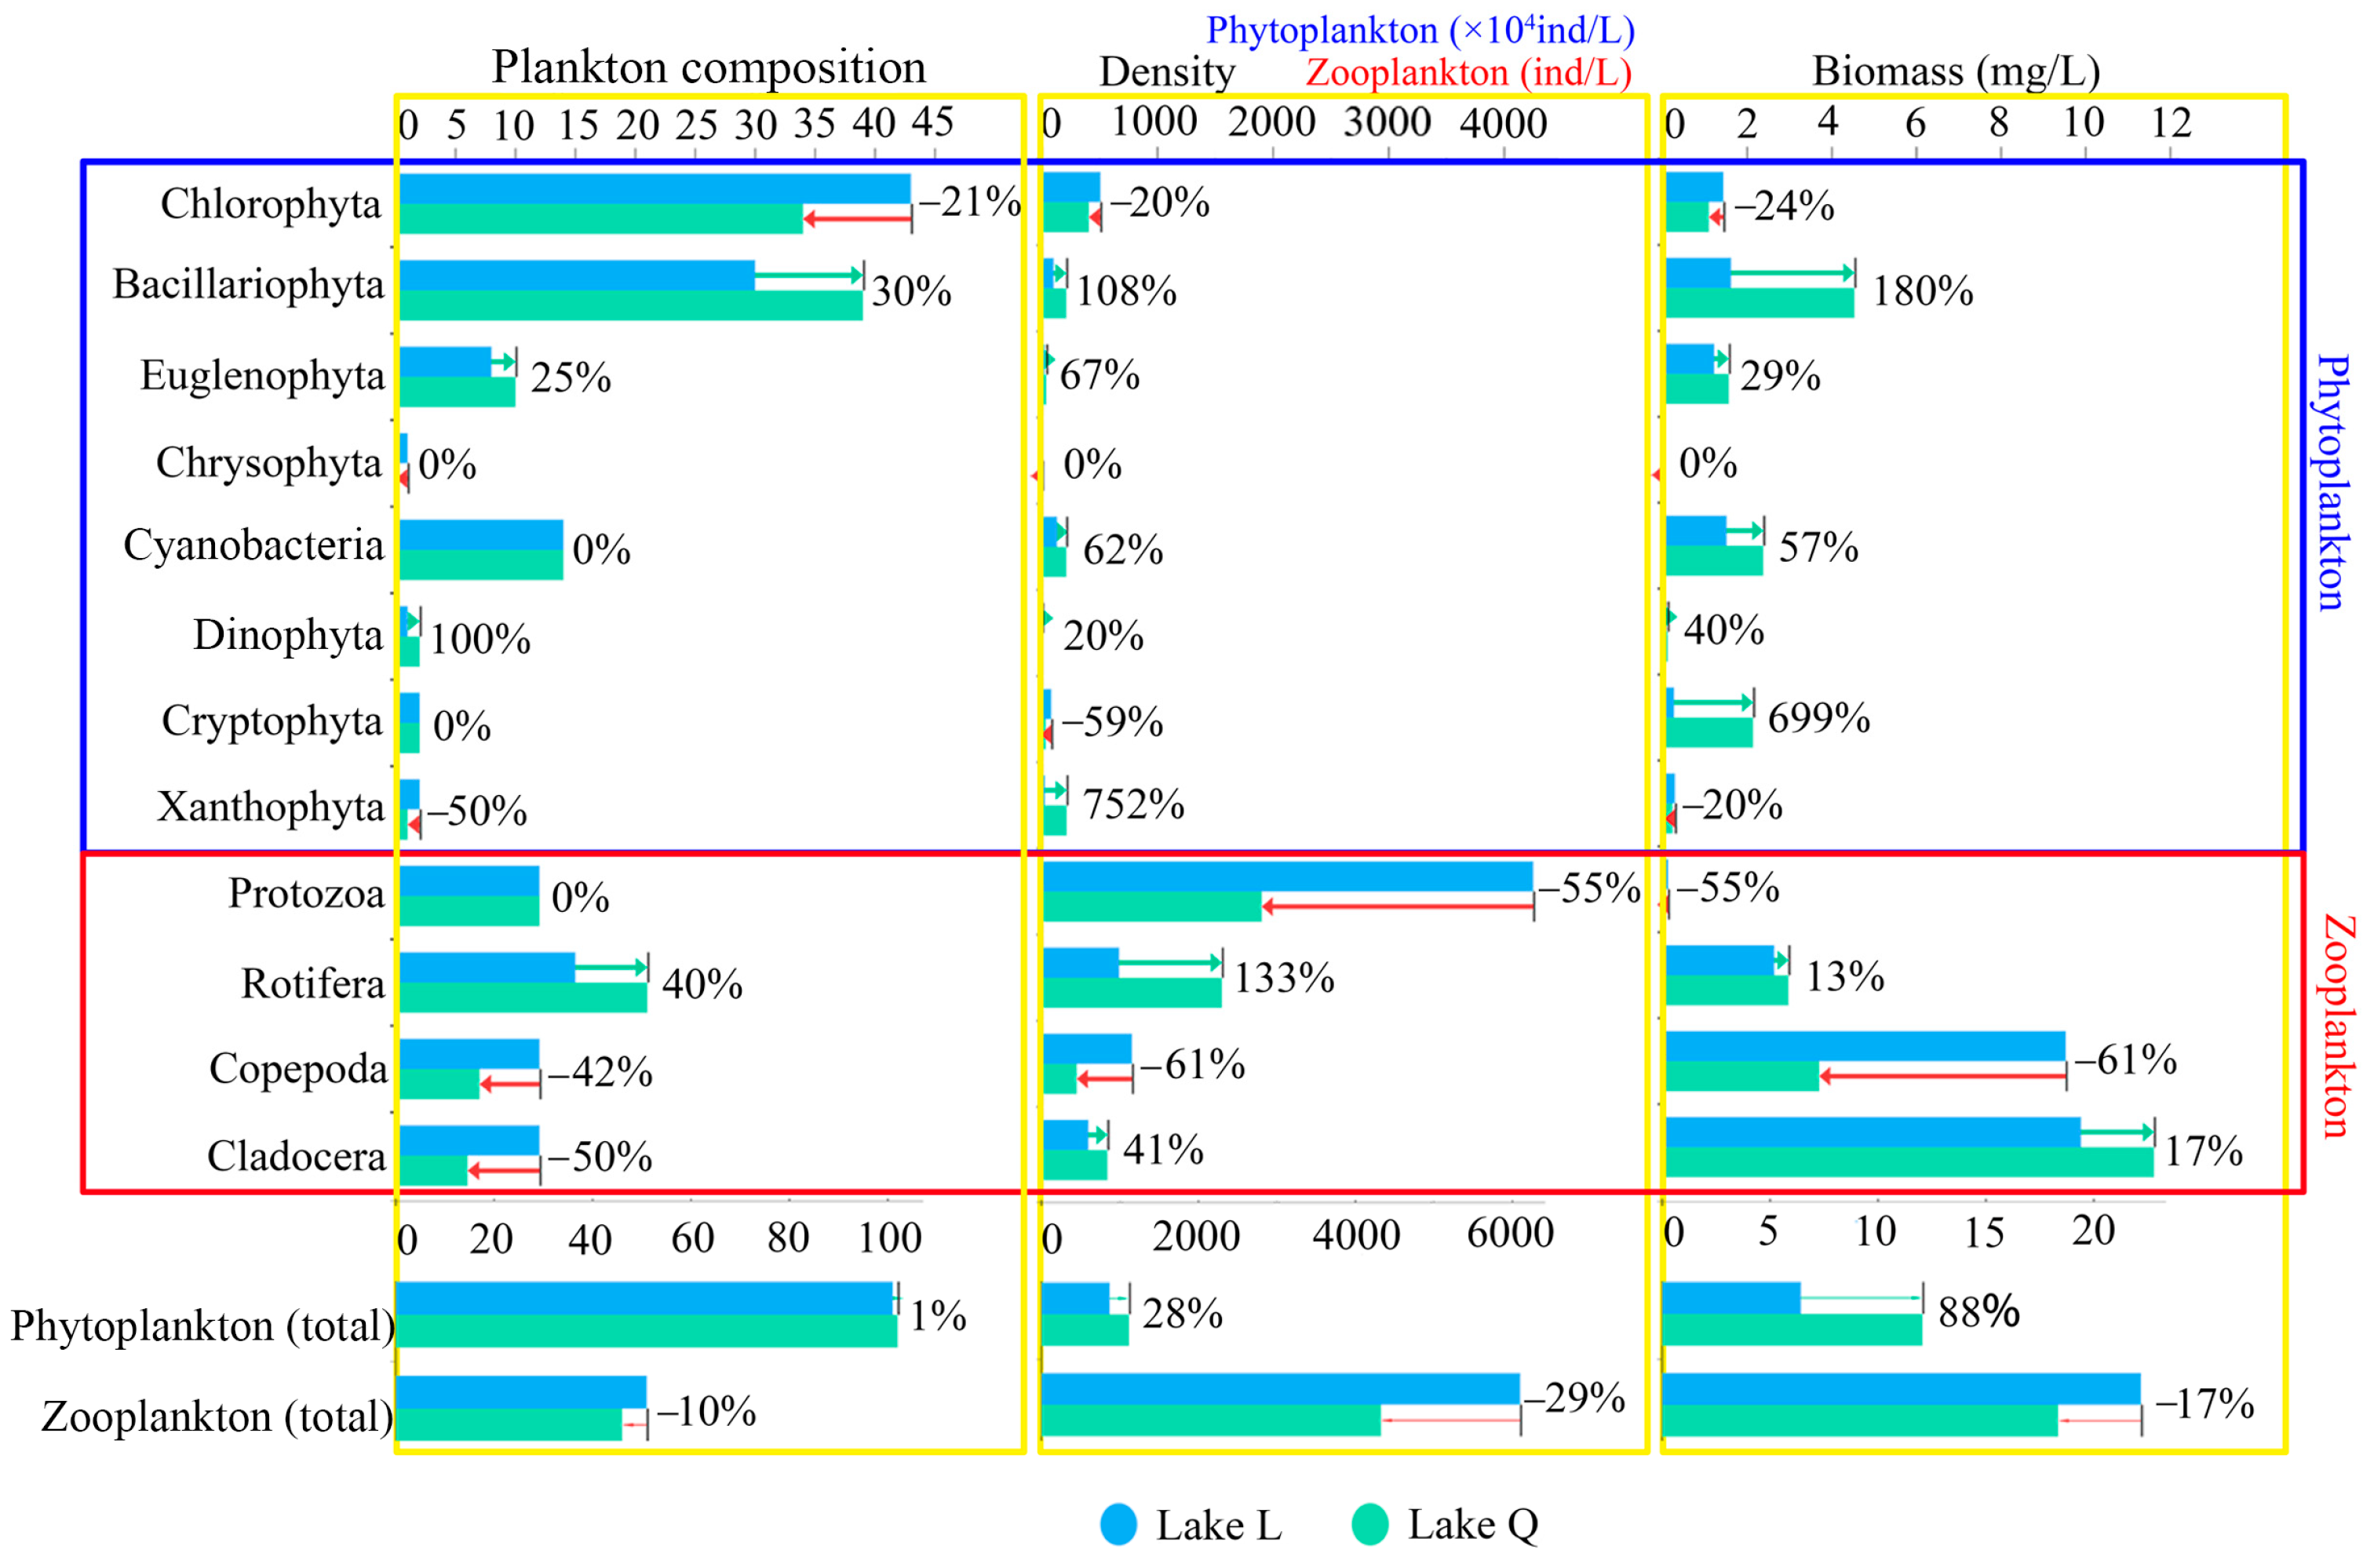
As shown in
Figure 2, the total phytoplankton composition was almost the same in the two lakes, with a difference of only 1%. Compared with Lake L, Lake Q had a slightly higher total phytoplankton density by 28%. The total phytoplankton biomass was significantly higher in Lake Q by 88% (
Figure 2).
3.1.2. Zooplankton Composition, Density, and Biomass
A total of 68 species were recorded in two lakes: 25 Rotifera, 16 Protozoa, 14 Copepoda, and 13 Cladocera. Rotifera was the most abundant zooplankton taxa in Lake L, comprising 29.5% of total species. This was followed by Protozoa (23.5%), Copepoda (23.5%), and Cladocera (23.5%). Protozoa comprised 26.1% of zooplankton species in Lake Q, while Rotifera was the most abundant zooplankton taxa (45.7%), Copepoda comprised 15.2%, and Cladocera comprised 13.0%. The mean density was 1303 ± 1215.23 ind/L, and the total density was 5212 ind/L in the two lakes. Protozoa were the most abundant taxon and contributed 59% of the total zooplankton density. This was followed by Rotifera (21.3%), Copepoda (10.4%), and Cladocera (9.3%). The average zooplankton biomass was 5.0661 ± 4.6396 mg/L, and the total biomass was 20.2646 mg/L in the two lakes. Cladocera was the highest in biomass and contributed 53.1% of the total zooplankton biomass. This was followed by Copepoda (32.6%), Rotifera (13.9%), and Protozoa (0.4%).
Compared with Lake Q, the total zooplankton composition was higher in Lake L by 10%, with Copepoda and Cladocera contributing the most. Lake L had a higher total zooplankton density by 29%, with Protozoa and Copepoda contributing the most. The total zooplankton biomass was higher in Lake L by 17%, with Copepoda contributing the most to the higher biomass (
Figure 2).
In each survey month, the composition, density, and biomass of plankton in Lake L and Q were compared using independent-samples
t-tests to investigate significant differences. The results showed that significant differences existed in phytoplankton composition in the two lakes in October; in phytoplankton density in the two lakes in April, October, and December; and in phytoplankton biomass in August and October. The zooplankton composition differed significantly in the two lakes in April, August, October, and December, while zooplankton density exhibited significant differences in April, October, and December. Furthermore, zooplankton biomass differed significantly in April and August between the two lakes (
Table 1).
3.1.3. Dominant Species (DS)
The DS are shown in
Table 2. Phytoplankton was dominated by Chlorophyta (15) and Cyanobacteria (9), followed by Bacillariophyta (7), Euglenophyta (2), Cryptophyta (2), and Xanthophyta (1). Zooplankton was dominated by Rotifera (13) and Protozoa (13), followed by Cladocera (7) and Copepoda (6) (
Figure 3).
In Lake L, DS of Rotifera occurred from February to December, and the total dominance (TD) was relatively high in April (0.33), June (0.22), and August (0.13) and relatively low in February (0.04), October (0.03), and December (0.03). DS of Protozoa also occurred from February to December, and the DS was relatively high in October (0.86), February (0.46), and December (0.43), and it was relatively low in August (0.16), April (0.02), and June (0.02). DS of Copepoda occurred from April to August and December, and the TD decreased gradually in April (0.49), June (0.26), August (0.17), and December (0.11). DS of Cladocera occurred in June and August, and the TD in June (0.26) was higher than that in August (0.05). In Lake Q, DS of Protozoa occurred from February to December, and the TD was relatively high in February (0.26), August (0.23), October (0.14), and December (0.15) and relatively low in April (0.05) and June (0.03). DS of Copepoda also occurred from February to December, and the TD was relatively high in October (0.15), April (0.09), December (0.09), August (0.05), and June (0.04) and relatively low in February (0.02). DS of Rotifera occurred from February to August, and the TD was relatively high in April (0.75) and June (0.49), and it was relatively low in August (0.14) and February (0.07). DS of Cladocera occurred from June to December, and the TD was relatively high in June (0.37) and relatively low in October (0.13), August (0.05), and December (0.05) (
Figure 3).
In Lake L, DS of Chlorophyta occurred from February to December, and the TD of was relatively high in April (0.78), June (0.76), August (0.46), and October (0.3) and relatively low in February (0.09) and December (0.04). DS of Cyanobacteria occurred in February and from August to December, and Bacillariophyta occurred in February, August, and October. Cryptophyta occurred in February and December, Euglenophyta occurred in October, and Xanthophyta occurred in August. In Lake Q, DS of Chlorophyta occurred from February to December, and the TD was relatively high in February (0.45), June (0.28), and October (0.25), and it was relatively low in April (0.12), August (0.18), and December (0.02). DS of Bacillariophyta occurred in February and from June to October, and the TD was high in October (0.24). DS of Cyanobacteria occurred in February and from August to December, and the highest TD was in December (0.68). DS of Xanthophyta occurred in April, June, and December, and the highest total dominance was in June (0.21). DS of Cryptophyta occurred in February and December, Euglenophyta occurred in February, and neither of the TD values were high (
Figure 3).
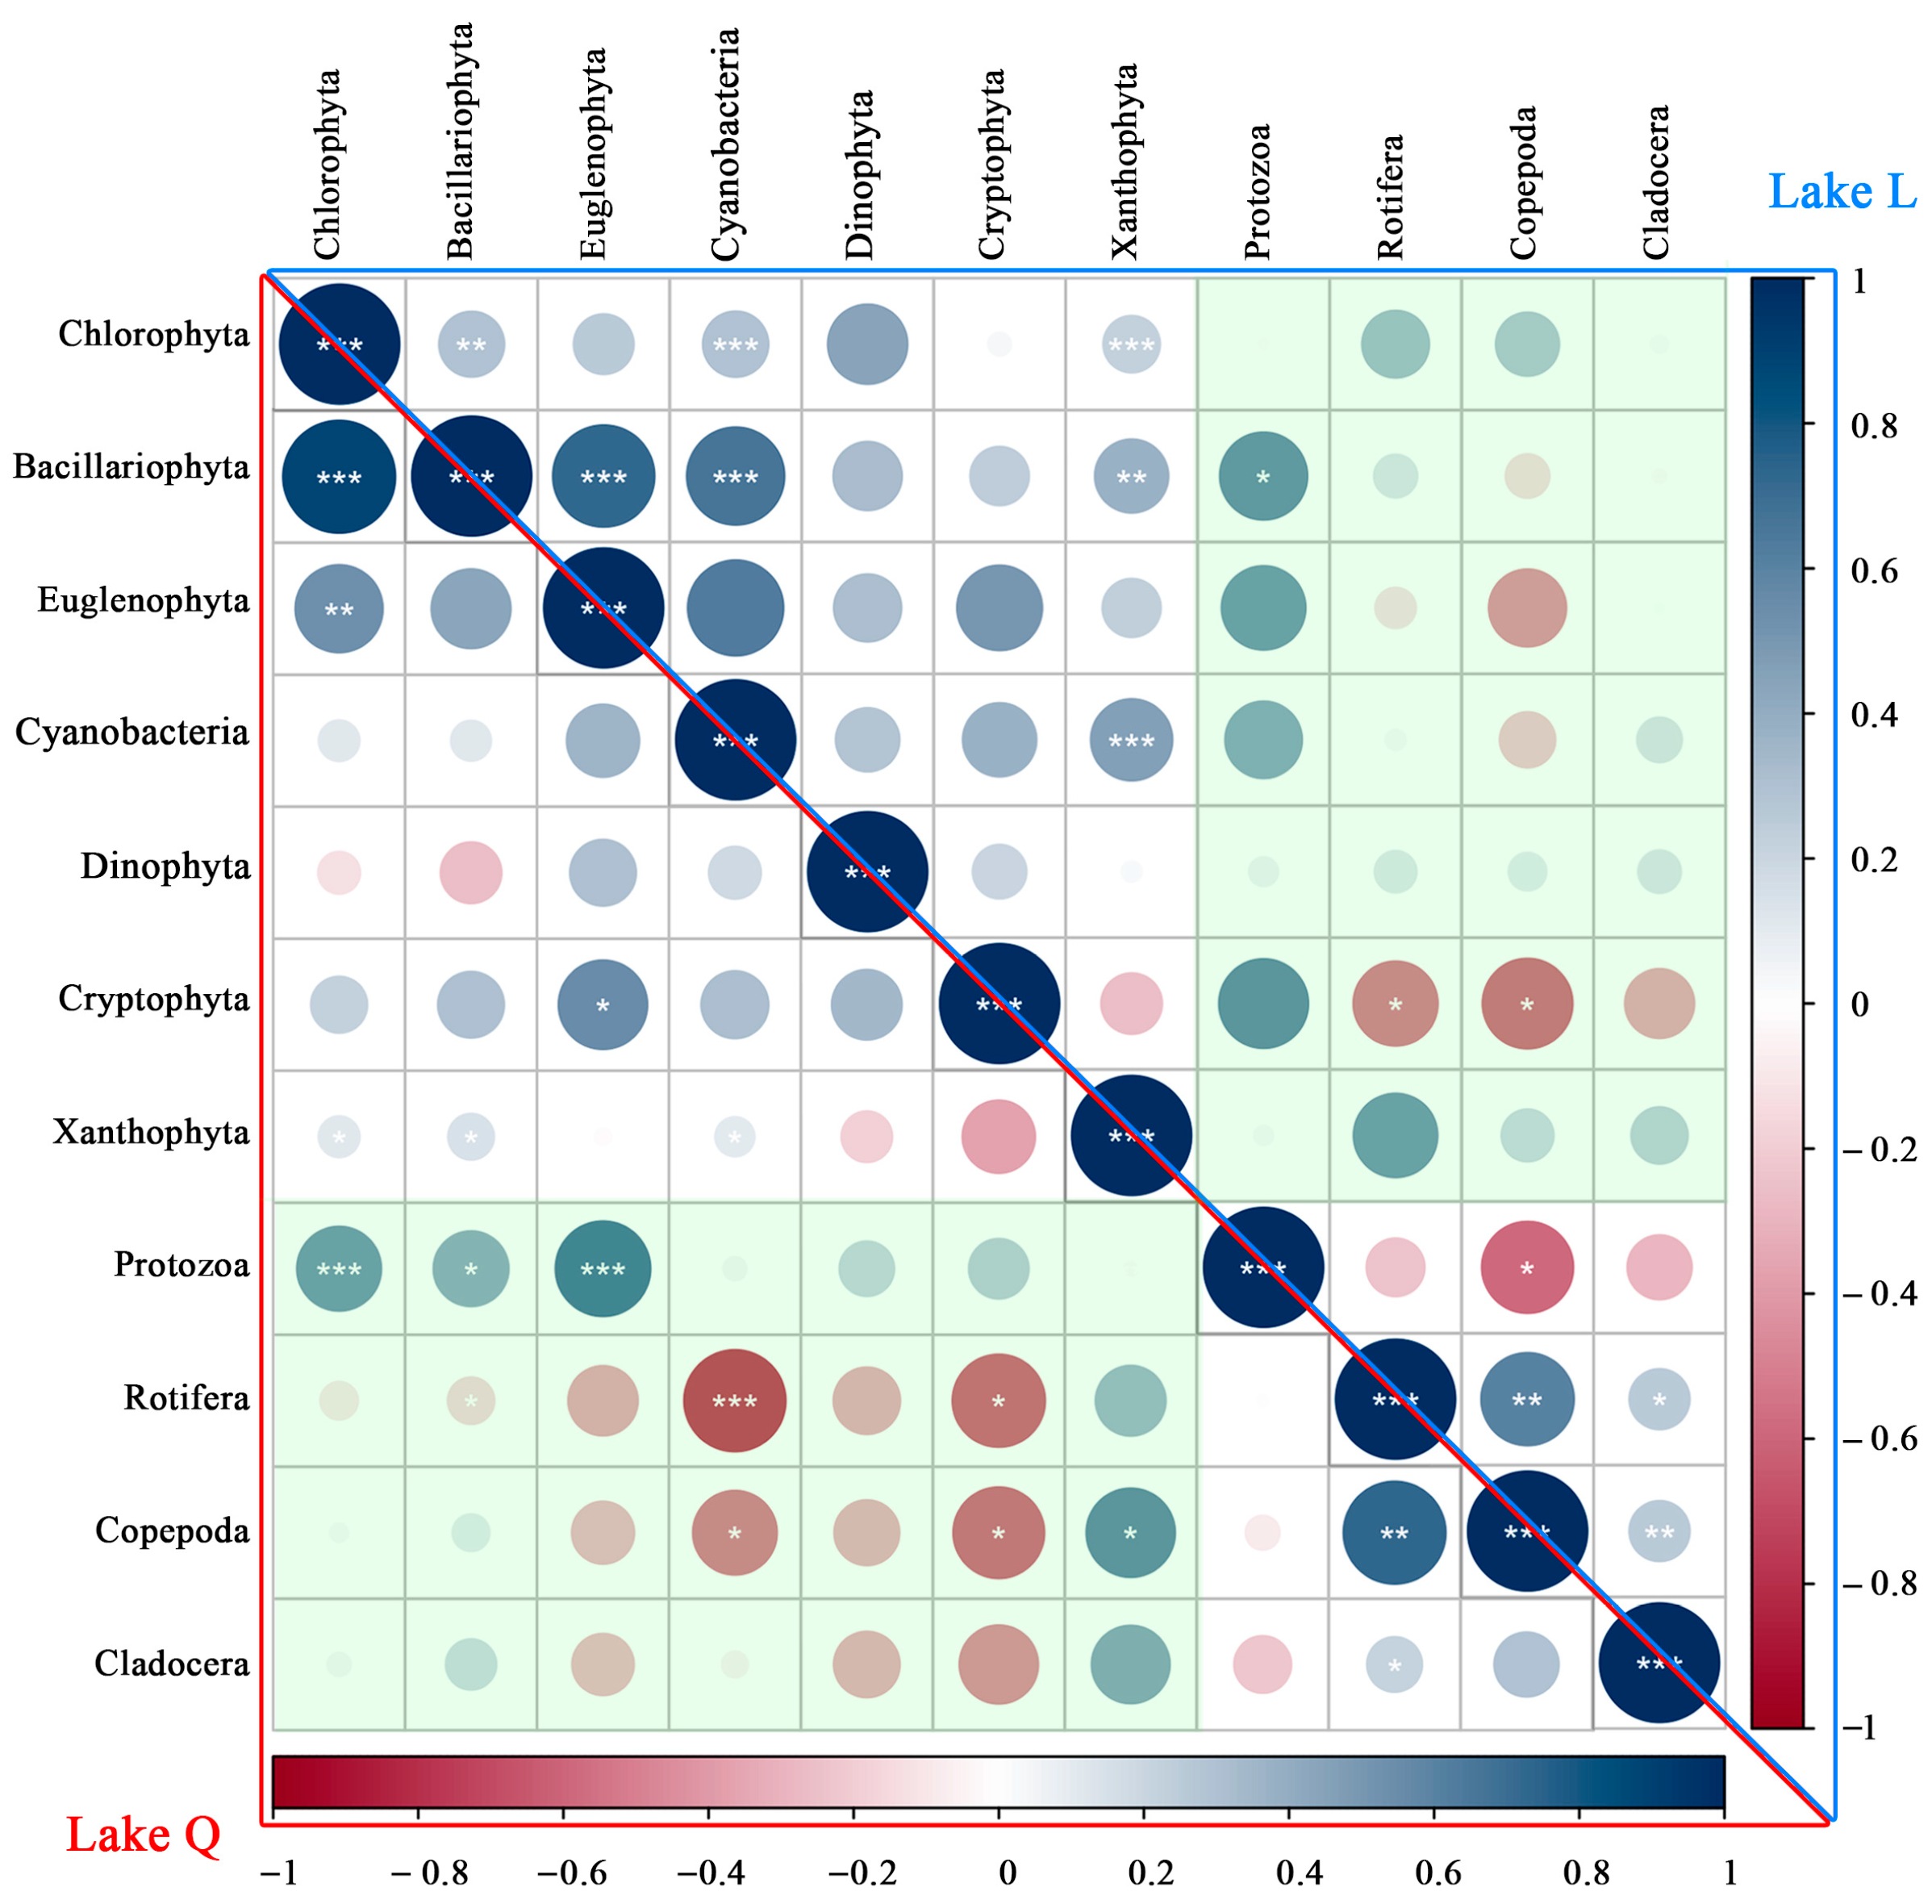
The Cj values of phytoplankton and zooplankton between the two lakes were not high (index values below 0.50 indicate low similarity; values above 0.50 indicate high similarity), with annual averages of 0.26 and 0.18, respectively. Phytoplankton had the highest similarity in December with a Cj of 0.38 and the lowest similarity in April with a Cj of 0.1. The Cj was 0.2, 0.33, 0.32, and 0.25 in February, June, August, and October, respectively. For zooplankton, the similarity was the highest in April with a Cj of 0.38, and the similarity was the lowest in August with Cj of 0.12. The Cj was 0.15, 0.13, 0.14, and 0.14 in February, June, October, and December, respectively.
In Lake L, Protozoa and Rotifera were dominant in every survey month, especially when the total dominance of the dominant species of Protozoa suddenly rose to 0.86. Cladocera dominated in June and August, and the total dominance of dominant species decreased. Copepoda dominated from April to August, and the total dominance of the dominant species gradually decreased. After not being dominant in October, Copepoda dominated again in December (
Table 3). In Lake Q, Rotifera were dominant from February to August, and Protozoa were dominant in every survey month. Compared with L, the total dominance of the dominant species of Protozoa did not increase or decrease significantly. In Lake Q, Cladocera dominated from June to December. Copepoda were dominant in every survey month, and the total dominance of dominant species did not increase or decrease significantly (
Table 3).
In Lake L, Chlorophyta dominated in every survey month, and the total dominance of dominant species was higher from April to August and gradually decreased. Cyanobacteria dominated in February and August–December. Bacillariophyta dominated in February and August–October. Other phytoplankton had a certain degree of dominance in different months (
Table 4). In Lake Q, Chlorophyta dominated in every survey month, and the total dominance of dominant species was the highest in February, and there was no obvious increase or decrease in other months. Cyanobacteria dominated in February and August–December, and the total dominance of dominant species was higher in December. Bacillariophyta dominated in February and June–October. Other phytoplankton had a certain degree of dominance in different months (
Table 4).
3.1.4. Plankton Diversity in the Two Lakes
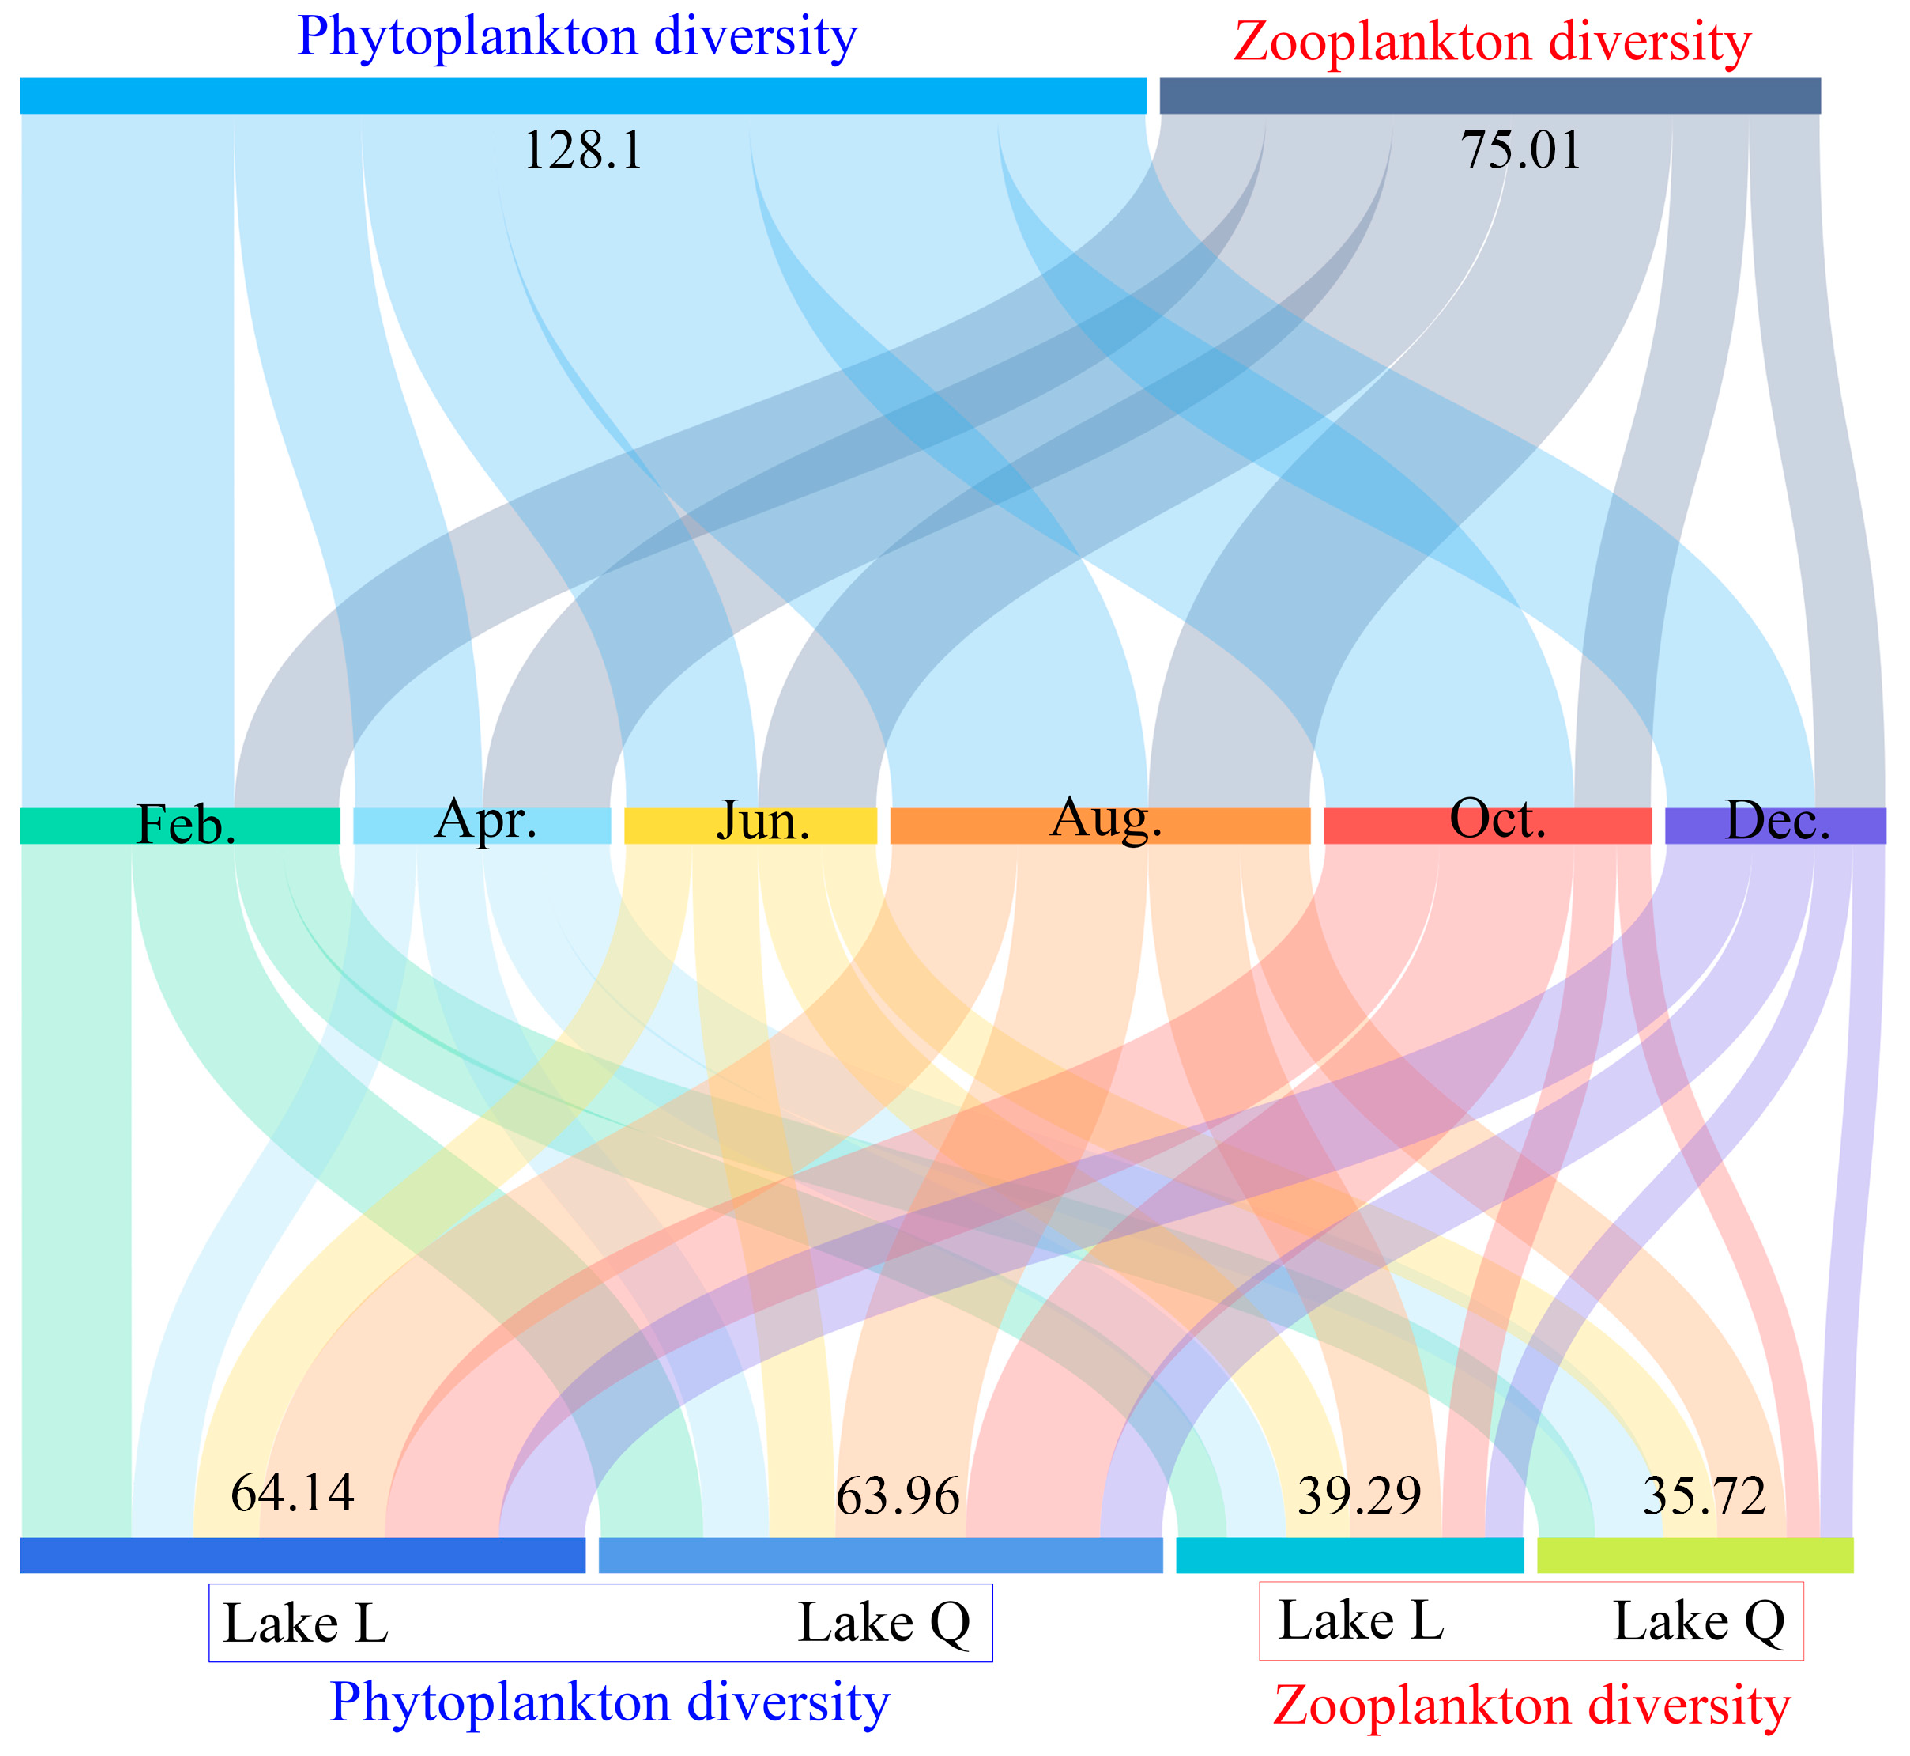
The complete 6-month data for plankton diversity in the two lakes are shown in
Figure 4. Over the course of 6 months, the total phytoplankton diversity index value in the two lakes (Feb.: 24.22, Apr.: 14.53, Jun.: 15.02, Aug.: 29.16, Oct.: 28.32, Dec.: 16.85, and total: 128.1) was higher than that of zooplankton (Feb.: 11.93, Apr.: 14.5, Jun.: 13.45, Aug.: 18.38, Oct.: 8.72, Dec.: 8.03, and total:75.01). Plankton diversity in August was higher than other months (
Figure 4), which was caused by both phytoplankton and zooplankton. Diversity in Lake L slightly outnumbered Lake Q regardless of phytoplankton (Lake L: 64.14 and Lake Q: 63.96) and zooplankton (Lake L: 39.29 and Lake Q: 35.72) (
Figure 4).
Table 5 shows the significance analysis of the three diversity indices of plankton in the two lakes in each survey month based on the independent-samples
t-test. The
H’ and
J of phytoplankton were significantly different in October. The J of phytoplankton in August was significantly different. Zooplankton H’ was significantly different in April. J was significantly different in April and December. d was significantly different from June to October (
Table 5).
Paired-samples Wilcoxon signed-rank tests to
H’,
J, and
d between lakes were summarized in
Table 6. The results showed that most of the plankton diversity indices were not significantly different between the two lakes, except that phytoplankton
J and zooplankton
d were relatively higher in lake L (
Table 6).
