Communication

MIMS as a Low-Impact Tool to Identify Pathogens in Water

1
Department of Physics, Chemistry, and Pharmacy, University of Southern Denmark, Campusvej 55, 5230 Odense M, Denmark
2
Department of Drug Design and Pharmacology, University of Copenhagen, Universitetsparken 2, 2100 København Ø, Denmark
3
Department of Biochemistry and Molecular Biology, University of Southern Denmark, Campusvej 55, 5230 Odense M, Denmark
4
Institute of Science and Environment, Roskilde University, Universitetsvej 1, 4000 Roskilde, Denmark
*
Author to whom correspondence should be addressed.
These authors contributed equally to this work.
Water 2023, 15(1), 184; https://doi.org/10.3390/w15010184
Submission received: 2 November 2022 / Revised: 22 December 2022 / Accepted: 28 December 2022 / Published: 2 January 2023
(This article belongs to the Special Issue Pathogen Detection and Identification in Wastewater)

Abstract

:
Bacteria produce many kinds of volatile compounds throughout their lifecycle. Identifying these volatile compounds can help to understand bacterial interactions with the host and/or other surrounding pathogens of the same or different species. Some commonly used techniques to detect these volatile compounds are GC and/or LC coupled to mass spectrometric techniques. However, these methods can sometimes become challenging owing to tedious sample preparation steps. Thus, identifying an easier method to detect these volatile compounds was investigated in the present study. Here, Membrane-inlet mass spectrometry (MIMS) provided a facile low-impact alternative to the existing strategies. MIMS was able to differentiate between the pathogenic and nonpathogenic bacterial strains, implying that it can be used as a bioprocess monitoring tool to analyze water samples from either water treatment plants or biotechnological industries.

Graphical Abstract

1. Introduction

Bacteria are prokaryotic organisms, and based on the composition of the cell wall, bacteria can be further classified into two subcategories, i.e., Gram-positive and Gram-negative. The Gram-positive cell type consists of three layers, which are the peptidoglycan, periplasmic space, and a cell membrane, while an additional outer membrane is present in Gram-negative organisms [1].
Throughout their lifecycle, bacteria produce different organic volatile compounds when exposed to different environmental conditions. These volatile compounds are metabolites that can be divided into two categories, primary and secondary metabolites [2]. Primary metabolites are essential for the growth, development, and reproduction of bacteria, while secondary metabolites are produced as part of a defense strategy against other bacteria or fungi, and they generally improve tolerance to environmental stresses. These metabolites can be ketones, aldehydes, alcohols, hydrocarbons, etc. [3,4,5,6]. Since different bacteria produce different metabolites, including volatiles, these metabolites may serve as biomarkers for species identification [7]. All volatile metabolites and other volatile organic and inorganic molecules that originate from an organism are included in its volatome [8,9]. Moreover, many these volatile compounds are differentially regulated by certain biochemical processes. These changes in the volatome have been used to study transcriptomes in mushrooms [10]. For instance, significantly altered volatile compounds were observed in mated and unmated strains of mushrooms, which correspond very well to the genomic and proteomic data [11]. These volatile compounds are difficult to analyze as they are released only for a certain period of time to execute a particular biological function. Furthermore, they are released in relatively low amounts complicating the detection of these compounds [12]. Traditionally, GC-MS is commonly used to identify volatile compounds but it possesses several challenges related to sample preparation, which hinder the in-depth coverage of volatiles [13]. On the other hand, membrane-inlet mass spectrometry (MIMS) is a low-impact mass spectrometric technique used for identifying gaseous and volatile organic compounds from solid, liquid, or gaseous samples [14].
MIMS was developed in the 1960s, and the basic principles of MIMS have been described previously [15,16]. Since its development, it has been associated with a wide range of uses for different purposes, such as the analysis of volatomes in soil and oceans, for monitoring in industrial purposes, and for forensic applications [17,18].
Now, the utility of MIMS is gaining even more prominence because it possesses several advantages compared to GC/MS [19], such as the ability to detect samples at low detection limits (lower ppb to ppt) with nearly no sample preparation, whereas in GC-MS, sample preparation is a crucial (and sometimes time-consuming and difficult) step before analysis [14]. In addition, MIMS is also a tool that allows for the rapid analysis of samples in real-time; thus, it has been widely used for the analysis of variety of chemical classes such as semi volatile compounds, organometallic compounds, free radicals, etc. [18]. Additionally, MIMS systems can be purchased at relatively economical prices as compared to LC/GC-MS instruments. Furthermore, the membranes used in MIMS are economical (costing less than 10 USD) and can be recycled for several years, which often is not the case with GC/LC columns (costing 300 USD minimum) [17,20,21]. Finally, the maintenance and running cost of MIMS is significantly lower compared to that of GC/LC-MS instruments.
Until now, MIMS has been used for the analysis of volatile organic metabolites produced by microorganisms [22] and the detection of metabolites secreted by genetically engineered bacteria [23]. MIMS is a well-established method for the mass spectrometric analysis of volatile organic metabolites produced by microorganisms [23], but its use in combination with advanced data treatment technologies has hitherto only been scarcely investigated.
In the present study, it was hypothesized that MIMS, as an analytical technique, would provide a faster and economical way to identify and distinguish bacteria in water. The presence of several pathogenic bacteria has been observed in the drinking water and has been discussed in the literature [24,25]. The aim was thus to investigate the volatomic profile of selected pathogenic bacteria, such as Gram-positive Staphylococcus epidermidis and Gram-negative Escherichia coli and Pseudomonas aeruginosa, as a model system and to explore the use of principal component analysis (PCA) for differentiating between the organisms. Furthermore, we also tested the capacity of MIMS to study a lab strain of E. coli expressing a functional recombinant protein and a lab strain of E. coli expressing a dysfunctional protein, thus establishing MIMS as an online process monitoring tool for recombinant protein production.

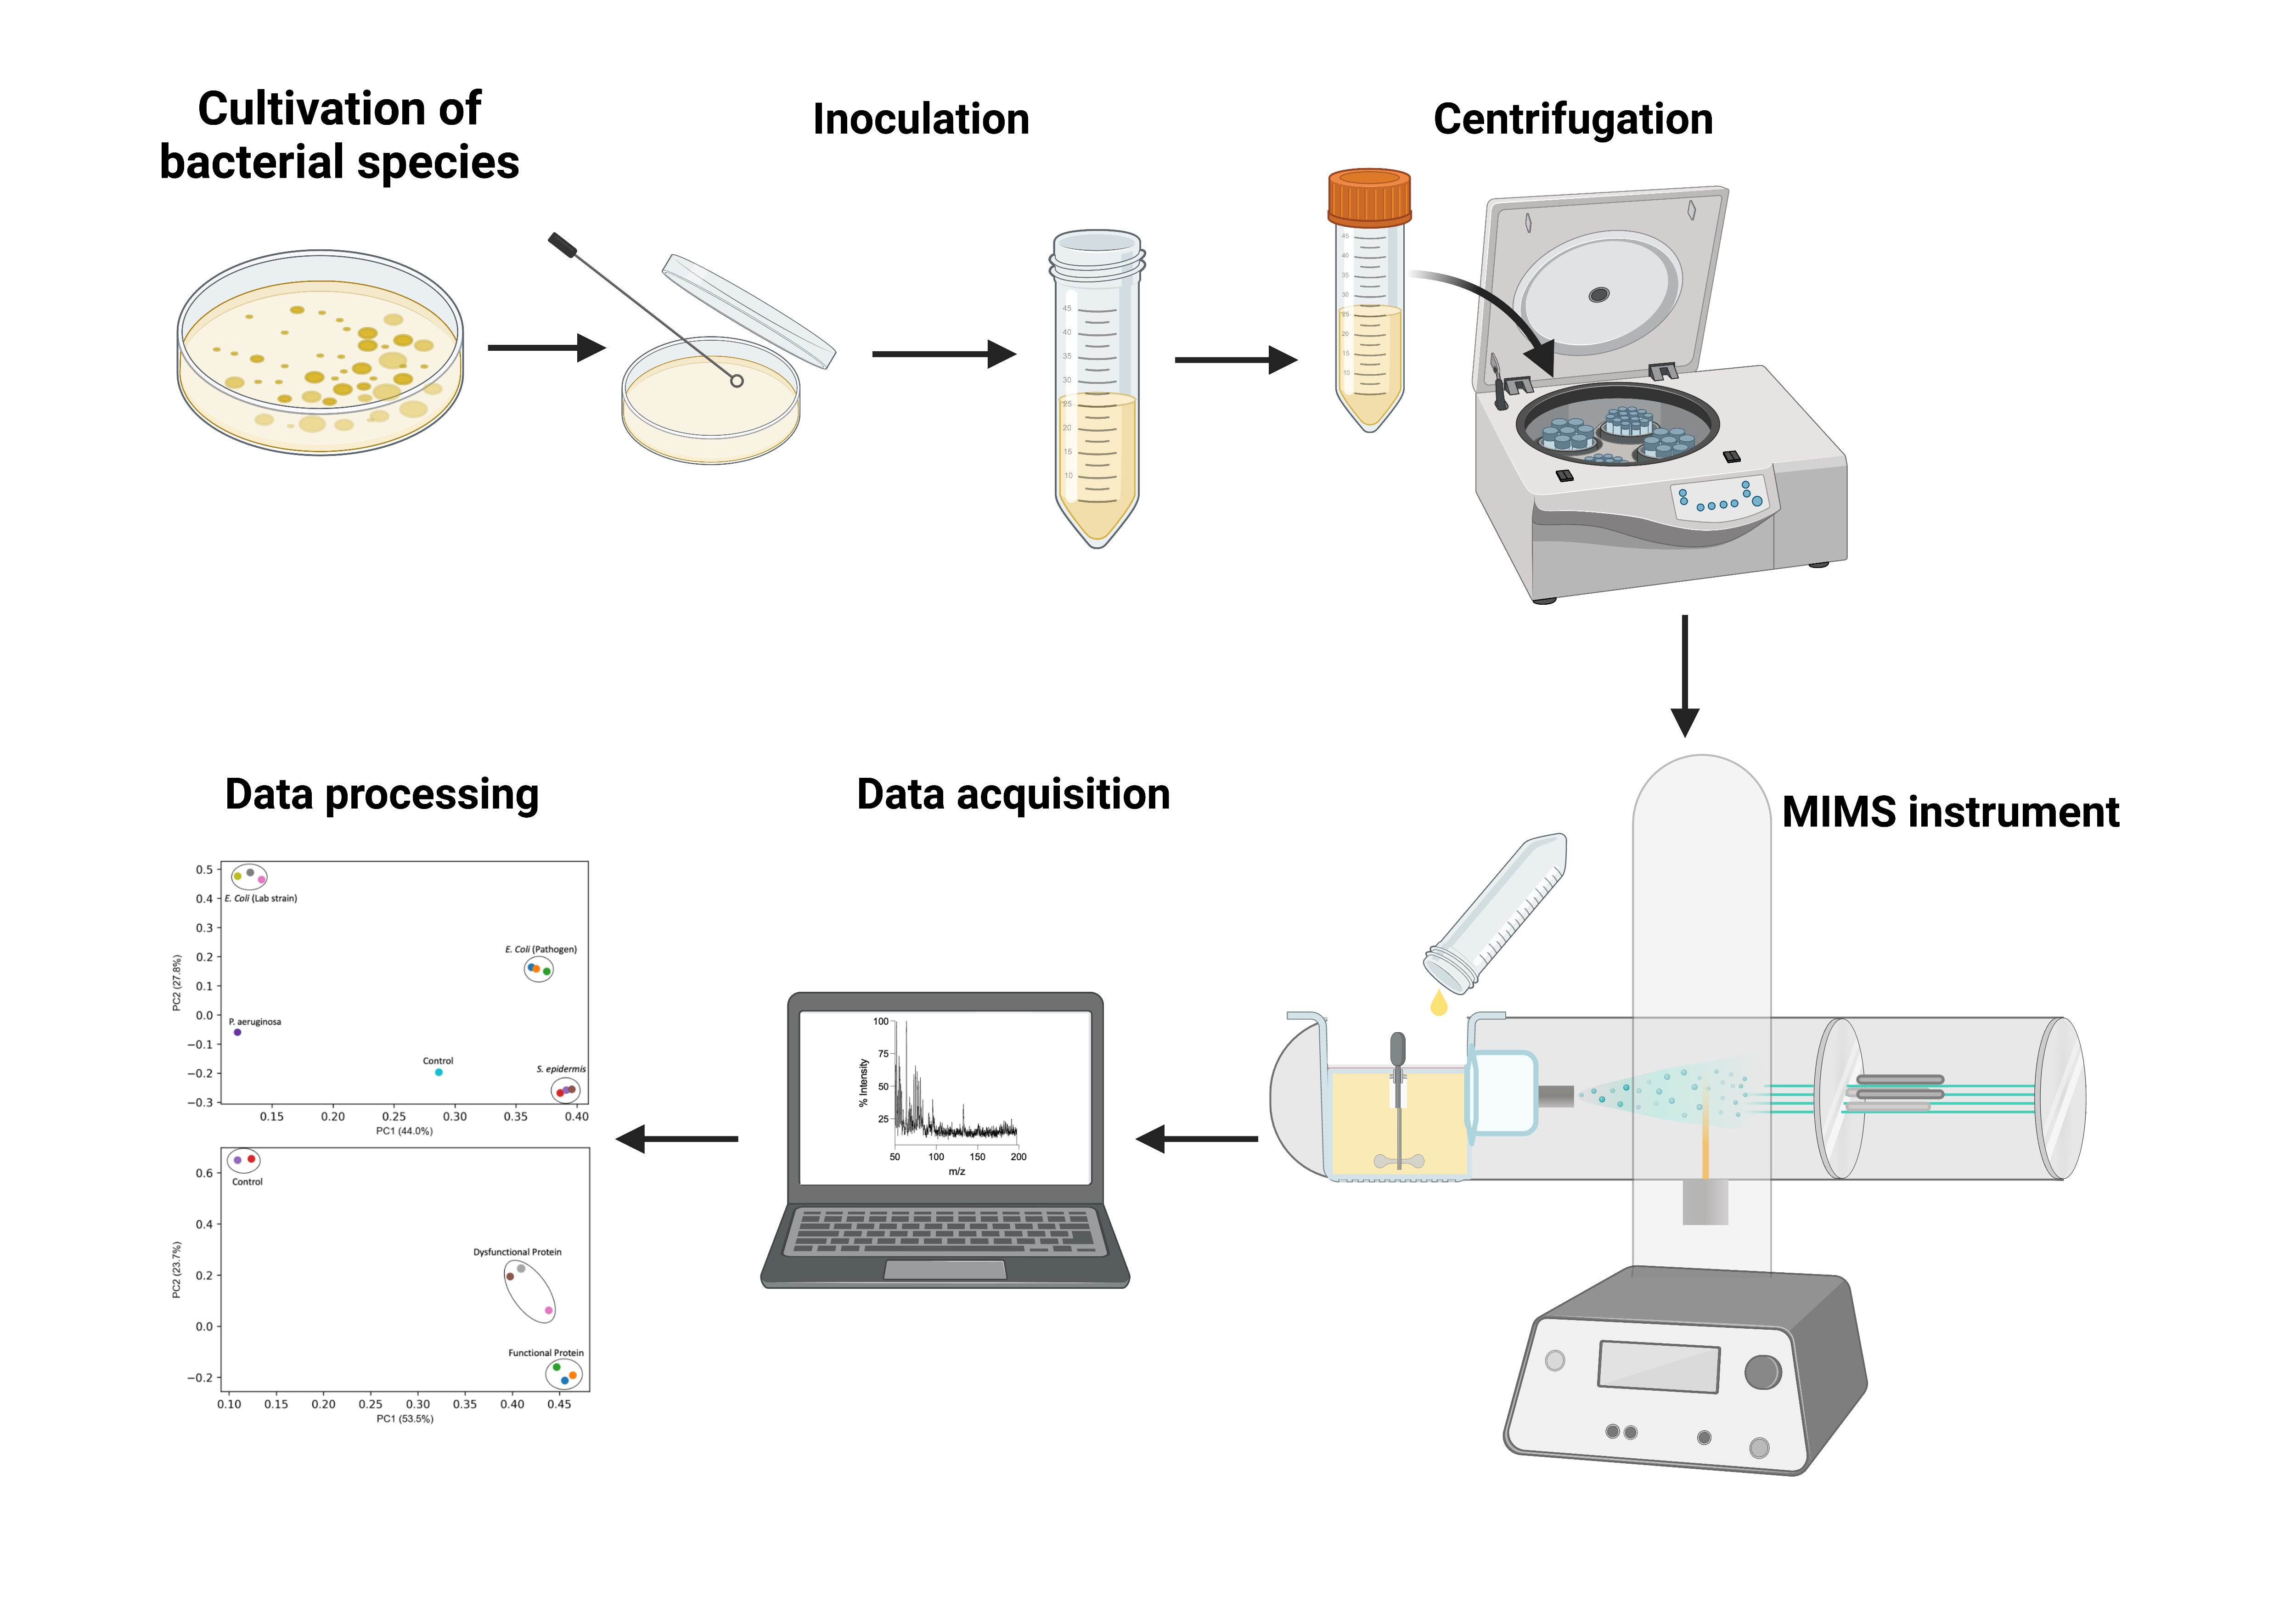
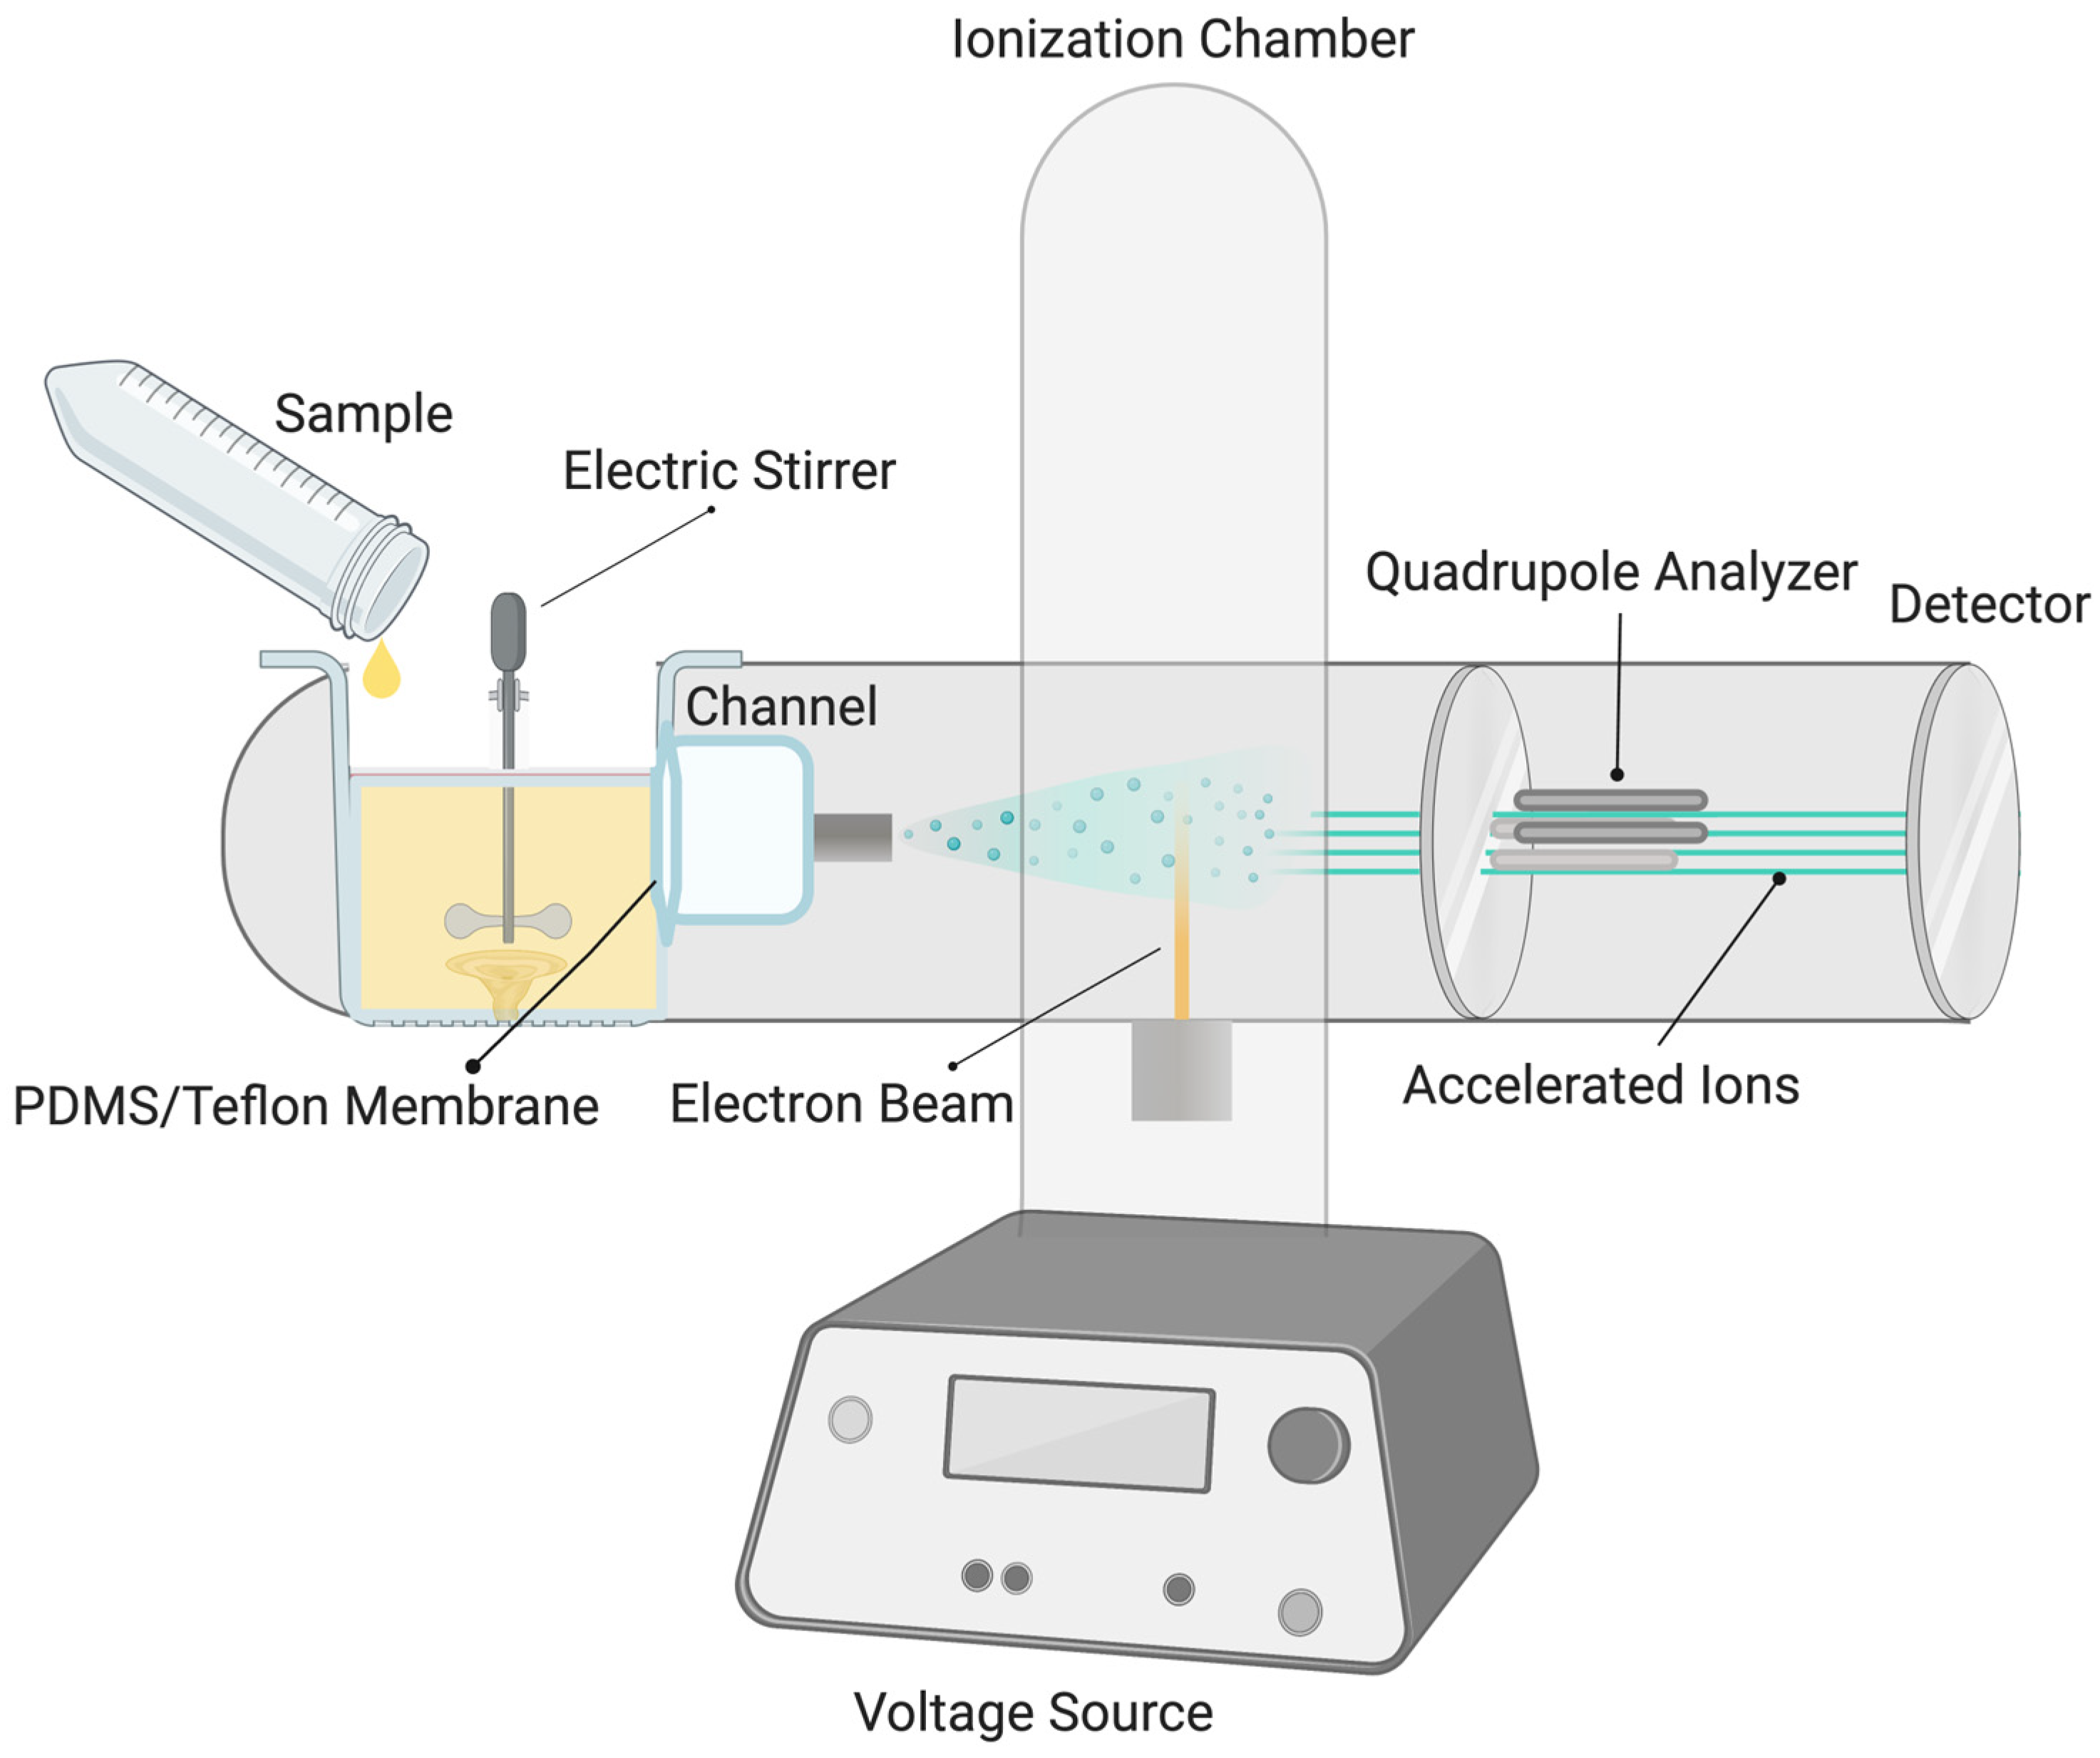
2. Materials and Methods

The overexpression of recombinant protein was performed as described previously [26]. Briefly, E. coli BL21(DE3)pLysS cells transformed with plasmids pTTQ18-ydgR (functional protein) and pTTQ18-ydgR mutant (E33Q; dysfunctional protein) were inoculated into 3 mL of lysogeny broth (LB) media containing 100 μg/mL ampicillin and 34 μg/mL chloramphenicol and allowed to grow overnight. The overnight cultures were transferred and diluted 1:50 in 25 mL of LB media with the same concentration of antibiotics. The cells were allowed to grow to an OD600 of 0.6 at 37 °C and 160 rpm before induction with 1 mM isopropyl-β-D-thiogalactoside (IPTG, inducing protein expression). After 3 h of incubation at 37 °C and 160 rpm, samples were centrifuged at 10,000 g for 5 min, and supernatant media were collected for testing.
The pathogenic bacterial strains of P. aeruginosa, S. epidermidis [27], and E. coli [28] were grown at 37 °C on LB agar plates overnight. A single colony of each bacterial strain from the plates was transferred to 25 mL of LB broth and was allowed to grow overnight at 37 °C with 160 rpm shaking. The cultures were centrifuged at 4700 g for 15 min and the supernatants were sterile-filtered with a 0.22 μm syringe filter. The filtered samples were stored at −80 °C until analysis.
The samples were recorded using MIMS, as previously reported [29]. The setup for MIMS can be seen in Figure 1. MIMS uses a thermoregulated sample cell, which holds a small aperture exposing the surface of the membrane, which is used as a barrier to separate the liquid phase and the ion source of the mass spectrometer. Gasses and volatile organic compounds evaporate from the liquid through the membrane into the vacuum of the mass spectrometer, where the molecules vaporize and get ionized using electron ionization. The ionized particles are then separated based on their mass-to-charge ratio (m/z) using a quadrupole mass spectrometer, and a 2D-chromatogram with m/z on the x-axis and relative abundance on the y-axis is produced.
Briefly, 20 mL of the LB media samples was poured into a thermoregulated (40 °C) sample cell equipped with an electric stirrer mounted on a Prisma QME200 single quadrupole mass spectrometer (Balzers, Liechtenstein). A 3 mm hole supported by a medical-grade polydimethylsiloxane (PDMS) membrane (125 μm; Sil-Tec Sheeting, USA) is present in the sample cell, allowing molecules (volatile and semi-volatile organic substances) to pass into the ion source. The sample cell was washed twice with water to avoid carryover after each sample. A background spectrum was collected before each sample. The spectra for each sample were recorded in 3 cycles, and the average of these cycles was used to generate the spectrum. The samples were recorded between m/z 50 and 300. The time taken to analyze each sample was approximately 20 min. MIMS data acquisition and data conversion were performed using the Prisma QME200 instrument package. The recorded data were exported to .asc format using the software dispsav and opened into a Microsoft Excel spreadsheet. The heatmaps were prepared using GraphPad Prism 9.0, plotted as an average of three replicates. The Excel files were processed using Python 3.7 (pycharm community edition) for generating principal component plots.

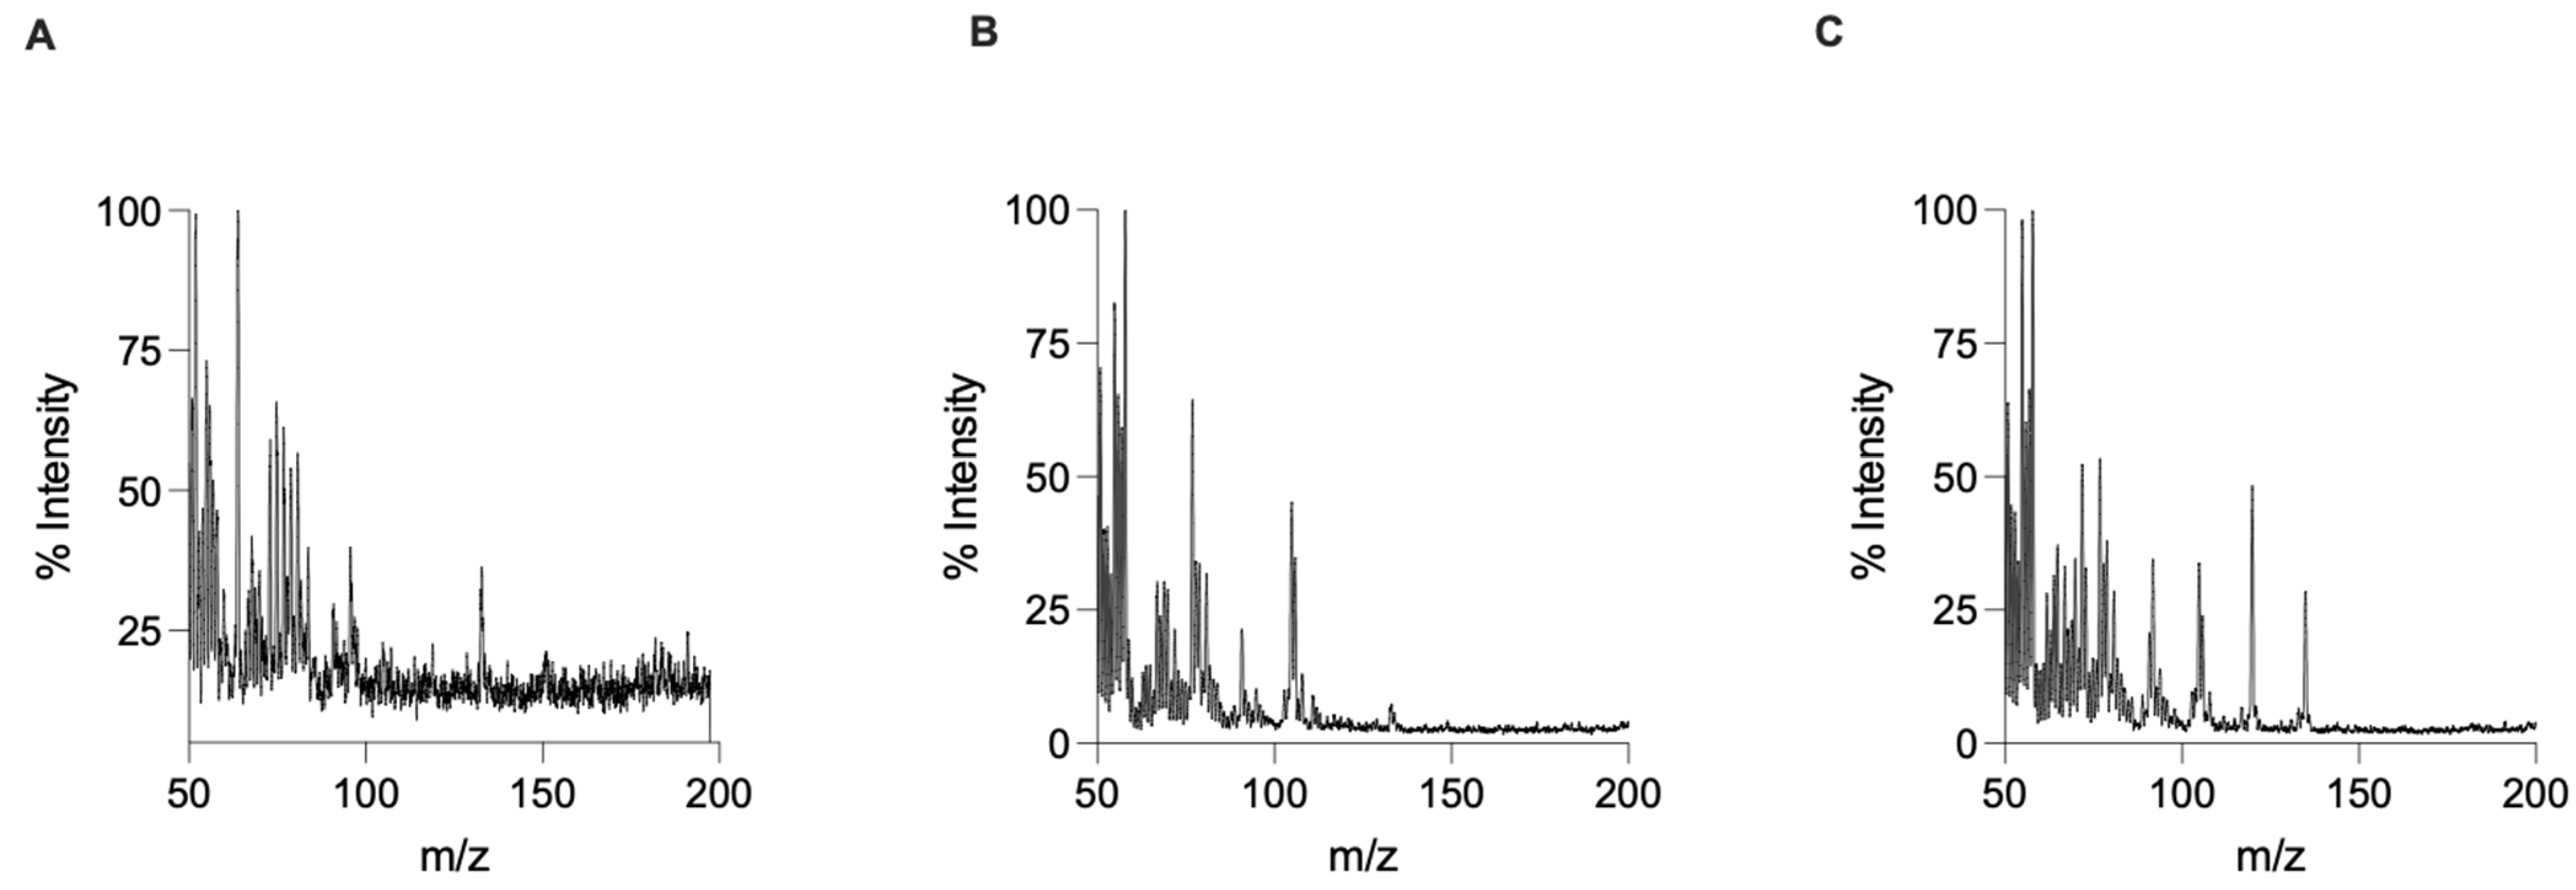
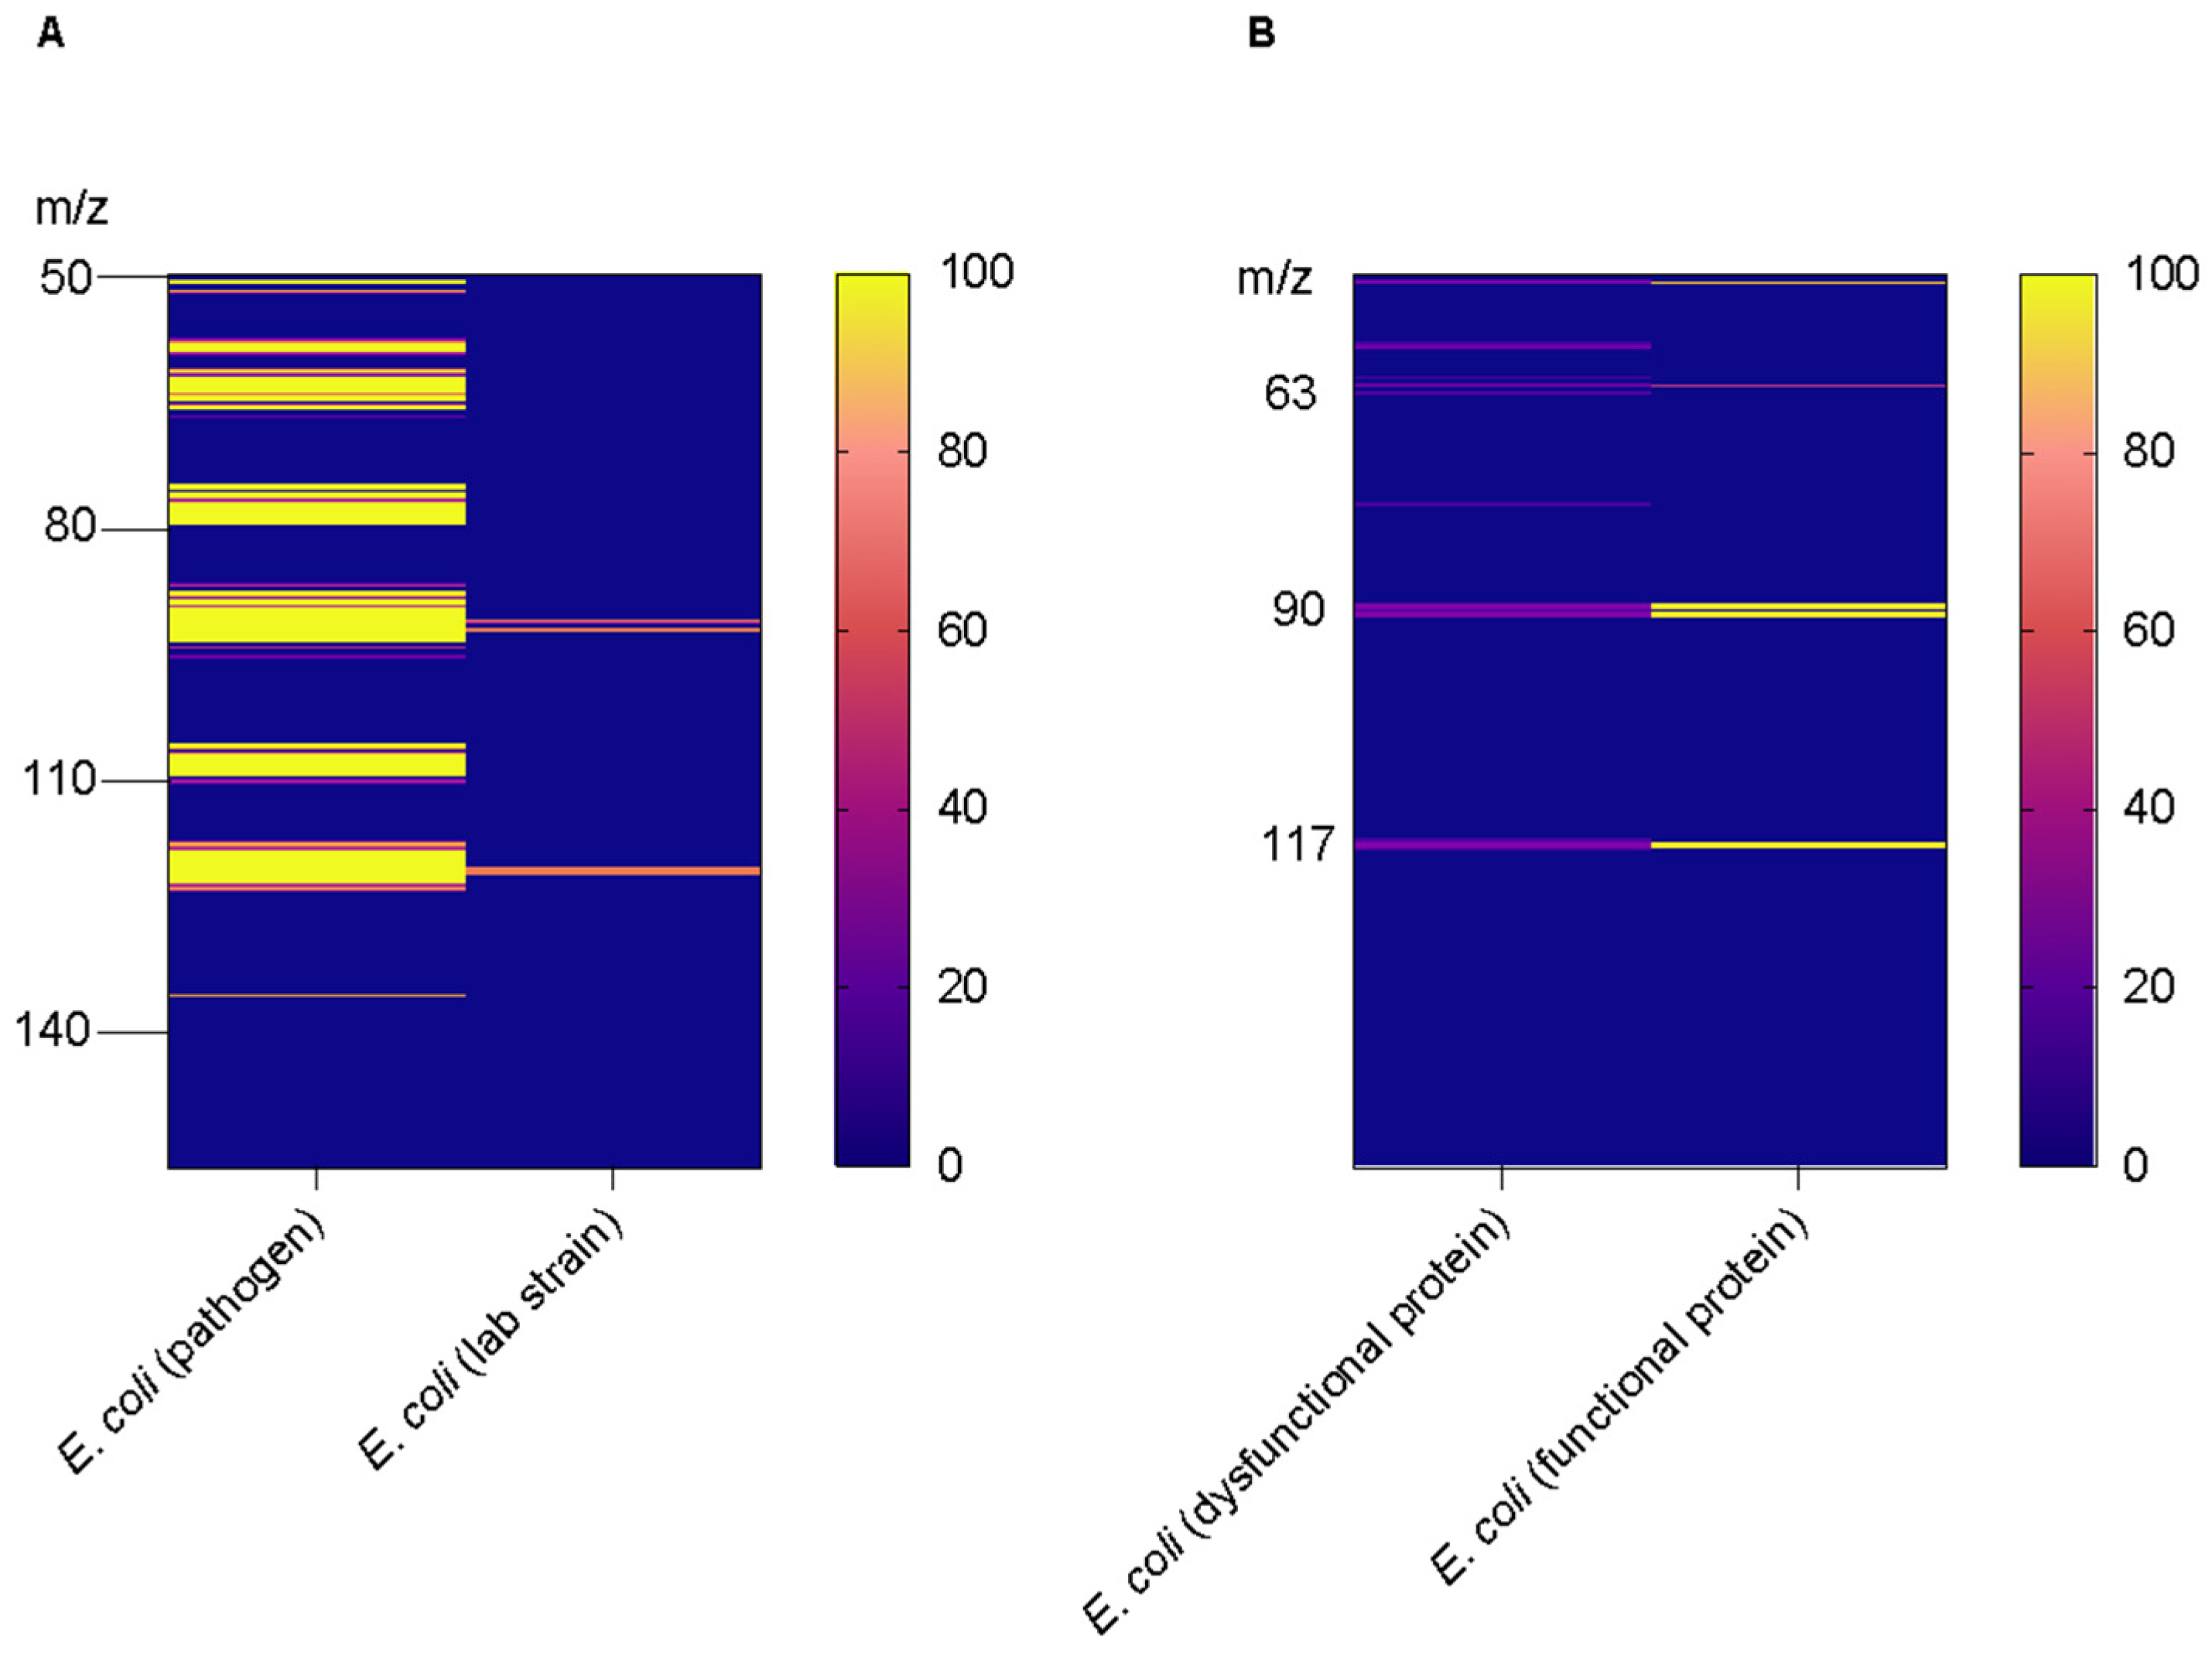
3. Results and Discussion

The MIMS spectra are shown between m/z 50 and 180 as the spectrum depicts signals corresponding to the local environment (e.g., water from media, argon/nitrogen, carbon dioxide etc.) below m/z 50 and there were no significant peaks above m/z 180 (Figure 2A–C).
All samples showed prominent peaks below m/z 150. The bacterial strains showed common fragmentation patterns, such as peaks at m/z 77 corresponding to phenyl fragments; this was expected as many common volatomes detected using GC-MS for bacteria include compounds with a benzene ring [30,31]. Another common fragmentation pattern seen for all strains was a peak at m/z 58 (acetone) and m/z 106 (benzaldehyde). This was also expected because these bacterial strains produce many ketones, carboxylic acids, and aldehydes as their metabolites [32,33]. Using PTR-MS (proton transfer reaction ionization mass spectrometry) [34,35] several volatile markers [indoles (m/z 117), butanol (m/z 57), acetone (m/z 59), and 2-methyl-1-butanol (m/z 89)] from E. coli growth culture have previously been detected. MIMS herein utilized electron ionization, and therefore, a direct comparison to the PTR-MS could not be performed. The data obtained from the MIMS have been depicted as heat maps as this gives an instant snapshot of the spectral differences between different samples at a glance. More details of the algorithms, codes, and advantages of presenting mass spectrometric data as heat maps have been discussed in detail elsewhere [36].
Relatively larger amounts of these commonly found volatile compounds are observed in pathogenic species of E. coli (Figure 3A) as compared to those in non-pathogenic species. Similarly, higher amounts of indole are present in cells expressing functional protein as compared to those in cells expressing dysfunctional protein (Figure 3B). These differences in the signals obtained from different compounds could be used as biomarkers either for virulence or a metabolic shift in cell systems as a function of protein functionality. Signals corresponding to indoles in bacterial cultures were previously observed using GC-MS [37,38] and MIMS [39]. This shows that MIMS can be a simpler and more economical alternative to GC/LC-MS techniques for biomonitoring. The selectivity of the MIMS can be further improved by utilizing MIMS/MS systems [39,40]. Further investigations will be directed towards identification of the possible volatile signatures, including their quantification, to be utilized as a marker for the detection of protein functionality.
It was then investigated if MIMS could differentiate between the bacterial strains based on principal component analysis (PCA) (Figure 4) [29]. PCA was performed using the obtained data. This is an analytical technique used for dimensional reduction and data visualization. The mean and standard deviation of the given features were calculated. The data were then scaled using the calculated mean and standard deviation. The data were then distributed normally such that the mean was zero and had unit standard deviation. The Python inbuilt functionalities of standard scaler and fit transform were used for data standardization. The plotted principal components showed similarity and differences between datasets or samples when grouped together in clusters or when separated apart. The data patterns were visualized by plotting the principal components on the orthogonal axes. PCA allows complex and high-dimensional datasets to be simplified into lower-dimensional data sets. This technique is useful because by lowering the complexity of the dataset, it is easier to visualize patterns, subsequently making data interpretation much easier [41,42]. The interpretation of PCA is that similar samples are closely clustered together, while dissimilar samples are farther from each other [41,42]. The PCA analysis showed that MIMS was able to differentiate between the bacterial strains (Figure 4). This is especially true for E. coli where all similar samples were clustered close to each other and were far from the other bacterial strains (Figure 4). The data from PCA also show that pathogenic S. epidermidis (Gram-positive) was very well separated from pathogenic E. coli (Gram-negative). Furthermore, the lab strain of E. coli was very well separated from the respective pathogenic strain further substantiating the capacity of MIMS to differentiate between pathogenic and non-pathogenic species.
To further explore the possibility of utilizing MIMS as a process monitoring tool in biotechnological production facilities, we tested MIMS on a lab strain of E. coli with one clone expressing a fully functional protein YdgR encoded by pTTQ18 and a subsequent clone carrying the same vector with a functionally inactive variant of YdgR (mutant). The protein of interest here is a membrane transport protein, which has been routinely utilized in our lab [43,44]. Overexpression of the membrane protein has an impact on cellular systems, significantly affecting the differential regulation of proteins, thus possibly altering the volatile components secreted. This has not been investigated well enough to the best of our knowledge and should be pursued in our future studies.
Based on the PCA plots, it was observed that MIMS was able to distinguish between cells expressing functional protein from the cells expressing a functionally inactive protein (Figure 5). YdgR loses its functionality when mutated at the residue glutamate 30 impairing proton coupling efficiency. This results in the complete loss of YdgR function and has been very well established previously [45].
Differentiating between control strains and strains expressing functionally active and/or functionally inactive proteins can have a marked impact within the biopharmaceutical industry. Specifically, the limitations in oxygen delivery and waste product accumulation, the need for more advanced process control, and the shear sensitivity of cells poses difficulties for the large-scale cultivation of recombinant proteins in cell cultures [46]. These difficulties could be mitigated by following up on the volatile markers of cells, and timely intervention could significantly impact the cell titer obtained from the cell factories. Sometimes cell factories can also get contaminated, and using MIMS as a process monitoring tool can shorten the troubleshooting times within biotechnological industries. The cellular systems need to be thoroughly investigated both qualitatively and quantitatively based on the secreted markers observed to develop algorithms enabling rapid analysis and identification of the problems.
The focus of the present study was to investigate the possibilities of using MIMS to detect pathogens for water analysis and as an online process monitoring tool. Previous studies have used other microbial indicators to detect the presence of pathogens in water, and based on the findings of this study, it is seen that MIMS can also be used as a microbial indicator [25]. Moreover, the fact that MIMS can separate pathogens from lab strains further substantiates the utility of MIMS for bioprocess monitoring. As of now, we have not focused on the features responsible for the differences in bacteria tested, and a detailed analysis will be presented in future studies. The present paper can be regarded as one of the initial steps toward implementing MIMS in bioprocess monitoring.
Herein, we have utilized only a small sample set with two lab strains and two pathogenic bacteria, but the ability of MIMS to separate the lab strains from the pathogens enhances its applicability in water treatment plants located outside research laboratories and pharmaceutical industries.

4. Conclusions

MIMS has previously been used to study volatomes of genetically engineered bacteria. In this study through the usage of MIMS, we were able to differentiate between the volatile profiles of pathogenic and non-pathogenic E. coli. Furthermore, we were able to differentiate between the volatile compounds secreted by two lab strains, where one overexpressed dysfunctional proteins and the other overexpressed a functional protein. Moreover, we also differentiated between the volatomes of Gram-positive and Gram-negative bacteria. Thus, MIMS was identified as a tool that provides a low-impact alternative to existing water monitoring systems and online process monitoring tools to detect the presence of pathogenic bacterial strains.

Author Contributions

Conceptualization, B.K.P., H.J., M.G.J. and F.R.L.; Methodology, S.S. and I.A.; Formal analysis, S.F.C.; Investigation, S.S. and I.A.; Resources, B.K.P., H.J., M.G.J. and F.R.L.; writing—original draft preparation, review and editing, S.S., I.A., S.F.C., H.J., M.G.J., F.R.L. and B.K.P. All authors have read and agreed to the published version of the manuscript.

Funding

This research received no external funding.

Data Availability Statement

The python codes can be made available upon reasonable request to the corresponding author.

Acknowledgments

We wish to acknowledge the Higher Education Commission (HEC), Pakistan, for supporting the salary of Salvia Sajid. Authors also wish to acknowledge Carsten Uhd Nielsen for fruitful discussions.

Conflicts of Interest

The authors declare no conflict of interest.

References

  1. Silhavy, T.J.; Kahne, D.; Walker, S. The Bacterial Cell Envelope. Cold Spring Harbor Persp. Biol. 2010, 2, a000414. [Google Scholar] [CrossRef] [PubMed]
  2. Erb, M.; Kliebenstein, D.J. Plant Secondary Metabolites as Defenses, Regulators, and Primary Metabolites: The Blurred Functional Trichotomy. Plant Physiol. 2020, 184, 39–52. [Google Scholar] [CrossRef] [PubMed]
  3. Umber, B.J.; Shin, H.-W.; Meinardi, S.; Leu, S.-Y.; Zaldivar, F.; Cooper, D.M.; Blake, D.R. Gas Signatures from Escherichia coli and Escherichia coli-Inoculated Human Whole Blood. Clin. Transl. Med. 2013, 2, 13. [Google Scholar] [CrossRef] [PubMed] [Green Version]
  4. Jenkins, C.L.; Bean, H.D. Dependence of the Staphylococcal Volatilome Composition on Microbial Nutrition. Metabolites 2020, 10, 347. [Google Scholar] [CrossRef] [PubMed]
  5. Vilaplana, L.; Marco, M.-P. Phenazines as Potential Biomarkers of Pseudomonas Aeruginosa Infections: Synthesis Regulation, Pathogenesis and Analytical Methods for Their Detection. Anal. Bioanal. Chem. 2020, 412, 5897–5912. [Google Scholar] [CrossRef]
  6. Fitzgerald, S.; Holland, L.; Morrin, A. An Investigation of Stability and Species and Strain-Level Specificity in Bacterial Volatilomes. Front. Microbiol. 2021, 12, 693075. [Google Scholar] [CrossRef]
  7. Nizio, K.D.; Perrault, K.A.; Troobnikoff, A.N.; Ueland, M.; Shoma, S.; Iredell, J.R.; Middleton, P.G.; Forbes, S.L. In Vitro Volatile Organic Compound Profiling Using GC× GC-TOFMS to Differentiate Bacteria Associated with Lung Infections: A Proof-of-Concept Study. J. Breath Res. 2016, 10, 026008. [Google Scholar] [CrossRef] [Green Version]
  8. Phillips, M.; Cataneo, R.N.; Chaturvedi, A.; Kaplan, P.D.; Libardoni, M.; Mundada, M.; Patel, U.; Zhang, X. Detection of an Extended Human Volatome with Comprehensive Two-Dimensional Gas Chromatography Time-of-Flight Mass Spectrometry. PLoS ONE 2013, 8, e75274. [Google Scholar] [CrossRef]
  9. Heddergott, C.; Calvo, A.M.; Latgé, J.P. The Volatome of Aspergillus Fumigatus. Eukaryot. Cell 2014, 13, 1014–1025. [Google Scholar] [CrossRef] [Green Version]
  10. Orban, A.; Weber, A.; Herzog, R.; Hennicke, F.; Rühl, M. Transcriptome of Different Fruiting Stages in the Cultivated Mushroom Cyclocybe Aegerita Suggests a Complex Regulation of Fruiting and Reveals Enzymes Putatively Involved in Fungal Oxylipin Biosynthesis. BMC Genom. 2021, 22, 324. [Google Scholar] [CrossRef]
  11. Freihorst, D.; Brunsch, M.; Wirth, S.; Krause, K.; Kniemeyer, O.; Linde, J.; Kunert, M.; Boland, W.; Kothe, E. Smelling the Difference: Transcriptome, Proteome and Volatilome Changes after Mating. Fungal Genet. Biol. 2018, 112, 2–11. [Google Scholar] [CrossRef] [PubMed]
  12. Boots, A.W.; Smolinska, A.; van Berkel, J.J.B.N.; Fijten, R.R.R.; Stobberingh, E.E.; Boumans, M.L.L.; Moonen, E.J.; Wouters, E.F.M.; Dallinga, J.W.; Van Schooten, F.J. Identification of Microorganisms Based on Headspace Analysis of Volatile Organic Compounds by Gas Chromatography–mass Spectrometry. J. Breath Res. 2014, 8, 027106. [Google Scholar] [CrossRef] [PubMed]
  13. Beale, D.J.; Pinu, F.R.; Kouremenos, K.A.; Poojary, M.M.; Narayana, V.K.; Boughton, B.A.; Kanojia, K.; Dayalan, S.; Jones, O.A.H.; Dias, D.A. Review of Recent Developments in GC-MS Approaches to Metabolomics-Based Research. Metabolomics 2018, 14, 152. [Google Scholar] [CrossRef] [PubMed]
  14. Nalbantoglu, S. Metabolomics: Basic Principles and Strategies. In Molecular Medicine; Nalbantoglu, S., Amri, H., Eds.; IntechOpen: London, UK, 2019. [Google Scholar] [CrossRef] [Green Version]
  15. Kotiaho, T.; Lauritsen, F.R.; Choudhury, T.K.; Cooks, R.G.; Tsao, G.T. Membrane Introduction Mass Spectrometry. Anal. Chem. 1991, 63, 875A–883A. [Google Scholar] [CrossRef]
  16. Kotiaho, T.; Lauritsen, F.R. Chapter 16 Membrane Inlet Mass Spectrometry. In Comprehensive Analytical Chemistry; Elsevier: Amsterdam, The Netherlands, 2002; Volume 37, pp. 531–557. [Google Scholar]
  17. Giannoukos, S.; Brkić, B.; Taylor, S.; France, N. Membrane Inlet Mass Spectrometry for Homeland Security and Forensic Applications. J. Am. Soc. Mass Spectrom. 2015, 26, 231–239. [Google Scholar] [CrossRef] [Green Version]
  18. Johnson, R.C.; Cooks, R.G.; Allen, T.M.; Cisper, M.E.; Hemberger, P.H. Membrane Introduction Mass Spectrometry: Trends and Applications. Mass Spectrom. Rev. 2000, 19, 1–37. [Google Scholar] [CrossRef]
  19. Kinani, S.; Richard, B.; Souissi, Y.; Bouchonnet, S. Analysis of Inorganic Chloramines in Water. Trends Anal. Chem. 2012, 33, 55–67. [Google Scholar] [CrossRef]
  20. Degn, H. Membrane Inlet Mass Spectrometry in Pure and Applied Microbiology. J. Microbiol. Methods 1992, 15, 185–197. [Google Scholar] [CrossRef]
  21. Burlacot, A.; Burlacot, F.; Li-Beisson, Y.; Peltier, G. Membrane Inlet Mass Spectrometry: A Powerful Tool for Algal Research. Front. Plant Sci. 2020, 11, 1302. [Google Scholar] [CrossRef]
  22. Douchi, D.; Liang, F.; Cano, M.; Xiong, W.; Wang, B.; Maness, P.-C.; Lindblad, P.; Yu, J. Membrane-Inlet Mass Spectrometry Enables a Quantitative Understanding of Inorganic Carbon Uptake Flux and Carbon Concentrating Mechanisms in Metabolically Engineered Cyanobacteria. Front. Microbiol. 2019, 10, 1356. [Google Scholar] [CrossRef]
  23. Lauritsen, F.R.; Lloyd, D. Direct Detection of Volatile Metabolites Produced by Microorganisms. In Mass Spectrometry for the Characterization of Microorganisms; ACS Symposium Series; American Chemical Society: New York, NY, USA, 1993; Volume 541, pp. 91–106. ISBN 9780841227378. [Google Scholar]
  24. Cabral, J.P.S. Water Microbiology. Bacterial Pathogens and Water. Int. J. Environ. Res. Public Health 2010, 7, 3657–3703. [Google Scholar] [CrossRef] [PubMed]
  25. Payment, P.; Locas, A. Pathogens in Water: Value and Limits of Correlation with Microbial Indicators. Ground Water 2011, 49, 4–11. [Google Scholar] [CrossRef] [PubMed]
  26. Jensen, J.M.; Ismat, F.; Szakonyi, G.; Rahman, M.; Mirza, O. Probing the Putative Active Site of YjdL: An Unusual Proton-Coupled Oligopeptide Transporter from E. Coli. PLoS ONE 2012, 7, e47780. [Google Scholar] [CrossRef] [PubMed] [Green Version]
  27. Saporito, P.; Vang Mouritzen, M.; Løbner-Olesen, A.; Jenssen, H. LL-37 Fragments Have Antimicrobial Activity against Staphylococcus epidermidis Biofilms and Wound Healing Potential in HaCaT Cell Line. J. Pept. Sci. 2018, 24, e3080. [Google Scholar] [CrossRef] [Green Version]
  28. Saporito, P.; Biljana, M.; Løbner Olesen, A.; Jenssen, H. Antibacterial Mechanisms of GN-2 Derived Peptides and Peptoids against Escherichia coli. Biopolymers 2019, 110, e23275. [Google Scholar] [CrossRef]
  29. Hughes, S.S.; Nielsen, M.M.K.; Jonsbo, R.V.; Nielsen, C.U.; Lauritsen, F.R.; Prabhala, B.K. BeerMIMS: Exploring the Use of Membrane-Inlet Mass Spectrometry (MIMS) Coupled to KNIME for the Characterization of Danish Beers. Eur. J. Mass Spectrom. 2021, 27, 266–271. [Google Scholar] [CrossRef]
  30. Fletcher, J.S.; Vickerman, J.C. Secondary Ion Mass Spectrometry: Characterizing Complex Samples in Two and Three Dimensions. Anal. Chem. 2013, 85, 610–639. [Google Scholar] [CrossRef]
  31. Smith, F.T.; DeRuiter, J.; Abdel-Hay, K.; Randall Clark, C. GC–MS and FTIR Evaluation of the Six Benzoyl-Substituted-1-Pentylindoles: Isomeric Synthetic Cannabinoids. Talanta 2014, 129, 171–182. [Google Scholar] [CrossRef]
  32. Morris, H.R.; Taylor, G.W.; Masento, M.S.; Jermyn, K.A.; Kay, R.R. Chemical Structure of the Morphogen Differentiation Inducing Factor from Dictyostelium Discoideum. Nature 1987, 328, 811–814. [Google Scholar] [CrossRef]
  33. Dickschat, J.S. Capturing Volatile Natural Products by Mass Spectrometry. Nat. Prod. Rep. 2014, 31, 838–861. [Google Scholar] [CrossRef]
  34. Bunge, M.; Araghipour, N.; Mikoviny, T.; Dunkl, J.; Schnitzhofer, R.; Hansel, A.; Schinner, F.; Wisthaler, A.; Margesin, R.; Märk, T.D. On-Line Monitoring of Microbial Volatile Metabolites by Proton Transfer Reaction-Mass Spectrometry. Appl. Environ. Microbiol. 2008, 74, 2179–2186. [Google Scholar] [CrossRef] [PubMed] [Green Version]
  35. Rosenthal, K.; Hunsicker, E.; Ratcliffe, E.; Lindley, M.R.; Leonard, J.; Hitchens, J.R.; Turner, M.A. Volatile Atmospheric Pressure Chemical Ionisation Mass Spectrometry Headspace Analysis of E. coli and S. aureus. Anal. Methods 2021, 13, 5441–5449. [Google Scholar] [CrossRef] [PubMed]
  36. Key, M. A Tutorial in Displaying Mass Spectrometry-Based Proteomic Data Using Heat Maps. BMC Bioinform. 2012, 13 (Suppl. S16), S10. [Google Scholar] [CrossRef] [PubMed] [Green Version]
  37. Arora, P.K.; Bae, H. Identification of New Metabolites of Bacterial Transformation of Indole by Gas Chromatography-Mass Spectrometry and High Performance Liquid Chromatography. Int. J. Anal. Chem. 2014, 2014, 239641. [Google Scholar] [CrossRef]
  38. Ratiu, I.-A.; Ligor, T.; Bocos-Bintintan, V.; Al-Suod, H.; Kowalkowski, T.; Rafińska, K.; Buszewski, B. The Effect of Growth Medium on an Escherichia Coli Pathway Mirrored into GC/MS Profiles. J. Breath Res. 2017, 11, 036012. [Google Scholar] [CrossRef] [PubMed]
  39. Lloyd, D.; Lauritsen, F.R.; Degn, H. The Parasitic Flagellates Trichomonas Vaginalis and Tritrichomonas Foetus Produce Indole and Dimethyl Disulphide: Direct Characterization by Membrane Inlet Tandem Mass Spectrometry. J. Gen. Microbiol. 1991, 137, 1743–1747. [Google Scholar] [CrossRef] [Green Version]
  40. Etzkorn, J.M.; Davey, N.G.; Thompson, A.J.; Creba, A.S.; Leblanc, C.W.; Simpson, C.D.; Krogh, E.T.; Gill, C.G. The Use of MIMS-MS-MS in Field Locations as an on-Line Quantitative Environmental Monitoring Technique for Trace Contaminants in Air and Water. J. Chromatogr. Sci. 2009, 47, 57–66. [Google Scholar] [CrossRef]
  41. Ma, Y.; Zhu, L. A Review on Dimension Reduction. Int. Stat. Rev. 2013, 81, 134–150. [Google Scholar] [CrossRef] [Green Version]
  42. Simmons, S.; Peng, J.; Bienkowska, J.; Berger, B. Discovering What Dimensionality Reduction Really Tells Us About RNA-Seq Data. J. Comput. Biol. 2015, 22, 715–728. [Google Scholar] [CrossRef]
  43. Harder, D.; Stolz, J.; Casagrande, F.; Obrdlik, P.; Weitz, D.; Fotiadis, D.; Daniel, H. DtpB (YhiP) and DtpA (TppB, YdgR) Are Prototypical Proton-Dependent Peptide Transporters of Escherichia coli. FEBS J. 2008, 275, 3290–3298. [Google Scholar] [CrossRef]
  44. Prabhala, B.K.; Aduri, N.G.; Iqbal, M.; Rahman, M.; Gajhede, M.; Hansen, P.R.; Mirza, O. Several hPepT1-transported Drugs Are Substrates of the Escherichia coli Proton-Coupled Oligopeptide Transporter YdgR. Res. Microbiol. 2017, 168, 443–449. [Google Scholar] [CrossRef] [PubMed]
  45. Jensen, J.M.; Ernst, H.A.; Wang, X.; Hald, H.; Ditta, A.C.; Ismat, F.; Rahman, M.; Mirza, O. Functional Investigation of Conserved Membrane-Embedded Glutamate Residues in the Proton-Coupled Peptide Transporter YjdL. Protein Pept. Lett. 2012, 19, 282–287. [Google Scholar] [CrossRef] [PubMed]
  46. Chu, L.; Robinson, D.K. Industrial Choices for Protein Production by Large-Scale Cell Culture. Curr. Opin. Biotechnol. 2001, 12, 180–187. [Google Scholar] [CrossRef] [PubMed]
Figure 1. Schematic representation of Membrane-Inlet Mass Spectrometry (MIMS) (Created in BioRender.com (accessed on 22 December 2022)).
Water 15 00184 g001
Figure 2. Representative mass spectra of (A) control (LB media), (B) S. epidermidis, and (C) P. aeruginosa from undiluted overnight cultures.
Water 15 00184 g002
Figure 3. (A) Representative heatmap of undiluted overnight cultures from E. coli pathogenic and lab strains (n = 4). (B) Optical density-adjusted cultures harvested 3 h after induction with IPTG (n = 3).
Water 15 00184 g003
Figure 4. Representative PCA plot illustrating the ability of MIMS to separate the volatile profiles of different bacterial strains and the uninoculated media (control).
Water 15 00184 g004
Figure 5. A representative PCA plot illustrating the ability of MIMS to distinguish between the volatile profiles of uninoculated media, i.e., control and growth media with cells expressing the functional YdgR and cells expressing the dysfunctional protein (YdgR mutant).
Water 15 00184 g005
Disclaimer/Publisher’s Note: The statements, opinions and data contained in all publications are solely those of the individual author(s) and contributor(s) and not of MDPI and/or the editor(s). MDPI and/or the editor(s) disclaim responsibility for any injury to people or property resulting from any ideas, methods, instructions or products referred to in the content.

