3.1. Hydro Chemical Characteristics of Surface Water
The findings of the statistical summaries of the physicochemical and biological properties of the investigated surface water samples indicate a wide variation in the different individual parameters listed in
Table 4. The surface water temperatures ranged from 17.7 to 24.8 °C, with an average temperature of 20.78 °C (
Figure 3). Most of the samples in the study area showed almost neutral to alkaline properties, with a pH ranging from 7.2 to 8.4, lower than the maximum value recommended by [
60]. In general, the high pH values were due to the natural existence of carbonates and bicarbonates [
68]. The EC value ranges between 301 and 524 µs/cm, with a mean value of 435 µS/cm. EC values of surface water were below the WHO limit of 1000 µs/cm (
Figure 3). The TDS ranged from 180.6 to 314.4 mg/L (
Table 4), and all samples were below the maximum permissible amount recommended by WHO (2017). All samples showed values above the WHO threshold for DO, set at 2 mg/L, indicating a higher degree of oxygenation in surface waters. The DO concentration varied from 6.83 to 10.22 mg/L (
Table 4). The BOD
5 levels were higher than the 3 mg/L standard set by the WHO, ranging from 4.02 to 14.94 mg/L. The concentrations of COD vary from 31.31 to 59.81 mg/L, with the highest values observed at sites QZ12 and QZ13 (
Table 4). The samples’ turbidity readings vary from 0.12 to 9.33 NTU, and exceed the WHO’s threshold is set at 5 NTU in some locations [
60]. The results indicate that, in comparison to the river downstream, the upper portion of the river is narrower and has a faster flow. The turbidity levels exceeded the range prescribed by WHO at three locations QZ10, QZ12, and QZ13.
At locations QZ10, QZ12, and QZ13, he forms of nitrogen, such as NO
2− and NH
4+, exhibited significantly too low concentrations, with an average concentration of 0.03 mg/L and 0.68 mg/L, respectively, which were below the levels of 3 and 35 mg/L suggested by WHO for drinking water [
60]. NO
3− can originate from domestic wastewater, agricultural effluents such as fertilizers, and soil erosion [
69]. Only two samples, QZ12 (12.42 mg/L) and QZ13 (19.9 mg/L) (
Table 4), showed significant amounts but were still less than the 50 mg/L limit established by the (WHO, 2017) [
60]. Similarly, fluoride (F
−) levels at 13 locations range between 0.21 and 1.01 mg/L (
Figure 3), which fall within the acceptable range of 1.5 mg/L. Geogenic sources such as apatite, clay, and biotite, as well as extended interaction with the aquifer in an alkaline environment, are major contributors to the higher fluoride content in this area [
70]. Water contamination by fluoride could cause diseases such as infant methemoglobin, thyroid disease, neural tube defects, abdominal pain, diarrhea, vomiting, hypertension, gastric cancer in adults, and infant blue baby syndrome if their concentrations exceed the allowable limits [
71].
The concentrations of Ca
2+ and Mg
2+ ranged from 41.6 to 73.4 mg/L and 24.96 to 48.24 mg/L, respectively, with the highest values recorded at QZ11, QZ13, and QZ10 (
Table 4). None of the samples surpassed the drinking water standard limit of Ca
2+ and Mg
2+ set at 75 and 50 mg/L [
60], respectively. Disorders including Alzheimer’s, diabetes, and cardiovascular diseases could be generated by high water hardness (over 300 mg/L) [
72]. Calcium and magnesium are formed via the dissolution of carbonate minerals and ferromagnesian minerals in igneous and metamorphic rocks, and magnesium carbonate (dolomite) in sedimentary rocks [
73].
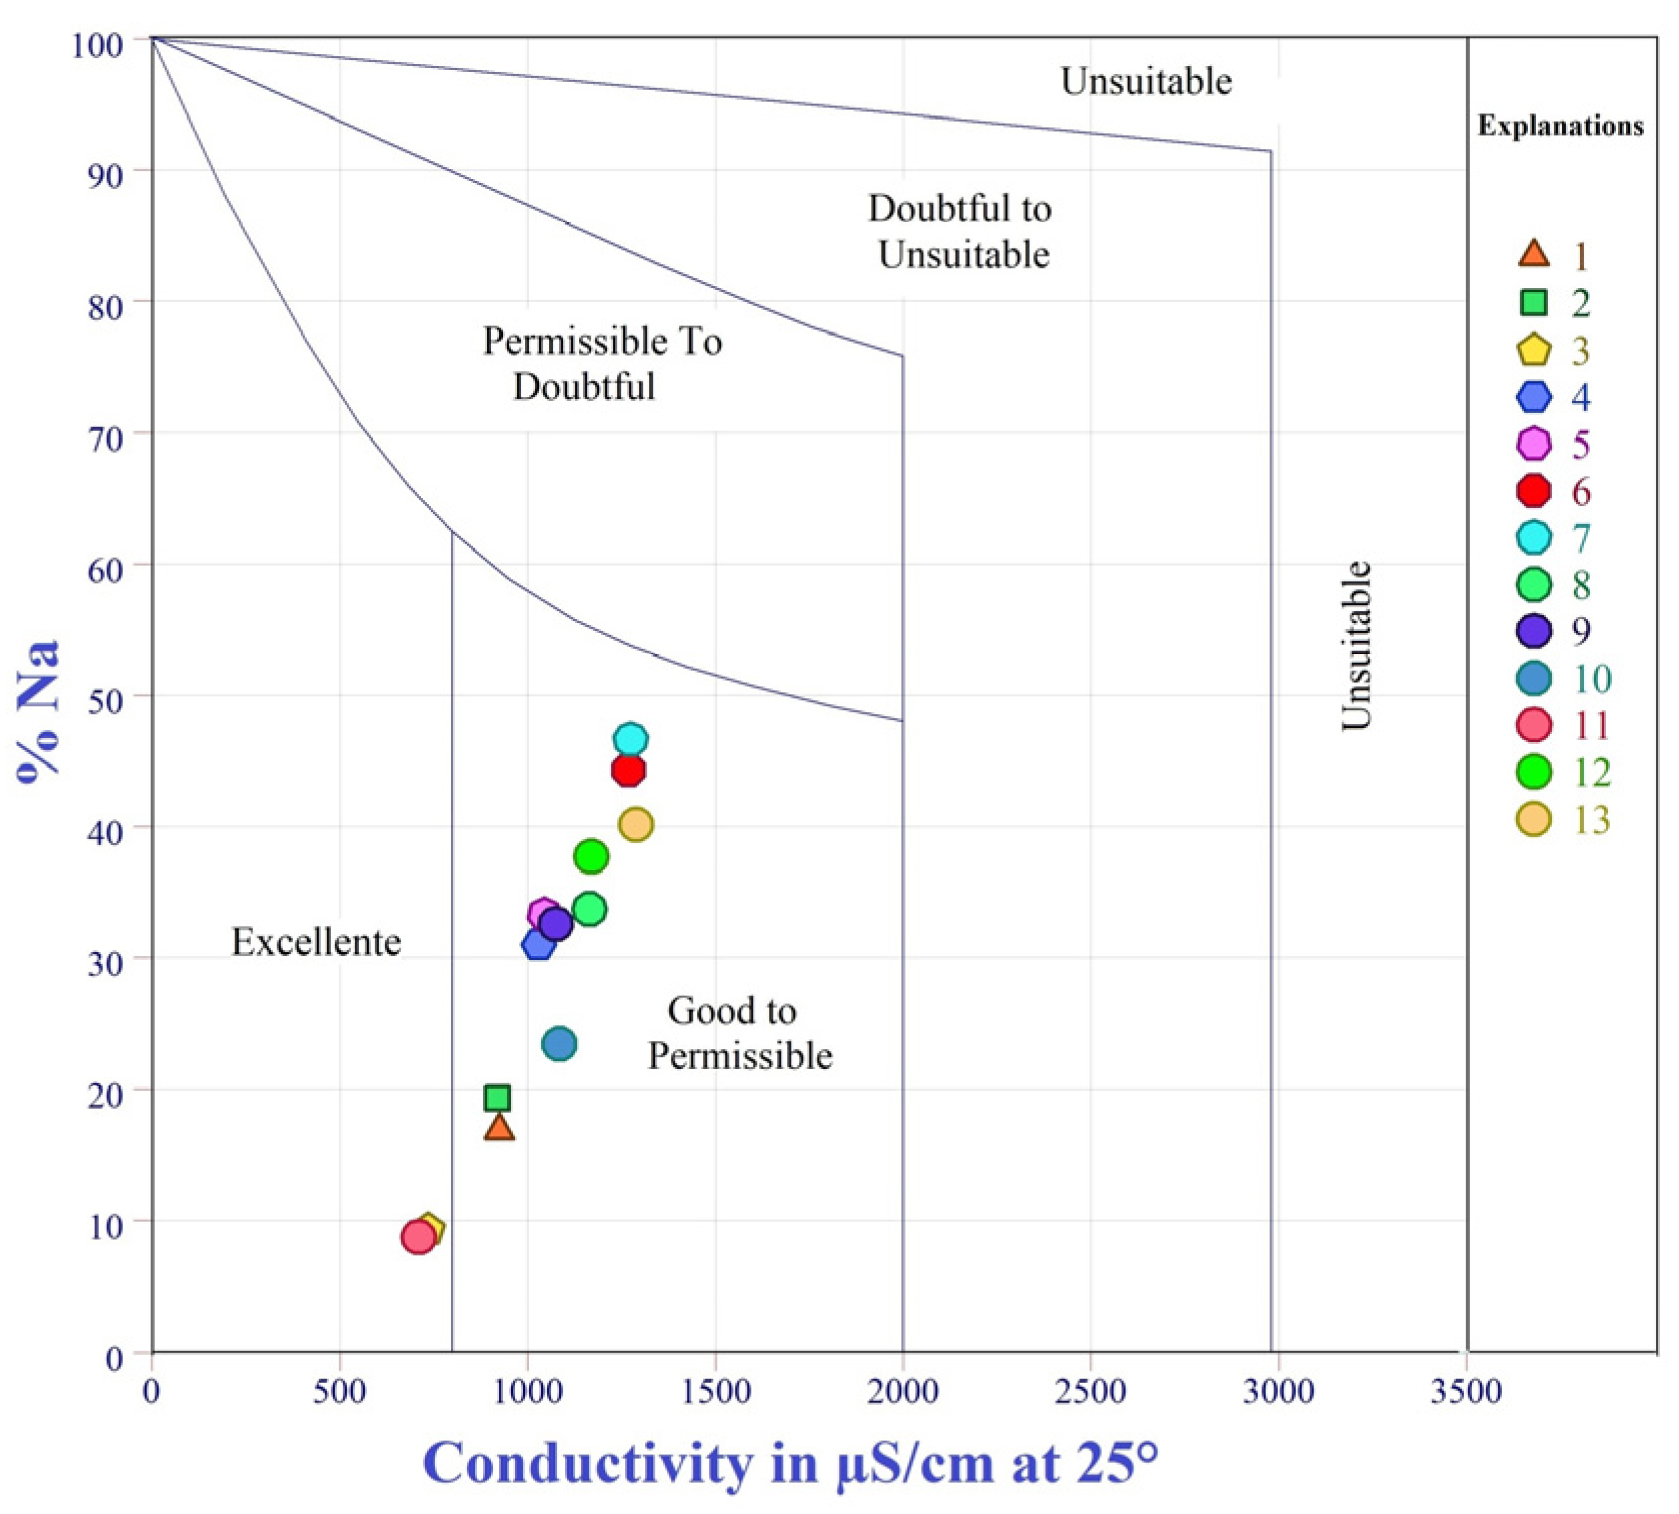
The concentrations of sodium and potassium were below the maximum allowable value of portability suggested by the WHO (2017), noting that the concentration of Na
+ and K
+ varies respectively between 8.45 and 92.87 mg/L and between 0.34 and 5.23 mg/L, the maximum values of Na
+ and K
+ recorded respectively in stations QZ6 and QZ13 (
Figure 3). The alteration of silicate minerals is the main source of concentrations of Na
+ and K
+ [
74]. These ions are not harmful at normal levels, but when they exceed the allowed limits, they can harm human health, such as hypertension, heart disease, or kidney problems.
The proportions of bicarbonate (HCO
3−) and carbonate (CO
32−) control alkalinity in water. Alkalinity uptake in the samples was below 200 mg/L, the levels allowed by WHO 2017. Furthermore, CO
32− and HCO
3− concentrations ranged from 145 to 195 mg/L and 286.7 to 396.5 mg/L, respectively, with a notable maximum value in QZ7 (
Table 4). The main causes of carbonate alteration are changes in calcite and dolomite rocks [
75].
In QZ7, QZ6, QZ8, and QZ13, chloride levels ranged from 24 to 136 mg/L, which is lower than the 250 mg/L drinking water standard. Phosphate is a necessary nutrient for plant growth. Except for QZ13, all surface water samples had low phosphate PO
43− concentrations. QZ10 and QZ12 showed maximum values, ranging from 1.2, 1.15, and 0.94 mg/L, respectively, and did not exceed the standard value of 5 mg/L. The bacterial contamination indicators, such as coliforms, are one of the most crucial characteristics for assessing the water quality since they provide insight into the presence of fecal and, consequently, the possibility for pathogen contamination [
76]. According to the data, a station close to QZ12 and QZ13 recorded high amounts of fecal coliform, measuring 276 and 227 CFU/100 mL, respectively (
Table 4). These levels were not in compliance with the WHO standard. The other stations have shown low fecal coliform contamination of surface water, which could be attributed to animal or human feces and can induce gastroenteritis in patients. To be declared drinkable, no pathogens should be present per 100 mL of drinking water [
77]. While total coliform (TC) concentrations were high at stations QZ5 and QZ10 (
Table 4), the significant prevalence of total coliforms in the waterways indicates that the pollution is due to residential sewage (feces) [
78]. Human activity and area geology are two major elements of river hydrology and water quality in general [
75].
The variability of the data assessment was used to analyze the principal ions in the surface water samples. The concentrations of the sample’s principal cations were sorted in the following order based on the analytical data: Ca2+ > Na+ > Mg2+ > K+ > NH4+. The higher Ca2+ concentrations indicate the presence of large amounts of limestone and other dissolved substances. While the relatively higher concentration of Na+ and K+ in the upper part of the Oued Laou valley could be related to chemical fertilizers or other anthropogenic activities.
HCO
3− > CO
32− > Cl
− > SO
42− > NO
3− > F
− > PO
43− > NO
2− are the primary anions found in surface water samples, as shown in
Figure 3, which depicts a change in the concentrations of Cl
−, SO
42−, HCO
3−, and NO
3−. The research area’s increase in Cl
− levels can be attributed to Pliocene sediments. SO
42− levels may rise due to the depletion of sulfate minerals (such as gypsum), fertilizer inputs, and municipal waste.
HCO3− is formed when carbonic acid dissolves carbonate minerals and silicate minerals in the exploration area. However, some sample sites have detected changes in the order of the ions “SO42− > HCO3− > CO32− > Cl−”, especially in the samples QZ13, QZ12, and QZ10. At sites QZ11, QZ13, QZ5, and QZ4, the cation order is Ca2+, Na+, Mg2+, and K+. In general, the content of major ions changed in response to water-rock interaction. However, at some sites, anthropogenic pollutants predominate.
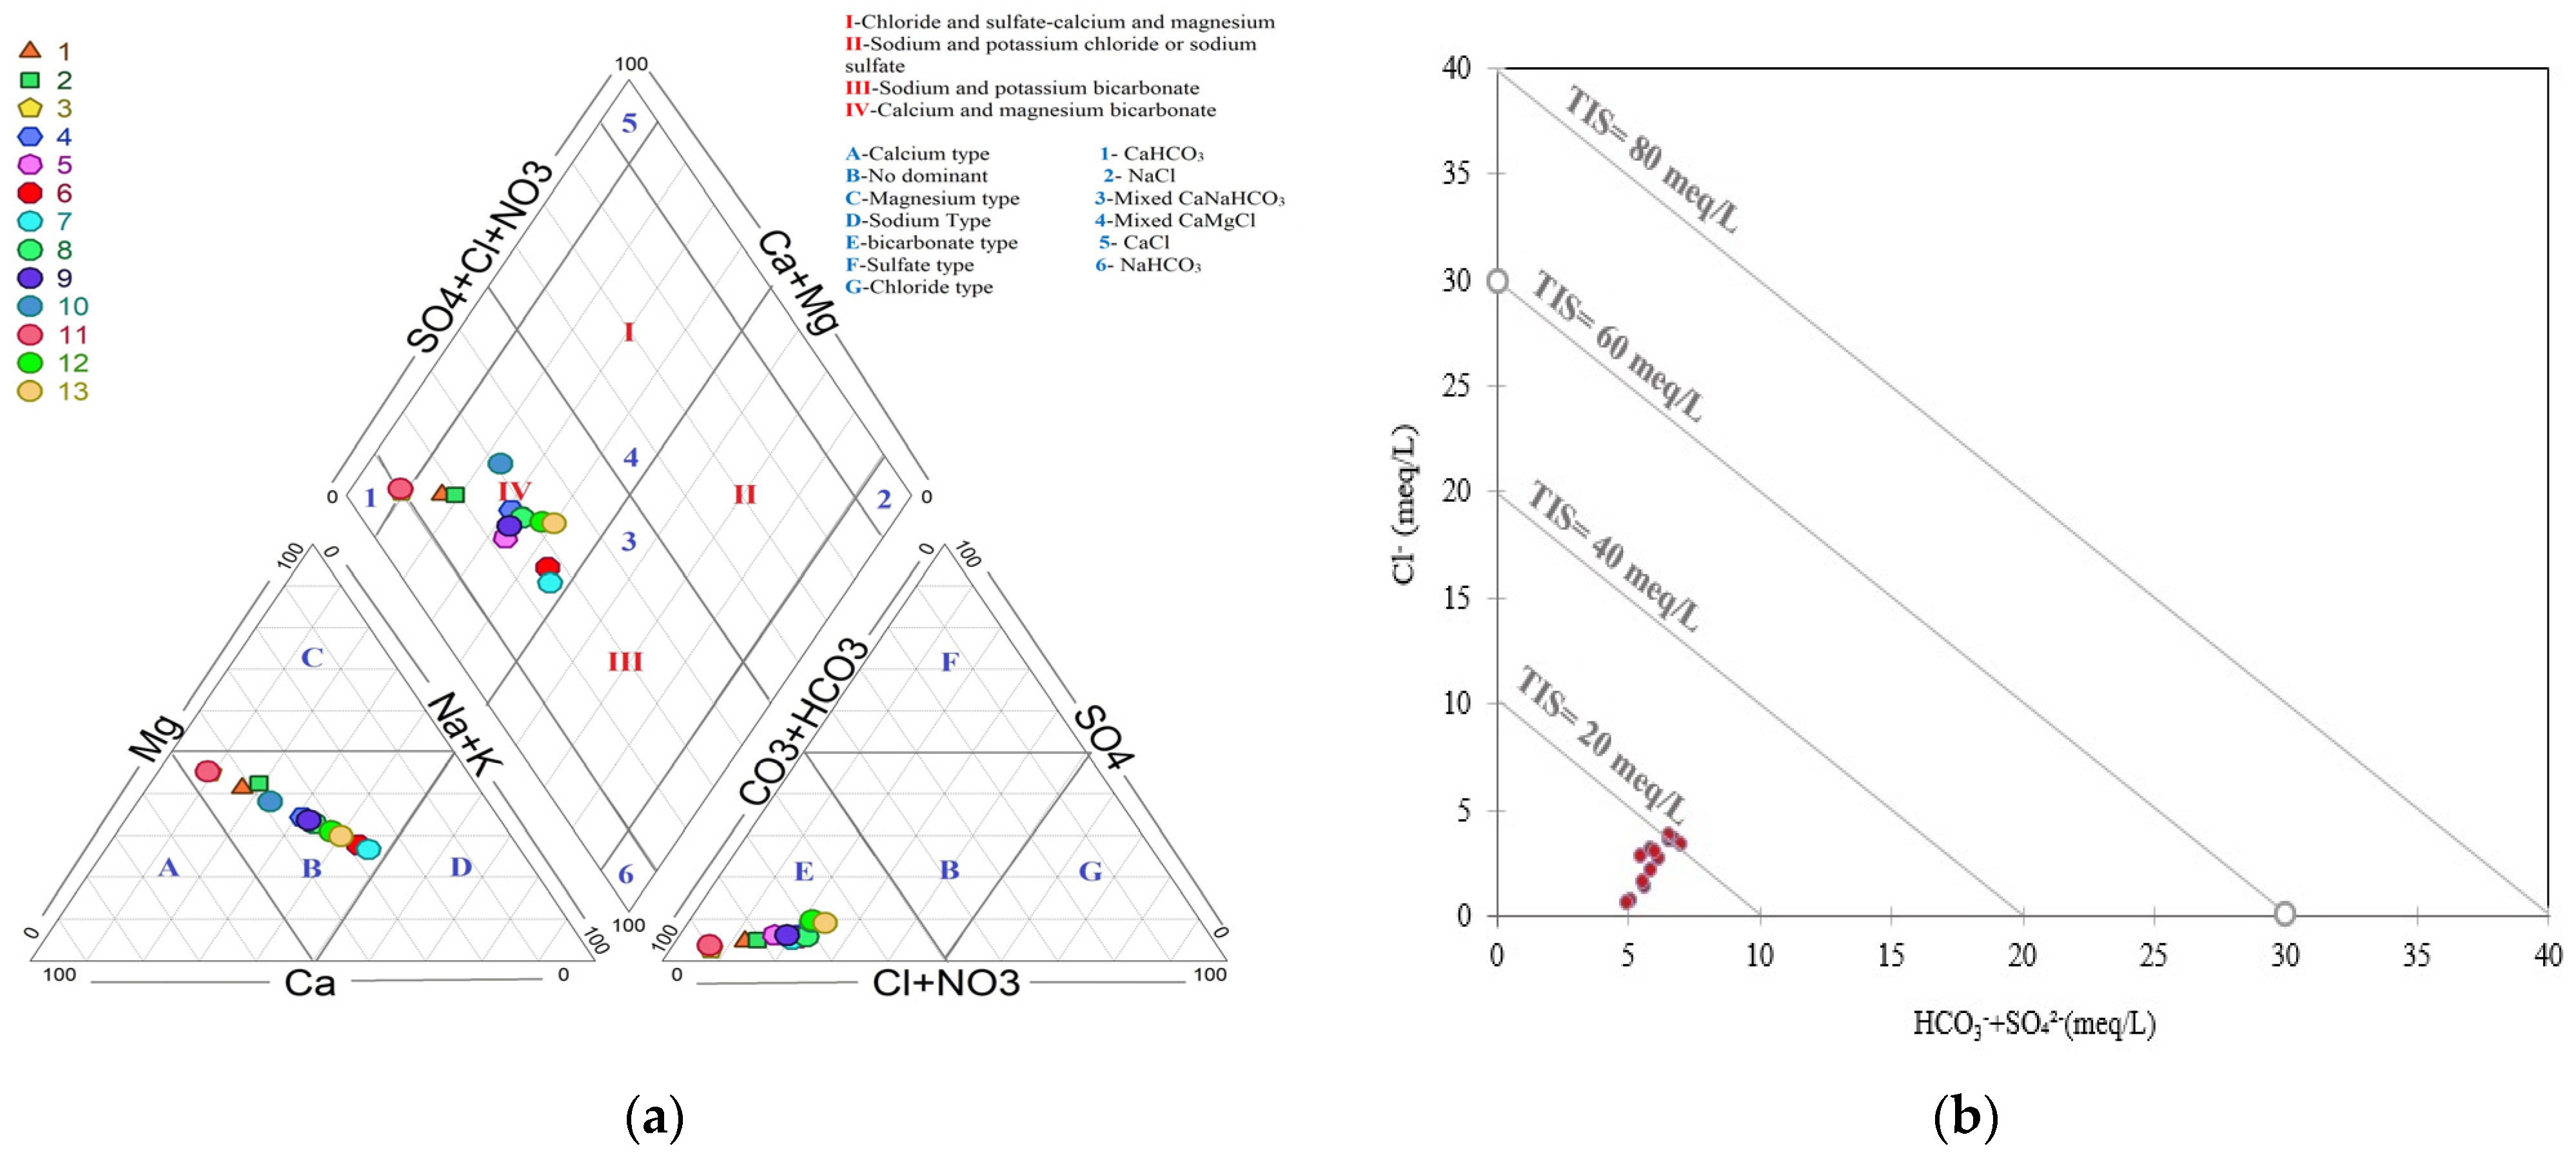
3.2. Hydro Chemical Evolution and Surface Water Types
To better understand the geochemical mechanisms that govern water quality, hydrochemical data were analyzed through imitative approaches, which were proposed by M. Piper in 1944 [
79].
Based on analytical data from the most dominated parameters of the physicochemical analysis (Ca
2+, Mg
2+, Na
+, K
+, Cl
−, NO
3−, HCO
3−, CO
32−, SO
42−), Piper’s trilinear diagram was used to define the geochemical facies and surface water types in the Oued Laou watershed and their interaction with rocks (
Figure 4a).
Based on the cation plot, all samples fell in the center (Zone B), indicating no apparent dominance of any cation in the surface water. However, Na
+ and Ca
2+ were found at significant concentrations in most sample sites, showing apparent carbonate alteration. On the other hand, the anion diagram revealed that all samples were found in Zone E, indicating HCO
3− dominance and paralleling the weathering of the carbonate-dominated lithology. The chemical properties of the analyzed surface water samples revealed Ca
2+-HCO
3− and Ca
2+-Mg
2+-HCO
3− type water, which indicates that all the samples fall into the non-alkaline carbonate domain. In general, the alkaline earth metal content (Ca
2+ + Mg
2+) outnumbers the alkali (Na
+ + K
+), and the weak acid level (CO
32− + SO
42−) outnumbers the strong acid level (CO
32− + HCO
3−), which vary from 60% to 90% and 70% to 95%, respectively. However, bicarbonate is a by-product of the dissociation of carbonic acid from the solubility of atmospheric carbon dioxide and humic acids present in the soil or the weathering of silicates [
80]. The observed chemical changes may be regulated by natural sources, such as rock-water interactions, anthropogenic sources, irrigation returns, and chemical fertilizers.
Total Ionic Salinity (TIS) analysis was performed to determine the salinity content of the water samples based on Cl
−, HCO
3−, and SO
42− [
81].
Figure 4b shows the comparable salinity, which ranges from 5 to 10.35 meq/L, knowing that the majority of samples (1, 2, 4, 5, 9, 10, and 12) have TIS between 5 and 9 meq/L, while samples 3 and 11 showed a TIS < 6 meq/L. It was noted that the highest TIS > 10 meq/L was observed in samples 6, 7, 8, and 13, which had the highest values of Cl
−, SO
42−, TDS, EC, PO
43−, and EC in all the samples.
3.3. Correlation Matrix
A correlation matrix serves to investigate the interactions between water quality indicators and the origin of water-soluble compounds in the Oued Laou watershed [
82]. A Pearson correlation matrix was created using the actual values of the 26 variables chosen for statistical analysis (
Table 5), including pH, EC, DO, BOD
5, COD, TDS, TH, TAC, Sal, Turb, Na
+, K
+, Ca
2+, Mg
2+, F
−, SO
42−, Cl
−, FC, TC, NO
3−, NO
2−, SO
42−, PO
43−, CO
32−, HCO
3− and CaCO
3. The effects of various hydrological, geological, and human activities on water quality may result in high or low correlations between hydrochemical parameters [
83].
According to the Pearson correlation matrix analysis in
Table 5, the high significant correlation coefficient (r = 1) between EC and TDS indicates that the conductivity of water depends on TDS. EC and TDS had positive correlations with PO
43−, Cl
−, NO
3−, SO
42−, and Na
+, which provide information on the main parameters controlling the salinity and mineralization of Oued Laou surface water.
A high correlation (r > 0.9) was observed between Ca2+, Mg2+, and TH, indicating that water hardness is defined as the combined concentration of calcium and magnesium ions in water samples.
The sampled surface water was high in sodium, bicarbonate, chloride, and sulfate. The strong correlation (r > 0.8) between sulfate and chloride is due to several factors, such as natural and human activities. There was also a significant positive correlation (r > 0.741) between the main cation Na+ and the bicarbonates (Cl−, HCO3−, CO32−, CaCO3), as well as between (Cl− vs. SO42−) and (Na+ vs. SO42−). This significant association gives information on the chemical weathering and leaching of salts in surface waters and suggests that salt dissolution in the surface water is the main source of Na+ and Cl−.
The strong relationship between NH
4+ and NO
3− (r > 0.7) could explain the low NH
4+ concentrations in surface waters. As previously stated, there is a significant relationship between DO and NO
3−, implying that oxygen levels control the nitrification process in the river. While the high correlation between SO
42− and (Cl
−, K
+) may be due to a long history of evaporation and seasonal impacts [
84]. Other significant correlations were also found (r > 0.735) between F
− and SO
42−, due to the dissolution of fluorite and some silicate minerals, such as mica (the principal source of F
− in surface water) [
85]. The association between NO
3− and PO
43− in water samples may indicates anthropogenic contamination, primarily from agricultural and/or domestic wastes [
86].
The presence of ammonium in the water is an indicator of possible microbiological contamination. Turbid water provides information about the suspension or dissolution of organic and inorganic particles in water. The significant positive correlation between ammonium and turbidity with FC (r = 0.712) could inform the parameters controlling the organic contamination of the Oued Laou river caused by wastewater discharge from human activities and the application of agricultural fertilizers. Therefore, a low dissolved oxygen environment will lead to an increase in fecal coliforms [
87]. Additionally, high turbidity allows the fixation of microorganisms on suspended particles. Consequently, the bacteriological quality of turbid waters is questionable [
88].
The significant relationship between COD and Cl−-SO42−-PO43− (r > 0.7) suggests that COD concentration may influence the occurrence of Cl− and SO42− in the Oued Laou river.
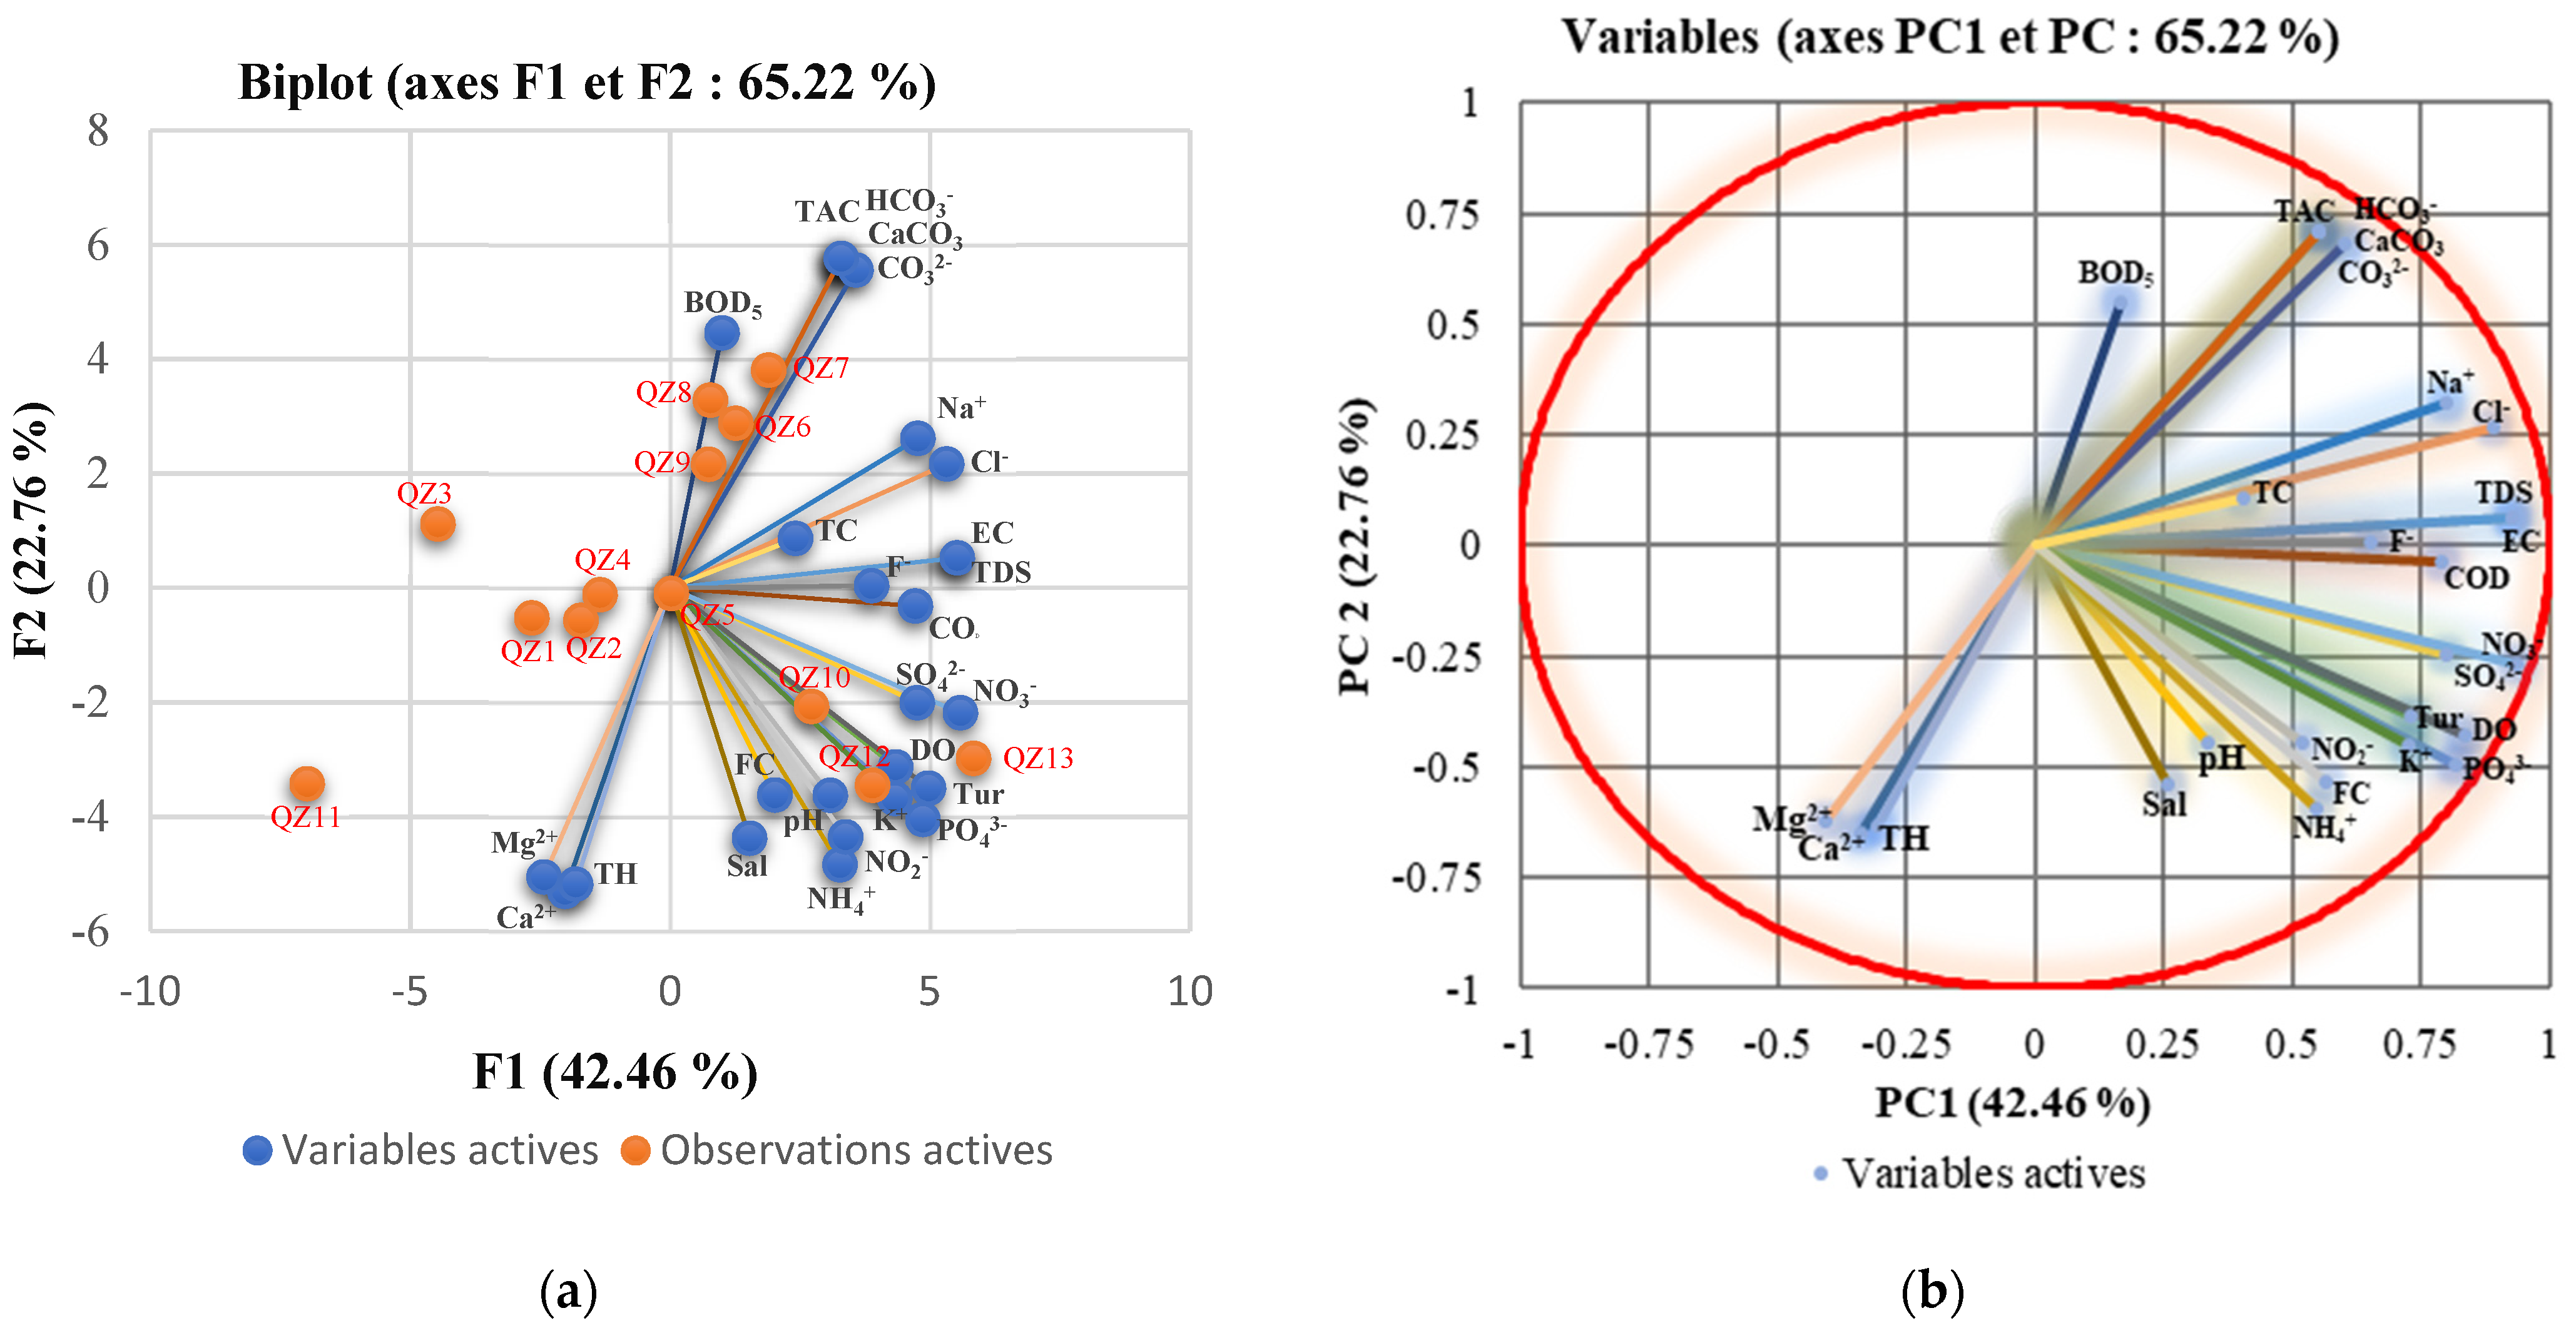
3.4. Principal Component Analysis
The PCA loading for 26 parameters allows the extraction of five principal components, explaining 89.73 percent of the overall variance of the data (
Table 6).
The F1-F2 duo accounts for more than 65.22% of the data (
Figure 5). Based on these percentages, the processes governing the chemical development of the region’s waters are essentially contained in these five components.
The first component (PC1) accounts for 42.45% of the total variation, with large positive loadings of EC, TDS, Cl−, and SO42− and moderate loadings of K+, COD, PO43−, NO3−, Na+, Tur, and DO. This component indicates that EC in the surface water is influenced by the amounts of TDS, SO42−, NO3−, and Na+. These are the primary ions regulating surface water mineralization at the research site due to the significant positive charge of EC, NO3−, and the medium charge of Na+. Taking everything into account, the most abundant elements in surface water are Na+, Cl−, HCO3−, and TDS. This is explained by the presence of clays and limestones across the research region.
DO and COD are used to assess the amount of pollution in surface waters by lowering organic and inorganic components [
83]. Because all other forms of inorganic nitrogen have been oxidized, resulting in an increase in NH
4+ and FC, which are routinely used to determine the level of fecal contamination, the significant positive loading of DO for this component could indicate a fluctuation of nitrates in surface waters. The considerable positive presence of NO
3− and PO
43− is mostly associated with the use of chemical or biological fertilizers and wastewater. Although SO
42− is primarily derived from soluble inorganic nitrogen and inorganic salts, it is affected by agricultural activities (sulfate fertilizers) and bacterial oxidation of sulfur compounds [
16]. While the moderate NO
2− charge in the study area of natural aquifers is linked to anthropogenic factors based on the denitrification process [
89], because of its limited solubility, the ion fluorine is frequently inactive in pH-neutral surface waters and is absorbed by other materials that replace clay. However, in an alkaline environment, hydroxyl (OH) groups are easily exchanged into F-, and interaction with water in dry climates would be the primary cause of the fluoride concentration increase. This suggests that fluoride-added water is often excessively alkaline and soft [
90]. QZ1, QZ3, QZ11, and QZ13 had the greatest effect on the PC1 score (>0.5), whereas QZ10 and QZ12 had a modest effect.
With moderate positive loadings of HCO3−, CO32−, CaCO3, and alkalinity, the second component (PC2) explains 22.76 percent of the overall variance. The presence of TAC and HCO3− in this component suggests that surface water alkalinity is related to bicarbonate ions, which are the result of a natural disintegration process of the calcareous sedimentary rocks that dominate the Oued Laou catchment basin. The sources of pollution on this axis include both natural and anthropogenic (domestic, industrial, and agricultural).
The fact that CO
32− has a moderate loading on the PC2 factor indicates that it is formed through weathering, carbonate dissolution, gypsum dissolution, and bacterial decomposition of organic pollution, among other processes [
91]. Stations QZ6, QZ7, and QZ8 also had the greatest impact on the PC2 score.
PC3 accounts for 10.89% of total variability and is distinguished by significant positive Mg2+, Ca2+, and BOD5 loading. This component’s substantial Ca2+ loading may explain why Ca2+ predominates over Mg2+ in surface water samples, and it may also suggest that Ca2+ has a comparable source to nitrate in surface water. This component is generally associated with anthropogenic contamination induced by agricultural operations in the study region. The presence of Mg2+ ions in the research area suggests that they were formed as a result of interactions between the dolomitic limestone and water, which explains the increase in Mg2+.
The fourth component (PC4) indicates that 8.06% of the total variance was mostly caused by salinity with a moderate load, which was caused by lithology or highly dry climate features that naturally cause substantial evapotranspiration and concentrate the soil solution [
92]. Stations QZ2 and QZ4 accounted for the majority of PC4 scores.
The PC5 has a moderately positive pH and TC load, accounting for 5.55 percent of the overall variability. This demonstrates how the pH variation in the research region serves as a gauge for the concentration of key ions in surface water. The pH being close to neutral might encourage the development of bacteria in surface water, especially total coliforms. This high TC load may result from a spillover phenomenon whereby all human and animal waste is discharged into the river water. Similar observations have been made by Zegmout [
93].
The positive loads of factors 1 and 2 are greater than those of factors 3, 4, and 5. This demonstrates that they are the result of rock-water interaction. PCA results show that dissolved inorganic nitrogen (NH4+, NO3−, and NO2−) significantly contributes to PC1 and PC5, and that human activities may have a considerable impact on the amounts of dissolved inorganic nitrogen in surface waters.
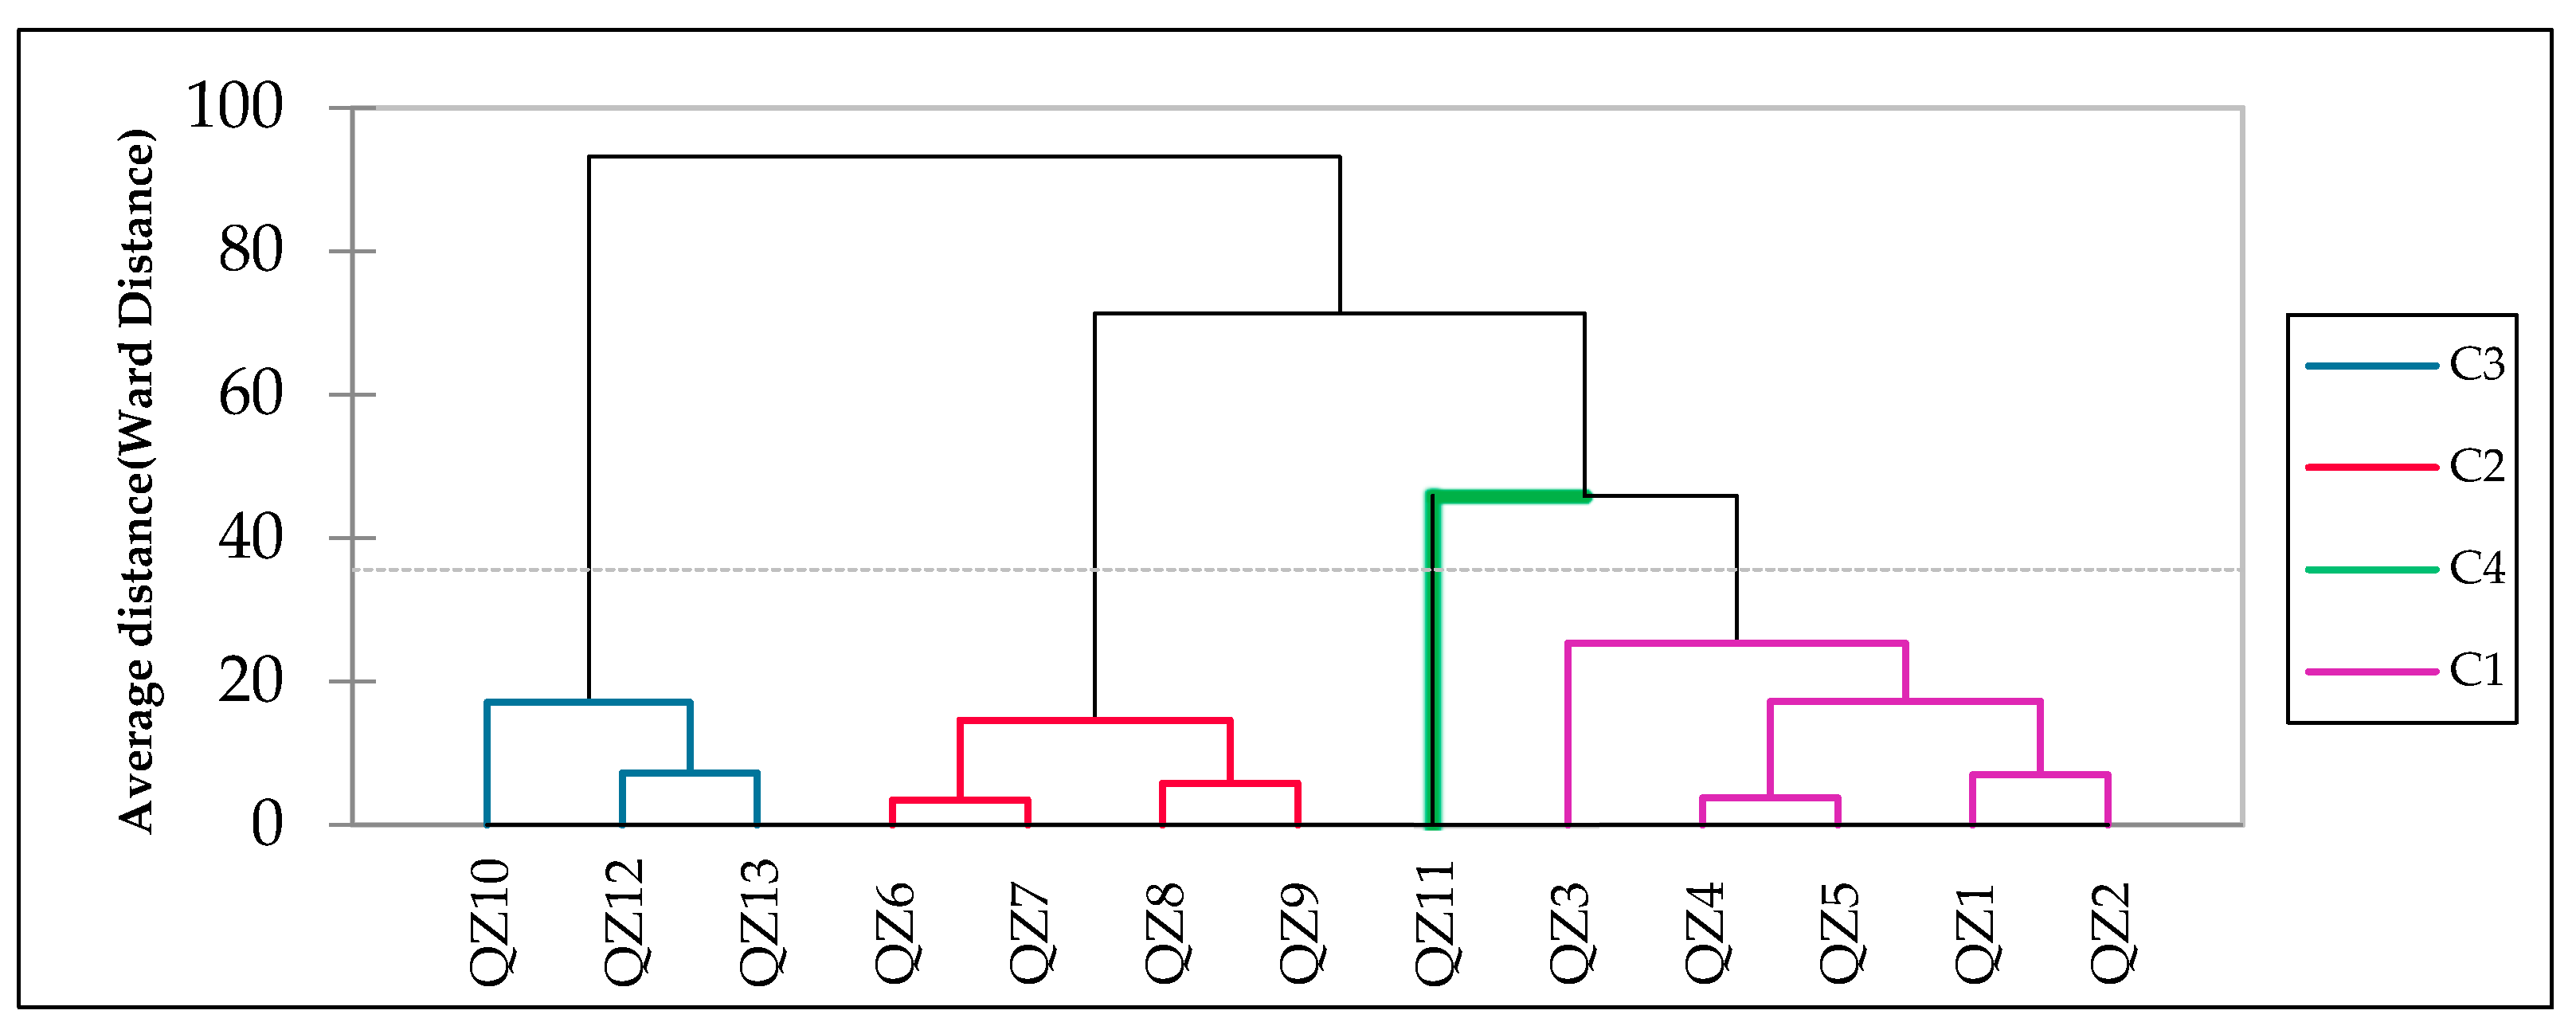
3.5. Hierarchical Cluster Analysis
The sample stations are geographically categorized using the Euclidean distance and ward linkage approach as a measure of similarity or dissimilarity [
94]. Hierarchical cluster analysis (HCA) was employed in this study to corroborate the results of PCA [
95]. The HCA findings for the physicochemical parameters indicated four types of clustering (
Figure 6).
Cluster 1 is divided into two sub-clusters. The first covers QZ1-QZ2 and QZ4-QZ5, whereas the second just includes QZ3. It represents the northwestern and southern regions of the Oued Laou basin, which is composed of limestone and shale. This zone’s water quality examination revealed considerable amounts of Cl−, NO3−, SO42−, TC, and Na+. It represents the greatest concentrations of these chemicals in the research area. Except for QZ3, the placement of QZ1-QZ2 and QZ4-QZ5 in this group is owing to the high concentration of Ca2+, which is presumably connected to the dissolution of the bicarbonate rocks. Only QZ3 was classified as the cleanest sample in Group 1 since all physicochemical and biological characteristics were present in low quantities and no WHO limits were exceeded.
Cluster 2 has two sub-clusters (QZ6-QZ7) and (QZ8-QZ9), which represent the central and northwest regions of the Oued Laou basin near Akchour. Analyses of the water quality in this location reveal increased levels of PO43−, Cl−, SO42−, and TC. Cluster 2 has similar qualities to Cluster 1, but they are more apparent.
Cluster 3 is made up of QZ10, QZ12, and QZ13. These three sites had greater EC, pH, Sal, FC, and Na
+ levels than the other samples. However, the amounts of PO
43−, NO
3−, SO
42−, and NH
4+ were greater in cluster 3 than in clusters 1 and 2, indicating that high levels of phosphates in surface water are produced by human pollution, notably detergent-containing residential wastewater [
96]. Furthermore, the average salinity in cluster 3 was lower than in clusters 1 and 2, and the Ca
2+ concentration was greater in cluster 3 than in clusters 1 and 2.
Cluster 4 contained a single sample (QZ11) found in the northwestern portion of Oued Laou near the urban center. This sample contains the lowest quantities of nitrates, indicating that the area is not influenced by agricultural operations or anthropogenic contamination. Given the highest Ca2+ and Mg2+ concentrations, the load of Mg2+ ions indicate that they can be derived from rock-water interaction processes. In general, the clustering results are based on the rate of surface water mineralization, which resulted in four classes in the following order of mineralization: Cluster 1 > Cluster 4 > Cluster 2 > Cluster 3.
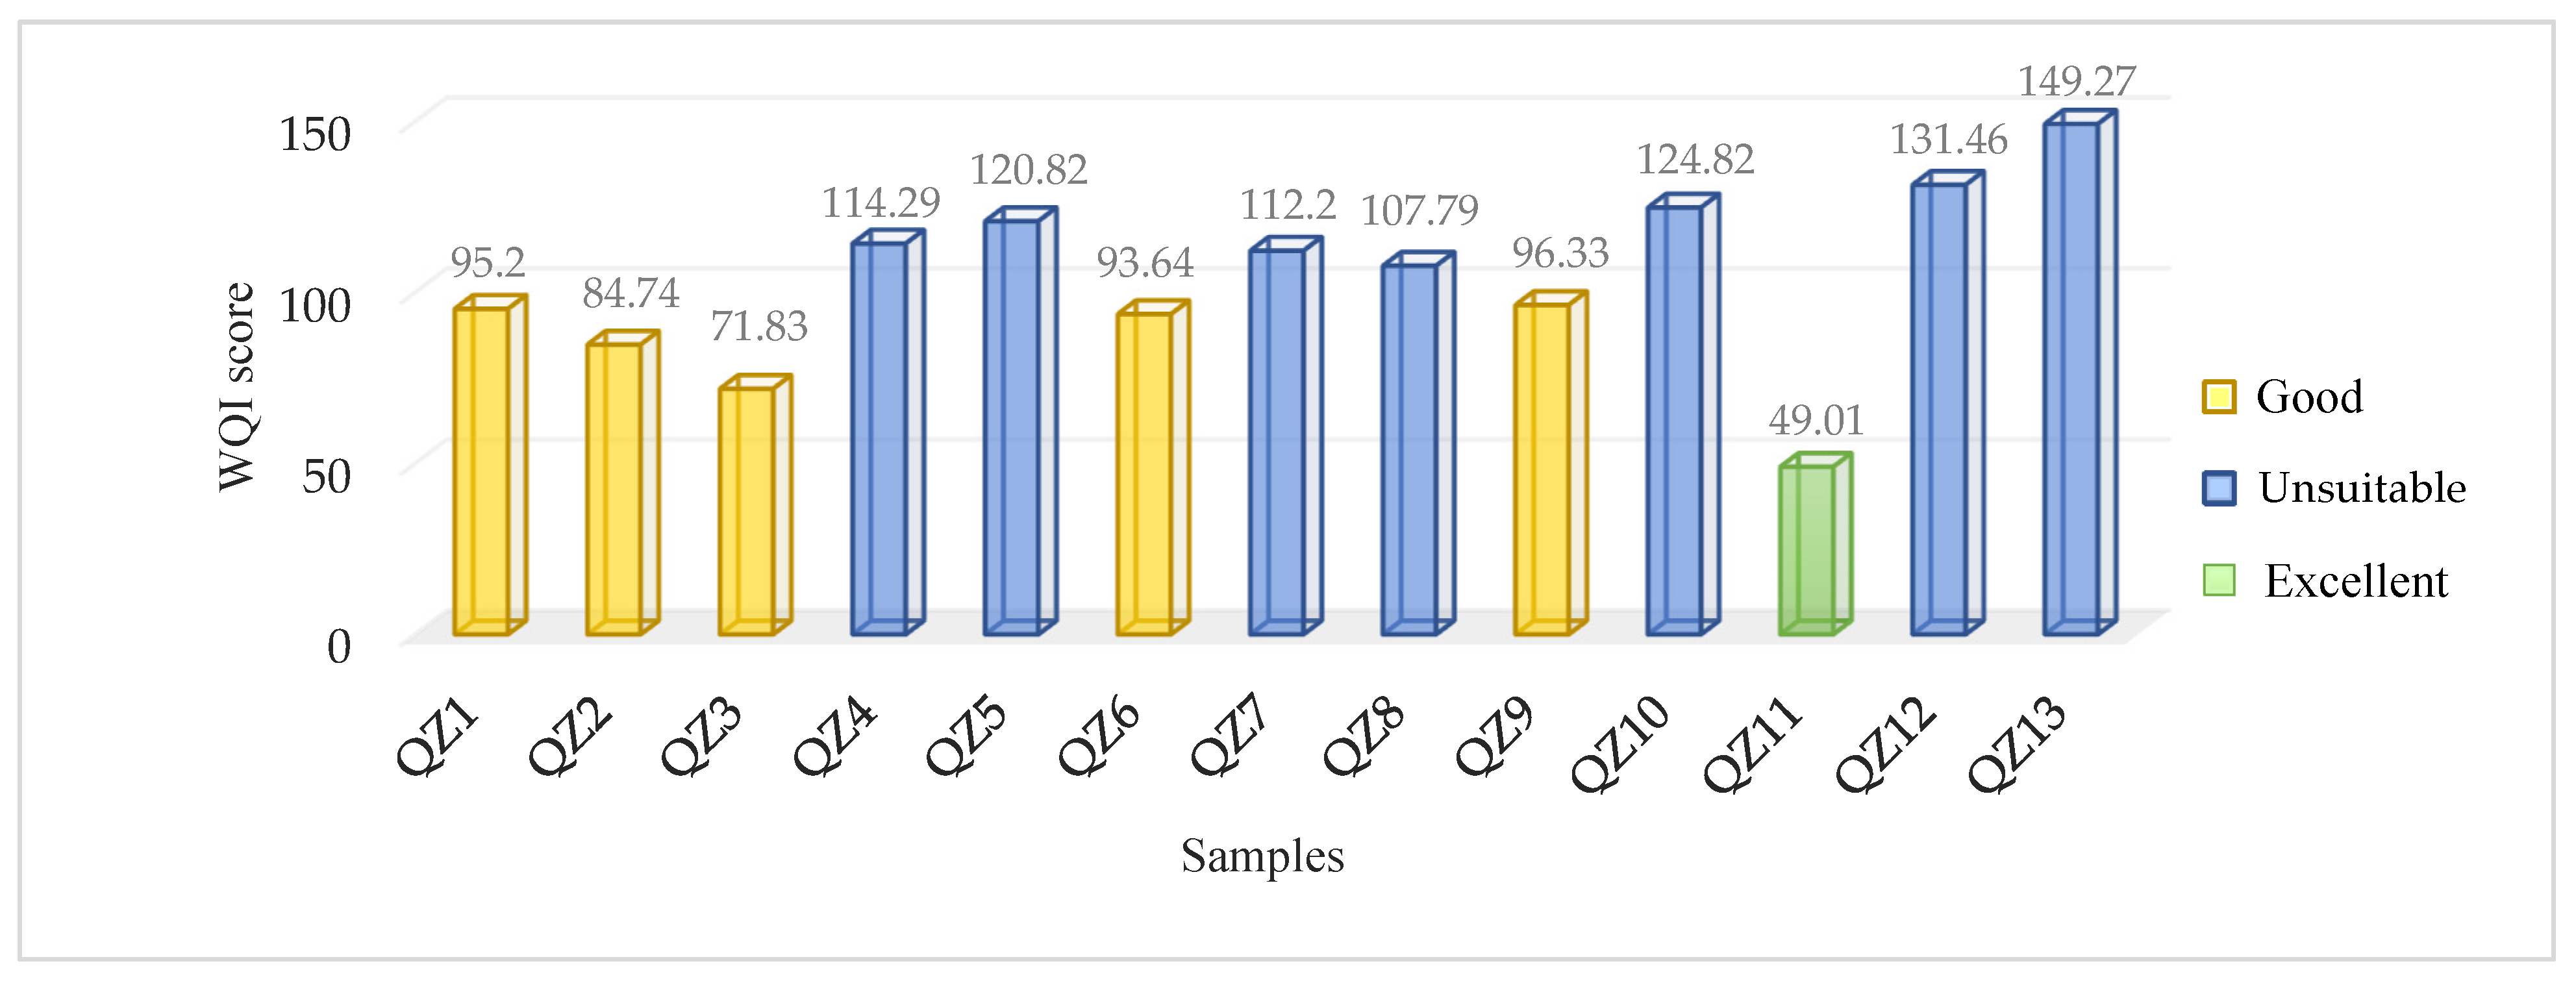
3.6. Water Quality Index
The suitability of surface water sources was assessed using the Water Quality Index method, which leads to a friendly interpretation of water quality by assembling different parameters into a single number. The WQI was calculated using the concentration of 15 parameters as per their relative significance in the overall quality of water for drinking, domestic, and irrigation purposes (
Table 1) and
Figure 7 and their permissible limits for water according to the International Regulations (WHO 2017). The surface water quality index divides water bodies into four groups based on pollution levels [
22]. This approach also provides a more accurate assessment of drinking water quality [
97].
The results of the calculated WQI, as displayed in
Figure 7, suggest that the WQI ranged from 49.01 to 149.27, indicating that the overall water quality of the studied rivers was graded into three categories: “excellent-green”, “good-yellow”, and “bad-blue”. According to this classification, except for one sampling site taken from the Oued Laou River that was within the limits of class 1 (excellent quality) with a relatively stable contribution of pH to the WQI, all the WQI values were more than 50.
Whereas 38.46 percent belong to class 2 (good quality), and 53.48 percent fall into the poor-quality category.
Sample QZ11 contained water of excellent quality, scoring 49.01, and is thus classified as excellent for rural consumption. While QZ1, QZ2, QZ3, QZ4, QZ6, and QZ9 were rated as good drinking water, ranging from 50 to 100. In contrast, the samples QZ5, QZ7, QZ8, QZ10, QZ12, and QZ13 were classified as poor water types with a value greater than 100, which can be attributed to their contact with anthropogenic activities.
The highest value, 149.27, was recorded at QZ13 because it was related to high nitrate, calcium, and phosphate levels and, secondarily, to organic and oxidizable materials exceeding requirements in some places. The WQI assessment indicated that the eastern and southern areas of the study area were unfit for drinking (
Figure 7). Previous studies that used the WQI to determine surface water quality discovered similar results. For example, Sudhakaran et al. [
98] reported and interpreted that the WQI values of the water in the Netravati River range from 33.21 to 298.66, indicating that the water quality ranges from excellent to very poor. While Hou et al. [
99] indicated that WQI values ranged from 17.8 to 77.8 in five reservoirs, which indicated “good” to “very poor” water quality in the reservoirs. No significant differences in WQIs were found between the mountain and Yellow River (China) reservoirs. As is the case for Taloor et al. [
100], a record that, according to the Water Quality Index (WQI), 45% of samples fall into the excellent category, and 50% of spring samples fall into good categories for drinking purposes for the Basantar watershed of the Jammu Himalaya (Kashmir, India).
3.7. Hierarchical Cluster Analysis and WQIs
We examined the categorization of the two criteria using the surface water quality index, whose findings show that the WQI is divided into three appropriate groups, and the HCA findings (
Figure 8). This comparison allows us to evaluate the similarity between the two methods. The samples with the most comparable WQI values were found to be categorized into the same cluster and subsequently into sub-clusters. When cluster 2 (QZ6, QZ7, QZ8, and QZ9) is compared to cluster 3 (QZ10, QZ12, and QZ13), it is clear that the classification is based on WQI results. where QZ13 had the highest value (149.29), followed by QZ12 (131.46), and QZ10 (124.82) was assigned to cluster 3. while the sub-clusters (QZ7 and QZ8) of cluster 2 were grouped into different sub-clusters. They are, however, all in the same category (blue). classified as “poor water quality”.
On the contrary, the sample QZ11, which has the lowest WQI value (49.01), was placed alone in Cluster 4, which is distinguished by “good water quality” (green). as is the case with Cluster 1, which contains QZ1, QZ2, QZ4, QZ5, and QZ3, which have slightly different WQI scores of (95.2), (84.74), (114.29), (120.82), and (71.83), respectively. In this case, HCA could group QZ4 and QZ5 into the same sub-cluster, different from the QZ1, QZ2, and QZ3 “good quality water” group (yellow), due to the almost identical WQI values with slight differences. It was also noted that the good water quality zones QZ3 and QZ11 are close to each other.
The HCA, on the other hand, can identify and segregate them into two groups since it establishes additional categories. Despite this, both approaches produce comparable findings, and combining them can lead to a more accurate surface water quality evaluation and interpretation.
3.8. Irrigation Water Quality Assessment
The surface water suitability for irrigation purposes is calculated to determine the influence of minerals and salts in surface waters on plants and soil, which may affect plant growth by chemically lowering water intake via osmotic pressure changes or metabolic responses such as those caused by hazardous chemicals. The same is true for soil structure, permeability, and aeration. The IWQI purpose is calculated (
Table 7), according to the cumulative effect of the nine hazard groups: EC, Na%, SAR, RSC, RSBC, PI, KI, PS, and MH [
98].
The electrical conductivity levels reflected by salinity damage are essential considerations in evaluating the suitability of water used for irrigation because of their effect on the osmotic pressure of the soil solution and the ability of plants to absorb water via their roots [
101]. According to Wilcox (1955), C1 surface water (low salinity risk) can be used to irrigate most crops and soils. In the case of moderate leaching, secondary water C2 (moderate salinity risk) can be used for irrigation. Water with relatively high salinity (class C3) may be suitable for salt-tolerant plants but not for normal watering, especially in soils with limited drainage. Water with high salinity (C4) cannot be used in soils with limited (
Table 8) [
102].
Based on the results of the samples studied in our study area, it was determined that all the samples were classified as moderately brackish, ranging from values below 750 μS/cm, consistent with Richards’ value, which indicates good to acceptable irrigation water quality according to the EC value (
Table 7).
The salt concentration, or “alkali danger”, which is expressed in the SAR, is a crucial factor for assessing the suitability of surface water for irrigation. Sodium Adsorption Rate (SAR) affects the soil, so irrigation water with high salt levels is of special concern and symbolizes the sodium danger because salt affects the soil. SAR also takes water from plants and decreases soil permeability [
103].
This activity is particularly sensitive to finely structured soils, particularly those with high clay content. Some modifications may be required to achieve a stage with a high SAR. Ca
2+ and Mg
2+, when present in sufficient amounts in the soil, help balance the effects of Na
+ and maintain healthy soil properties [
104]. SAR is used to categorize surface waters into four groups. Excellent (SAR < 10), Good (10 < SAR <18), Suspicious (18 < SAR < 26), and Unsuitable (SAR > 26). Water sample SAR varied from 0.18 to 2.51, with an average of 1.37 (
Table 7). As a result, according to a USSL diagram [
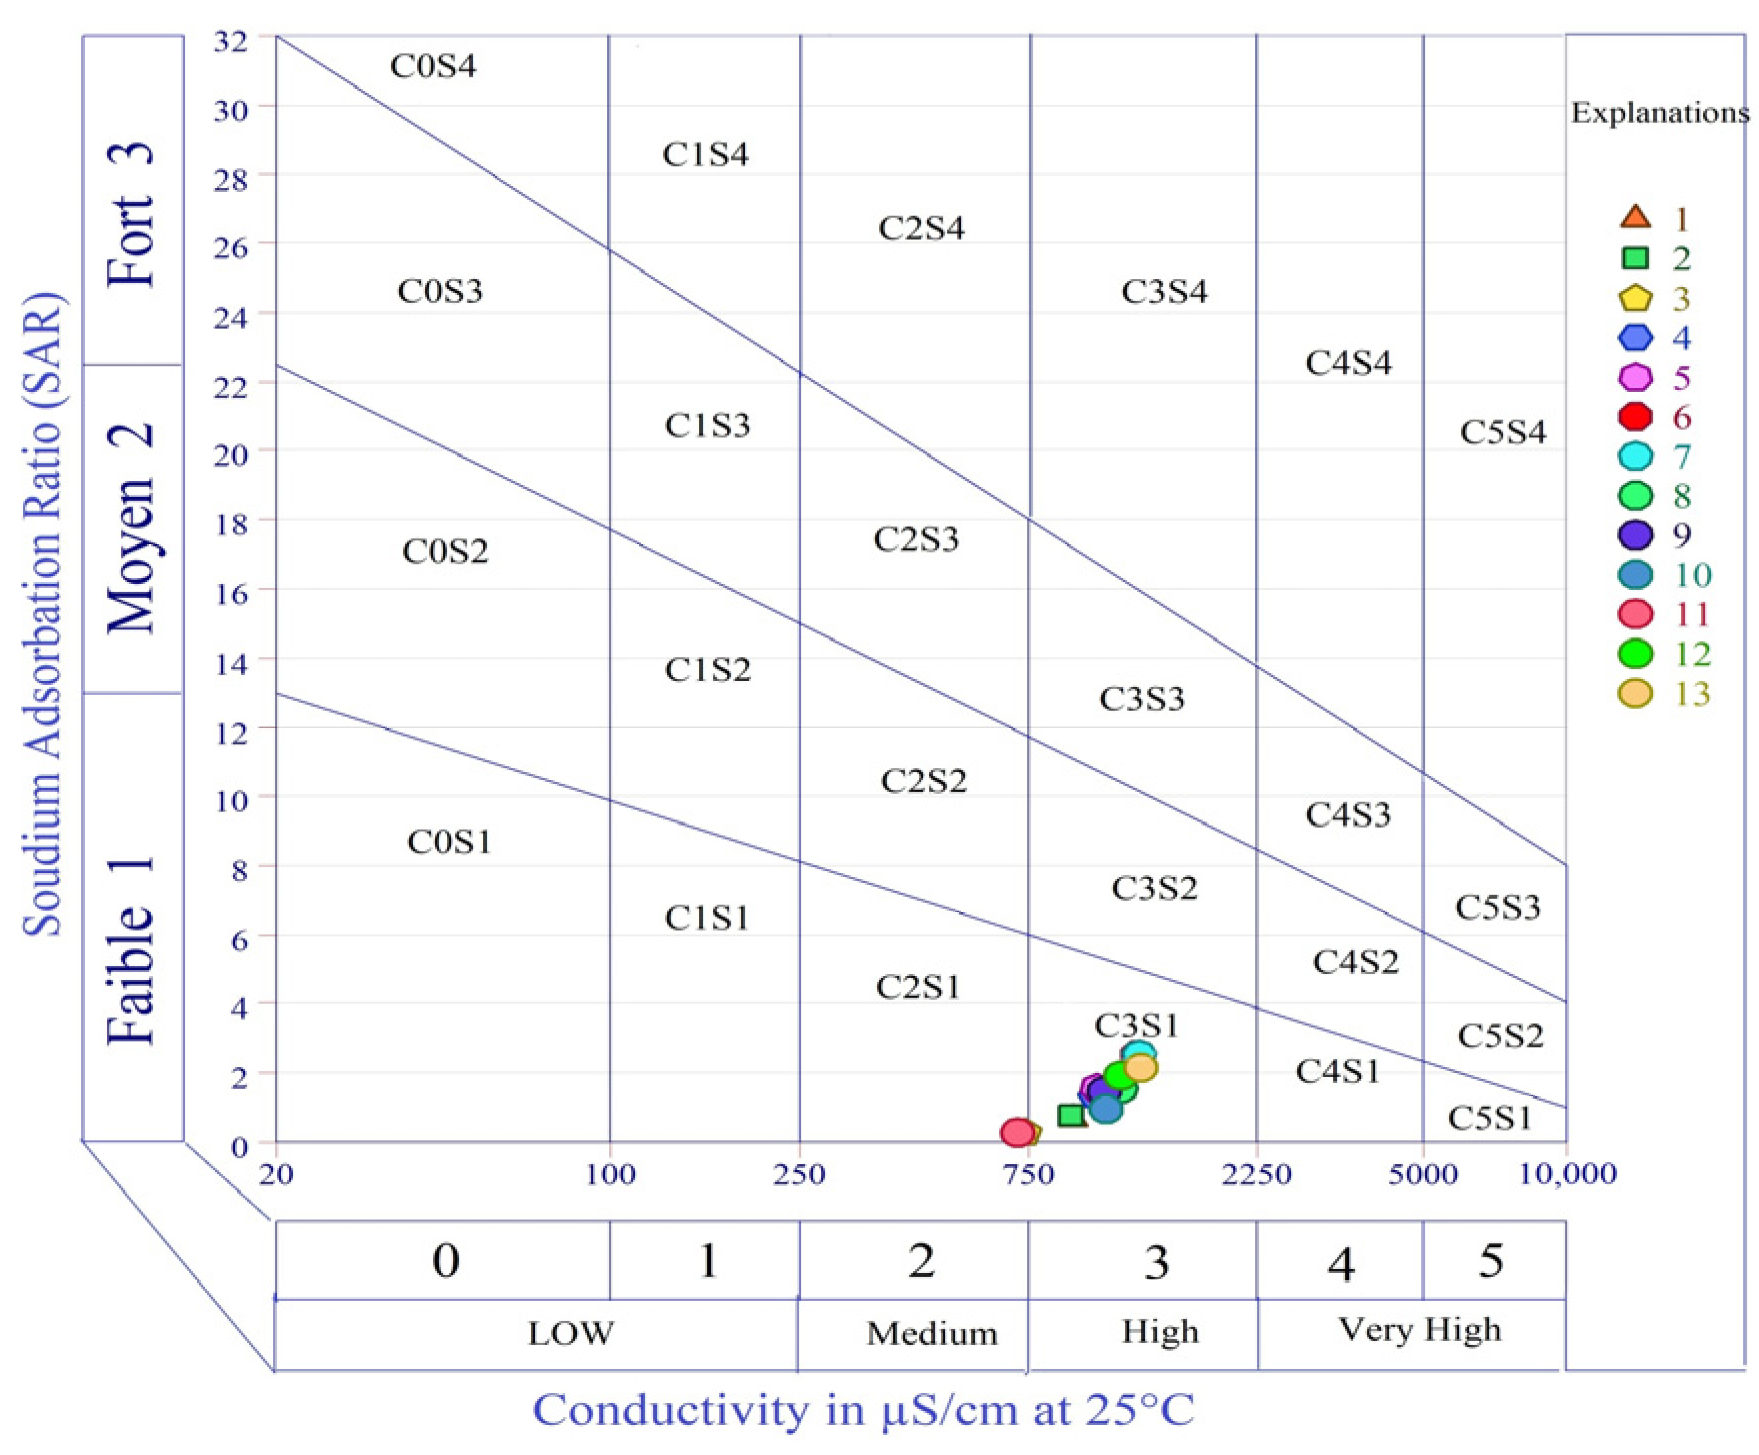
105], the categorization of irrigation water quality is in the form of EC against SAR values. EC is used as the salinity risk index, and SAR gives the sodium risk for irrigation water.
According to the Richards classification [
105], the plot revealed that about 15.35% of the surface water samples fell into the C2-S1 category. In comparison, approximately 84.62% of the samples fell into the C3-S1 category, which shows that the surface waters in the investigated area have a medium salinity and low sodium content (
Figure 9). According to the US Salinity Laboratory classification [
106], the surface waters in the study area are within a low salinity field (<2250 μa/cm); thus, the water is highly appropriate for irrigation.
Similar results were found by Elsayed et al. [
31], SAR revealed that most surface water samples fell into the C2-S1 category and a few samples fell into the C3-S1 category, which shows that the surface waters in the Nile River are suitable for irrigation. While Pivić et al. [
102] found a different result for SAR, whose values varied between 0.01 and 10.34 meq/L. The obtained SAR values showed that all tested irrigation water samples, except one, were of excellent quality, and one sample was of good quality in the Republic of Serbia.
The sodium percentage (Na%) is also used to assess the risk of sodium in soil and particle clogging. An excess of sodium with carbonate ions will help turn the soil into alkaline soil; in contrast, sodium mixed with chloride ions will accelerate the formation of saline soil, which ultimately worsens the infiltration capacity of the soil and reduces plant growth [
95]. According to the classification of Wilcox (1955) [
29], surface waters are divided into five types (
Table 8).
Table 7 shows that the Na% in the water samples for irrigation in the study area ranged from 4.73 to 44.66%, with an average of 28.41%. Therefore, the Wilcox plot [
29] related to the percentage of sodium and total concentration displayed in
Figure 10 and
Figure 11d reveals that 30.76% of the water samples are in good condition. In comparison, 69.24% are classified as “excellent to permitted” with excessive content.
Similar results were found by Amrani et al. [
107] in the region of Timahdite-Almis Guigou, Middle Atlas, Morocco. The water contained less than 60 percent sodium, which is considered healthy and was recommended for irrigation [
16]. The high concentration of Na
+ in irrigation water tends to be absorbed by clay particles, displacing Mg
2+ and Ca
2+ ions. The exchange of soluble Na
+ for Ca
2+ and Mg
2+ in the soil reduces permeability and ultimately leads to poor internal drainage. The restriction of air and water circulation during wet conditions affects soil hardness after drying [
108].
Water with large quantities of these ions tends to precipitate as calcium carbonate or magnesium carbonate from soil solutions, increasing the salt content and, therefore, the danger of alkalinity. Excessive bicarbonate and carbonate concentrations other than calcium and magnesium are alluded to as residual sodium carbonate (RSC) [
109].
RSC is a valuable tool for examining the applicability of irrigation water. It is divided into three levels, according to the Eaton 1950 classification (
Table 8) [
110]. The RSC values of the 13 samples in our investigation varied from 1.71 to 8.12 meq/L, with an average value of 5.61 meq/L (
Table 7). According to this result, 92.31% of the water samples had a value higher than 2.25 meq/L, which falls under the “unsuitable for irrigation” category based on the classification of Knowing that 7.69% (QZ11) of the water samples showed a marginally suitable category for irrigation, the water samples with positive RSC infer that the cumulative concentration of CO
32− and HCO
3− is higher than the combined concentrations of Ca
2+ and Mg
2+, which would indicate the presence of residual carbonate [
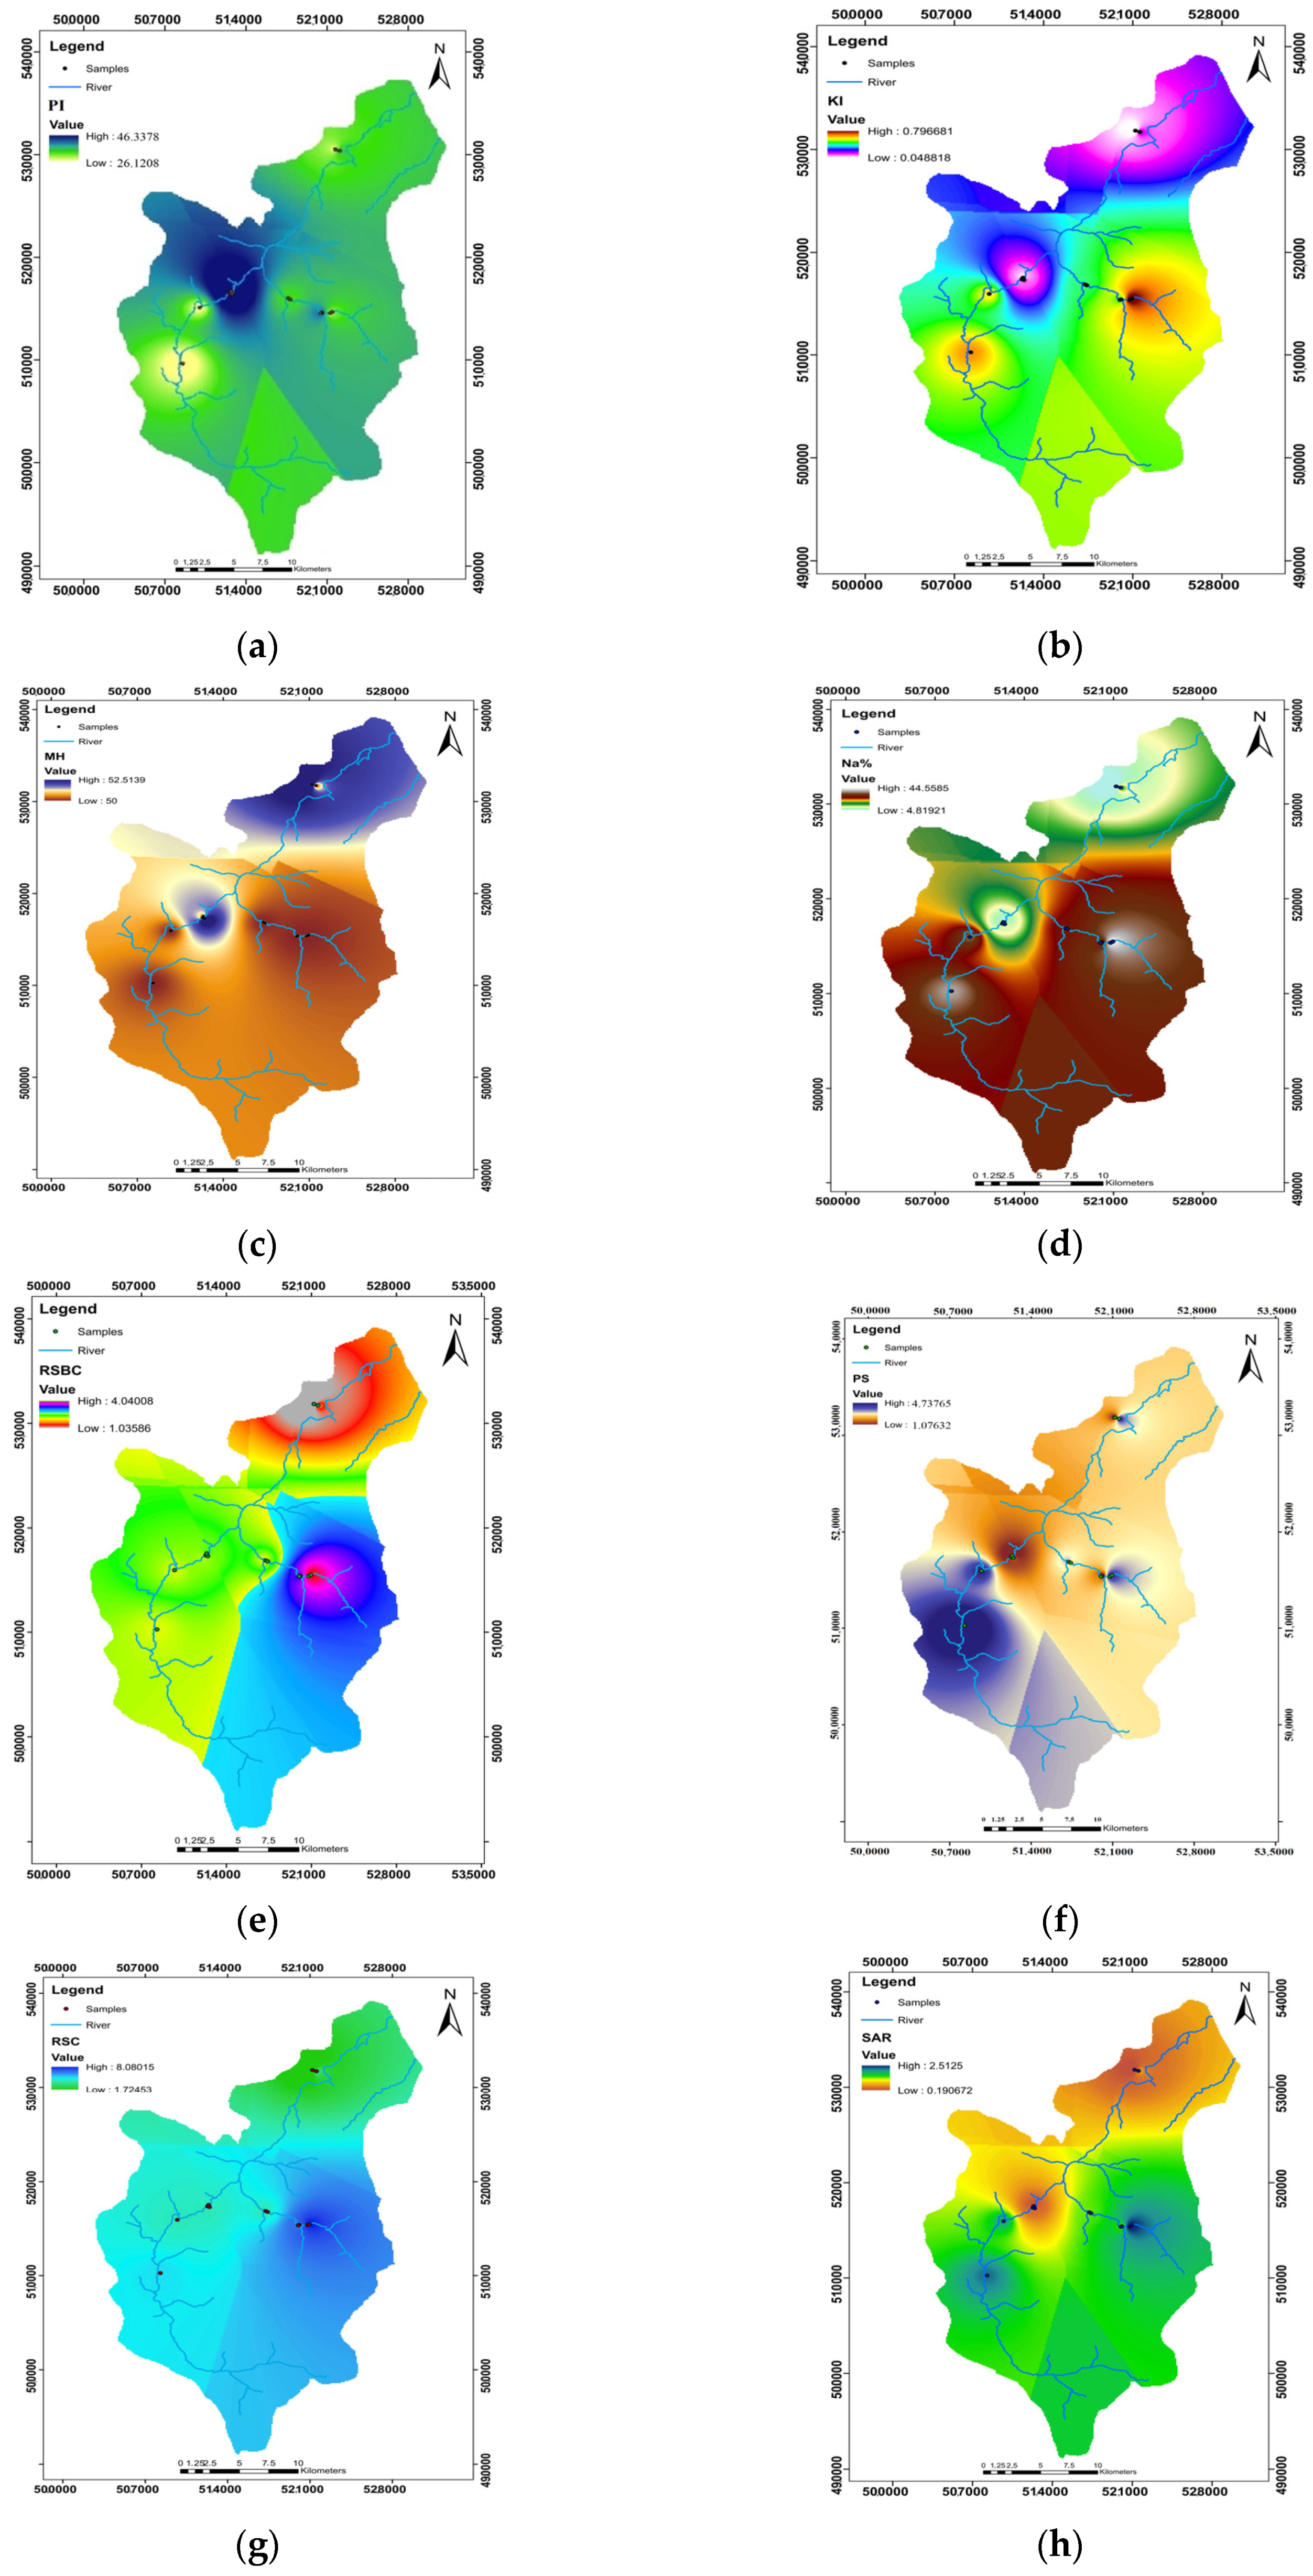
102], which causes a decrease in soil fertilization. The exact variations in RSC values were shown by the IDW interpolation map (
Figure 11g).
The residual sodium bicarbonate index (RSBC) has been proposed by Gupta et al. [
111] to express the risk of alkalinity. Generally, a bicarbonate concentration above 10.0 meq/L affects plant growth in several ways. while RSBC values less than 5 meq/L were considered satisfactory [
111]. In this study, RSBC values ranged from 1.03 to 4.06 meq/L (
Table 7), with an average of 2.82 meq/L, which shows that all samples had RSBC values much lower than the acceptable level and may be used safely for irrigation.
Potential salinity (PS), which is the concentration of Cl
− plus half the concentration of SO4
2−, is used as one of the classifications for assessing the suitability of water for irrigation [
112]. In the examined irrigation water samples, the potential salinity of water samples from the river Oued Laou ranged from 0.72 meq/L to 4.37 meq/L, with an average of 2.90 meq/L (
Table 7). This means that 46.15% of the samples (QZ1, QZ2, QZ3, QZ5, QZ8, and QZ11) are excellent. while 53.85% of the samples are classified as good (
Table 8). These variations in potential salinity levels might be attributed to the presence of chlorides in agricultural and wastewater discharges.
The RSBC and PS analytical data are shown geospatially on the IDW maps (
Figure 11e,f).
The use of water with high quantities of salt, calcium, magnesium, and bicarbonate alters soil permeability over time [
104]. The Permeability Index (PI), developed by Doneen et al. [
112], can better reflect the effects of irrigation. Based on the parameters employed, water can be divided into three classes: excellent, good, and poor (
Table 8). Class I (>75%) and Class II (25–75%), respectively, are deemed suitable and moderate for irrigation, whereas Class III (25%) is deemed unsuitable [
113]. The computed permeability index for water samples in the Oued Laou watershed spans from 26.12% to 48.40%, with an average of 31.48%. The analytical results are projected geospatially onto the IDW map (
Figure 11a), revealing that all samples are dispersed in class II. This means that surface water is suitable for irrigation, and long-term irrigation will not affect soil permeability.
Paliwal et al. [
114] developed the Magnesium Danger Index (MH) to assess the magnesium in irrigation water.Ca
2+ and Mg
2+, in general, keep the water balanced, although they behave differently in physiological systems. The high Mg
2+ content is usually due to the presence of replaceable Na
+ in the irrigated soil, which negatively affects soil quality and causes it to become alkaline due to the adsorption of large amounts of water between magnesium and clay particles, reducing the soil’s ability to infiltrate and crop production [
115].
The MH values in our study varied from 50 to 52.83%, indicating that only 15.38% of the water samples (QZ3, QZ11) had a value of more than 50, which might have a detrimental influence on agricultural output and soil alkalinity. However, most of the tested samples (84.63%) had MH values greater than 50 and were appropriate for irrigation. The IDW variants of MH values are depicted in
Figure 11c.
The Kelley index (KI) [
116] was used in the research region to assess irrigation water quality. The levels of Na
+, Ca
2+, and Mg
2+ in water are used to calculate the value of KI. A KI value >1 indicates that excess salt is hazardous for irrigation, but a KI value less than one indicates that water is good for irrigation [
59]. The observed KI values in our study varied from 0.04 to 0.79 meq/L, with a mean of 0.42 meq/L (
Table 7). According to Kelly’s analysis (
Table 8), the surface water at 13 locations was deemed enough for irrigation, and long-term irrigation will not negatively impact soil permeability potentially resulting from insufficient cation exchange, which results in a minor Na
+ surplus [
117]. The IDW differences in KI values are seen in
Figure 11b.
The irrigation water quality indicator is based on the ideal limits of nine indices: CE, Na%, PI, PS, KI, SAR, RSC, RSBC, and MH (
Table 7). The calculated IWQI ranges from 28.52 to 79.76, with an average value of 58.45 displayed in the graph (
Table 7). demonstrating that the surface water quality at this location is outstanding or acceptable and suitable for irrigation. According to the results, one of the thirteen water samples was exceptional, while the other twelve were good. The samples with the highest IWQI values are QZ7, QZ6, QZ8, and QZ13, which mostly belong to the hydrochemical types Ca
2+-Mg
2+-HCO
3−, which are close to Ca
2+-Na
+-HCO
3− (
Figure 4), indicating that Na
+ is the dominant factor affecting irrigation water quality in this area.
Table 8.
Classification of waters based on salinity hazard EC and SAR values and sodium hazard classes based on USSL classification [
118].
Table 8.
Classification of waters based on salinity hazard EC and SAR values and sodium hazard classes based on USSL classification [
118].
Index
Classification | Range | Reference | Range
(No. of Samples) | Remark on Quality | Water Type | Salinity Hazard
Class |
|---|
| Salinity | 100–250 | | - | Excellent | Low salinity water | C1 |
| hazard | 250–750 | | 301–524 (13 samples) | Good | Medium salinity | C2 |
| EC (μS/cm) | 750–2250 | [29] | - | Doubtful | High salinity water | C3 |
| | >2500 | | - | Unsuitable | Very high salinity | C4 |
| | <10 | | 0.18–2.51 (13 samples) | Excellent | Low sodium water | S1 |
| SAR | 10–18 | [105] | -- | Good | Medium Sodium | S2 |
| | 19–26 | | -- | Doubtful | High sodium water | S3 |
| | >26 | | -- | Unsuitable | Very high Sodium | S4 And S5 |
| | <20 | | 4.73–9.18 (4 samples) | Excellent | -- | -- |
| | 20–40 | | 23.33–39.90 (7 samples) | Good | -- | -- |
| Sodium (%) | 40–60 | [29] | 44.13–44.66 (2 samples) | Permissible | -- | -- |
| | 60–80 | | Nil | Doubtful | -- | -- |
| | >80 | | Nil | Unsuitable | -- | -- |
| | <1.25 | | Nil | Safe/Good | -- | -- |
| RSC | 1.25–2.5 | [110] | 1.71 (1 sample) | Marginal/Doubtful | -- | -- |
| | >2.5 | | 4.8–8.12 (12 Samples) | Unsuitable | -- | -- |
| RSBC | <0 | | Nil | | Non-alkaline | -- |
| | 0 | | Nil | | Normal | -- |
| | 0–2.5 | | 1.03–2.4 (4 Samples) | Satisfactory | Low alkalinity | |
| | 2.5–5 | [118] | 2.56–4.06 (9 Samples) | | Medium alkalinity | |
| | 5–10 | | Nil | Marginal | High alkalinity | |
| | >10 | | Nil | | Very high alkalinity | |
| | <3 | | 0.72–2.69 (6 samples) | Excellent | -- | -- |
| PS | 3–5 | [112] | 3.28–4.73 (7 samples) | Good | -- | -- |
| | >5 | | Nil | Unsuitable | -- | -- |
| | >75% | | Nil | Good | | |
| PI | 25–75% | [112] | 26.12–48.40 (13 samples) | Suitable | | |
| | <25% | | Nil | Unsuitable | | |
| KI | <1 | [116] | 0.04–0.79 (13 samples) | Suitable | -- | -- |
| | >1 | | Nil | Unsuitable | -- | -- |
| MH | <50 | [114] | 50 (11 samples) | suitability for irrigation | -- | -- |
| | >50 | | 50–52 (2 samples) | Unsuitable for irrigation | -- | -- |
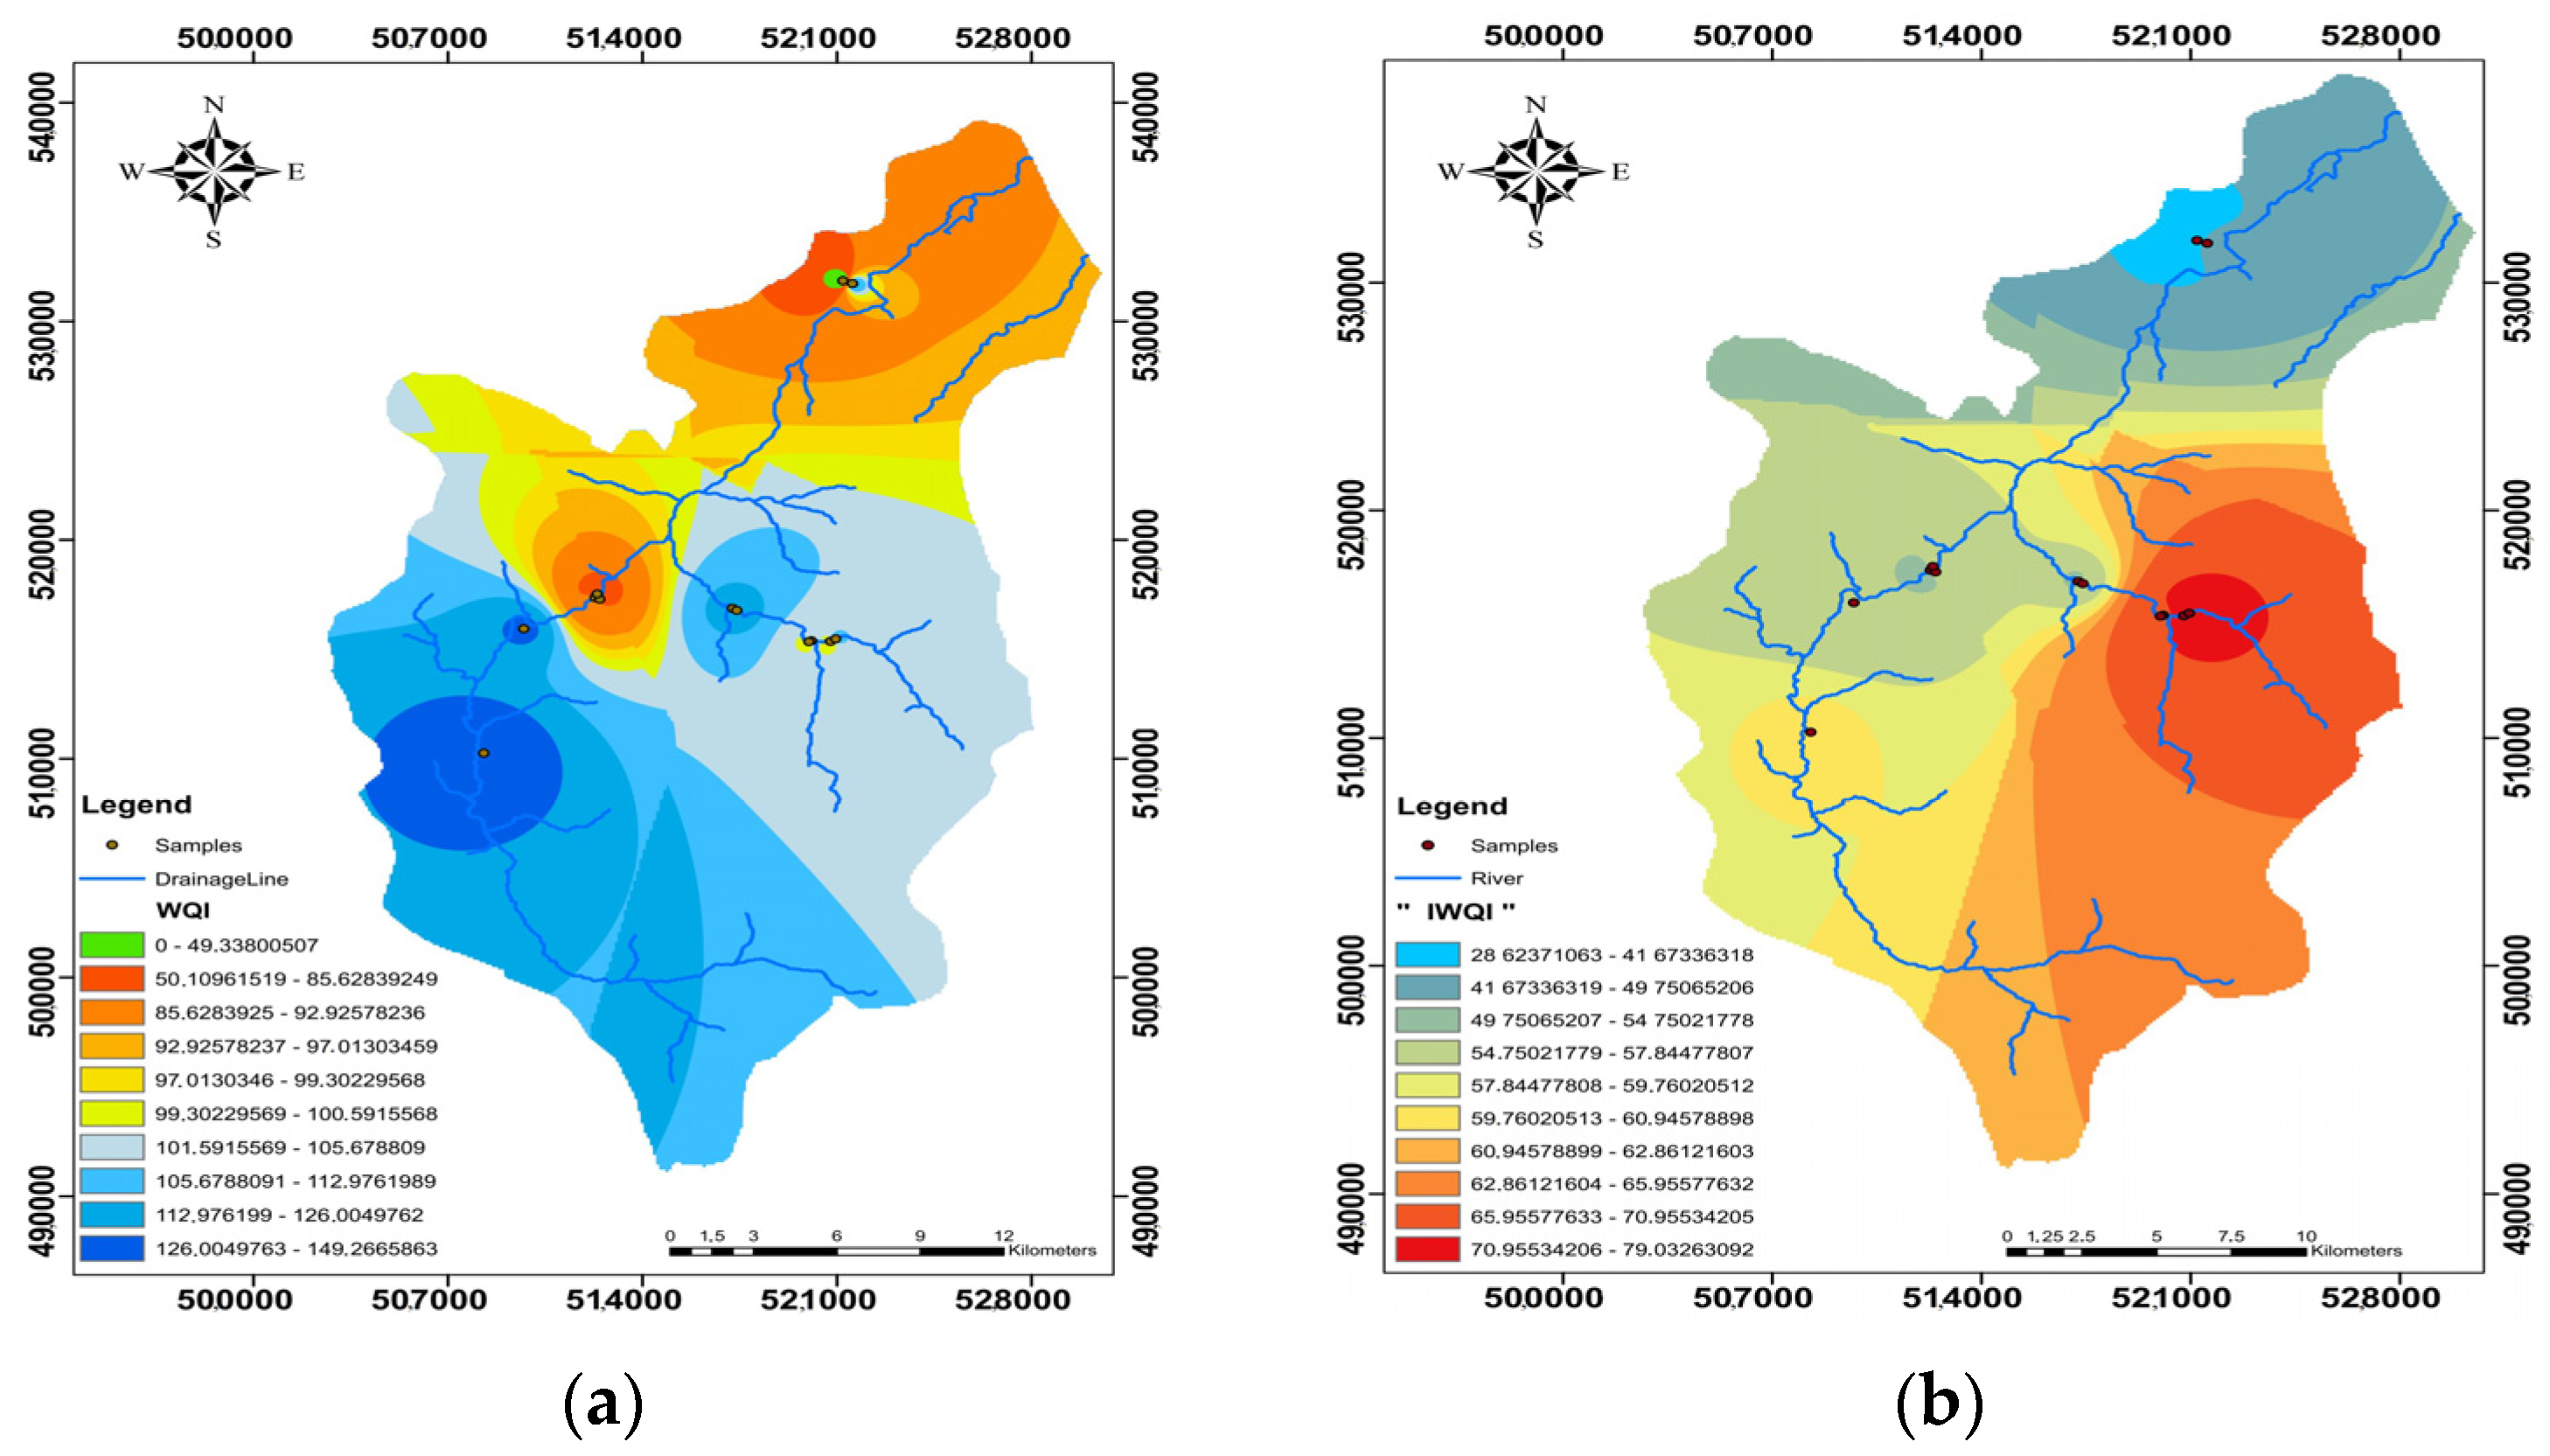
3.9. Spatial Division
To show the regional distribution of water quality at each site, the geospatial distribution maps of WQI and IWQI were created using the inverse interpolation technique (IDW) to produce a database of surface water quality for consumption and irrigation water in the study area (
Figure 12a,b). As a result, these maps have been proven beneficial and can be used to assess surface water quality and determine the best locations with the fewest dangerous pollutants [
60].
According to
Figure 12a, the water quality indices indicate that 7.69% of surface water samples were considered excellent for human consumption because of low local anthropogenic or agricultural activities, which are situated in the northwestern region (QZ11). In comparison, 38.46% of the samples were considered good quality in the central and western areas, especially the QZ1, QZ2, QZ3, QZ6, and QZ9 samples. However, because the zone is adjacent to anthropogenic activity, the water quality deteriorates with time because it is near irrigated fields, whereas 53.84 percent of the samples are considered poor quality in the central and southern parts of the zone study due to the influx of tourists as well as local residents.
According to
Table 9, the good water quality samples for irrigation are situated in the same area as the IWQ. The eastern and southern sections, as well as the center part, are dominated by high-quality water. The research region has a sub-humid climate with substantial winter precipitation, resulting in low evaporation as the primary factor affecting surface water chemistry. Anthropogenic inputs significantly influence the central area, particularly through the discharge of untreated wastewater. In numerous places, little trenches containing untreated sewage may be seen, through which effluent is leached into the river.
These operations have contaminated sample numbers QZ4, QZ5, QZ7, and QZ8. Before the area’s tourism operations, the water was utilized for drinking, but it is now solely used for residential and agricultural purposes. During the rainy season, effluents are dumped into natural drains and precipitation, damaging surface water supplies.
The southern portion is the most impacted by agricultural runoff and human activity due to the prevalence of agricultural land and wastewater from the cities of Chefchaouen and Dchar Akarat. As sample number QZ13 in Dchar Akarat is characterized by increased concentrations of nitrates, potassium, and chloride, which are likely contributed by sources of rock nature or domestic wastewater, there is a need to control the discharge of anthropogenic effluents affecting surface water quality in this area.


 ,
, 


