Article

An Assessment of the Water Resources Carrying Capacity in Xinjiang

1
Institute of Geographic Sciences and Natural Resources Research, Chinese Academy of Sciences, Beijing 100101, China
2
Key Laboratory of Water Cycle & Related Land Surface Processes, Chinese Academy of Sciences, Beijing 100101, China
*
Author to whom correspondence should be addressed.
Water 2022, 14(9), 1510; https://doi.org/10.3390/w14091510
Submission received: 14 February 2022 / Revised: 25 April 2022 / Accepted: 6 May 2022 / Published: 9 May 2022
(This article belongs to the Section Water Resources Management, Policy and Governance)

Abstract

:
The water resource shortage is a crucial factor in restraining the development of society and the economy in Xinjiang, where there is drought and little rain. The assessment of the water resources carrying capacity (WRCC) is a prerequisite for socioeconomic sustainable development in Xinjiang. In this paper, a convenient and effective model is established for assessing the WRCC under the influence of social welfare and water use efficiency. Meanwhile, a pedigree chart for WRCC is put forward. Then the developed approach is applied to investigate the sustainable utilization of water resources in Xinjiang. The results indicate that the WRCC of Xinjiang is not overloaded in 2018. The status of the WRCC is worse in northern Xinjiang than in southern Xinjiang, especially in Karamay, Shihezi, and Urumchi. The areas with potential water resource exploitation in Xinjiang are mainly located in the Yili Kazak Autonomous Prefecture and Altay Prefecture. The efficiency of agricultural water use is of vital importance to the WRCC in Xinjiang. The WRCC of Xinjiang can be improved by saving agricultural water, water recycling, and optimizing industrial structures. The maximum population carried by the water resources in Xinjiang is predicted to be 33.63 million and 35.80 million in 2035 and 2050, respectively. The assessment of the WRCC provides a valuable reference for the sustainable utilization of water resources in Xinjiang.

1. Introduction

Water is not only essential for human survival and development but also an indispensable resource for maintaining the functions of natural ecosystems and supporting socioeconomic development. With population growth and economic rapid development, the water demand has gone beyond regional water availability and results in severe water scarcity [1]. The water shortage issue has seriously restricted socioeconomic sustainable development [2]. Due to China’s rapid socioeconomic development and an increasing population, the demand for water resources and the imbalance between the supply and demand for water resources are increasing at a striking rate. Particularly, in Northwestern China, which has a dry climate, severe water shortage, and a fragile ecosystem, water scarcity has become the major constraint for socioeconomic development [3,4]. Coordinating the relationships between water resources, the population, the economy, and society is the precondition of socioeconomic sustainable development [5]. The water resources carrying capacity (WRCC) is an important indicator to measure the sustainable development of regional water resources and socioeconomic development and reflects the supportive capability water resources provide for the socioeconomic development [6]. The assessment of WRCC is helpful in providing decision support for the sustainable development of water resources and coordinating the relationship between regional water resources and socioeconomic development [7]. As a basic topic in the study of sustainable development and water security strategy, the WRCC has drawn wide attention in academia and is becoming a hot topic in water resource science research [8]. Shi et al. [9] proposed the concept of the WRCC in China. Since then, great progress has been made in researches on the WRCC; however, the theoretical systems and methodological systems of the WRCC have not yet been generally accepted [10]. Ren et al. [11] introduced a conceptual model of biological metabolism and deemed that water resources, as an input resource, were exported in the form of products, services, and pollutants after being consumed in socioeconomic systems. Then the WRCC was assessed by using the model at the regional level from the perspectives of the water resource system, the socioeconomic system, and ecosystems. Zhao et al. [12] employed the theory of pressure and support, destruction and restoration, degradation, and promotion (PS-DR-DP) to develop an indicator system for the WRCC; a geographically temporally weighted regression model was adopted to evaluate the WRCC in the Beijing-Tianjin-Hebei region and indicated that the water resources were in an overloaded state in over 50% of the cities in this region. The above studies on the WRCC were all based on index systems, whereas the selection of indicators was highly subjective. Considering the relationship between water resources, society, the economy, and the ecological environment, Yang et al. [13] employed an Analytical Hierarchy Process (AHP) and System Dynamics (SD) to simulate scenarios of the WRCC in Xi’an, a city in China; the results indicate that the WRCC in 2020 was increased by 48% in integrated scenarios than the conventional scenario. Despite the SD reflecting the mutual feedback among water resources, society, the economy, and the ecological environment, a mass of historical data and parameters are needed, and the calculation is also complex. In general, the research achievements of WRCC can be categorized into the following three aspects: (1) it is the greatest support capacity that water resources can provide for economic and social development [14]; (2) it is the maximum available water exploitation scale for economic and social development [15]; (3) it is the largest population or economic capacity that water resources can bear [16]. In brief, from all these aspects, water resources are regarded as a significant factor supporting the development of society and the economy. The WRCC is closely related to socioeconomic development level and technological advancement. The core issue of the WRCC is to determine the scale of socioeconomic development given a certain amount of available water resources based on a certain water-resource development stage and a certain environmental protection goal [17]. Environmental protection can be achieved by assigning a high priority to water use for ecosystems, and the exploitation and development of water resources can be measured using the technical level of social development and social welfare. The technical level is a comprehensive reflection of the industrial structure, water use efficiency, and social welfare, which can be represented by GDP per capita [18]. The WRCC can be evaluated by the optimization of the system, which is composed of water resources, society, and the economy. However, the goal in the process of optimization of the WRCC is often not very clear. The economic scale is only an intermediate medium, and the population is the final bear object of water resources; therefore, the maximum population is taken as an optimal object to assess the WRCC.
The potential carrying capacity of the water resources of Xinjiang has always been a topic of general interest in academia. As early as 1989, the water resources soft science research group of Xinjiang [19] started the investigation of regional water resources, their carrying capacity, as well as a development strategy. Zhou et al. [20] and Wang et al. [21] assessed the WRCC of Xinjiang based on the available water resources, respectively. They considered that the exploitation potential of water resources in Xinjiang lay in the water-saving potential in agriculture, the water diversion potential from the Yili river and Irtysh river, and the exploitation potential of groundwater. The Yili river and the Irtysh river are all international outbound rivers, and the impact of the development and utilization of these rivers on the WRCC in Xinjiang should be further investigated. The above research lacked an analysis of the spatial pattern of the WRCC in Xinjiang. Xinjiang covers a vast area of 1.66 million km2, and water resources and their economic and social-spatial distributions differ markedly across the region. Hence, the assessment of the WRCC in Xinjiang and analysis of its spatial distribution is of great practical significance for the regional society and economic development. Additionally, the WRCC is closely related to the economic, social, and technological development levels, as well as social welfare and water use efficiency; however, previous researches lacked relevant analyses. Therefore, the main objectives of this paper are as follows: (1) to establish a convenient and effective approach based on an analysis of the water resources system, which can compute the maximum socio-economic scale carried by the regional water resources under a different scenario. The maximum population is taken as the objective, the water use efficiency, and social welfare are taken as the constraints; (2) to evaluate the current WRCC in Xinjiang and put forward the maximum population carried by regional water resources in the planning-level year; (3) to analyze the influence on the WRCC by the outbound water resources, social welfare, and water use efficiency, so as to provide a valuable reference for authorities and managers involved in water resources in Xinjiang.

2. Material

Xinjiang is located in Central Eurasia of China and possesses a dry climate and low precipitation. A total of 570 rivers are distributed in this area. The annual total amount of water resources does not change much annually, and the annual average runoff of rivers is approximately 80 billion m3. The relative amount of water resources is relatively more in Xinjiang; however, the absolute amount of water resources is quite less. The water yield per unit area in this region is 50,000 m3/km2, which is only one-sixth of the national average level [22]. Meanwhile, the water resources per unit area of cultivated land are 20,000 m3/hm2, which is close to the national average level. Xinjiang is divided into northern and southern Xinjiang, with the Tianshan Mountains as the boundary and the regional water resources being split almost evenly between the two areas. Xinjiang’s water resources are unevenly distributed in space. The surface water resources in northwest Xinjiang are about 93%, while those in the southeast are only 7% [21]. The multi-year average volume of available surface water is 52.22 billion m3, of which outbound water resources account for 22.62 billion m3, exploitable groundwater resources for 15.32 billion m3, and the repeated amount of available surface groundwater resources for 7.865 billion m3; the multi-year available water resources in Xinjiang excluding unavailable water resources and ecological and environmental water demand are 59.68 billion m3 [23,24]. In 2018, the overall water resources in Xinjiang were 85.88 billion m3, which belongs to a normal water year. Surface water resources were 81.78 billion m3, groundwater resources were 49.7 billion m3, and the repeated water resources between them were 45.6 billion m3 [25]. In 2018, the overall water use in Xinjiang was 54.88 billion m3, and the exploitation rate was 65.9%, which is higher than the internationally recognized warning level of 40% [26]. Agriculture plays an important role in the socioeconomic development in Xinjiang. Although the primary industry proportion has been declining since 1980, so far, agriculture production remains a dominant part of Xinjiang. The primary industry proportion of Xinjiang was 13.9% in 2018 [27], which is higher than the national average level of 7.2%. The problem of agricultural water occupying the ecological environment water is prominent of Xinjiang, and the capacity of the water resources carrying in some regions is at risk of overloading. The carrying capacity of water resources in Xinjiang is at risk of severe overloading, and water resources have become a bottleneck for the region’s socioeconomic development; therefore, the research of the WRCC in Xinjiang is of urgent importance for the sustainable development of this region.

3. Methodology and Data

3.1. Model for the Assessment of WRCC

The WRCC focuses on the supporting capacity of water resources for economic and social development with water resources as the constraint. Such research involves investigating whether water resources can satisfy economic and social development after reaching the water requirements of ecosystems. In this paper, the system analysis theory was adopted to study the WRCC in Xinjiang. After meeting the water demand of ecosystem, an optimal model was established to assess the water carrying capacity. The maximum population was taken as the object function, and water use efficiency and social welfare were set as the constraints. The related equations are given as follows:
max Pop
Subject to the following:
Total_WatUse ≤ Wat_avail × P + Wat_recy
Total_WatUse = Dom_WatUse + Ind_WatUse + Agr_WatUse
Dom_WatUse = Pop × Quota_Dom
Ind_WatUse = GDP × Rate_Ind_GDP × Quota_Ind
Agr_WatUse = Grain_yield × Rate_irrg_area/Grain_per_Wat
GDP_per_Pop = GDP/Pop ≥ MinGDP_per_Pop
Grain_per_Pop = Grain_yield/Pop ≥ MinGrain_per_Pop
where Pop is the population carried by water resources, 104 persons; Total_WatUse is the total water use, 104 m3; Wat_avail is the available water resources, 104 m3; Wat_recy is the recyclable water resources, 104 m3; Dom_WatUse is the domestic water use, 104 m3; Ind_WatUse is the industrial water use, 104 m3; GDP is the Gross Domestic Product, 104 CNY; Agr_WatUse is the agricultural water use, 104 m3; Quota_Dom is the domestic water use per capita, m3/day; Rate_Ind_GDP is the rate of increase in industrial value in GDP, %; Quota_Ind is the industrial water consumption per industrial value-added, m3/104 CNY; Grain_yield is the grain yield, 104 tons; Rate_irrg_area is the rate of the irrigated land area in the cultivated land area, %; Grain_per_Wat is the grain yield per cubic meter of irrigation water, kg/m3. GDP_per_Pop is the GDP per capita, 104 CNY/capita; MinGDP_per_Pop is the minimum GDP per capita, 104 CNY/capita; Grain_per_Pop is the grain yield per capita, 104 ton/capita; MinGrain_per_Pop is the minimum grain amount per capita, 104 ton/capita. The meanings of the main parameters are as follows:

3.1.1. Available Water Resources

The available water resources are the total water resources exclusive of ecological and environmental water demand (inside and outside river courses) and are used for human production and daily life, meanwhile, recycled water also being considered. Water from natural waters is not completely consumed and part of it is returned to natural waters (e.g., water returned during irrigation); the returned water can be reused in the downstream areas for irrigation. Therefore, the available water resources are equal to the utilizable water resources multiplied by the multiple of repeated water use. The multiple of repeated water use is negatively correlated with the water consumption rate. As the upstream water use efficiency increases, the amount of returned water will gradually decrease, and the water consumption rate will slowly increase. Since Xinjiang is located in Northwest China, a significant amount of leaked water will not return to natural waters. The mobility of regional water resources is low, and the returned water resources are lower than those in inland areas; therefore, the water reuse coefficient was taken as 1.05 due to the surface water return ratio being usually 4~8% [28,29].

3.1.2. Domestic Water Use per Capita

The domestic water use per capita is equal to the ratio of domestic water use to the total population, and it is one indicator used to measure the human life standard. The larger the domestic water use per capita is, the higher the standard of living will be. The domestic water consumption per capita in a planning-level year is predicted according to the current state of regional domestic water use and its tendency.

3.1.3. The Rate of Industrial Value-Added in GDP

The rate of industrial value-added in GDP is a vital index used to judge the industrial development level in a region. As the industrial water use efficiency is usually higher than the agricultural water use efficiency. The larger the ratio of the industrial value-added is to the total economic output value, the higher the degree of industrialization will be in the area, and thus the higher the social water use efficiency will be. The rate of industrial value-added in GDP in a planning-level year can be estimated based on industrialization development and the economic and social development plan.

3.1.4. Industrial Water Consumption Per Industrial Value-Added

The industrial water consumption per industrial value-added is the ratio of industrial water consumption to the industrial value-added and represents an important index for the industrial water use efficiency in region. In 2018, the industrial water consumption per industrial value-added in Xinjiang was 33.6 m3/104 CNY [25], and due to the improvement in industrial technology and increasing water conservation, the industrial water consumption per industrial value-added is predicted to decrease in the future.

3.1.5. Grain Yield per Cubic Meters of Irrigation Water

The grain yield per cubic meter of irrigation water is the ratio of the grain yield to irrigation water, and it indicates the agricultural water use efficiency. The higher the grain yield per cubic meter of irrigation water is, the higher the food security will be, and vice versa. The grain yield per cubic meter of irrigation water is influenced by numerous factors including climate, soil, and landforms. In 2018, the grain yield per cubic meter of irrigation water in Xinjiang was only 0.438 kg/m3 [27], which is significantly lower than the national average in China.

3.1.6. GDP per Capita

The GDP per capita is used to measure the standard of social welfare; the larger the GDP per capita is, the higher the standard of social welfare is. In 2018, the GDP per capita in Xinjiang was 48,600 CNY. With the development of society and economy, the GDP in Xinjiang is expected to steadily increase in the future. Based on the current GDP per capita and the development tendency of society and economy in China and northwest region, the GDP per capita in Xinjiang in planning year can be predicted. Hence, the carrying conditions in different planning years can be determined.
The presented model is a linear optimization problem, which can be solved by using a computer program. In this paper, the Matlab function “linprog ( )” was adopted to build a computer program and solve the optimum solution. For the constantly available water resources, each combination of water use efficiency (domestic water use per capita, industrial water consumption per industrial value-added, and grain yield per cubic meter of irrigation water) and social welfare data (GDP per capita) may result in a different WRCC (i.e., the population carried by water resources) using the assessment model.
Figure 1 shows the relationships between the maximum population and GDP per capita under different water use efficiencies (Quota_Dom, Quota_Ind, Grain_per_Wat). In each line, the maximum population carried by water resources in Xinjiang decreased as GDP per capita increased. Under the same GDP per capita, the maximum population in Xinjiang increased as domestic water use per capita decreased, showing that an increase in water use efficiency led to a great increase in WRCC or the maximum population. This also demonstrated the significant influence of GDP per capita and water use efficiency on the WRCC, showing that the WRCC depended on GDP per capita and water use efficiency and exhibited a large range.

3.2. Data Sources

The data related to water resources used in this paper, which include precipitation, water resources, and water use, were obtained from the [25]. Water requirements of ecosystem, inbound and outbound water resources, and available water resources were acquired from Deng et al. [23] and Zhang et al. [24]. Population, GDP, industrial structure, cultivated land, and grain yield were obtained from the [27].

4. Results and Analysis

4.1. WRCC under the Status Quo

In 2018, the total population of Xinjiang was 24.868 million, its GDP was 121.99 billion CNY, and its total grain yield was 149.26 million tons. The total water consumption was 54.88 billion m3, of which agricultural water use accounted for 89.4%; the water resources from surface water were 44.59 billion m3, the water resources from groundwater were 10.13 billion m3, reclaimed water use was 161 million m3, and the water recycling rate was 13.3%. The actual water irrigation per acre was 535.9 m3, which was higher than the national level by 46.8%; industrial water consumption per industrial value-added was 33.6 m3/104 CNY, which was close to the national average in China. Based on the available water resources, technical level, and social welfare, the population and economic scale that the water resources of Xinjiang could carry in 2018 were calculated by using Equations (1)–(8). The results are shown in Table 1.
The maximum population carried by water resources in Xinjiang in the 2018 year was 31.6 million. The uneven distribution of the water resources and available water resources in the region has also resulted in an uneven distribution of the WRCC. The water resources in Yili Prefecture are relatively abundant, and the regional ecosystem is also relatively healthy; therefore, the population carried by water resources was also the highest in this area, which was about 7.71 million and accounted for 24.4% of the total carried population of Xinjiang. The area in Xinjiang with the second-highest water resources was Kashgar Prefecture, with a population carried by water resources of 5.01 million, accounting for 15.9% of the total carried population of the region. Meanwhile, in Karamay, which has a serious water resource shortage and intense human activity, the population carried by water resources was the smallest of any area in Xinjiang, which was only 230,000, which comprises 0.7% of the total population carried by water resources. The area with the second-smallest population carried by water resources in Xinjiang was Shihezi, which had a population of 440,000 and constituted about 1.4% of the total population carried by water resources. The GDP carried by water resources of Xinjiang in the 2018 year was 1.93 trillion CNY; 633.1 billion CNY of this came from Yili Prefecture, which was the largest contribution of any area in Xinjiang and accounted for 32.8% of the total GDP carried by water resources in the region; the second-largest contribution came from Urumchi, which had a GDP carried by water resources of 253.3 billion CNY, accounting for 13.1% of the total GDP carried by water resources of Xinjiang. The lowest GDP carried by water resources was in Turpan, which was 26.6 billion CNY and accounted for 1.4% of the total GDP carried by water resources in Xinjiang. Based on the population in the 2018 year and the calculated population carried by the water resources, the Population Overloading Index of water resources in each area in Xinjiang was obtained, as given in Table 2.
The average Population Overloading Index of water resources in Xinjiang was found to be 0.72, suggesting that the region’s water resources are not in an overloaded state; however, serious overloading was observed in individual areas. The areas with the most serious overloading were Karamay and Shihezi, with an overloading index of over 1.30; these areas are also the most economically developed in Xinjiang. In 2018, the population in Karamay was 307,000, and the population carried by water resources was only 230,000, which was higher than the maximum population that can be carried by water resources. Thus, Karamay was in an extremely serious overloading state (Population Overloading Index > 1.30). In 2018, the GDP of Karamay was 89.81 billion CNY and the economic scale carried by water resources was 66.8 billion CNY. In 2018, the population of Shihezi was 592,000, while the population that could be carried by the water resources was 440,000; in the same year, the area’s GDP was 35.96 billion CNY and the economic scale carried by water resources was 31.2 billion CNY. Therefore, Shihezi was also in an extremely serious overloading state. Additionally, Urumchi and Turpan had a Population Overloading Index of between 1.22 and 1.17, respectively, indicating that they were in a critical overloading state (Population Overloading Index of 1.0–1.2). Therefore, more water resources should be allocated to these areas to meet the water demand of socioeconomic development. The spatial distribution of the population overloading index of WRCC of Xinjiang in 2018 was shown in Figure 2.

4.2. WRCC in Planning-Level Years

Based on the standard of life welfare and water use technology in the 2018 year and given the projected future improvement in technology, it was predicted that, by 2035, the domestic water use per capita in Xinjiang can be increased to 65 m3/capita, the industrial water consumption per industrial value-added can be reduced to 24 m3/104 CNY, the grain yield per cubic meter of irrigation water can be increased to 0.529 kg/m3, and the annual reclaimed water use can reach 1.09 billion m3. Meanwhile, it was found that, by 2050, the domestic water use per capita can be increased to 72 m3/capita, the industrial water consumption per industrial value-added can be reduced to 16 m3/104 CNY, the grain yield per cubic meter of irrigation water can be increased to 0.553 kg/m3, and the annual reclaimed water use can be increased to 2.17 billion m3. The maximum population and economic scale that can be carried by water resources in each area in Xinjiang are given in Table 3.
It is predicted that, by 2035, the maximum population that can be carried by water resources in Xinjiang will reach 33.63 million. Of this population, Yili Prefecture accounts for the largest share, namely, 8.14 million, representing about 24.2% of the expected total population carried by water resources in Xinjiang in 2035. The second-largest share (5.32 million; 15.8% of the expected total population carried by water resources in 2035) is contributed by Kashgar Prefecture. Meanwhile, the lowest share is Karamay (280,000; 0.8% of the expected total population carried by water resources in 2035). By 2050, the population carried by water resources in Xinjiang is expected to be 35.8 million. Of this population, Yili Prefecture accounts for the largest share, namely, 8.52 million, representing about 23.8% of the expected total population carried by water resources in 2050. The second-largest share (5.5 million; 15.3% of the expected total population carried by water resources in 2050) is in Kashgar Prefecture. The lowest share is Karamay (350,000; 1.0% of the expected total population carried by water resources in 2050). Kashgar and Hotan account for a large percentage of the population that can be carried by the water resources in Xinjiang; however, their population overloading indices are close to the critical values, so large-scale water withdrawal for socioeconomic development is not suitable in these areas. In the future, the areas with greater water resources carrying potential capacity are Yili and Altay in Xinjiang.
Furthermore, it was predicted that, by 2035, the economic scale carried by water resources in Xinjiang will reach 3.4454 trillion CNY and the GDP per capita will reach 102,000 CNY. Meanwhile, the economic scale carried by water resources is expected to be the largest in Yili Prefecture, where water resources are relatively rich; the predicted value is 912.6 billion CNY, which accounts for 26.5% of the total predicted economic scale carried by water resources in Xinjiang in 2035. Furthermore, in Urumchi (the political, economic, and cultural center of Xinjiang), the economic scale carried by water resources is predicted to be relatively high (11.7% of the total predicted economic scale carried by water resources in Xinjiang in 2035), and the GDP per capita is predicted to be 204,000 CNY in 2035. Moreover, Karamay (an important national petrochemical base and a new industrial city being built in Xinjiang) is predicted to have an economic scale carried by water resources of about 83 billion CNY and a GDP per capita of 295,000 CNY in 2035. By 2050, the economic scale carried by water resources in Xinjiang is predicted to be 4.4536 trillion CNY, the regional socioeconomic development is expected to be further improved, and the GDP per capita is predicted to be 124,000. Yili Prefecture is predicted to still have the largest economic scale carried by water resources, accounting for 25.3% of the total predicted economic scale of Xinjiang in 2050. In the same year, the second-highest contribution is predicted to come from Urumchi, representing 11.9% of the total predicted economic scale of Xinjiang.
In summary, the results of this research indicate that the WRCC in Xinjiang remain has the potential capacity, mainly in Yili Prefecture and Altay Prefecture. Additionally, this research also suggests that water resources are currently overloaded in some areas of Xinjiang. The reason for the overloading of water resources in northern Xinjiang is mainly the overuse of water resources resulting from human activities; this is particularly evident in areas such as Karamay and Shihezi, where dense populations, advanced economies, and higher water demand from activities related to production and household use. Although the WRCC in Southern Xinjiang is not currently overloaded, the ecosystem in this region is very fragile due to water resource shortages and high demand for eco-environmental water use. In Southern Xinjiang, the socioeconomic scale carried by water resources is highly limited and the Population Overloading Index of water resources is close to its critical value. Meanwhile, in Kashgar and Aksu, the large-scale development and utilization of water resources are not suitable without trans-basin water transfer.

5. Discussion

The WRCC is related not only to the available water resources but also to water resources policy and water use efficiencies in different social and economic sectors; thus, it is a complex system. The factors influencing the WRCC come from nature, society, and the economy. Some major factors affecting the WRCC in Xinjiang are discussed in this section.

5.1. Optimization Model for the Assessment of the WRCC

In this paper, an optimization model based on the coupling between water resources, society, and the economy was built for the assessment of the WRCC in Xinjiang, with the maximum population carried by the water resources as the objective. The model also provides a convenient and fast method for the assessment of the WRCC in other regions. Compared with the simulation of the supply and demand of the water resources system for calculating the carrying capacity, this model has a simple structure and fast calculation speed. The WRCC varies under the different technological and social welfare levels. According to the pedigree chart in Figure 1, the WRCC can be presented under different conditions, and the socioeconomic scale carried by regional water resources can also be put forward, which provides a practical guide for coordinating water resources and socioeconomic development. When water resources are constant, ecological water requirements determine the available water resources that are for societal and economic activities, and thus ecological water requirements influence the socioeconomic scale carried by water resources. The annual average available water resources in Xinjiang are 59.68 billion m3, excluding unavailable water resources and ecological and environmental water demand. In this paper, the sum of available water resources and recyclable water resources is taken as the constraint to total water use. Therefore, to simplify the model, in this research the ecological water requirement was taken as a constant value, i.e., the requirement was not changed in different planning-level years. Furthermore, the changing ecological water requirements under different scenarios should be put into research.

5.2. The Impact of Outbound Water Resources Exploitation on the WRCC in Xinjiang

Water resource shortages are the main factor affecting the WRCC in Xinjiang. Despite the total water resources in Xinjiang are abundant, and the region’s water resources per capita are also high, the water resources per unit of land area in Xinjiang are much less than the national average level. The total control indexes of “Highly Stringent Water Resources Management Measures” in China (Three Red Lines) for Xinjiang are between 51.597 and 52.674 billion m3 between 2020 and 2030, respectively; however, the current annual water consumption has already exceeded the total control indexes of “Three Red Lines”. Owing to the region’s natural and geographical conditions and its high degree of evaporation, water resources in Xinjiang possess a unique spatial distribution. The spatial distribution of water resources is extremely uneven; the matching degree between water resources and land resources is very low, resulting in a significant spatial variation in the development and utilization of water resources. The total amount of water flowing into Kazakhstan from the Yili River, Emin River, and Irtysh River in the Ili Kazakh Autonomous Prefecture is about 22.16 billion m3 per year; accounting for 25% of the total river runoff in Xinjiang. Under the same standard of living and the same level of water use technology, if 10% of the development of outbound water resources were reduced, the available water resources in Xinjiang would be decreased to 57.63 billion m3; in this case, the maximum population carried by water resources in Xinjiang would be between 32.41 and 34.52 million in between 2035 and 2050, respectively; if 20% of the development of outbound water resources are reduced, the available water resources in Xinjiang would be 55.37 billion m3, the maximum population carried by water resources, in Xinjiang would be between 31.18 and 33.24 million in between 2035 and 2050, respectively; if 30% of the development of outbound water resources are reduced, the available water resources in Xinjiang would be 53.11 billion m3 and the population carried by water resources in Xinjiang in between 2035 and 2050 would be between 29.95 and 31.96 million, respectively. Hence, the development of outbound water resources of international rivers has an important effect on WRCC in Xinjiang. At the same time, it is noteworthy that the development of outbound water resources involves dealing with issues related to international rivers, and therefore the interests of upstream and downstream parties should be considered in their entirety, and development and utilization should be conducted in a scientific and proper way.

5.3. The Impact of Technical Advancement on the WRCC

Technical advancement is an important indicator for measuring the regional development scale and reflects economic and social progress. The difference in technology of exploitation and development of water resources determines the quantity and efficiency of the available water resource diversity and results in a difference in the regional WRCC. For example, different irrigation patterns in agriculture lead to different amounts of water resource consumption, which further causes differences in agricultural water use efficiency. Meanwhile, due to the differences in technological levels between enterprises, the industrial water consumption efficiencies and the amounts of water resource consumption for the industry also differ. Agriculture is the main industry in Xinjiang, and the average annual agricultural water use has accounted for 90% of this region’s total water use. It is crucial to enhance the technological level and efficiency of agricultural water use to improve the WRCC in Xinjiang. The level of agricultural water-saving technology in Xinjiang is already the highest of any region in China, with the region’s annual water-saving irrigation area accounting for 58.4% of its total irrigation area. The saving water technologies in Xinjiang include spray irrigation, micro-irrigation, low-pressure irrigation, and other engineering water-saving. The proportion of each type of saving water irrigation area to the total saving water irrigation area is 0.9%, 88.5%, 3.0%, and 7.6%, respectively [30]. Since Xinjiang is located in the northwest of China, which suffers from drought and receives little rain, its agricultural development depends heavily on irrigation. The grain yield per cubic meter of irrigation water is relatively low in Xinjiang, with a value of 0.438 kg/m3; however, the average value is 0.561 kg/m3 in China [31]. The agricultural irrigation technology is gradually improving in Xinjiang. With the increase in the utilization coefficient of irrigation water in Xinjiang, the grain yield per cubic meter of irrigation water will increase in the future. If grain yield per cubic meter of irrigation water can be raised between 0.567 kg/m3 and 0.593 kg/m3 by 2035 and 2050, the maximum population carried by the water resources in Xinjiang will reach between 35.82 and 38.11 million in these years, respectively. Hence, improving agricultural water use efficiency is critical to increasing the WRCC in Xinjiang. The industrial value-added in Xinjiang is rising in a fluctuating manner, with an average annual growth rate of about 14.3%; however, the region’s industrial water use has been reducing since it reached its peak of 1.33 billion m3 in 2014, which is due to the improvement in industrial water use efficiency. The water consumption per industrial value added in Xinjiang decreased from 129.0 m3/104 CNY in 1997 to 33.6 m3/104 CNY in 2018, a reduction of 73.9%. During this period, the reduction of water consumption per industrial value added alleviated the expansion of industrial water demand.

5.4. The Impact of Social Welfare and Industrial Structure on the WRCC

Social welfare and industrial structure determine the demand amount and use pattern of water resources. The higher social welfare is, the greater the demand for water resources and the more pressure water resources bear. The social welfare level can be indirectly represented by GDP per capita, which is used to reflect the progress of society and the economy. The higher the social welfare level is, the larger the GDP per capita is, the more water demand for the development of society and the economy will be, and thus the pressure on the water resource system will also be higher. According to the pedigree chart of the WRCC, when other factors remain constant, as GDP per capita increases, the population carried by the water resources will decrease. In 2018, under the grain yield per cubic meter of irrigation water, technological level, and economic level remain constant, the population carried by the water resources in Xinjiang will be reduced from 29.37 million to 28.64 million if the GDP per capita increases from 50 thousand to 100 thousand CNY. Meanwhile, the population carried by the water resources will be reduced to 27.93 million if the GDP per capita increases to 150 thousand CNY. The industrial structure determines the water consumption structure, which in turn directly influences the overall water use efficiency of the whole society. Since the marginal benefits of agricultural water are lower than those of industrial water and water for services, for achieving the same social and economic output value, the higher the percentage that primary industry contributes to GDP, the lower the water use efficiency of the whole society will be and the greater the pressure on water resources will be. Although the primary industry possesses a large portion of the GDP in Xinjiang, this protion is gradually decreasing with socioeconomic development. The ratios of primary, secondary, and tertiary industries changed from 26.9:37.1:36.0 in 1997 to 13.9:40.3:45.8 in 2018, demonstrating optimization of the industrial structure. Additionally, the water use per GDP decreased from 4224 m3/104 CNY in 1997 to 449.8 m3/104 CNY in 2018, which demonstrates a certain improvement in the WRCC in Xinjiang. In China, the available water resources, social welfare, and water use efficiency are various in different regions. In this paper, the maximum population carried by regional water resources is simultaneously influenced by the above factors. The more available water resources, higher water use efficiency, lower GDP per capita, the more population carried by regional water resources.

6. Conclusions

Xinjiang possesses a wide territory and rich resources. Due to its unique geography and water resources, the water is of considerable importance for the region’s socioeconomic development, ecosystem construction, and environmental protection. Therefore, water resources are a critical factor in restricting socioeconomic development in Xinjiang. Research on the WRCC is the prerequisite and basis for sustainable development of society and the economy in Xinjiang. In this paper, the WRCC in Xinjiang was investigated and discussed from the perspective of system analysis. The main conclusions are summarized as follows:
(1)
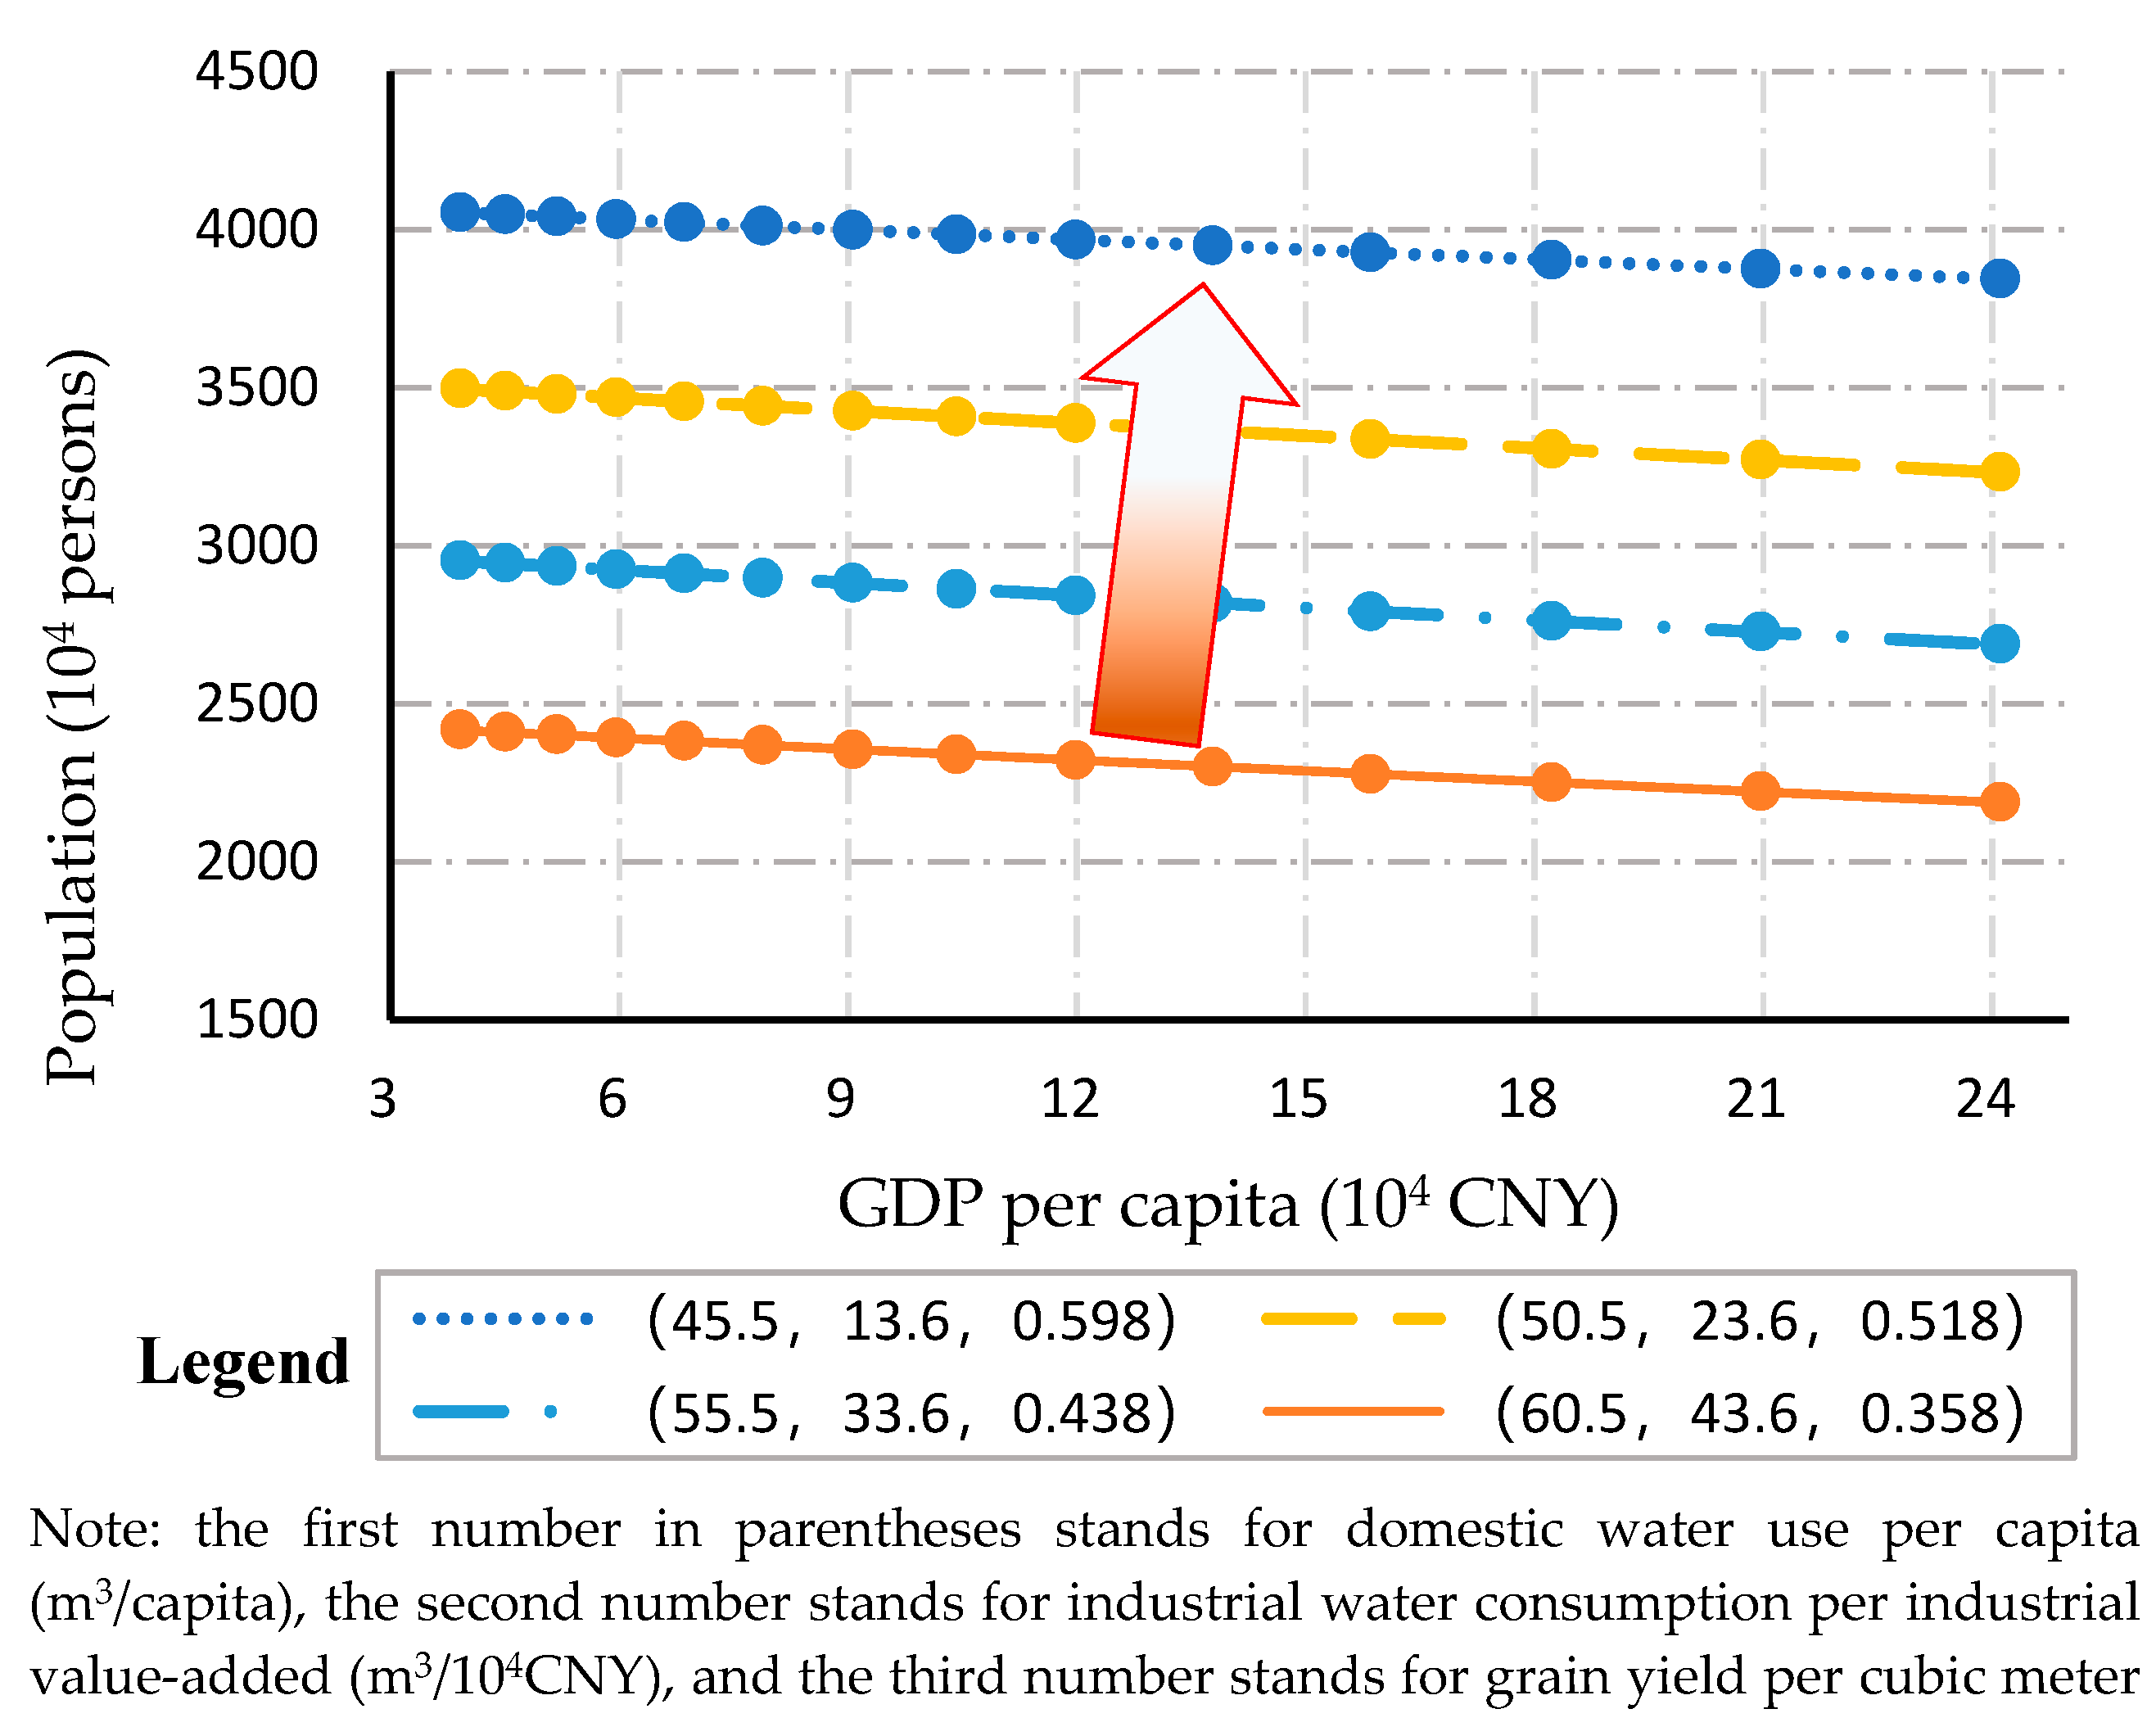
An assessment model for the WRCC in Xinjiang was established from the perspective of the relationship between water resources, society, and the economy. Meanwhile, a pedigree chart for WRCC was put forward. The WRCC is affected by the standards of social welfare and water use efficiency. In Xinjiang, water consumption for socioeconomic development is mainly in the agricultural sector, and therefore agricultural water use efficiency is crucial for the improvement of the WRCC in this region. For the same GDP per capita, the larger the grain yield per cubic meter of irrigation water is, the larger the population that can be carried by water resources will be. Meanwhile, for the same water use efficiency, the WRCC decreases as the standard of social welfare increases, indicating that a larger GDP per capita leads to a smaller population that can be carried by water resources. The proposed approach can also be used to assess the WRCC under different scenarios in other regions.
(2)
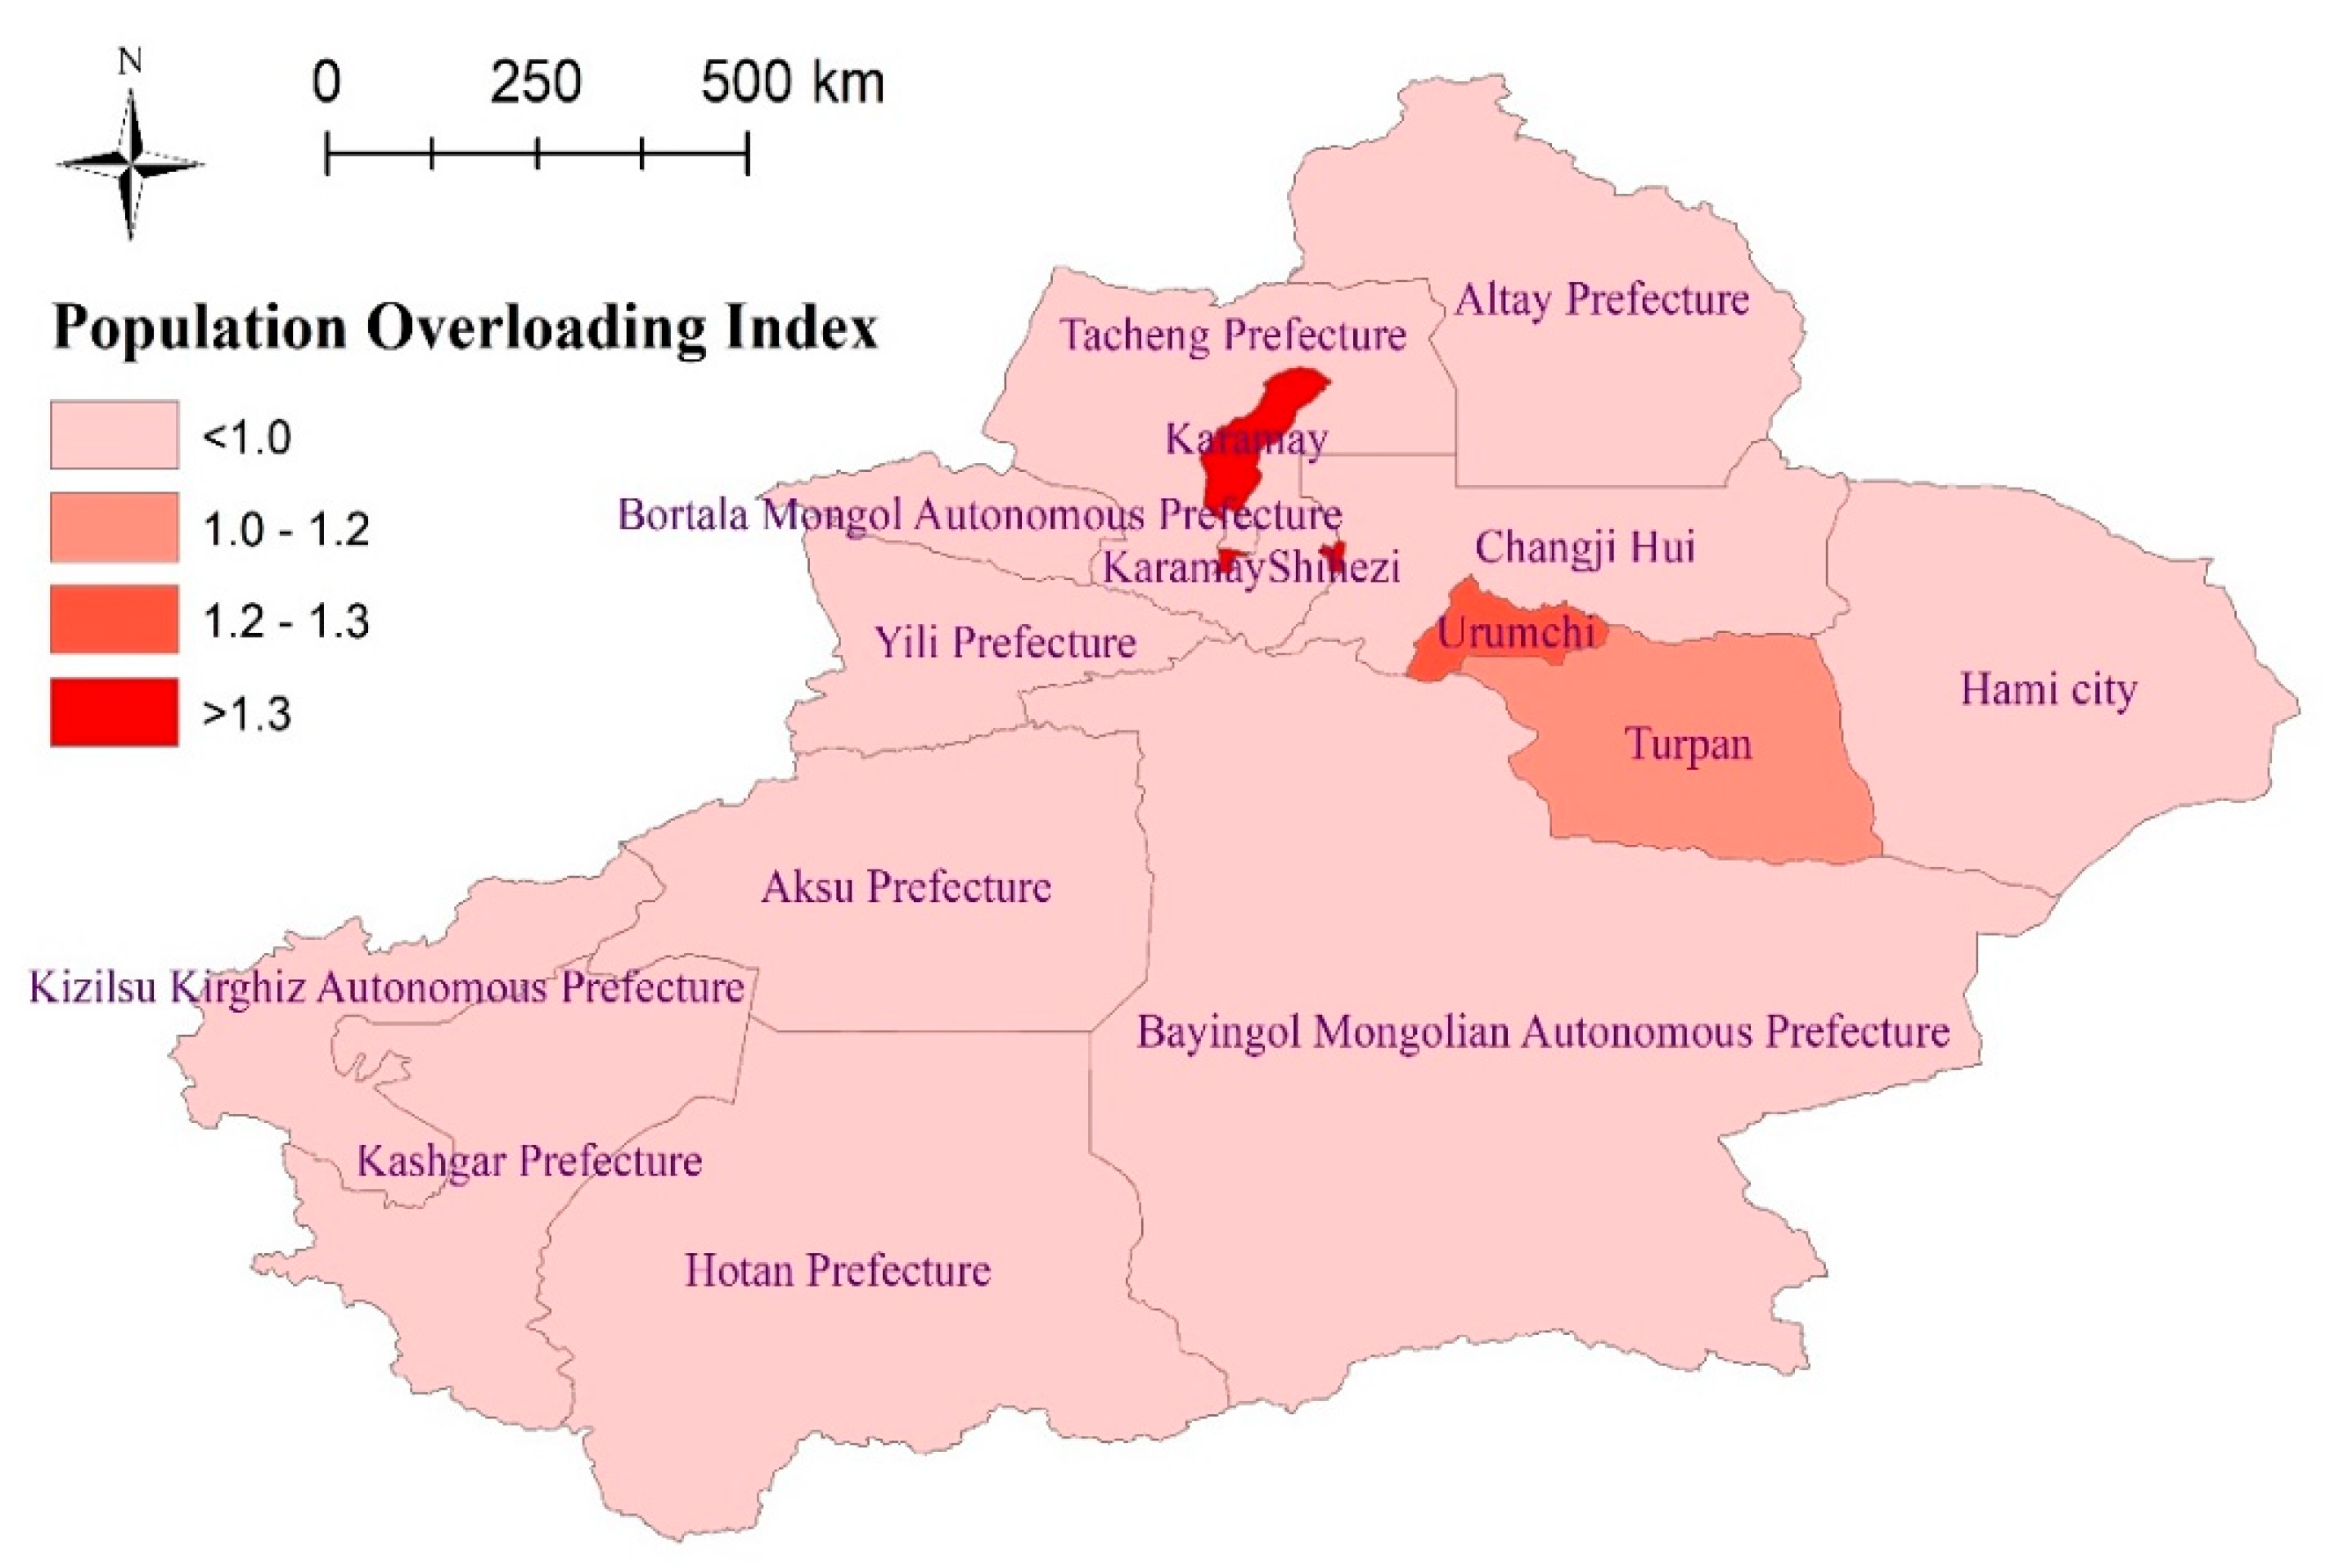
The WRCC of Xinjiang was evaluated in the planning level year. The results show that the population in Xinjiang was not overloaded, and the Population Overloading Index was 0.72 in 2018. Additionally, the results suggest that water resources still have exploitation potential in areas such as Yili Prefecture and Altay Prefecture. Population overloading was found in some areas, including Karamay and Shihezi, which are located to the north of Tianshan Mountain. With the currently available water resources, the population that can be carried by the water resources in Xinjiang is predicted to be between 33.63 and 35.8 million between 2035 and 2050, respectively. In Yili Prefecture, where water resources are relatively abundant, the maximum population carried by water resources is the largest of any area in Xinjiang, whereas the smallest population carried by water resources is in Karamay. The annual outbound water resources are very abundant, and their development of them has an important effect on WRCC in Xinjiang.
(3)
Currently, the sustainable development strategy of water resources in Xinjiang should mainly focus on water conservation, maximizing the potential for agricultural water conservation, and supplementary optimizing industrial structure. It is necessary to promote the high-efficiency use of water resources, accelerate the development of hydraulic infrastructure, optimize the water resources allocation, and maximize the efficiency of water resources in Xinjiang. In the future, trans-regional water transfer may be considered; the water network in southern and northern Xinjiang should be expanded; water transfer to Xinjiang from external areas may be put forward gradually; the outbound water resources will be exploited; the WRCC will be systematically improved so that the water resources can satisfy the water demand of socioeconomic sustainable development.

Author Contributions

Y.H. was responsible for establishment of WRCC model, calculation, and manuscript writing. S.J. put forward the main research ideas. All authors have read and agreed to the published version of the manuscript.

Funding

This research was supported by the National Major Science and Technology Program for Water Pollution Control and Treatment (2017ZX07101001) and the Major Hydraulic Science & Technology Project of Hunan Province (XSKJ2021000-05).

Institutional Review Board Statement

Not applicable.

Informed Consent Statement

Not applicable.

Data Availability Statement

The data of precipitation, water resources and water use were obtained from the Bulletin of Water Resources of Xinjiang Uygur Autonomous Region (http://slt.xinjiang.gov.cn/slt/slnb/list_ej.shtml, accessed on 13 February 2022). The Population, GDP, industrial structure, cultivated land, and grain yield were obtained from the Statistic Bureau of Xinjiang Uygur Autonomous Region (http://tjj.xinjiang.gov.cn/tjj/tjfx/ist.shtml, accessed on 13 February 2022).

Conflicts of Interest

The authors declare that they have no known competing financial interest or personal relationships that could have appeared to influence the work reported in this paper.

References

  1. Li, Y.; Ding, W.; Chen, X.X.; Cai, X.M.; Zhang, C. An Analytical Framework for Reservoir Operation With Combined Natural Inflow and Controlled Inflow. Water Resour. Res. 2020, 56, 25347. [Google Scholar] [CrossRef]
  2. Zhai, Y.J.; Zhang, T.Z.; Ma, X.T.; Shen, X.X.; Ji, C.X.; Bai, Y.Y. Life cycle water footprint analysis of crop production in Chia. Agric. Water Manag. 2021, 256, 107079. [Google Scholar] [CrossRef]
  3. Hu, X.J.; Xiong, Y.C.; Li, Y.J.; Xang, J.X.; Li, F.M.; Wang, H.Y.; Li, L.L. Integrated water resources management and water users’ associations in the arid region of northwest China: A case study of farmers’ perceptions. J. Environ. Manag. 2014, 145, 162–169. [Google Scholar] [CrossRef]
  4. Wan, L.; Xia, J.; Hong, S.; Bu, H.; Ning, L.; Chen, J. Decadal climate variability and vulnerability of water resources in arid regions of Northwest China. Environ. Earth Sci. 2015, 73, 6539–6552. [Google Scholar] [CrossRef] [Green Version]
  5. Han, Y.; Zhang, S.F.; Lv, A.F. Research of effect on water resources carrying capacity in Beijing-Tianjin-Hebei region by water transfer. Resour. Sci. 2018, 40, 2236–2246. [Google Scholar] [CrossRef]
  6. Wang, J.H.; Jiang, D.C.; Xiao, W.H.; Chen, Y.; Hu, P. Study on theoretical analysis of water resources carrying capacity: Definition and scientific topics. J. Hydraul. Eng. 2017, 48, 1399–1409. [Google Scholar] [CrossRef]
  7. He, L.; Du, Y.; Wu, S.; Zhang, Z.L. Evaluation of the agriculture water resources carrying capacity and optimization of a planting-raising structure. Agric. Water Resour. 2021, 243, 106456. [Google Scholar] [CrossRef]
  8. Daily, G.C.; Ehrlich, P.R. Socioeconomic equity, sustainability, and earth carrying capacity. Ecol. Appl. 1996, 6, 991–1001. [Google Scholar] [CrossRef]
  9. Shi, Y.F.; Qu, Y.G. The Carrying Capacity of Water Resources and Its Reasonable Use of Urumqi River; Science Press: Beijing, China, 1992. [Google Scholar]
  10. Li, Y.L.; Guo, X.N.; Guo, D.Y.; Wang, X.H. An evaluation method of water resources carrying capacity and application. Prog. Geogr. 2017, 36, 342–349. [Google Scholar] [CrossRef] [Green Version]
  11. Ren, C.F.; Guo, P.; Li, M.; Li, R.H. An innovative method for water resources carrying capacity research-Metabolic theory of regional water resources. J. Environ. Manag. 2016, 167, 139–146. [Google Scholar] [CrossRef]
  12. Zhao, Y.; Wang, Y.Y.; Wang, Y. Comprehensive evaluation and influencing factors of urban agglomeration water resources carrying capacity. J. Clean. Prod. 2020, 288, 125097. [Google Scholar] [CrossRef]
  13. Yang, Z.Y.; Song, J.X.; Cheng, D.D.; Xia, J.; Li, Q.; Ahamad, M.I. Comprehensive evaluation and scenario simulation for the water resources carrying capacity in Xi’an city, China. J. Environ. Manag. 2019, 230, 221–233. [Google Scholar] [CrossRef] [PubMed]
  14. Zhang, L.; Dong, Z.C.; Zhang, W. On concept of sustainable capacity of water resources. J. Hydraul. Eng. 2003, 34, 108–112. [Google Scholar] [CrossRef]
  15. Xu, Y.P. A study on comprehensive evaluation of the water resources carrying capacity in the arid area: A case study in the Hetian river basin of Xinjiang. J. Nat. Resour. 1993, 8, 229–237. [Google Scholar] [CrossRef]
  16. Wang, H.; Qin, D.Y.; Wang, J.H.; Li, L.Y. Study on carrying capacity of water resources in inland arid zone of Northwest China. J. Nat. Resour. 2004, 19, 151–159. [Google Scholar] [CrossRef]
  17. Xia, J.; Zhu, Y.Z. The measurement of water resources security: A study and challenge on water resources carrying capacity. J. Nat. Resour. 2002, 17, 262–269. [Google Scholar] [CrossRef]
  18. Jia, S.F.; Zhou, C.Q.; Yan, H.Y.; Zhou, H.F.; Tang, Q.C.; Zhang, J.B. Estimation of usable water resources and carrying capacity in Northwest China. Adv. Water Sci. 2004, 15, 801–807. [Google Scholar] [CrossRef]
  19. RGWRXJ: Research group of water resources social science of Xinjiang. Water resources, carrying capacity and the exploitation strategy of Xinjiang. Water Conserv. Electr. Tech. 1989, 19, 2–9. [Google Scholar]
  20. Zhou, H.F.; Zhang, J.B. Analysis on the volume of available water resources and its carrying capacity in Xinjiang. Arid. Land Geogr. 2005, 28, 763–765. [Google Scholar] [CrossRef]
  21. Wang, X.; He, Y.Z. The Capacity of water resources in Xinjiang. J. Xinjiang Univ. Financ. Econ. 2011, 45, 11–14. [Google Scholar] [CrossRef]
  22. Song, D.D.; Guo, H. Research on the carrying comprehensive evaluation of water resources in Xinjiang based on AHP and entropy method. J. Xinjiang Norm. Univ. 2014, 33, 1–8. [Google Scholar] [CrossRef]
  23. Deng, M.J.; Wang, S.J.; Dong, X.G.; Zhang, S.M. Water Resources and Sustainable Development in Xinjiang; China Water & Power Press: Beijing, China, 2005. [Google Scholar]
  24. Zhang, S.M.; Wang, Z.J.; You, P.D. Study on Surface Water Resources in Xinjiang; China Water & Power Press: Beijing, China, 2008. [Google Scholar]
  25. Department of Water Resources of Xinjiang Uygur Autonomous Region. Water Resources Bulletin of Xinjiang Uygur Autonomous Region; 2018. Available online: http://slt.xinjiang.gov.cn/slt/szygb/list.shtml (accessed on 13 February 2022).
  26. Tennant, D.L. Instream flow regimens for fish, wildlife, recreation, and related environmental resources. Fisheries 1976, 1, 6–10. [Google Scholar] [CrossRef]
  27. Statistic Bureau of Xinjiang Uygur Autonomous Region. Xinjiang Statistical Yearbook; China Statistics Press: Beijing, China, 2019. [Google Scholar]
  28. Wu, D.; Cui, Y.L.; Wang, Y.T.; Chen, M.Y.; Luo, Y.F.; Zhang, L. Reuse of return flows and its scale effect in irrigation systems based on modified SWAT model. Agric. Water Manag. 2019, 213, 280–288. [Google Scholar] [CrossRef]
  29. Delavar, M.; Eini, M.R.; Kuchak, V.S.; Zaghiyan, M.R.; Shahbazi, A.; Nourmohammadi, F.; Motamedi, A. Model-based water accounting for integrated assessment of water resources systems at the basin scale. Sci. Total Environ. 2022, 830, 154810. [Google Scholar] [CrossRef]
  30. Ministry of Water Resources of the People’s Republic of China. China Water Statistical Yearbook; China Water & Power Press: Beijing, China, 2019.
  31. National Bureau of Statistics of China. China Statistical Yearbook; China Statistics Press: Beijing, China, 2019. Available online: http://www.stats.gov.cn/tjsj/ndsj/2019/indexch.htm (accessed on 28 February 2020).
Figure 1. The pedigree chart of the water resources carrying capacity of Xinjiang.
Water 14 01510 g001
Figure 2. The Population Overloading Index of water resources carrying capacity of Xinjiang in 2018.
Water 14 01510 g002
Table 1. The calculated water carrying capacity of Xinjiang in 2018.
AreaPopulation (104 Persons)GDP (100 Million CNY)
All of Xinjiang316019,309
Urumchi1822533
Karamay23668
Shihezi44312
Turpan54266
Hami City57547
Changji Hui Autonomous Prefecture1531400
Yili Prefecture7716331
Tacheng Prefecture1191070
Altay Prefecture162859
Bortala Mongol Autonomous Prefecture67464
Bayingol Mongolian Autonomous Prefecture2091677
Aksu Prefecture2961112
Kizilsu Kirghiz Autonomous Prefecture92191
Kashgar Prefecture501930
Hotan Prefecture429947
Table 2. The Population Overloading Index of Xinjiang in 2018.
AreaPopulation Overloading Index
All of Xinjiang0.72
Urumchi1.22
Karamay1.34
Shihezi1.34
Turpan1.17
Hami City0.98
Changji Hui Autonomous Prefecture0.98
Yili Prefecture0.38
Tacheng Prefecture0.83
Altay Prefecture0.41
Bortala Mongol Autonomous Prefecture0.71
Bayingol Mongolian Autonomous Prefecture0.61
Aksu Prefecture0.92
Kizilsu Kirghiz Autonomous Prefecture0.68
Kashgar Prefecture0.96
Hotan Prefecture0.59
Table 3. The predicted population and economic scale that can be carried by water resources in Xinjiang in two planning-level years.
AreaPopulation (104 Persons)GDP (100 Million CNY)
2035 Year2050 Year2035 Year2050 Year
All of Xinjiang3363358034,45444,536
Urumchi19722540315280
Karamay28358301223
Shihezi4957546690
Turpan55666011056
Hami63729161115
Changji Hui Autonomous Prefecture16518423382796
Yili Prefecture814852912611,246
Tacheng Prefecture12813115361835
Altay Prefecture17218717762303
Bortala Mongol Autonomous Prefecture7276786978
Bayingol Mongolian Autonomous Prefecture22524427113420
Aksu Prefecture30933036364544
Kizilsu Kirghiz Autonomous Prefecture98103596827
Kashgar Prefecture53255031134316
Hotan Prefecture45446819122908
Publisher’s Note: MDPI stays neutral with regard to jurisdictional claims in published maps and institutional affiliations.

