
Estimation of Tidal Current Asymmetry in an Archipelagic Region: The Zhoushan Islands


Abstract
:1. Introduction
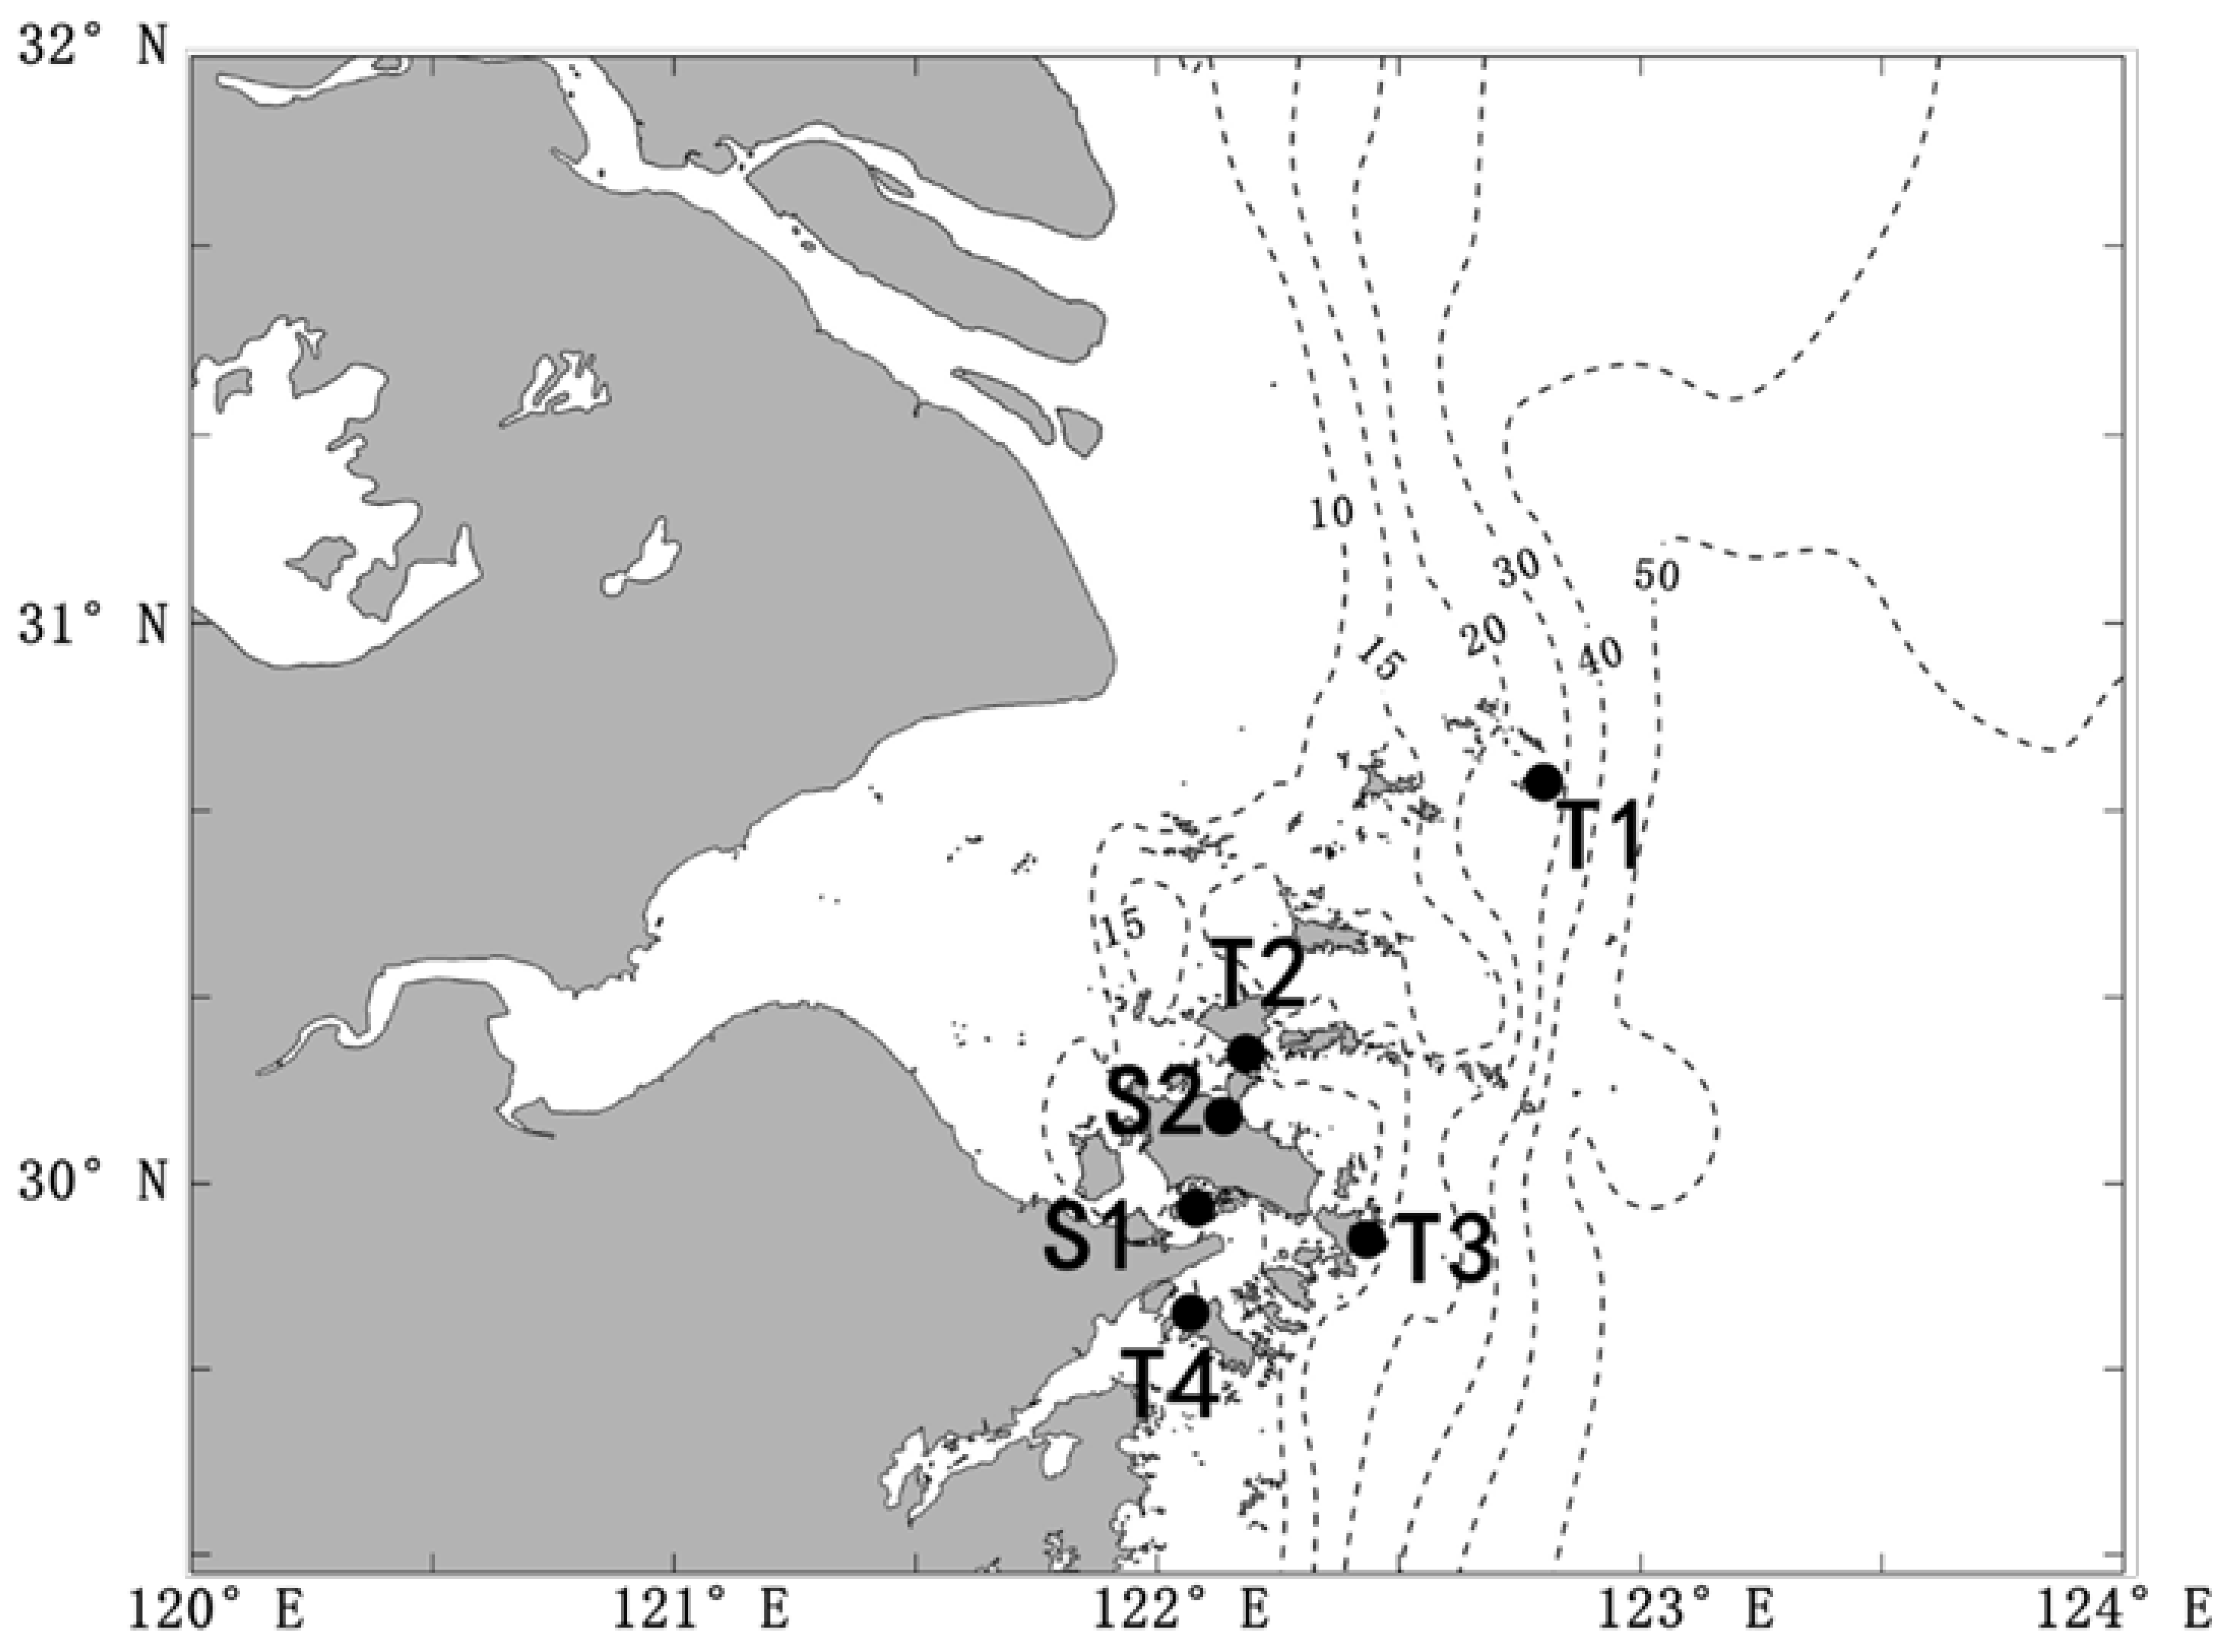
2. Methods and Data
2.1. Methods
- (1)
- Determine the flood periods via tidal level changes in each grid.
- (2)
- Identify the directions of the strongest flow during each flood period.
- (3)
- Choose the most probable direction as the MFD.
2.2. Model Description
3. Results
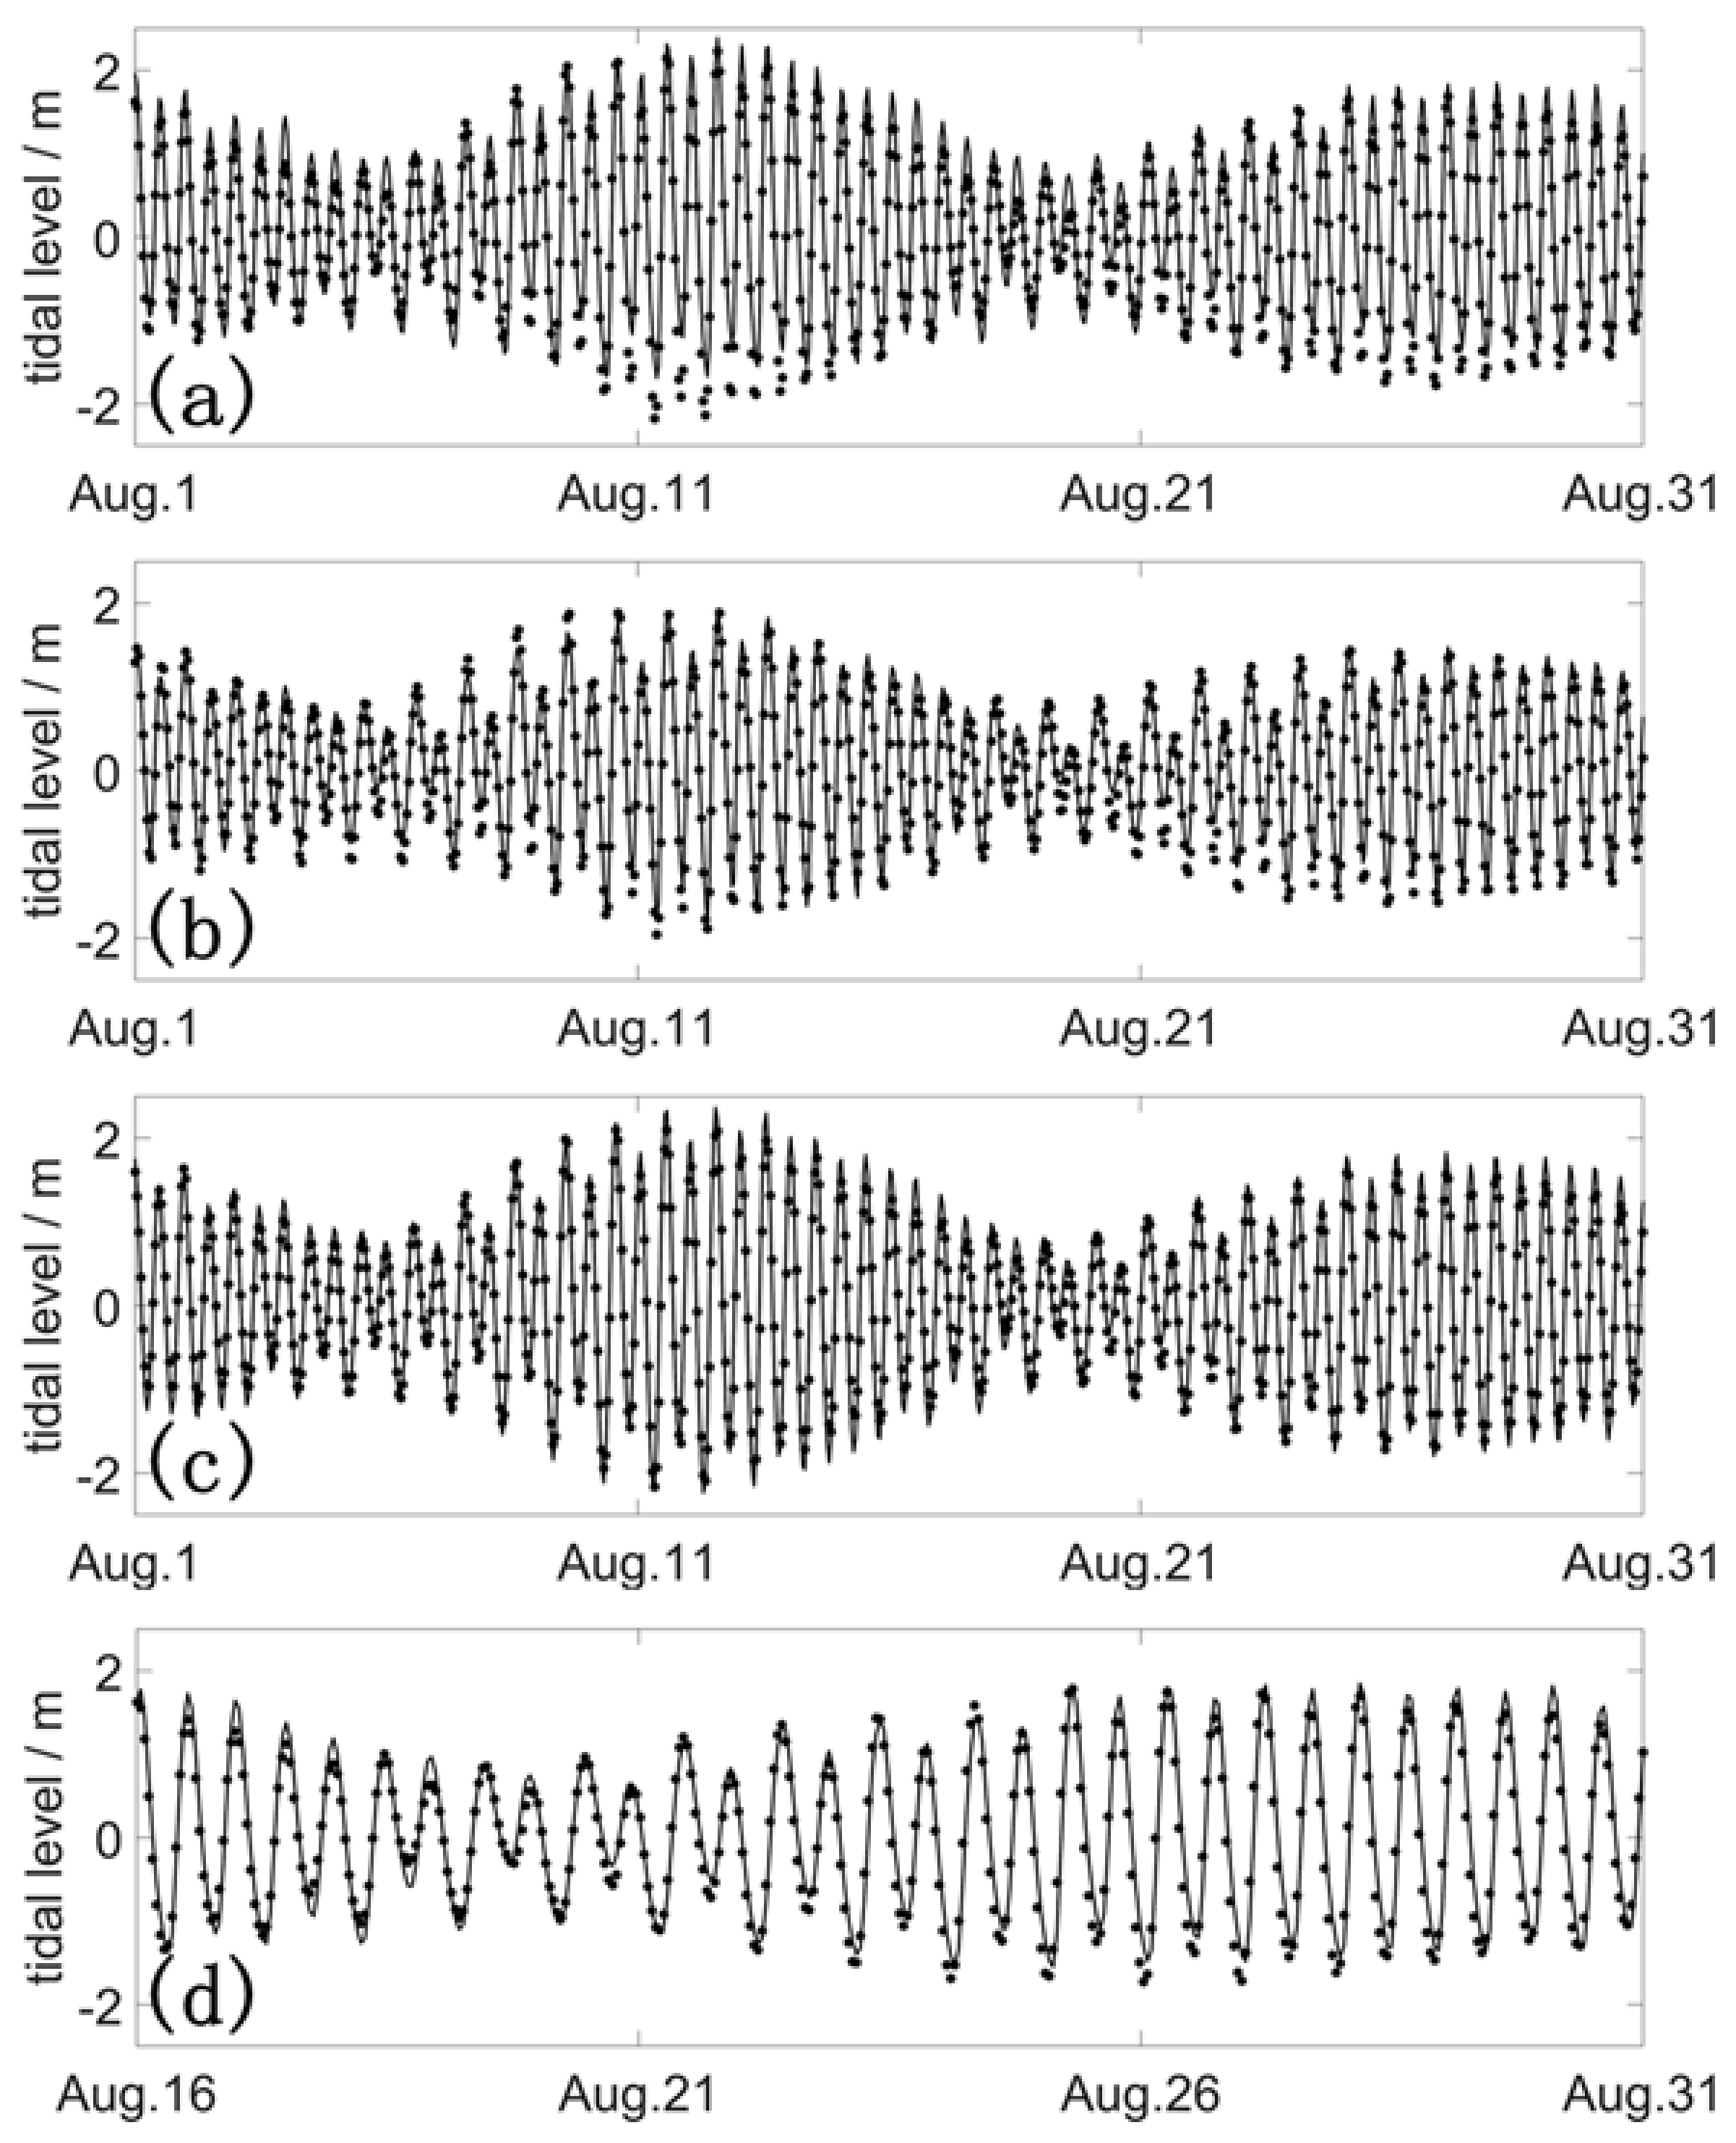
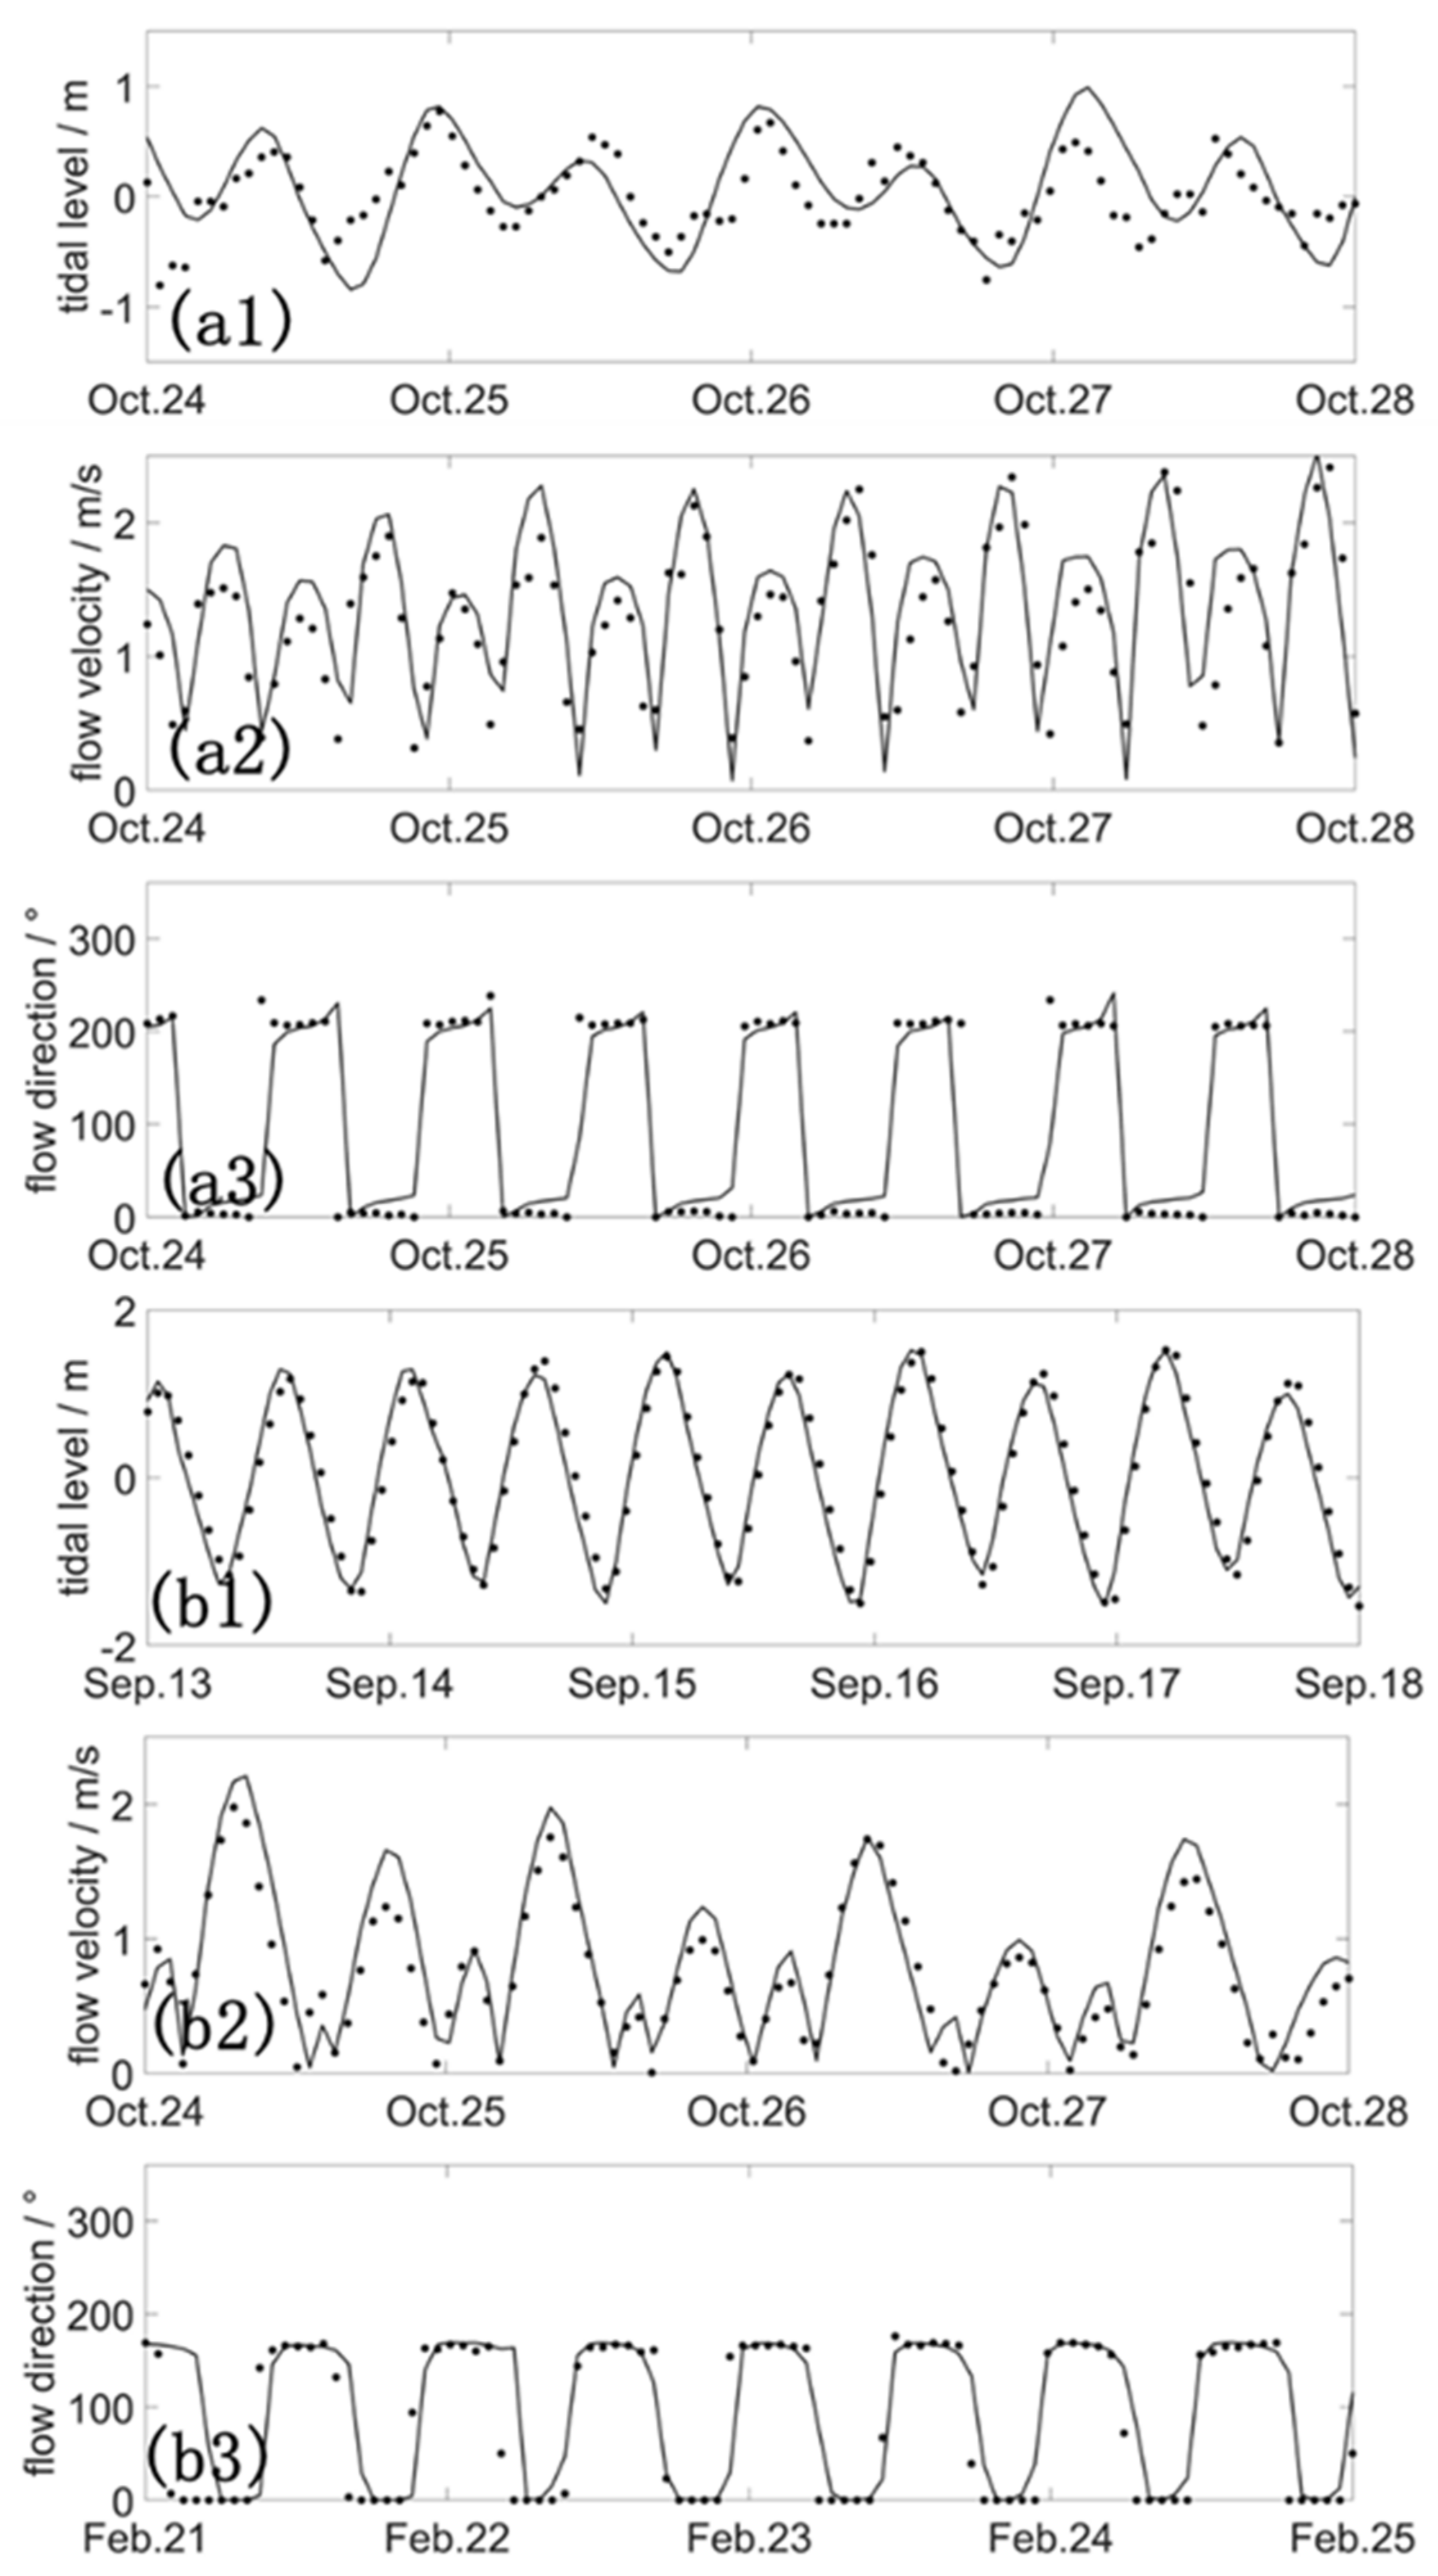
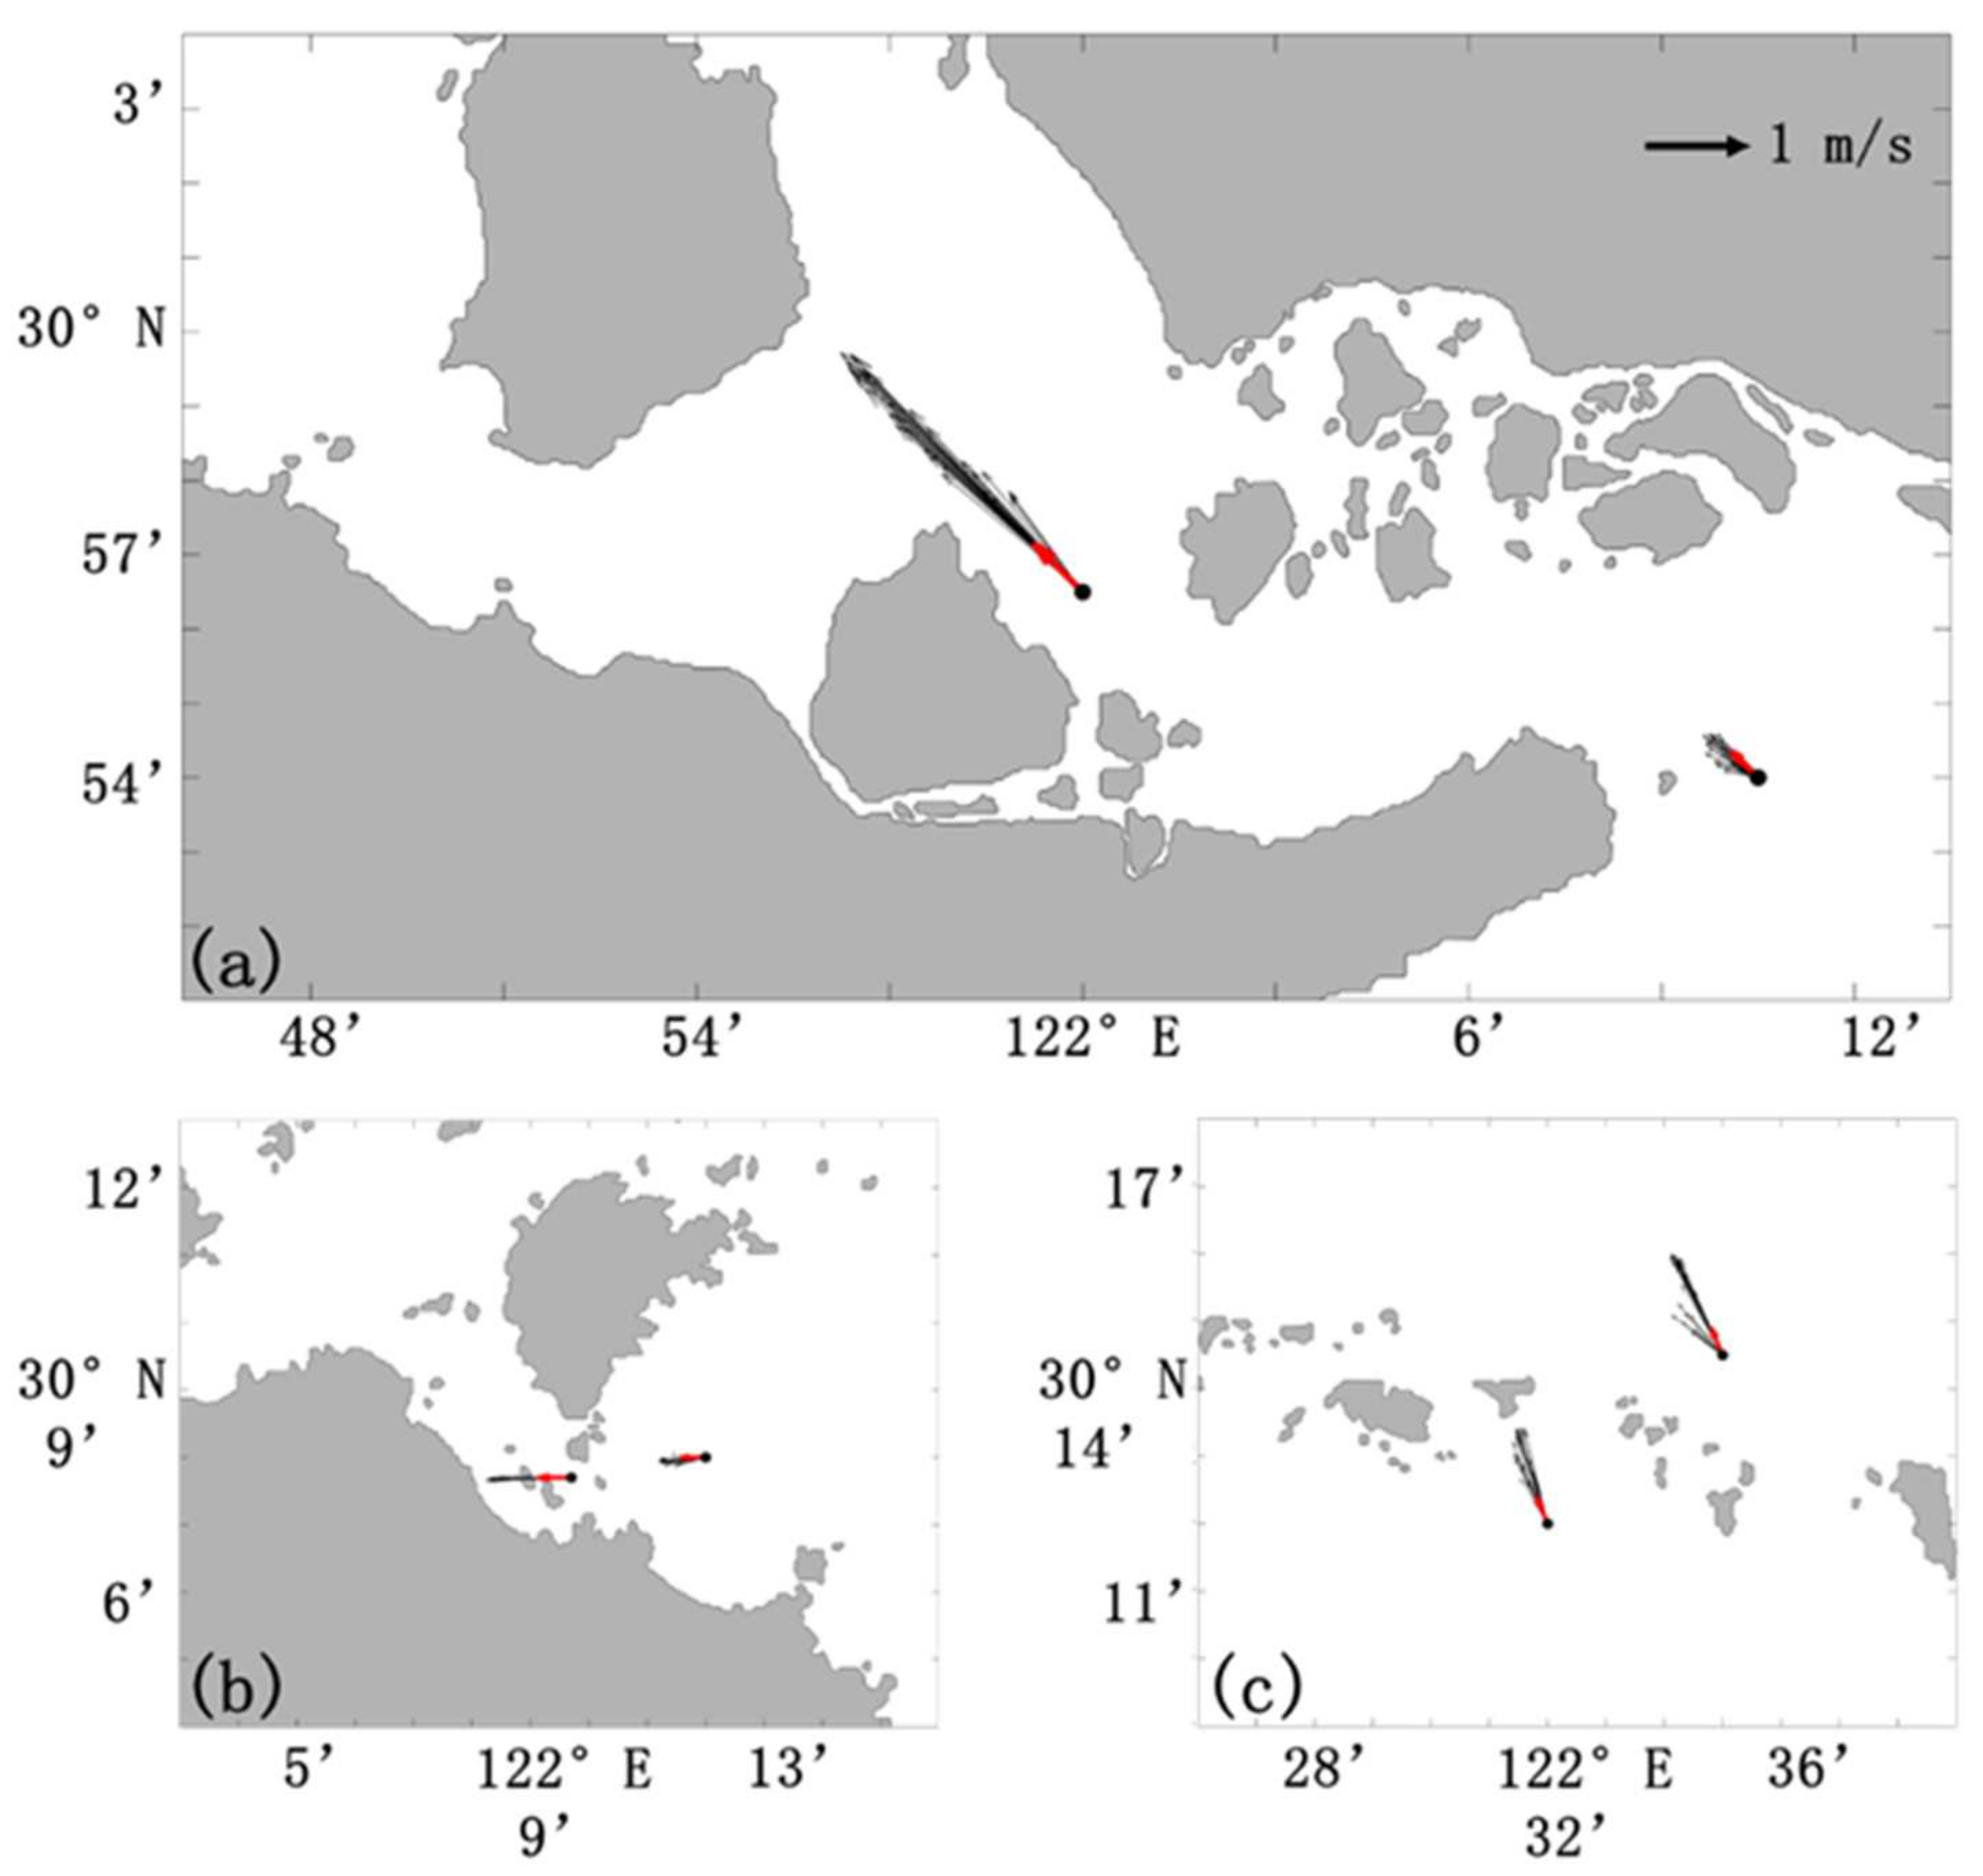
3.1. Validation of the Model Results
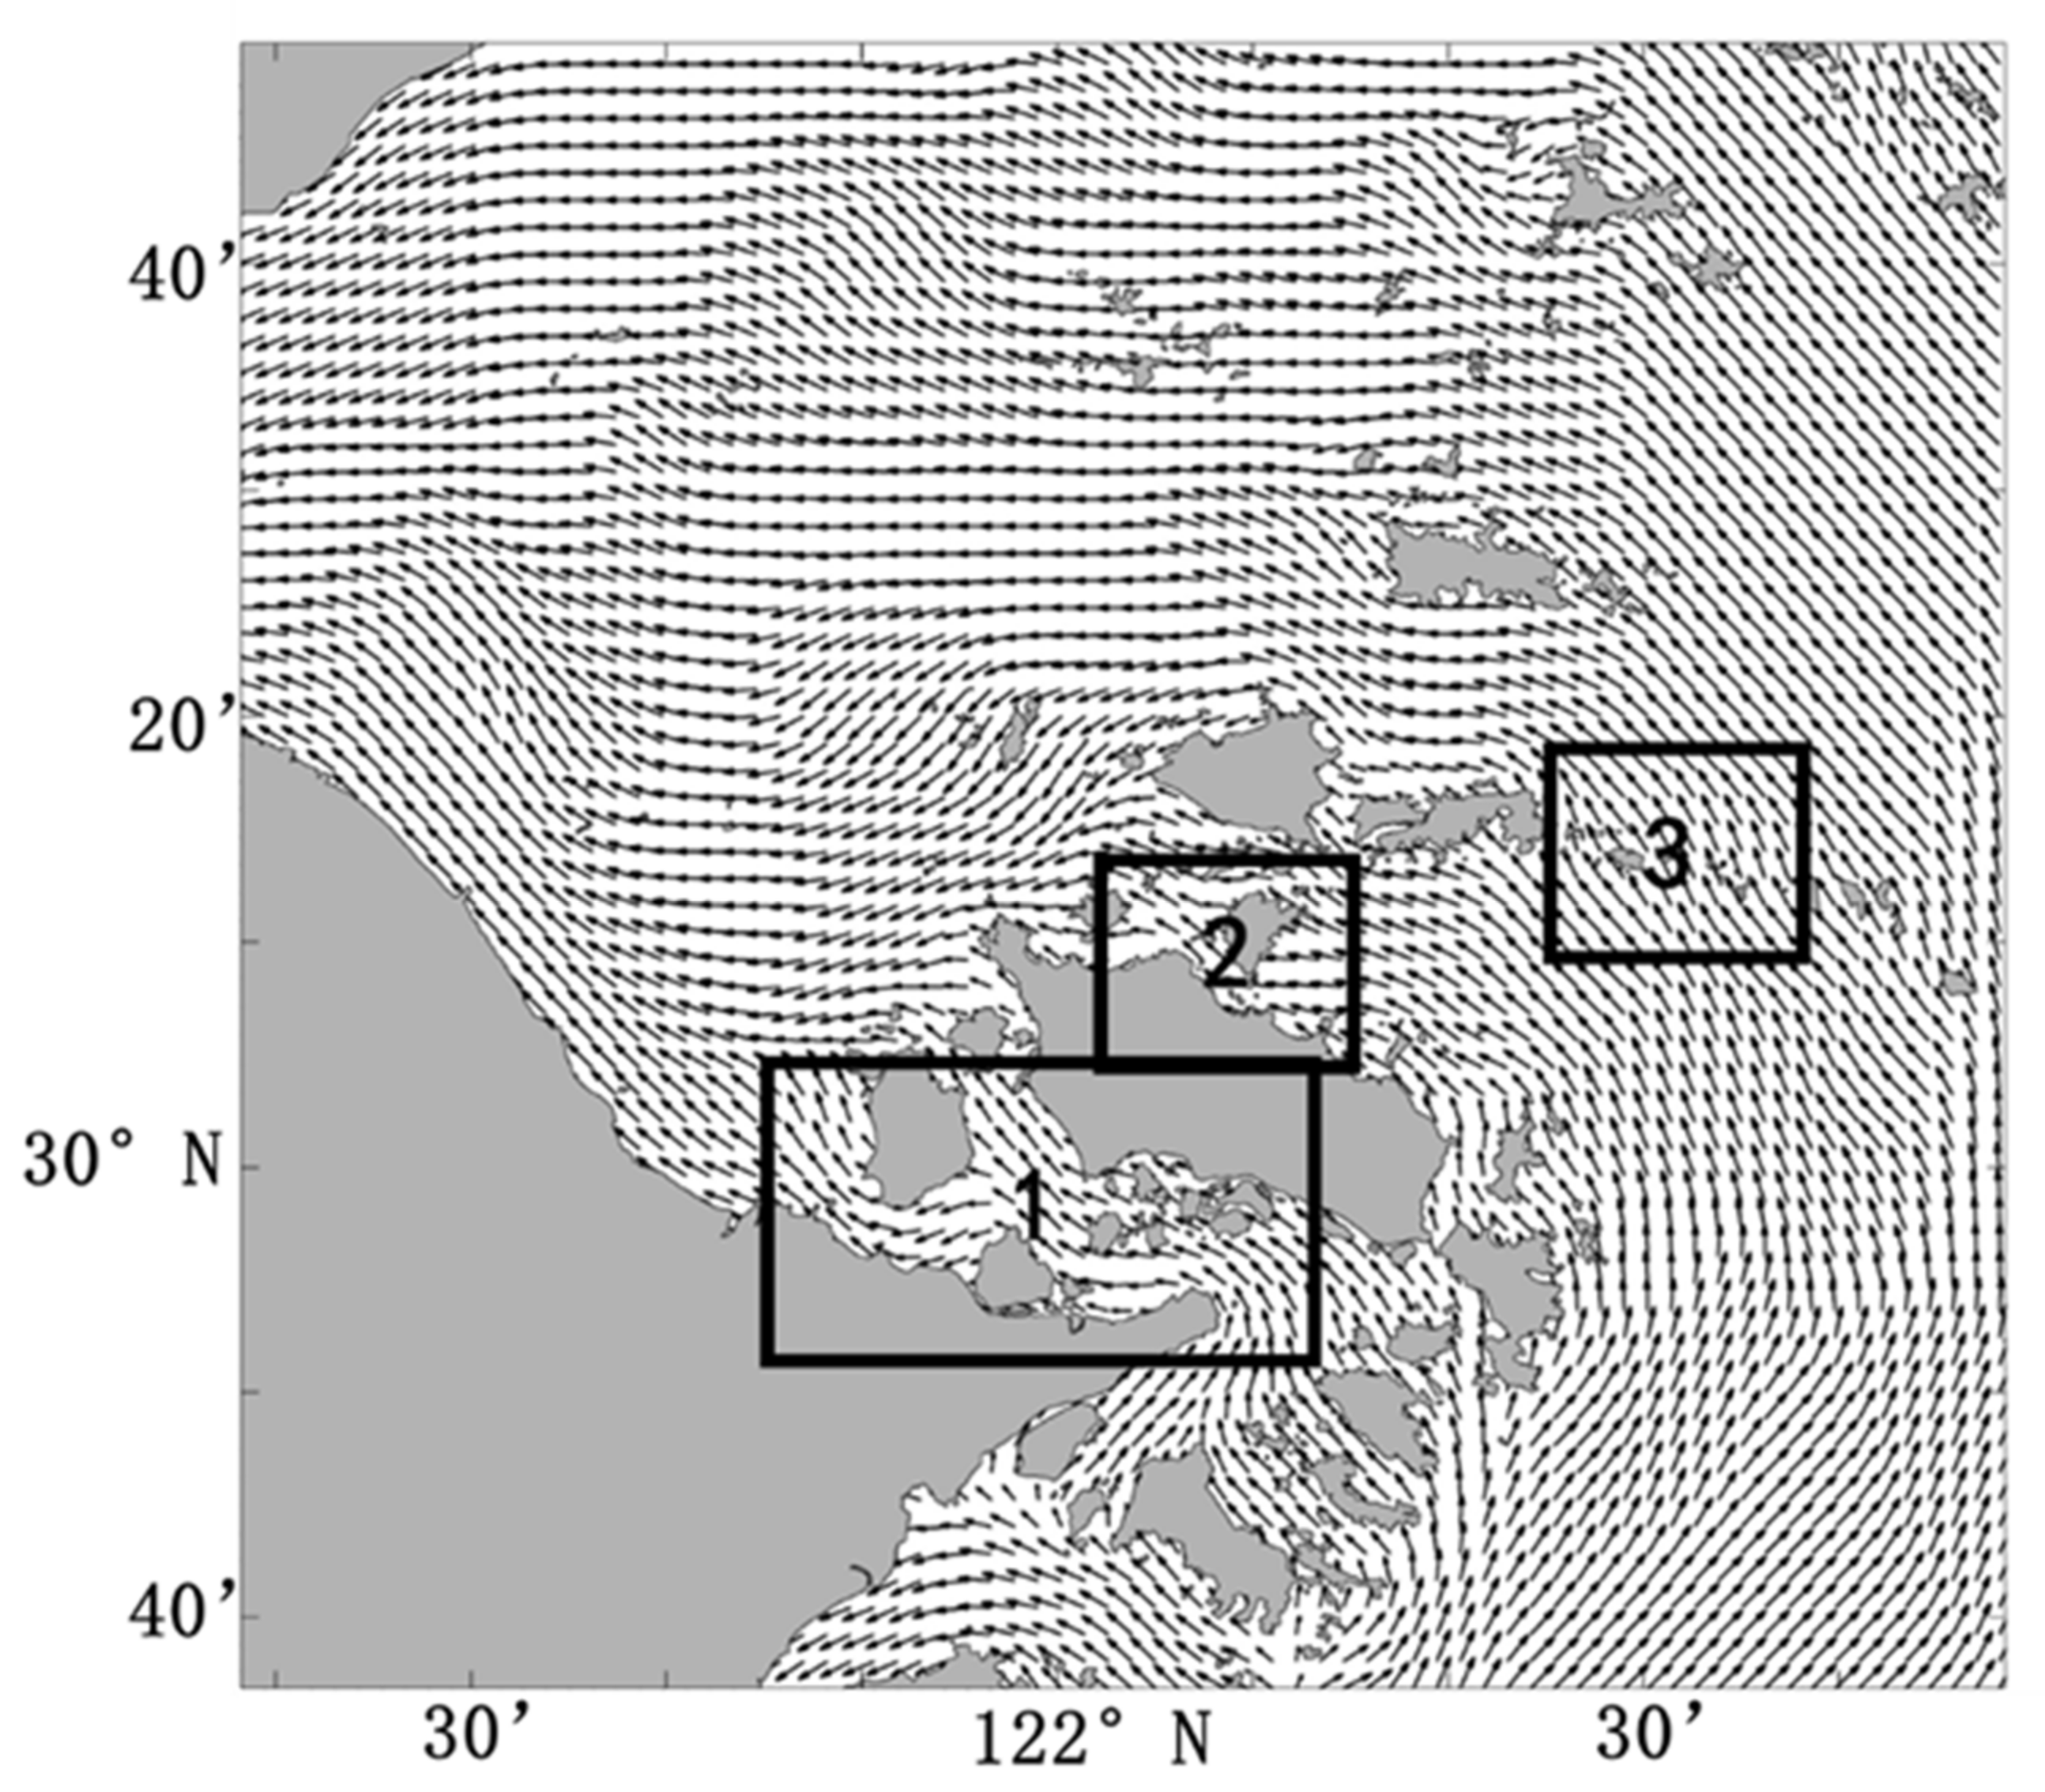
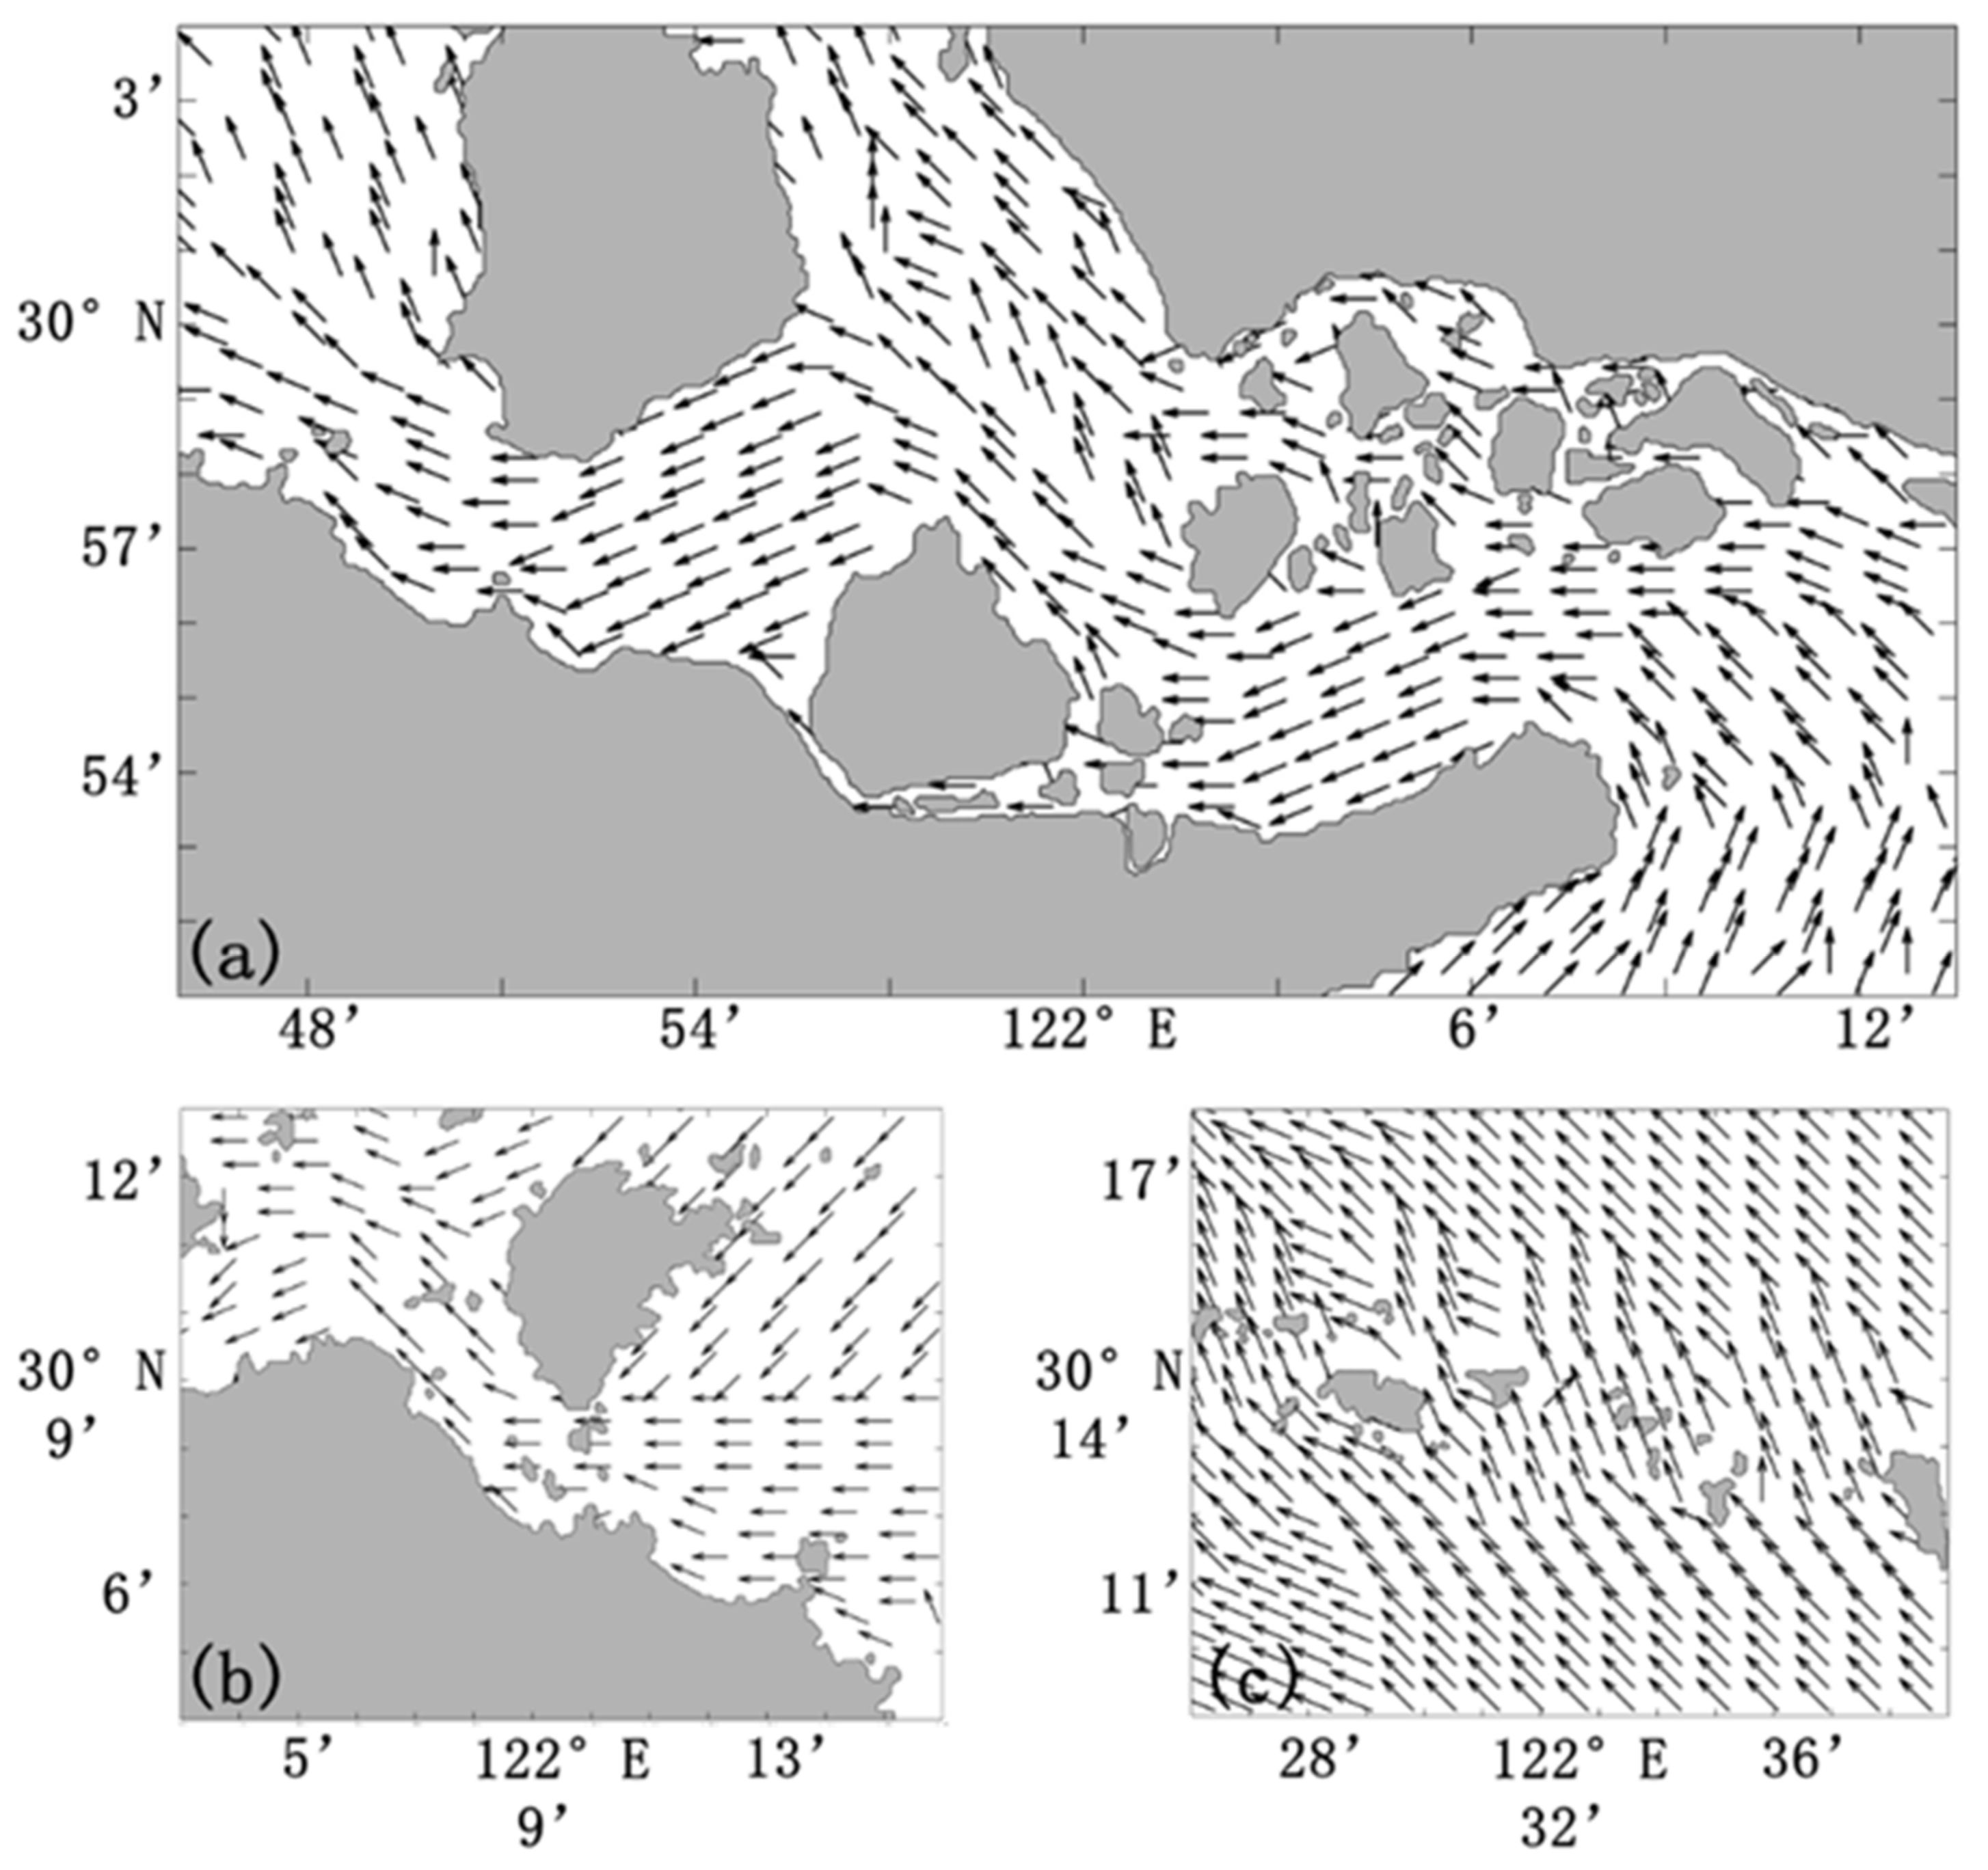
3.2. The MFD
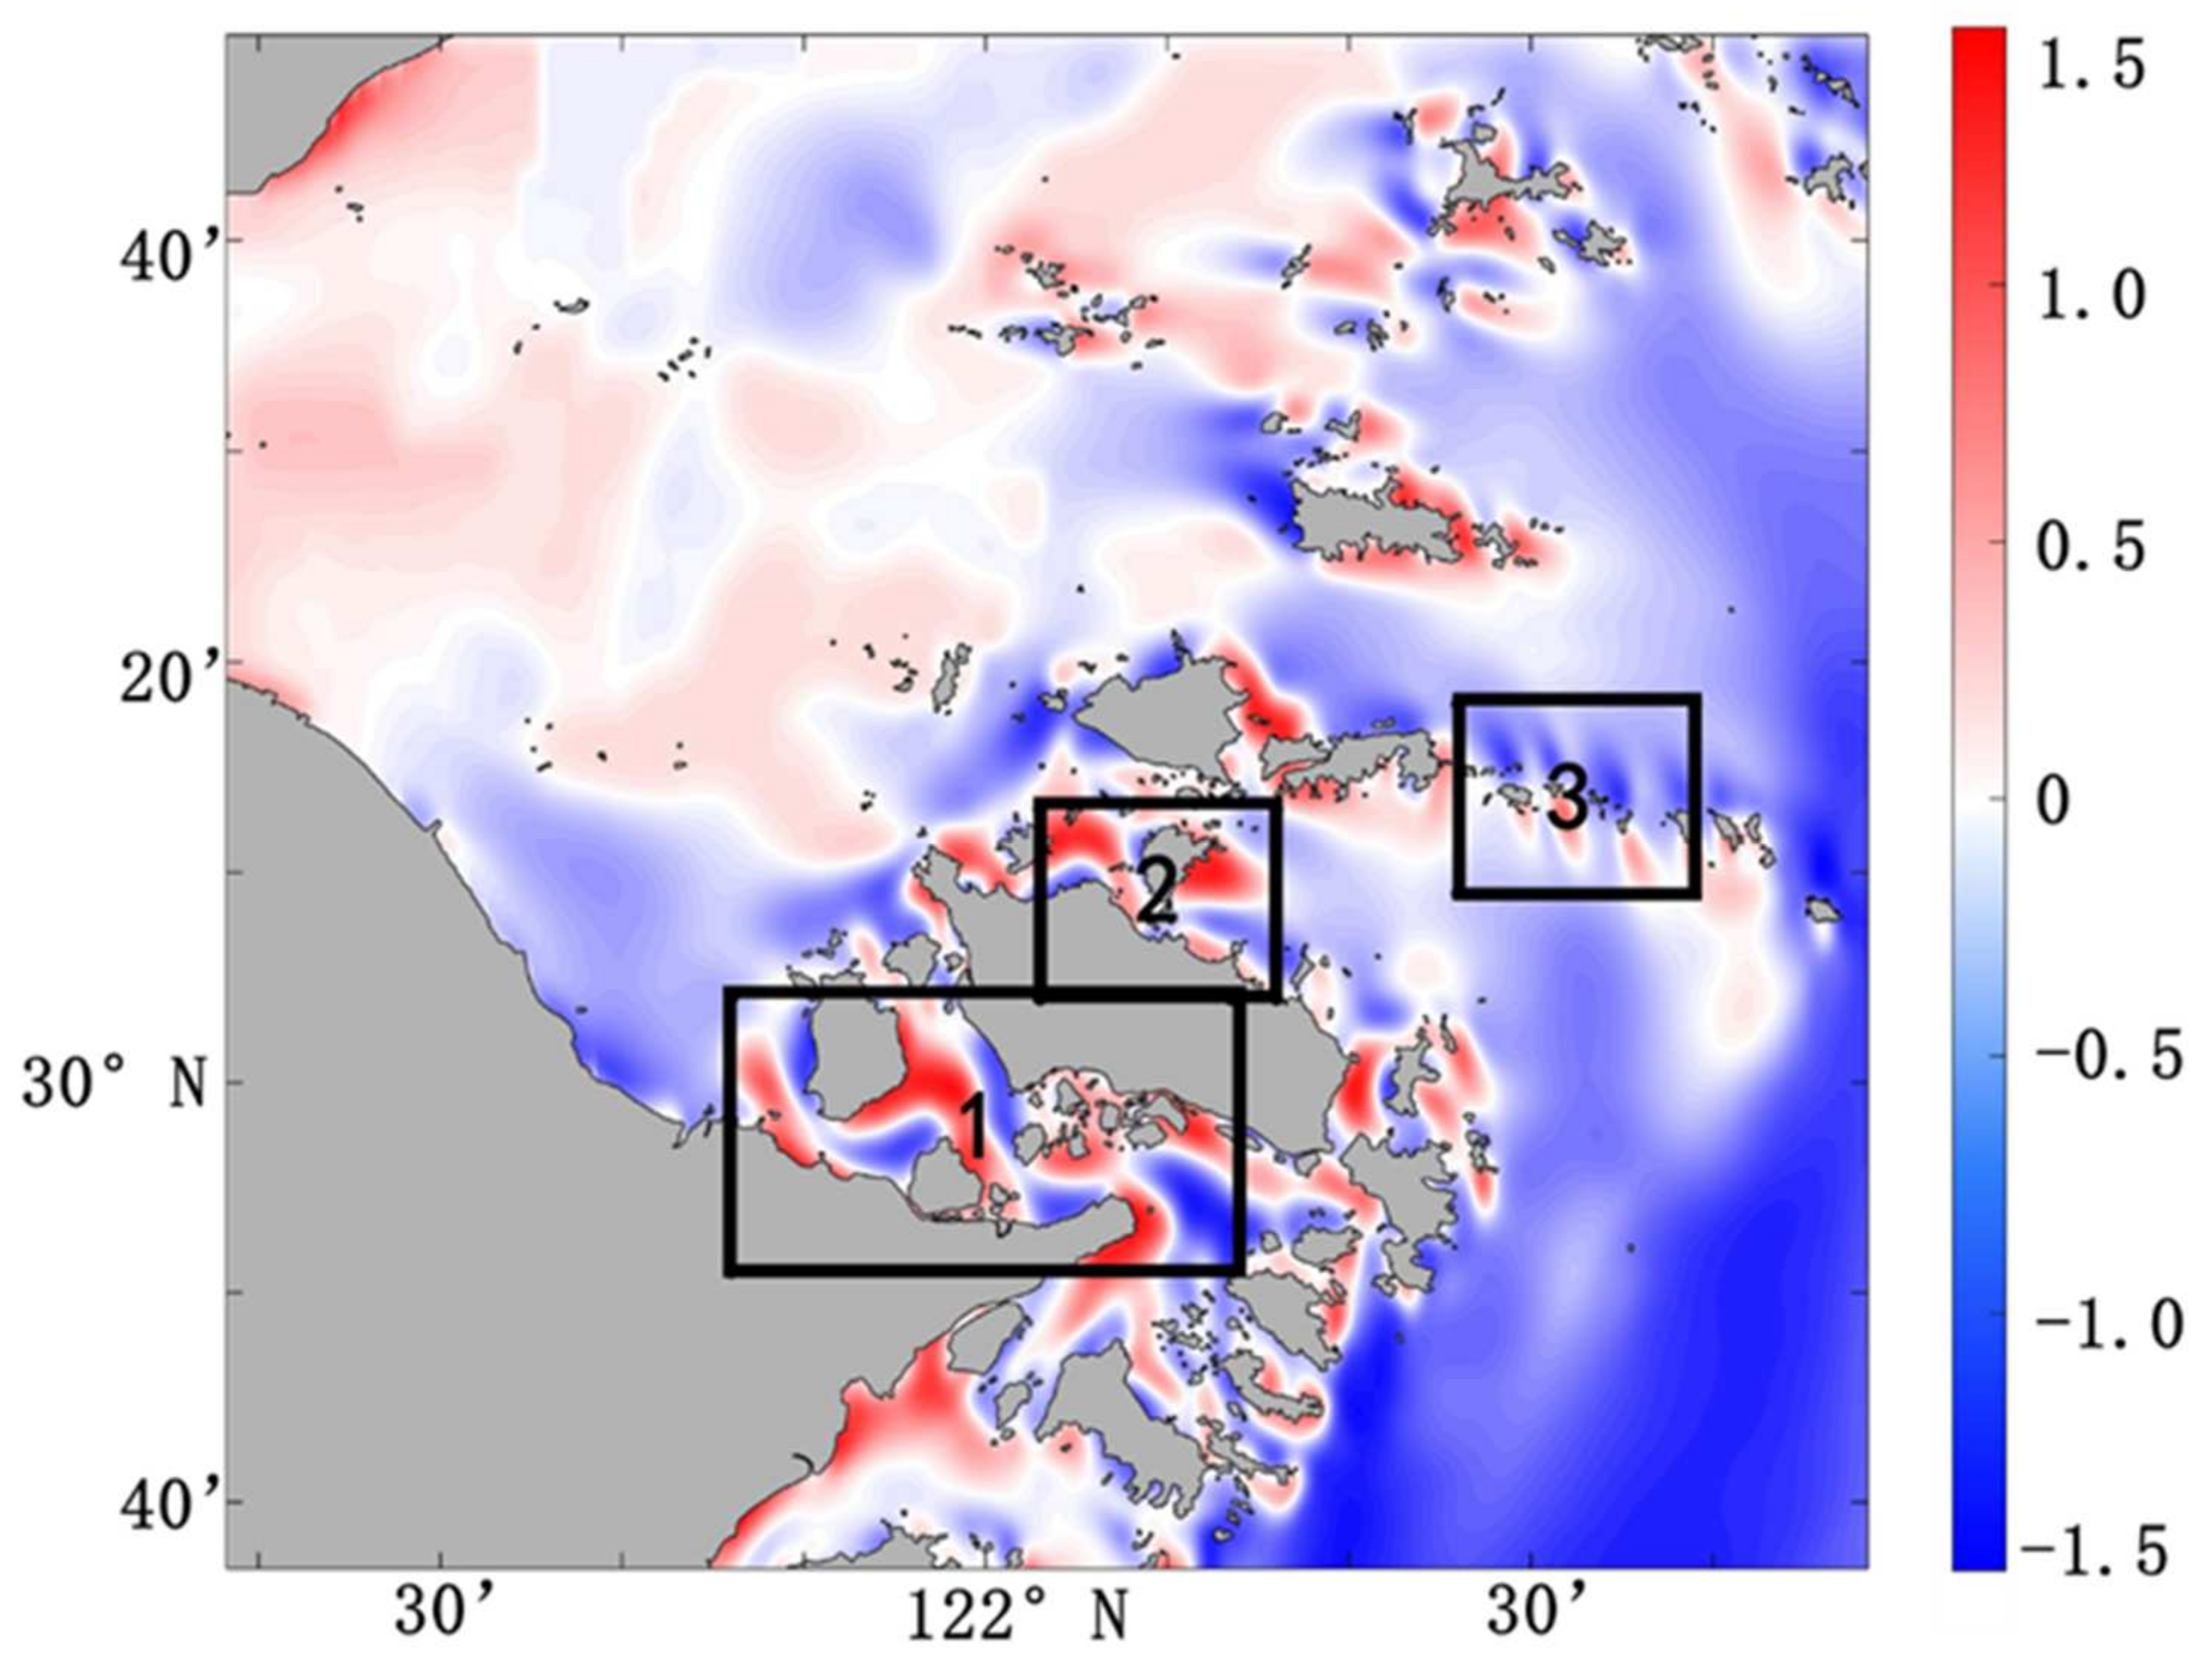
3.3. The TCA
4. Discussion
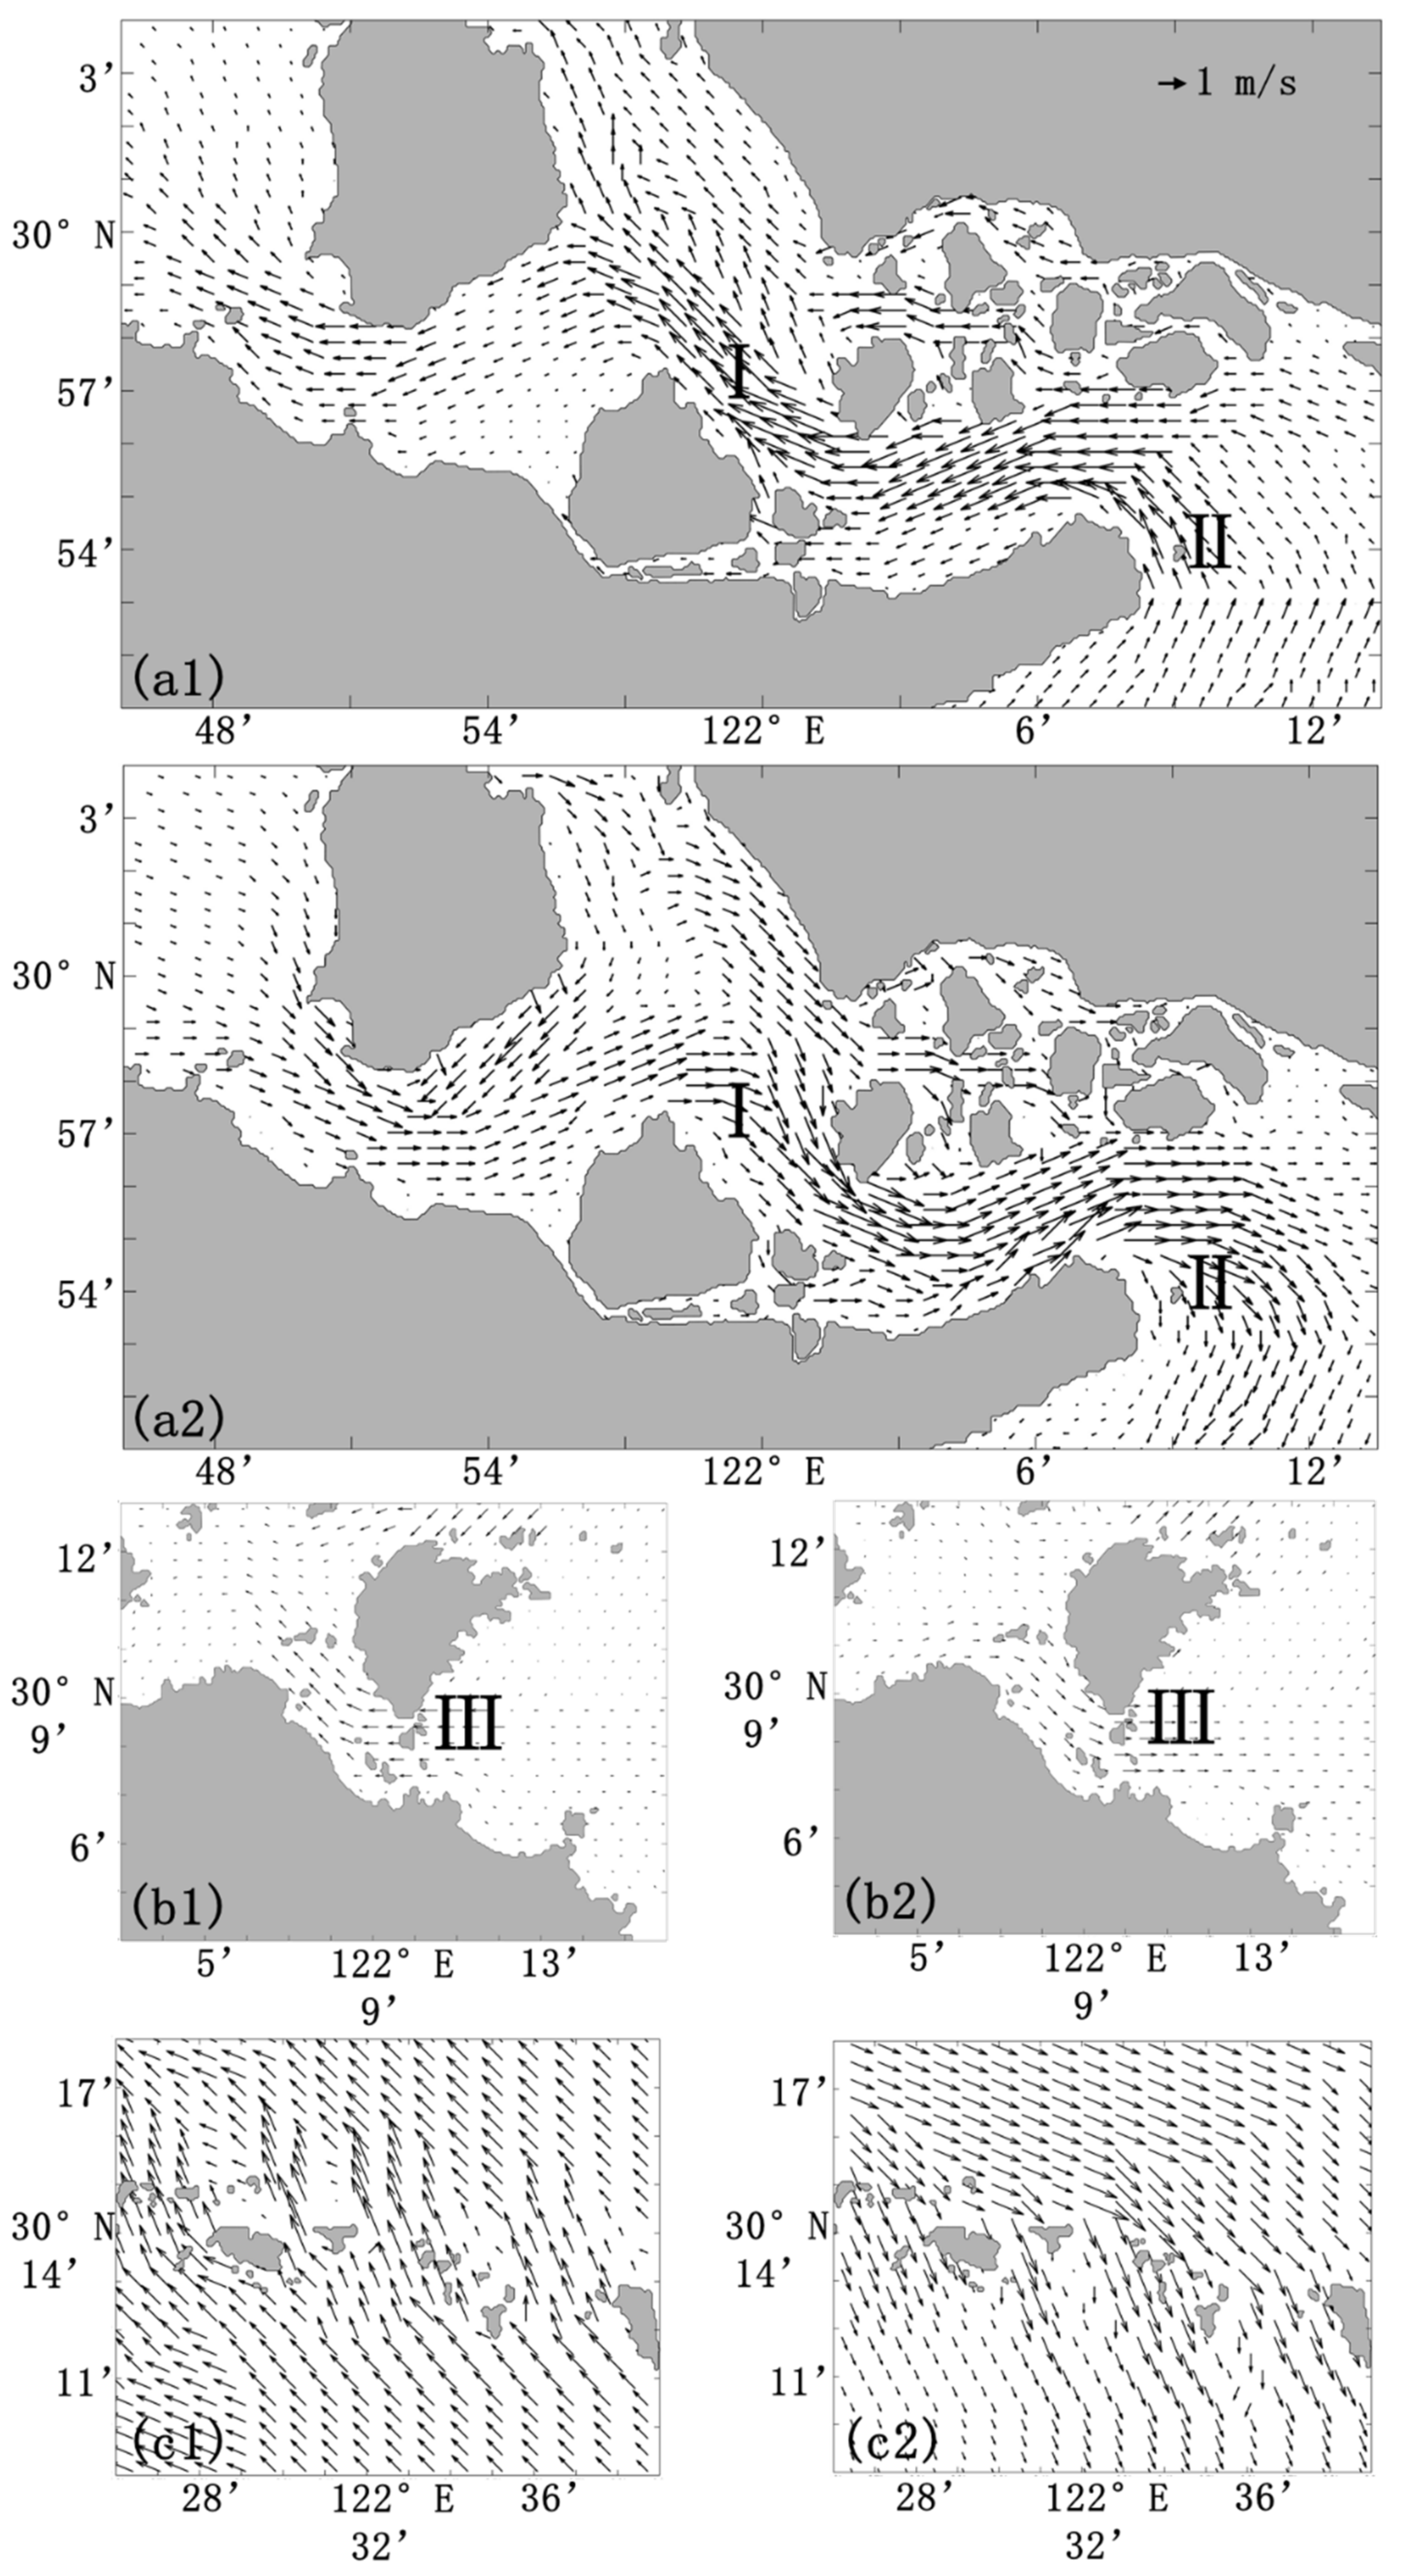
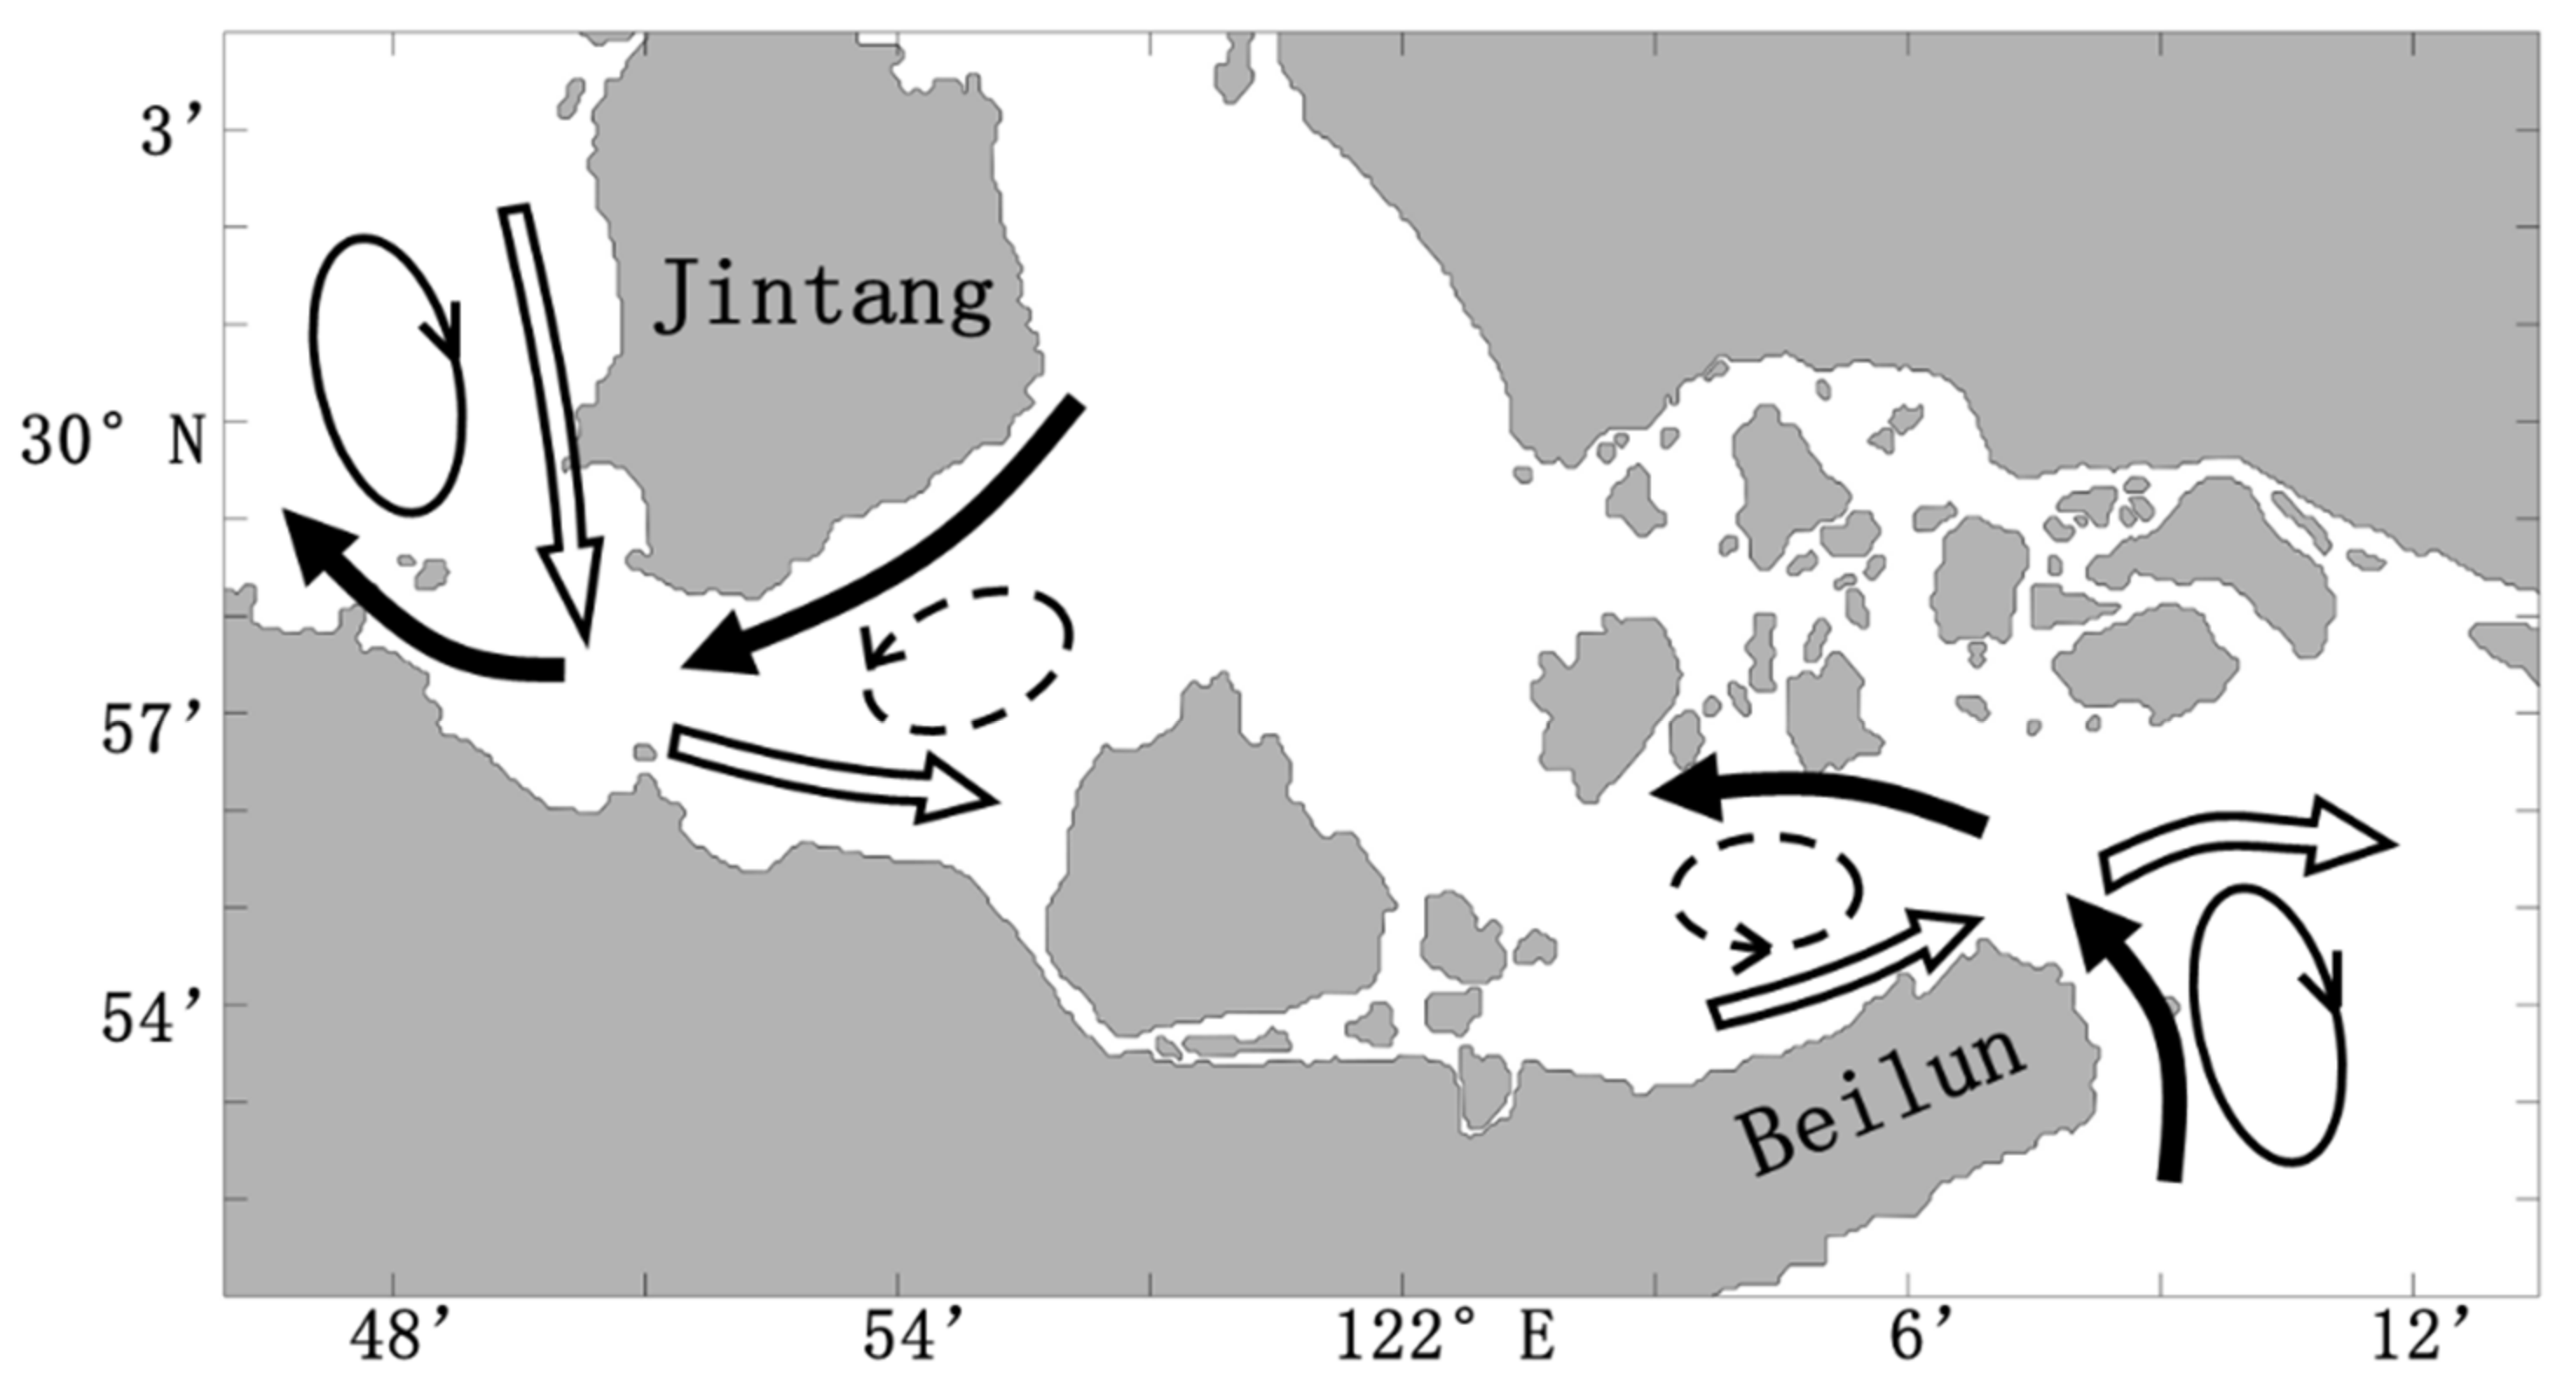
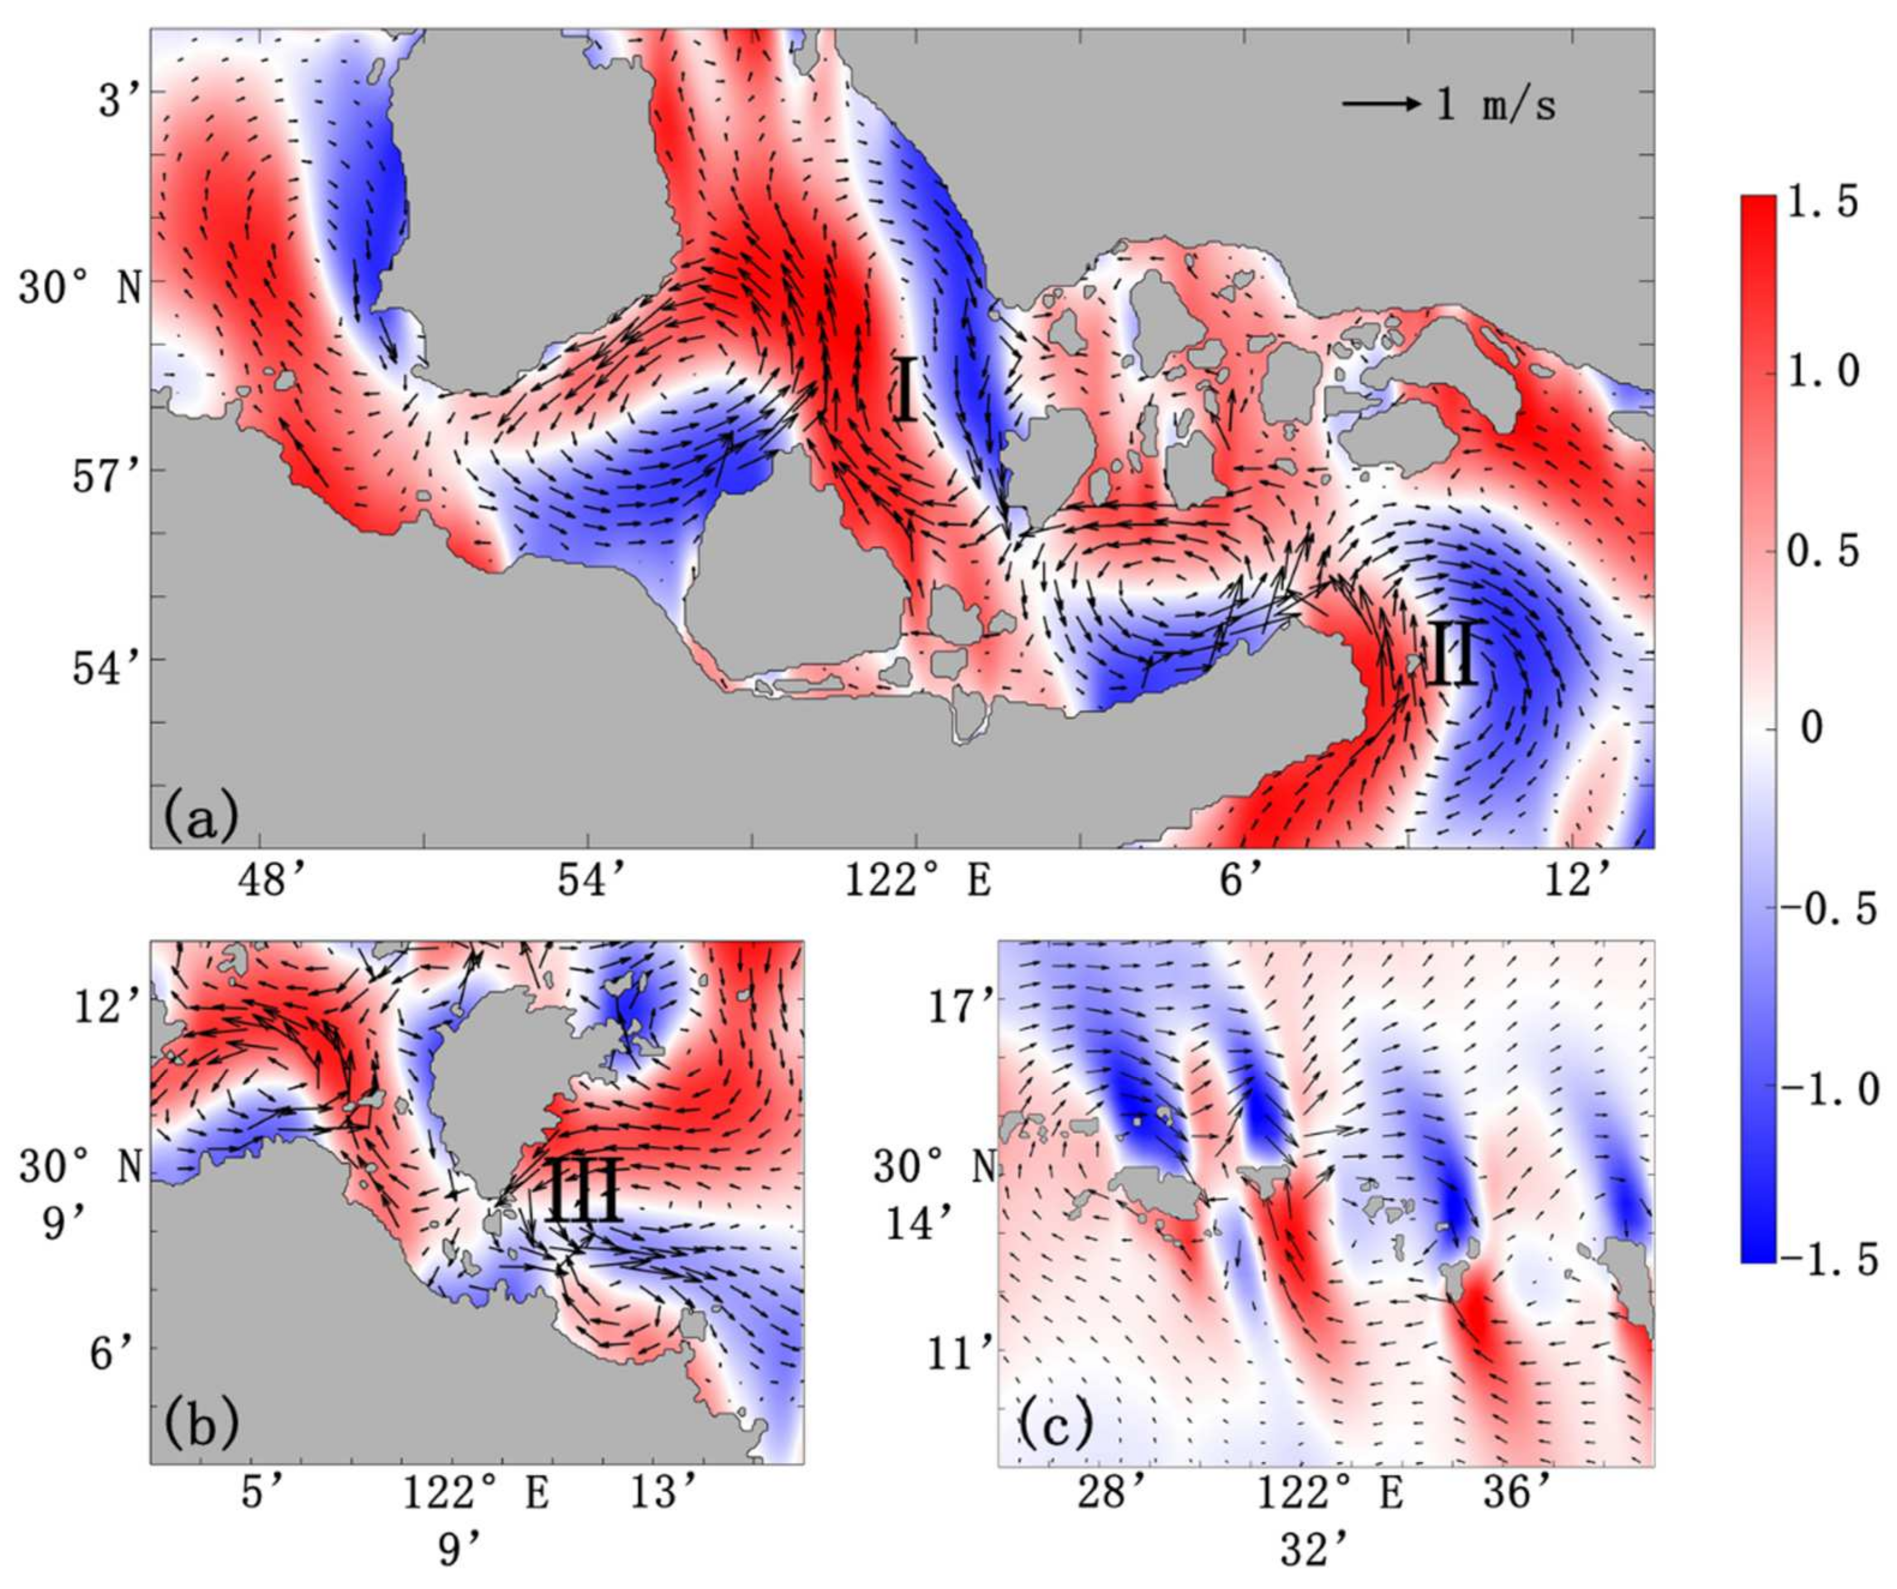
4.1. Role of Residual Currents
4.2. Role of Islands
5. Conclusions
Author Contributions
Funding
Data Availability Statement
Acknowledgments
Conflicts of Interest
References
- Postma, H. Sediment transport and sedimentation in the marine environment. Estuaries 1967, 83, 158–179. [Google Scholar]
- Dronkers, J. Tidal asymmetry and estuarine morphology. Neth. J. Sea Res. 1986, 20, 117–131. [Google Scholar] [CrossRef]
- Friedrichs, C.; Aubrey, D.G. Non-linear tidal distortion in shallow well-mixed estuaries: A synthesis. Estuar. Coast. Shelf Sci. 1988, 27, 521–545. [Google Scholar] [CrossRef]
- Huthnance, J.M. Tidal current asymmetries over the Norfolk Sandbanks. Estuar. Coast. Mar. Sci. 1973, 1, 89–99. [Google Scholar] [CrossRef]
- Lee, H.J.; Jo, H.R.; Chu, Y.S.; Bahk, K.S. Sediment transport on macrotidal flats in Garolim Bay, west coast of Korea: Significance of wind waves and asymmetry of tidal currents. Cont. Shelf Res. 2004, 24, 821–832. [Google Scholar] [CrossRef]
- Van Der Vegt, M.; Schuttelaars, H.M.; de Swart, H.E. The influence of tidal currents on the asymmetry of tide-dominated ebb–tidal deltas. Cont. Shelf Res. 2009, 29, 159–174. [Google Scholar] [CrossRef]
- Blanton, J.O.; Lin, G.; Elston, S.A. Tidal current asymmetry in shallow estuaries and tidal creeks. Cont. Shelf Res. 2002, 22, 1731–1743. [Google Scholar] [CrossRef]
- Byun, D.; Cho, Y. Double peak-flood current asymmetry in a shallow-water-constituent dominated embayment with a macro-tidal flat. Geophys. Res. Lett. 2006, 33, 16613. [Google Scholar] [CrossRef]
- Manoj, N.T.; Unnikrishnan, A.S.; Sundar, D. Tidal Asymmetry in the Mandovi and Zuari Estuaries, the west coast of India. J. Coast. Res. 2009, 25, 1187–1197. [Google Scholar] [CrossRef]
- Jewell, S.A.; Walker, D.J.; Fortunato, A.B. Tidal asymmetry in a coastal lagoon subject to a mixed tidal regime. Geomorphology 2012, 138, 171–180. [Google Scholar] [CrossRef]
- Nidzieko, N.J. Tidal asymmetry in estuaries with mixed semidiurnal/diurnal tides. J. Geophys. Res. 2010, 115, C08006. [Google Scholar] [CrossRef] [Green Version]
- Maren, D.V.; Winterwerp, J.C. The role of flow asymmetry and mud properties on tidal flat sedimentation. Cont. Shelf Res. 2013, 60, S71–S84. [Google Scholar] [CrossRef]
- Song, D.; Wang, X.H.; Kiss, A.E.; Bao, X. The contribution to tidal asymmetry by different combinations of tidal constituents. J. Geophys. Res. 2011, 116, 338–348. [Google Scholar] [CrossRef]
- Guo, W.; Song, D.; Wang, X.H.; Ding, P.; Ge, J. Contributions of different tidal interactions to fortnightly variation in tidal duration asymmetry. J. Geophys. Res. Ocean. 2016, 121, 5980–5994. [Google Scholar] [CrossRef]
- Mandal, S.; Sil, S.; Gangopadhyay, A.; Jena, B.K.; Venkatesan, R. On the nature of tidal asymmetry in the Gulf of Khambhat, Arabian Sea using HF radar surface currents. Estuar. Coast. Shelf Sci. 2020, 232, 106481. [Google Scholar] [CrossRef]
- Song, D.; Wang, X.H. Suspended sediment transport in the Deepwater Navigation Channel, Yangtze River Estuary, China, in the dry season 2009: 2. Numerical simulations. J. Geophys. Res. Ocean. 2013, 118, 5568–5590. [Google Scholar] [CrossRef]
- Maren, D.; Gerritsen, H. Residual flow and tidal asymmetry in the Singapore Strait, with implications for resuspension and residual transport of sediment. J. Geophys. Res. Ocean. 2012, 117, C04021. [Google Scholar] [CrossRef] [Green Version]
- Xuan, J.; Yang, Z.; Huang, D.; Wang, T.; Zhou, F. Tidal residual current and its role in the mean flow on the Changjiang Bank. J. Mar. Syst. 2016, 154, 66–81. [Google Scholar] [CrossRef]
- Webster, K.L.; Ogston, A.S.; Nittrouer, C.A. Delivery, reworking and export of fine-grained sediment across the sandy Skagit River tidal flats. Cont. Shelf Res. 2013, 60, S58–S70. [Google Scholar] [CrossRef]
- Gong, W.; Schuttelaars, H.; Zhang, H. Tidal asymmetry in a funnel-shaped estuary with mixed semidiurnal tides. Ocean Dyn. 2016, 66, 637–658. [Google Scholar] [CrossRef]
- Ralston, D.K.; Geyer, W.R.; Traykovski, P.A.; Nidzieko, N.J. Effects of estuarine and fluvial processes on sediment transport over deltaic tidal flats. Cont. Shelf Res. 2013, 60, S40–S57. [Google Scholar] [CrossRef] [Green Version]
- Huang, H.; Chen, C.; Blanton, J.O.; Andrade, F.A. A numerical study of tidal asymmetry in Okatee Creek, South Carolina. Estuar. Coast. Shelf Sci. 2008, 78, 190–202. [Google Scholar] [CrossRef]
- Guo, L.; Brand, M.; Sanders, B.F.; Stein, E.D. Tidal asymmetry and residual sediment transport in a short tidal basin under sea level rise. Adv. Water Resour. 2018, 121, 1–8. [Google Scholar] [CrossRef]
- Pan, C.; Huang, W. Numerical Modeling of Suspended Sediment Transport Affected by Tidal Bore in Qiantang Estuary. J. Coast. Res. 2010, 26, 1123–1132. [Google Scholar] [CrossRef]
- Wu, H.; Zhu, J.; Shen, J.; Wang, H. Tidal modulation on the Changjiang River plume in summer. J. Geophys. Res. Ocean. 2011, 116, C08017. [Google Scholar] [CrossRef] [Green Version]
- Elias, E.; Cleveringa, J.; Buijsman, M.C.; Roelvink, J.A.; Stive, M.J.F. Field and model data analysis of sand transport patterns in Texel Tidal inlet (The Netherlands). Coast. Eng. 2006, 53, 505–529. [Google Scholar] [CrossRef]
- Benedet, L.; List, J.H. Evaluation of the physical process controlling beach changes adjacent to nearshore dredge pits. Coast. Eng. 2008, 55, 1224–1236. [Google Scholar] [CrossRef]
- Dissanayake, D.; Roelvink, J.A.; Wegen, M. Modelled channel patterns in a schematized tidal inlet. Coast. Eng. 2009, 56, 1069–1083. [Google Scholar] [CrossRef]
- Geyer, W.R. Three-dimensional tidal flow around headlands. J. Geophys. Res. Ocean. 1993, 98, 955–966. [Google Scholar] [CrossRef]
- Nidzieko, N.J.; Hench, J.L.; Monismith, S.G. Lateral Circulation in Well-Mixed and Stratified Estuarine Flows with Curvature. J. Phys. Oceanogr. 2009, 39, 831–851. [Google Scholar] [CrossRef]
- Ahnert, F. Estuarine meanders in the Chesapeake Bay area. Geogr. Rev. 1960, 50, 390–401. [Google Scholar] [CrossRef]
- Van Veen, J.; van der Spek, A.J.F.; Stive, M.J.F.; Zitman, T. Ebb and flood channel systems in the netherlands tidal waters. J. Coast. Res. 2005, 21, 1107–1120. [Google Scholar] [CrossRef]


| Site | Tidal Level | Flow Velocity | Flow Direction | |||
|---|---|---|---|---|---|---|
| CC | RMS | CC | RMS | CC | RMS | |
| T1 | 0.9705 | 0.0696 | / | / | / | / |
| T2 | 0.9638 | 0.0593 | / | / | / | / |
| T3 | 0.9740 | 0.0632 | / | / | / | / |
| T4 | 0.9607 | 0.0743 | / | / | / | / |
| S1 | 0.8075 | 0.0954 | 0.8224 | 0.1307 | 0.8992 | 0.0020 |
| S2 | 0.9684 | 0.0528 | 0.9411 | 0.0431 | 0.8010 | 0.0025 |
| Point | Skewness | Relative Deviation |
|---|---|---|
| 1 | 0.92 | 0.47 |
| 2 | −1.42 | −0.90 |
| 3 | −0.26 | −0.16 |
| 4 | −0.30 | −0.17 |
| 5 | 1.09 | 0.44 |
| 6 | −0.58 | −0.21 |
Publisher’s Note: MDPI stays neutral with regard to jurisdictional claims in published maps and institutional affiliations. |
© 2022 by the authors. Licensee MDPI, Basel, Switzerland. This article is an open access article distributed under the terms and conditions of the Creative Commons Attribution (CC BY) license (https://creativecommons.org/licenses/by/4.0/).
Share and Cite
Song, D.; Cheng, K.; Li, B.; Xu, X.; Deng, L.; Liu, C. Estimation of Tidal Current Asymmetry in an Archipelagic Region: The Zhoushan Islands. Water 2022, 14, 1485. https://doi.org/10.3390/w14091485
Song D, Cheng K, Li B, Xu X, Deng L, Liu C. Estimation of Tidal Current Asymmetry in an Archipelagic Region: The Zhoushan Islands. Water. 2022; 14(9):1485. https://doi.org/10.3390/w14091485
Chicago/Turabian StyleSong, Dan, Kaihang Cheng, Bo Li, Xuefeng Xu, Longci Deng, and Cong Liu. 2022. "Estimation of Tidal Current Asymmetry in an Archipelagic Region: The Zhoushan Islands" Water 14, no. 9: 1485. https://doi.org/10.3390/w14091485
APA StyleSong, D., Cheng, K., Li, B., Xu, X., Deng, L., & Liu, C. (2022). Estimation of Tidal Current Asymmetry in an Archipelagic Region: The Zhoushan Islands. Water, 14(9), 1485. https://doi.org/10.3390/w14091485