Article

Variation in Dissolved Organic Matter Using Absorbance and Fluorescence Measurements during Dry Season in Sta. Rosa and Cabuyao Rivers, Philippines

by
Jumar G. Cadondon
1,2,*,
Edgar A. Vallar
1,
Arnel B. Beltran
3,
Aileen H. Orbecido
3 and
Maria Cecilia D. Galvez
1
1
Environment And RemoTe sensing researcH (EARTH) Laboratory, Physics Department, College of Science, De La Salle University Manila, Taft Avenue, Manila 0922, Philippines
2
Division of Physical Sciences and Mathematics, College of Arts and Sciences, University of the Philippines Visayas-Miagao Campus, Miagao 5023, Philippines
3
Chemical Engineering Department, Gokongwei College of Engineering, De La Salle University Manila, 2401 Taft Avenue, Manila 1004, Philippines
*
Author to whom correspondence should be addressed.
Water 2022, 14(9), 1444; https://doi.org/10.3390/w14091444
Submission received: 7 April 2022 / Revised: 26 April 2022 / Accepted: 27 April 2022 / Published: 30 April 2022
(This article belongs to the Special Issue Water Quality Changes of Lakes and Rivers)

Abstract

:
Santa Rosa watershed, where the Santa Rosa River and Cabuyao River are located, is growing with increasing urbanization and commercialization in their surroundings. Water quality monitoring is an important tool in understanding the possible impacts of domestic, industrial, and commercial discharges, and agricultural run-off on river systems and their tributaries. With the integration of absorbance and fluorescence measurements, we can further examine the effects of land use and climate change on dissolved organic matter (DOM) sources found in river systems. In this study, these two rivers exhibit poor quality with varying values in each sampling station and period. DOM sources change from terrestrial to endogenous sources within the sampling period. High aromaticity and molecular size were observed in all downstream sampling stations. This is supported by the high values of humic-like substances. Fluorescence index values showed temporal changes from terrestrial to endogenous DOM sources from November 2019 to February 2020. This is also confirmed by the increasing trend in the biological index. The variation in all sampling stations can be attributed to varying land use, hydrological, and climatological changes such as typhoon Tisoy, and Taal Volcano eruption observed during the sampling period.

1. Introduction

Rivers are important for sustainable water supply for human activities such as agricultural supply, urban run-off, industrial applications, and landscape activities [1,2,3,4]. They also play a big part in maintaining biodiversity for local aquatic plants and animals in the community. Several river systems are developed to maintain water quality requirements to provide a healthy and sustainable ecosystem. However, there are studies wherein effluents from land use and precipitation are some of the factors affecting the dynamics of the water quality in river systems. According to the Philippines’ Department of Environment and Natural Resources (DENR) report, domestic sewage, and commercial and industrial wastes are some of the factors polluting our river systems [5]. Heavy rainfall caused by typhoons and/or monsoons produced heavy precipitation which impacts the quality and quantity of terrestrial pollutants from the surrounding land use to river systems. With the growing population, heavy use of the rivers by people and industry has increased the pollution in the river systems.
Different agencies conduct water quality monitoring, and they create projects that help the community in maintaining good water quality in river systems. Laguna Lake Development Authority (LLDA), a local agency, was created to strengthen environmental protection and authority over the basin’s surface water and river systems. They have programs on environmental and watershed management, fisheries, and community development that aim to maintain water quality and activities in rivers located in Laguna [6]. There have been reports on the water quality status of its rivers and their tributaries throughout the year [7,8,9,10]. Changes in the water quality of regulated rivers have become a problem due to climate change, and land-use patterns in society.
Conventional physicochemical parameters can characterize the changes in the nutrients in natural waters. River systems are analyzed based on these parameters guided by water quality standards [11,12]. However, these parameters cannot explore the possible autochthonous sources found in bodies of water caused by terrestrial pollution and/or climate change. Recent studies have reported that dissolved organic matter (DOM) is a useful parameter for correlating and evaluating water quality systems [7,13,14,15,16,17,18,19,20,21]. These methods use absorbance ratio which predicts dissolved organic carbon (DOC) [22,23,24,25,26], molecular weight (MW) [24,27,28], aromaticity [29,30], humification [24,31], hydrophobicity [32], trihalomethane formation potential (THMFP) [33], and DOM sources [34,35]. Other reports also measure fluorescence DOM, which are rich in carbon, nitrogen, and phosphorus to evaluate water quality in different aquatic systems [36,37,38]. The use of excitation-emission matrix (EEM) fluorescence spectroscopy can also predict compositions and properties of DOM in aquatic ecosystems which are related to terrestrial sources such as urban run-off, agriculture, and industry [39,40,41]. Hence, absorbance and fluorescence measurements of DOM can quickly provide its sources and compositions at natural concentrations without complex pretreatments before analysis. These absorbance and fluorescence data can provide an overview of water quality in the rivers and estuaries while standard water quality measurements are conducted.
To solve these emerging problems, we aim to understand the influence of the dry season and land use on the water quality of Sta. Rosa (SR) and Cabuyao (CR) rivers. Water quality parameters such as pH, electrical conductivity (EC), biochemical oxygen demand (BOD), dissolved organic carbon, nitrates, phosphates, and suspended solid parameters were conducted among sampling stations located in SR and CR. The three objectives of our study were to (1) use absorbance spectra to explore organic pollution sources, (2) use 3D-EEM spectra to determine components of organic pollution and their impacts on the two rivers, and (3) understand the influence of the dry season and land use on water quality. These findings can provide significance in understanding river systems. They can be used as a guide in improving assessment and management practices sponsored by the government and private sectors which serves as a basis to control terrestrial impacts in the waters.

2. Materials and Methods
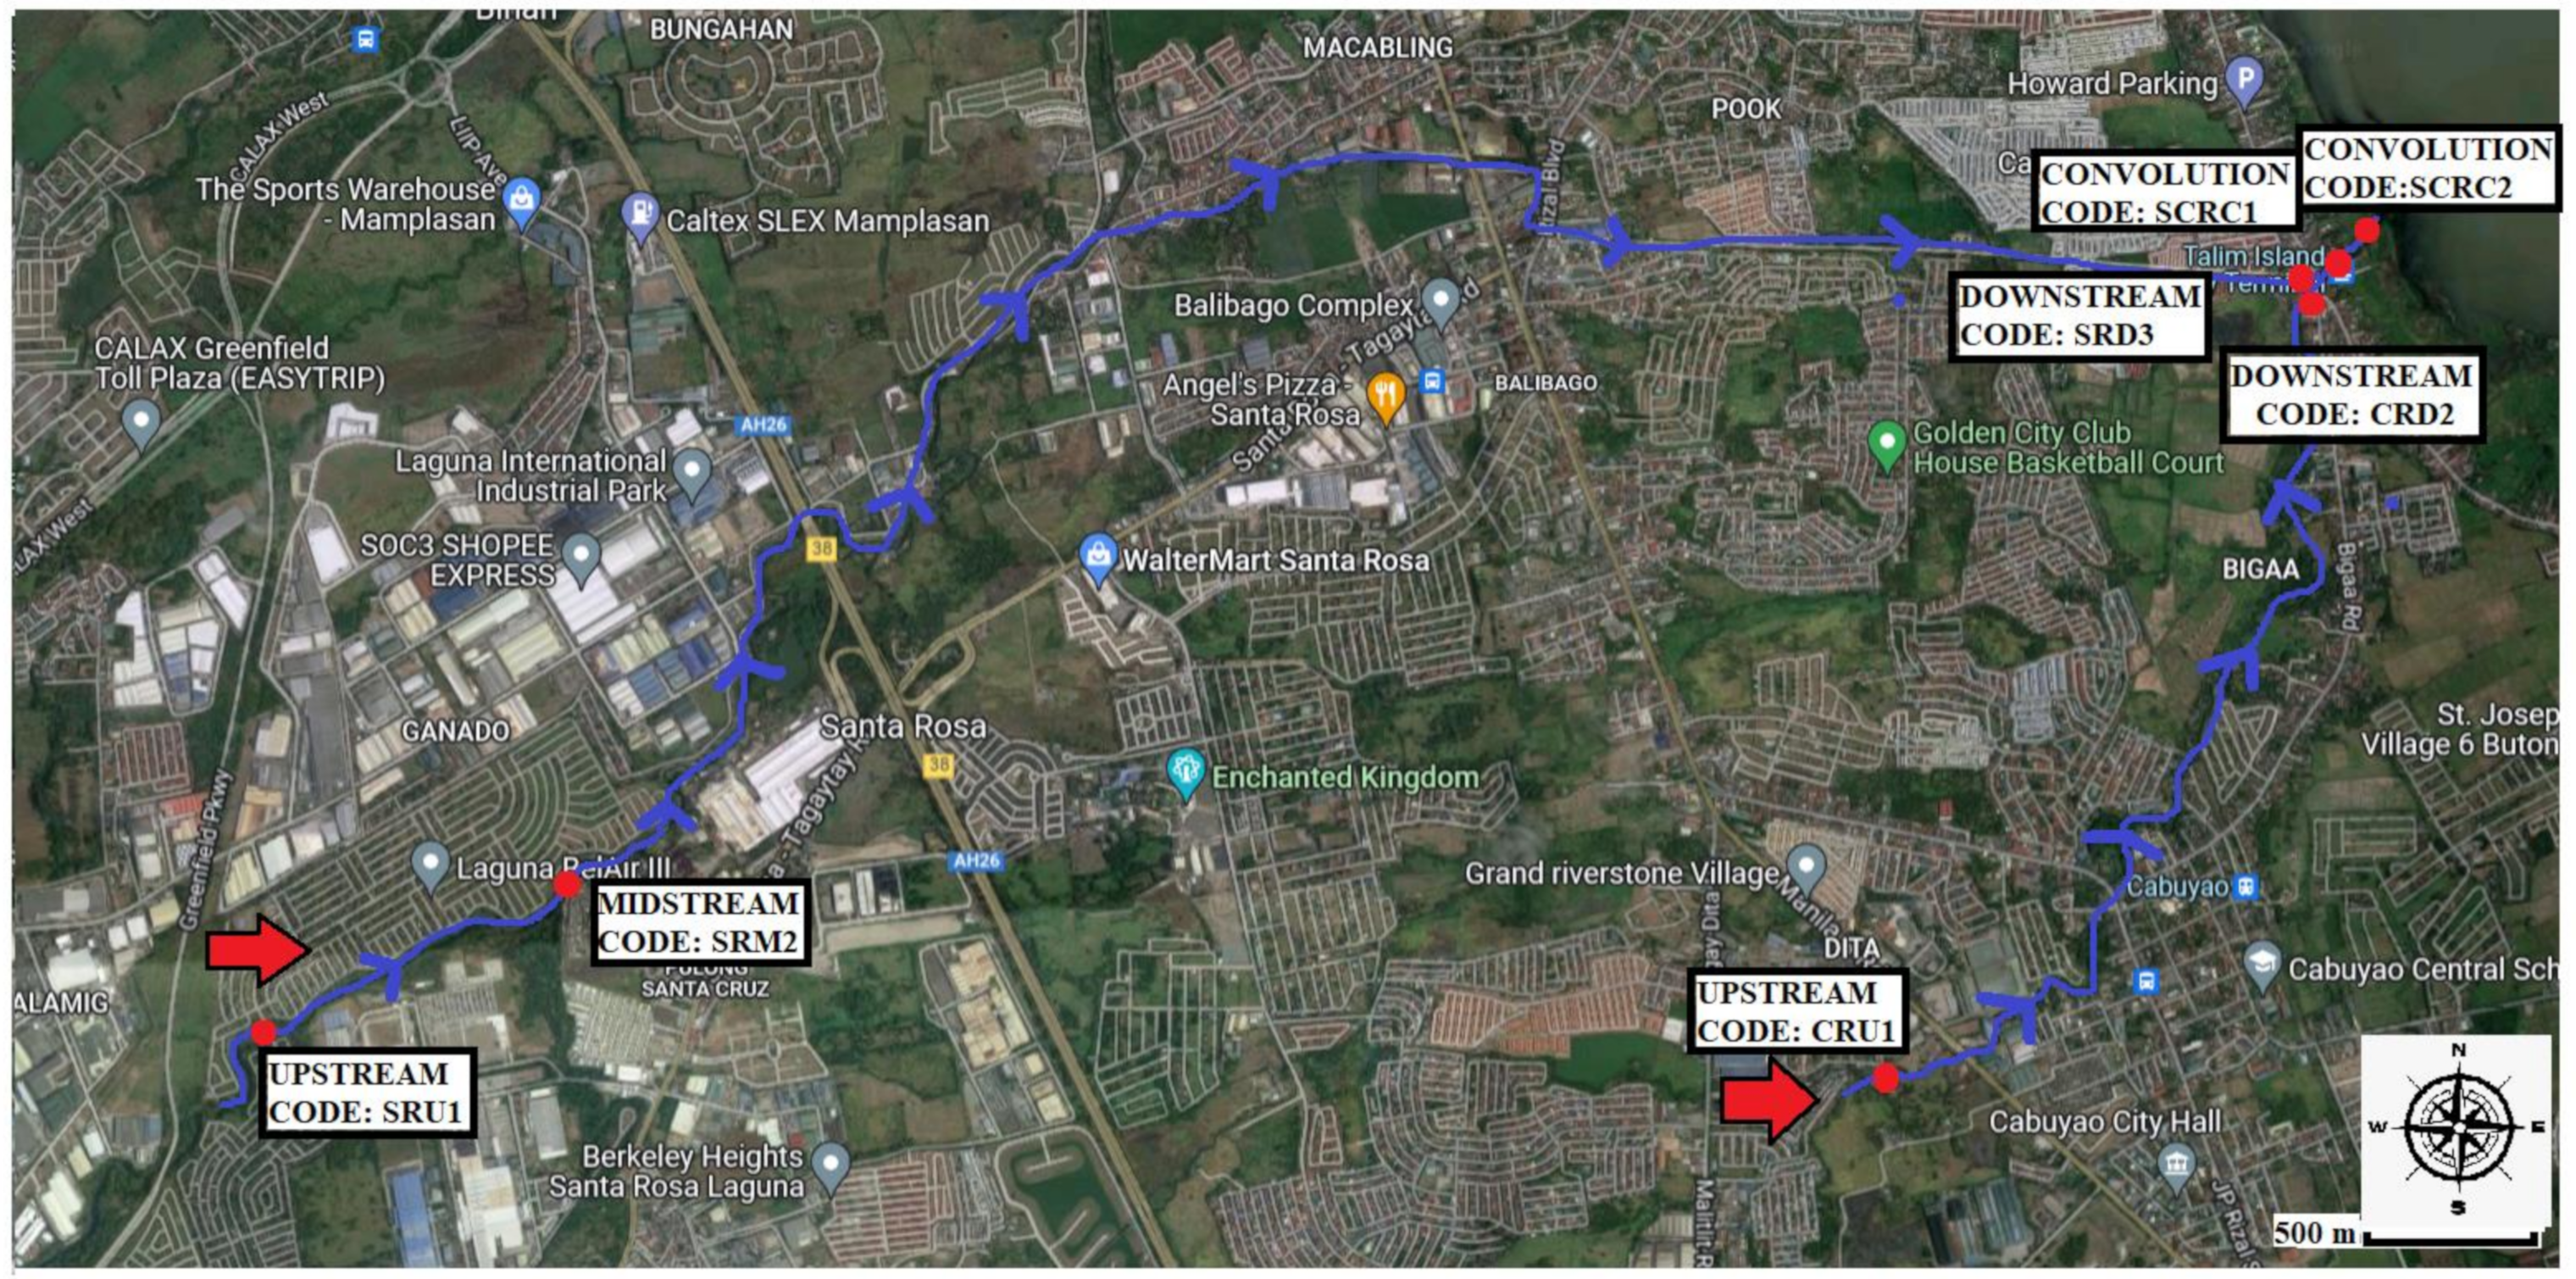
2.1. Study Area

Laguna province has two distinct seasons: the dry season from November to April and the wet season during the rest of the year. The dry season may be subdivided into (a) cool dry season, from December to February; and (b) hot dry season, from March to May. It is classified under the Koppen climate classification as having a tropical monsoon climate around areas of Calamba to Calauan, while Binan to Cabuyao is classified as a tropical savanna climate while the area from Luisiana to Pangil has a tropical rainforest climate [42].
Sta. Rosa river and Cabuyao river are in the province of Laguna, Calabarzon region in Luzon, Philippines. Laguna covers a total area of 1917.85 km2 and engulfs the southern shores of Laguna de Bay [43]. Cabuyao and Sta. Rosa are first-class urbanized cities in the province of Laguna. They are in the western portion of Laguna and about 43 km southeast of Metro Manila. Based on the 2020 Census, Cabuyao city has a total population of 355,330 while Sta. Rosa City has a 414,812 total population [44]. The Sta. Rosa watershed is composed of two municipalities (Cabuyao, Laguna; Silang, Cavite) and two cities (Sta. Rosa, and Binan, Laguna). The total land area of the Sta. Rosa basin is 115 sq. km (Table 1). Based on the Hydrology and Hydrogeology Report of Sta. Rosa (2009), the city of Sta. Rosa comprised 37% of the Sta. Rosa basin and the city of Cabuyao, 25%. In terms of land use categories, Sta. Rosa holds most of the grasslands in the whole watershed, however, these are temporary due to the increasing property development in the city. Sta. Rosa’s land use is currently transformed from an agricultural town to a major residential, industrial, commercial, and recreational center in the South Luzon region. With this, agricultural land is found in Cabuyao (10%), followed by Sta. Rosa (9%) while commercial-residential-industrial are evident in Sta. Rosa (16%) compared to Cabuyao (10%) [45].

2.2. Sampling Stations and Strategy

Seven sampling stations were selected covering commercial-residential, industrial, grassland, and rice lands connected to SR and CR. The land-use patterns and coordinates of the sampling stations are shown in Table 2.
Surface water samples were collected from the two regulated rivers as illustrated in Figure 1. The sampling period covers November 2019 to February 2020 which is considered the dry season.
The sampling time for the two rivers is one day each month. Weather conditions and observations were also recorded as shown in Table 3.
The average air temperature measured ranges from 25 to 26 °C. The average relative humidity ranges from 70 to 75 °C from November 2019 to February 2020. Precipitation measured range from 0 to 0.99 mm. Based on the observations, there were unexpected events that happened during the sampling, however, these must be recorded for further analyses. It should be noted that during December 2019, Typhoon Tisoy (PAGASA Typhoon name) caused heavy rains to fall on Laguna and other parts of the Luzon. In January 2020, Taal Volcano erupted which spewed ashfall. Laguna is 83 km away from the volcano which affected the residents and the environment.

2.3. Physiochemical Analyses

In-situ water quality monitoring was conducted to measure pH, DO, EC, and water temperature using Hach HQ40D/intelliCAL (Loveland, CO, USA) rugged field device. For the water collection, there are four water sampling preparations conducted. For each sampling station, half-liter water samples were collected for BOD and DOC tests using BOD and DOC bottles, respectively. One liter of water sample was collected for nitrates, total phosphates, and chlorides tests. A half-liter of water sample was collected for oil and grease measurements. And lastly, another half-liter of water sample was collected for absorbance and fluorescence measurements. All water collection was based on the standard water sampling method [11,12]. BOD and DOC were conducted using the grab sampling method and were sent to the CRL Environmental Corporation laboratory (Angeles City, Philippines) for analysis. Water samples tested for TSS analysis (SM 2540 D) were dried at 103–105 °C before measurements. For DOC (SM 5310 C), Nitrates, and Phosphates tests, HACH DR1900 portable spectrophotometer was used. A 5-day BOD test (SM 5210 B) was conducted on the water samples. The argentometric method was performed for Chlorides tests (SM 4500 Cl-B). Gravimetry (n-Hexane extraction) was performed for oil and grease measurements (SM5520 B).
All physico-chemical measurements were evaluated based on the DENR Administrative Order No. 2016-08 water quality guidelines and general effluents standards on water and wastewater samples. It also provides guidelines for the classification of water bodies in the Philippines. Freshwater systems are classified based on water bodies and usage. Class AA (or Public Water Supply Class I) is intended primarily for water having watersheds, and protected areas. Class A (or Public Water Supply II) is intended as a source of water supply requiring conventional treatment. Class B (or Recreational Water Class I) is intended for primary contact recreation. Class C is used for fishery water, recreational water activities, agriculture, irrigation, and livestock watering. Class D is intended for navigable waters [11].

2.4. Absorbance Measurements

The samples were filtered using 0.45 μm microfiber filter paper and were stored in an icebox with an initial temperature of 10 °C. One (1) mL of water sample was collected and transferred into three 10 mm UV-vis cuvette using a micropipette. Absorbance measurements were conducted in the Molecular Science Unit laboratory, De La Salle University-Manila using Genesis 10 uv Thermo Spectronic (Waltham, MA, USA) set-up.
Absorption coefficient (or absorbance) is the absorbance converted to Napierian form (ln10) and normalized by the cell length [48]. It is the most common parameter used in the field of environmental sciences [49,50], and engineered systems [51,52]. It has been commonly used to quantify the concentration of DOM [53,54,55]. Absorbance at specific wavelengths has been widely suggested to represent or predict DOC concentrations. These absorption values and DOC concentrations are reported to have high correlation in natural waters such as lakes [22,56], rivers [22,57], estuaries [54,58,59], and ocean systems [23,60].

Absorption Ratios

Absorption ratios are defined as the ratios of absorption at two different wavelengths. These ratios are used to probe the sources and chemical composition of DOM. Instead of using concentrations in analyzing DOM, we use ratios to reflect its quality. Table 4 shows the absorbance ratios used in DOM analyses for SR and CR samples. The absorption ratio. A250/363 has been used to indicate the molecular sizes and weight of DOM [28,61].
Sources of DOM can also be derived through absorption ratios. DOM sources vary in their absorption ratio such as A254/436 for estuarine/seawater environment [34], and A280/A665 for humic acids from lake sediments [35]. From the different characteristics of absorbance ratio, the degree of humification of DOM is also an important part of the analysis. A300/400 have been employed to indicate the humification degree in soil humic [62], soil fulvic [31], and lake [24].
Based on the absorption ratios, we could understand the composition of DOM. A254/436 has been used to indicate lignin degradation [63] and estimate the relative composition of autochthonous versus terrestrial DOM [34,64].

2.5. EEM Fluorescence Measurements

From the filtered water samples, one mL was collected using a micropipette and transferred to 10 mm UV-vis cuvettes. The water samples from the two rivers were measured using Ocean Optics fluorescence spectroscopy set-up. This was previously used for the preliminary analysis of water samples from estuarine and lake environments [7,58]. The scanning property of the set-up ranges from 250 to 450 nm for the excitation spectra (with 5 nm interval), and 300 to 600 nm for the emission spectrum with the same step increment, and 0.5 s of integration time. To adjust the EEM data, the EEM response of Milli-Q water served as a blank sample and was subtracted from the sample EEMs. The fluorescence intensities of the EEMs were normalized, converting arbitrary units to Raman units (RU) [65].
To quantify the 3D-EEM results, the corrected EEMs were imported to MATLAB R2020b to measure the indices and intensities found in Table 5. The obtained parameters are tryptophan-like (Peak T), humic-like (Peak C), and fulvic-like (Peak A) peaks for the composition of DOM. Indices such as fluorescence index (FI), biological index (BIX), and humification index (HIX) have been computed to determine the behavior of DOM.
The maximum peak at the excitation region of 210 to 250 nm and emission region of 320 to 380 nm is the Tryptophan-like value. These tryptophan-like fluorescence components are protein-like substances, which may be derived from human activities [66,67]. Another important peak is the humic-like peak derived from the excitation region of 210 to 250 nm and the emission region of 380 to 550 nm. Also, the fulvic acid-like component of DOM is collected from the excitation region of 250 to 430 nm and the emission region of 380 to 550 nm. These humic and fulvic acids can be derived from the organic matter originating from microbial activity [67]. FI value was measured by computing the ratio between the emission wavelengths at 470 nm and 520 nm at the excitation wavelength of 370 nm. It differentiates DOM sources as terrestrially derived or microbially derived sources [68]. The BIX value is the fluorescence emission intensity ratio at 380 nm and 430 nm with an excitation wavelength of 310 nm [20]. The HIX value is the fluorescence emission ratio of the integral area at regions 435 to 480 nm and 300 to 345 nm at an excitation wavelength of 254 nm [69]. The HIX value is important in analyzing the degrees of humification at the two rivers.

2.6. Statistical Analyses

The variations in physico-chemical parameters across the sampling stations (spatial) and months were analyzed using a one-way analysis of variance (ANOVA). Only the complete data from all sampling stations in four months were used for further analyses. Pearson correlations were used to correlate between physico-chemical, absorbance, and fluorescence measurements.

3. Results

3.1. Physico-Chemical Properties of River Water

Physico-chemical measurements are summarized for Sta. Rosa and Cabuyao rivers in Table 6. The mean water temperature in November 2019 is 28.95 °C for SR and 28.68 °C for CR. Lower than 1.05 °C was recorded for December 2019 for SR and a decrease of 0.1 °C for CR was observed. For January 2020, SR recorded a water temperature of 28.58 °C while CR is at 28.20 °C. No significant change was recorded for February 2020 with a temperature of 28.33 °C for SR while 27.95 °C for CR. The pH value for all sampling stations are relatively stable and within the pH range set by the standard. DO values were observed to be below the minimum standard for Type C waters. All DO values for the sampling months of November 2019, January, and February 2020 are below hypoxic levels. Wastes from sewage, human and animal, and biodegradable products may consume the dissolved oxygen in river systems causing low values as observed [70]. The EC values for all SR and CR stations are similar during the same sampling period from November 2019 to February 2020.
TSS measurements were below the standard value set except for the SRM2 sampling station where its value is 156 mg/L for November 2019. Nitrate concentrations were all below 2 mg/L which is considered the usual concentration for surface water samples [11]. TP concentrations were higher than 1 mg/L, which is above the minimum value for surface water samples. Chloride measurements for SR and CR sampling stations range from 6 to 296 mg/L.
All sampling stations are within the acceptable range except for SRU1 which recorded a value of 296 mg/L for November 2019. SRD3 sampling station showed high values for oil and grease measurements specifically for February 2020. BOD5 concentrations are higher than the maximum concentration of 7 mg/L set by DENR-DAO 2016-08 for type C waters. River water samples above the standard set are considered heavily polluted. High DOC concentrations above 5 mg/L were measured from December 2019 to February 2020 in all sampling stations. The high production of organic carbon shows the presence of organic matter in all water samples.
Monthly and spatial variations in TP, Oil and Grease, BOD, DOC, DO, and Nitrates were observed. Monthly variations are significant in DO (p < 0.10), Nitrates (p < 0.01), and TP (p < 0.10). Only TP (p < 0.01), Oil and Grease (p < 0.05), BOD (p < 0.05), and DOC (p < 0.01) showed significant spatial variations.

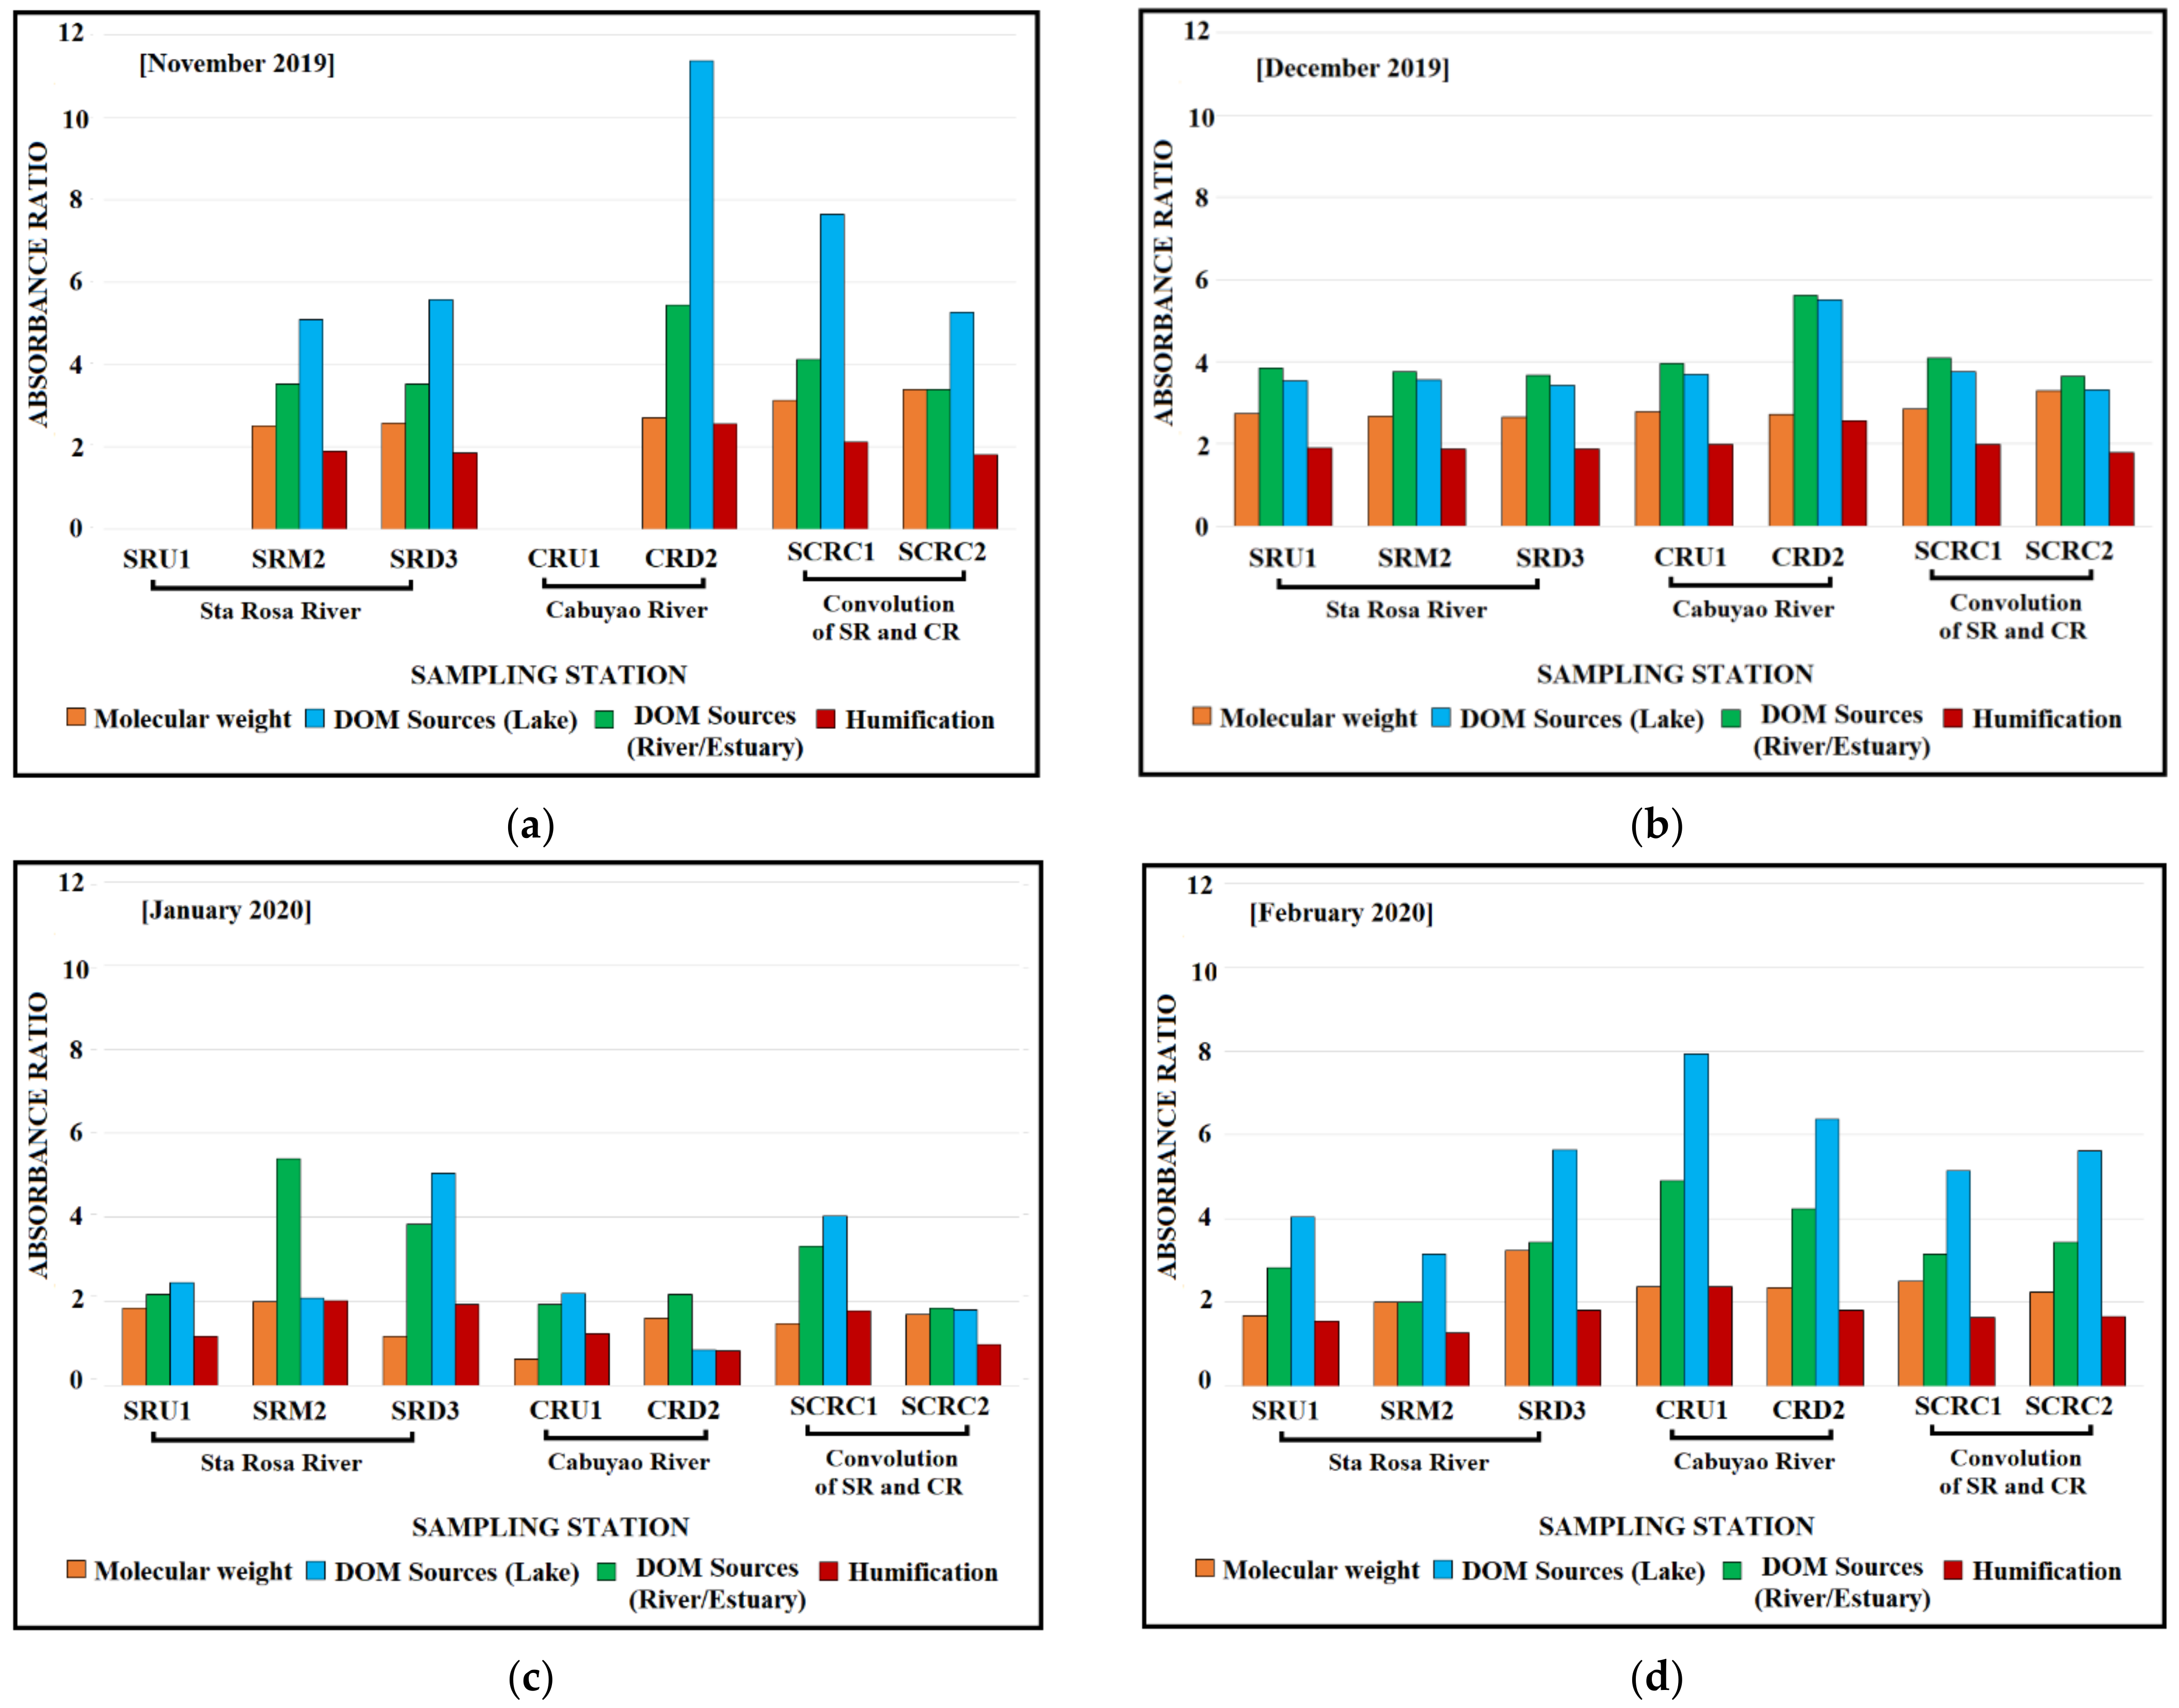
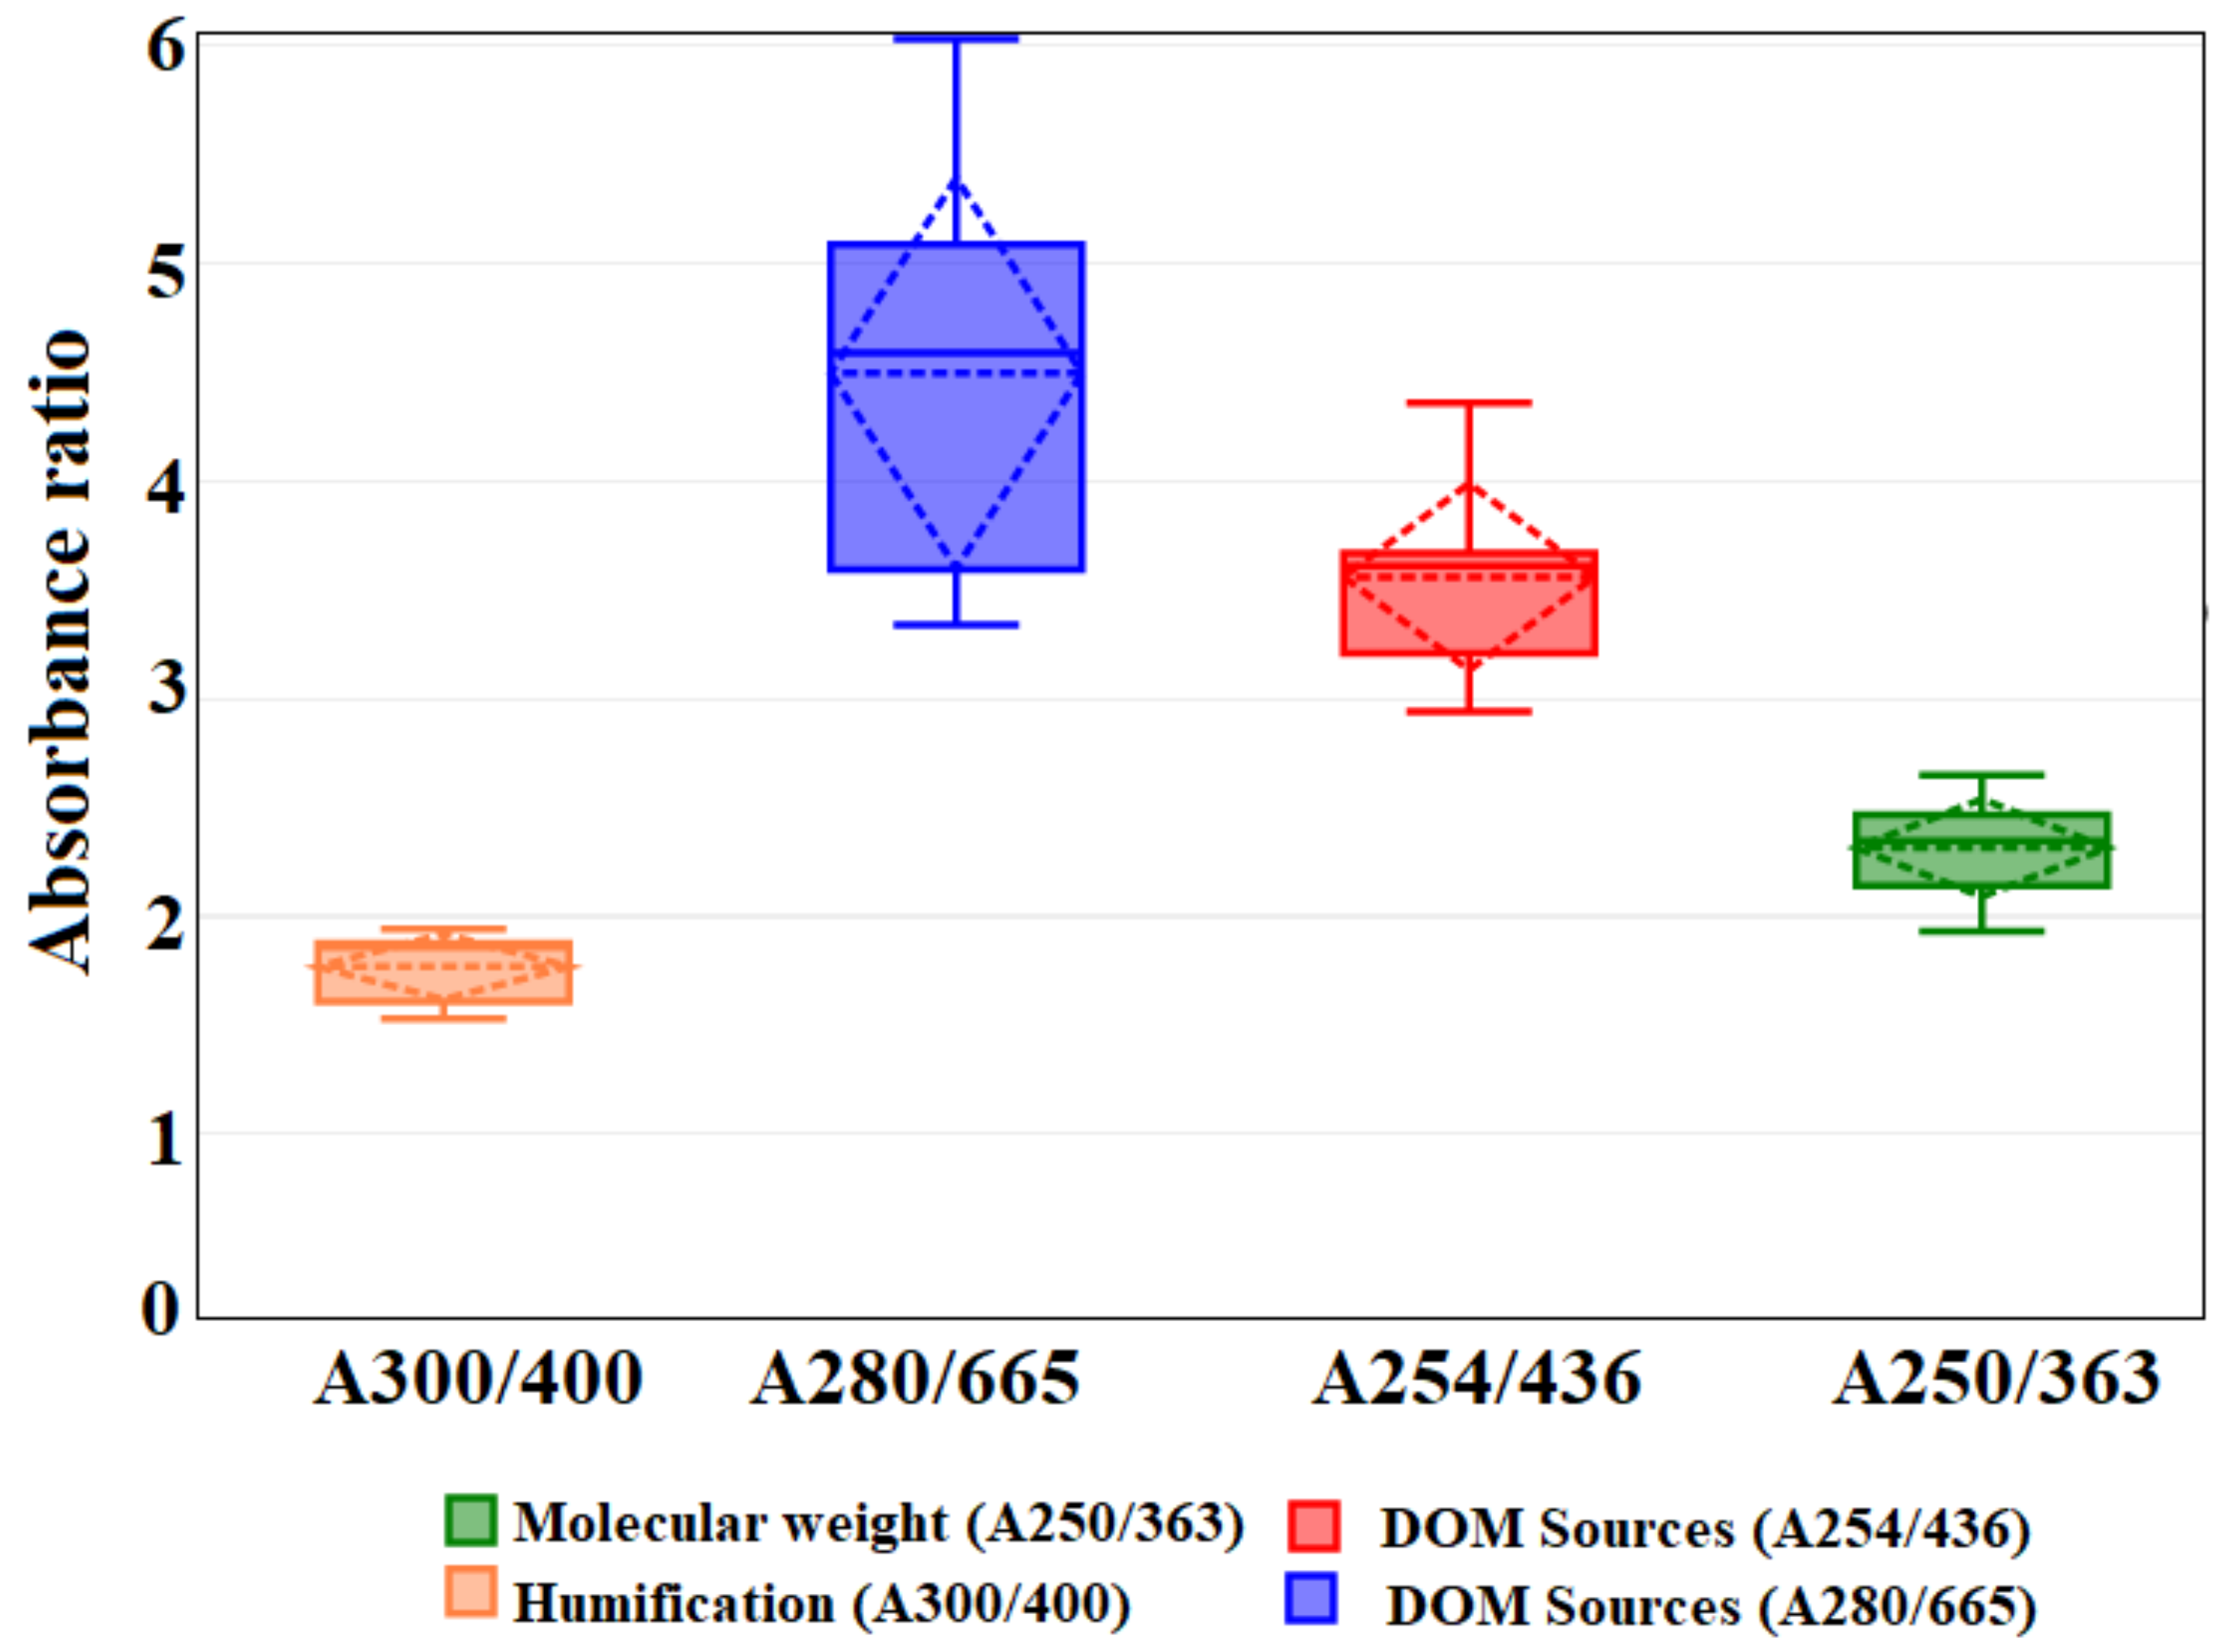
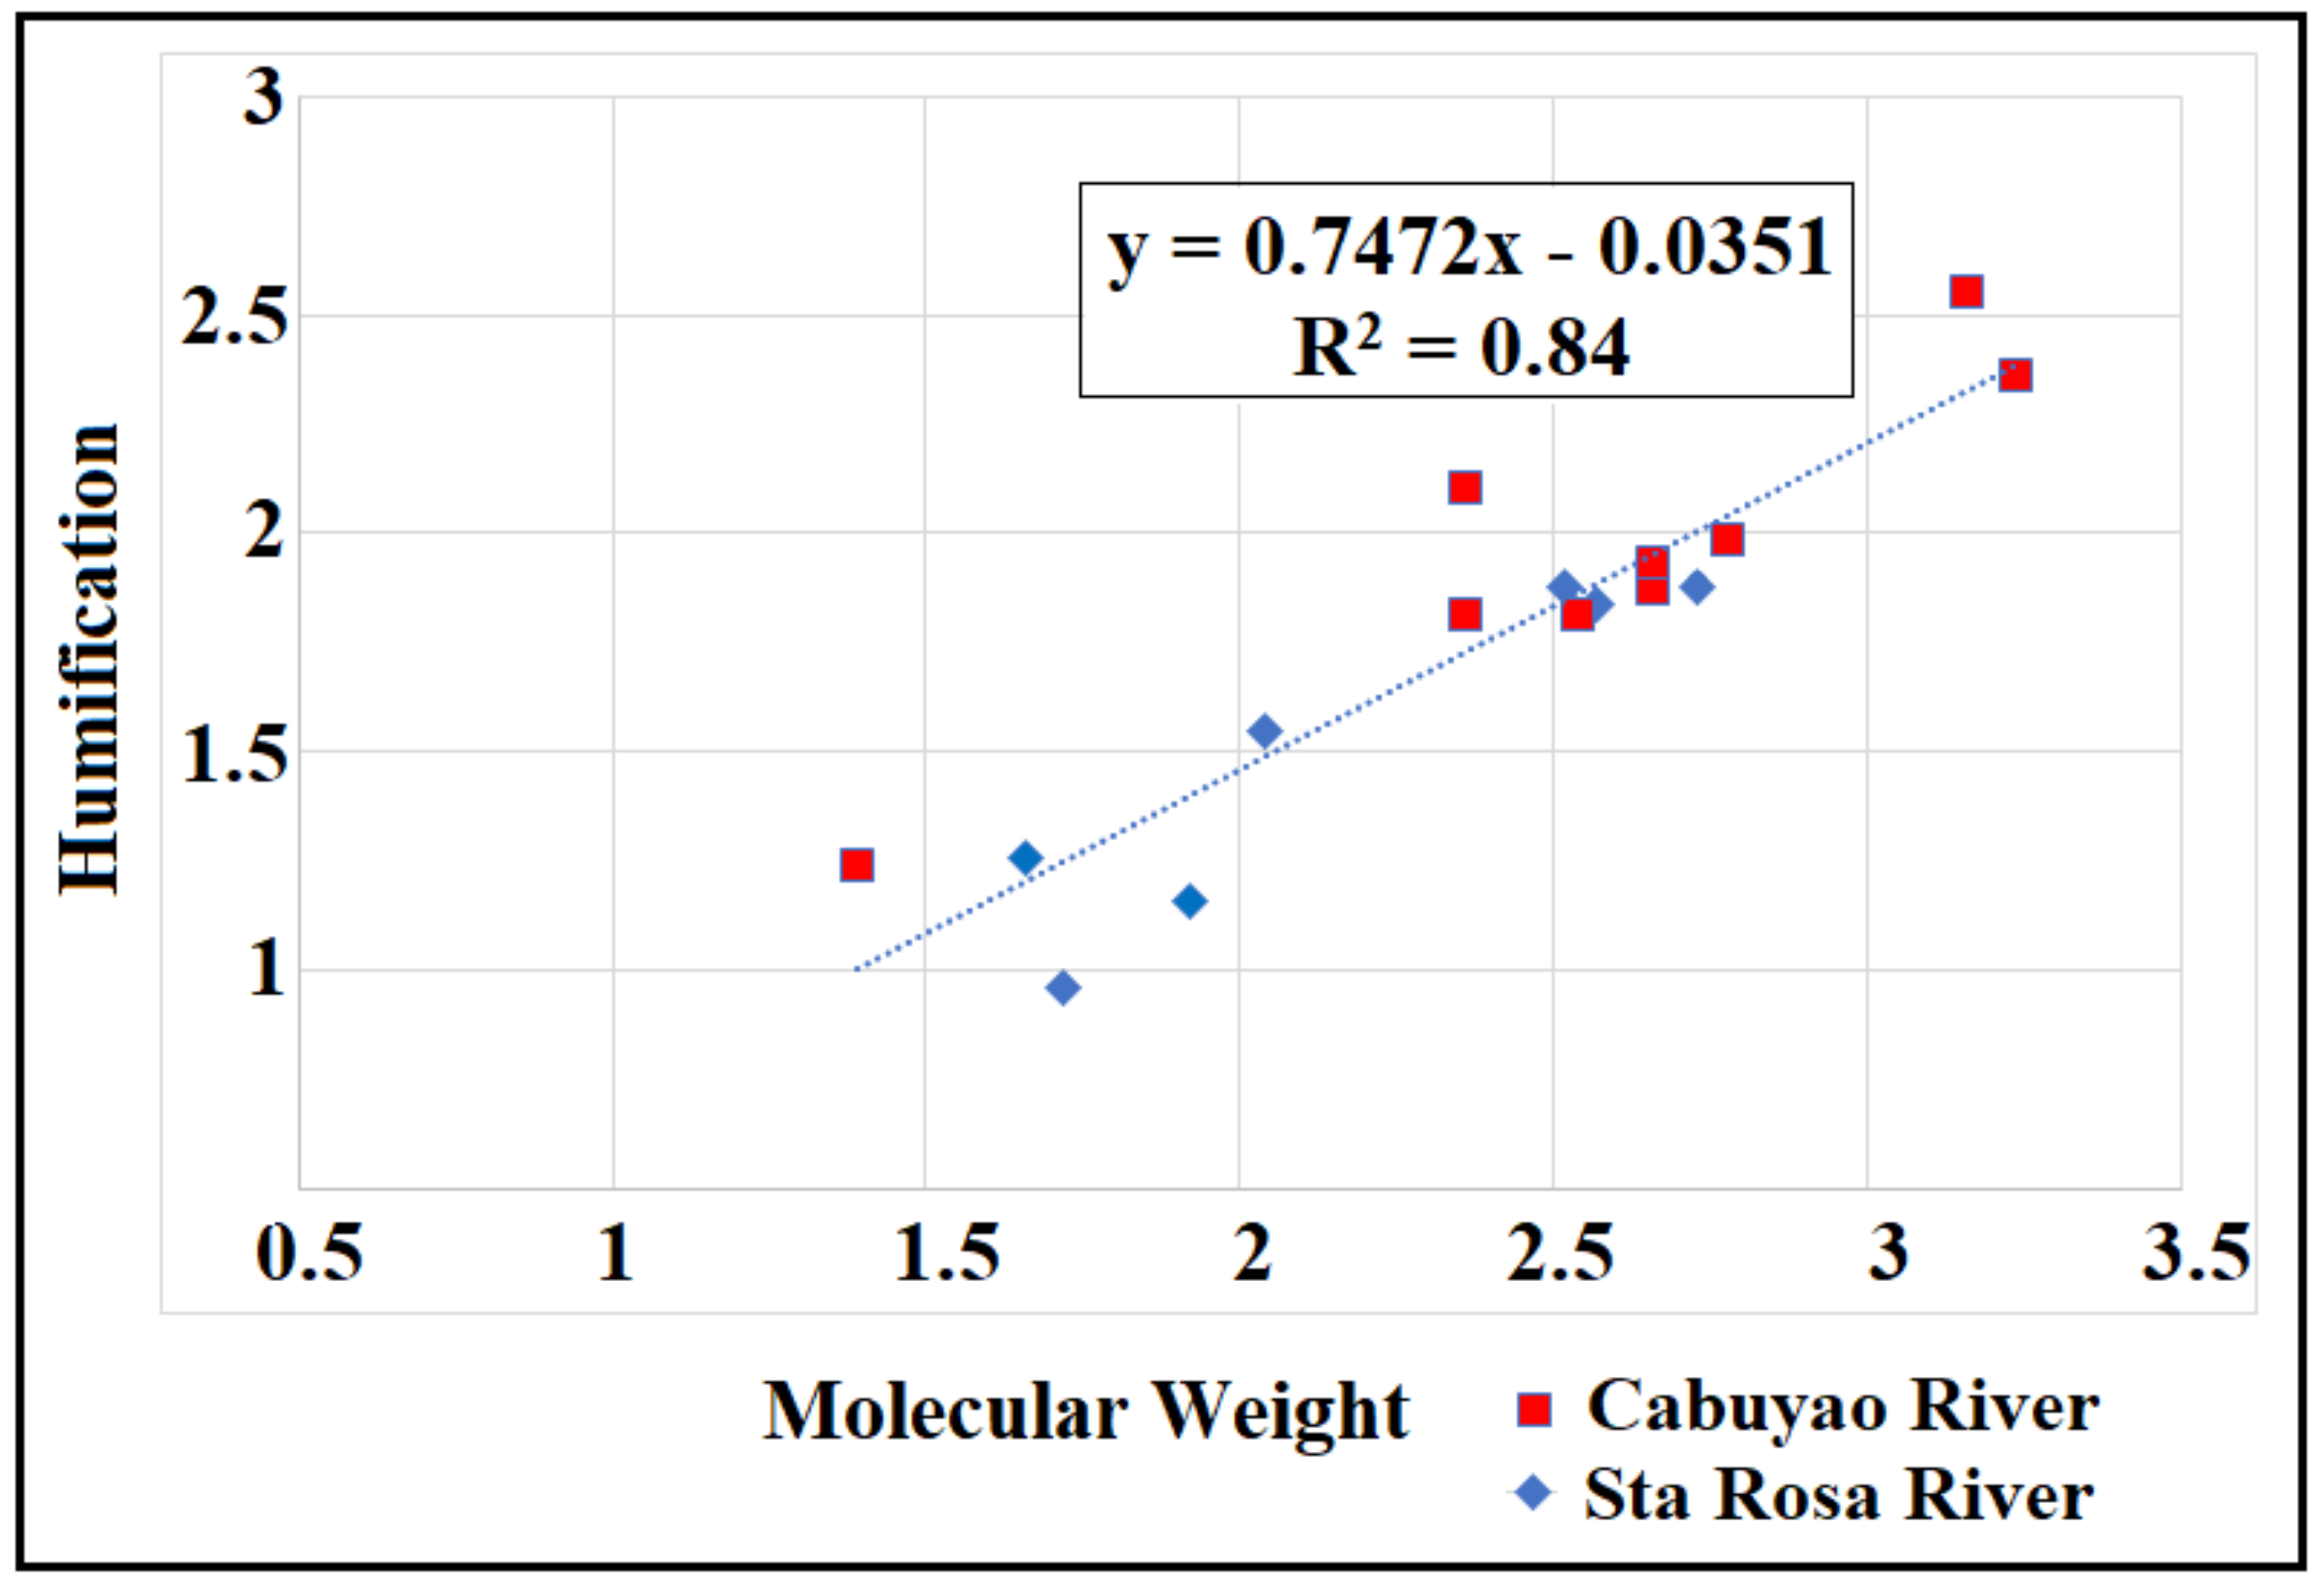
3.2. Absorption Ratios of SR and CR

The absorption ratios of the DOM characteristics showed temporal changes in the two rivers and differences among all sampling stations are shown in Figure 2. No data were collected for SRU1 and CRU1 sampling stations for November 2019 due to local repairs in the area. DOM sources at A254/436 and A254/436 for estuary/rivers and lakes, respectively, showed a trend from upstream to downstream. In the downstream sampling locations, absorbance ratios during November 2019 and December 2019 are higher in CR than in SR. Lower values of absorbance ratios were observed in January 2020 for SR and CR sampling stations. For February 2020, increasing values of DOM sources were observed from upstream to downstream of SR while decreasing ratios for CR. All absorbance ratios range from 0.7 to 7.9.
Absorbance ratio distributions of molecular weight, DOM sources, and humification are shown in Figure 3. Molecular weight at A250/363 ranges from 1.93 to 2.65 (Mean: 2.32, SD: 0.22). Measured values at A250/363 showed the presence of organic matter in the water samples. It indicates a probable mixture of autochthonous sources from the biological activity and allochthonous sources of organic matter in river systems. Molecular weight values observed in both SR and CR are low compared to the standard range which indicates anthropogenic allochthonous sources of DOM [28,61].
Variance in DOM sources are measured at A254/436 (Mean: 3.56, SD: 0.43), and A280/665 (Mean: 4.49, SD: 0.89). DOM sources at A254/436 and A280/665 range from 2.94 to 4.36, and 3.34 to 6.03, respectively. These values are common for terrestrial/allochthonous DOM, which has a greater aromatic carbon content associated with humic-like substances derived from plant and soil organic matter [34].

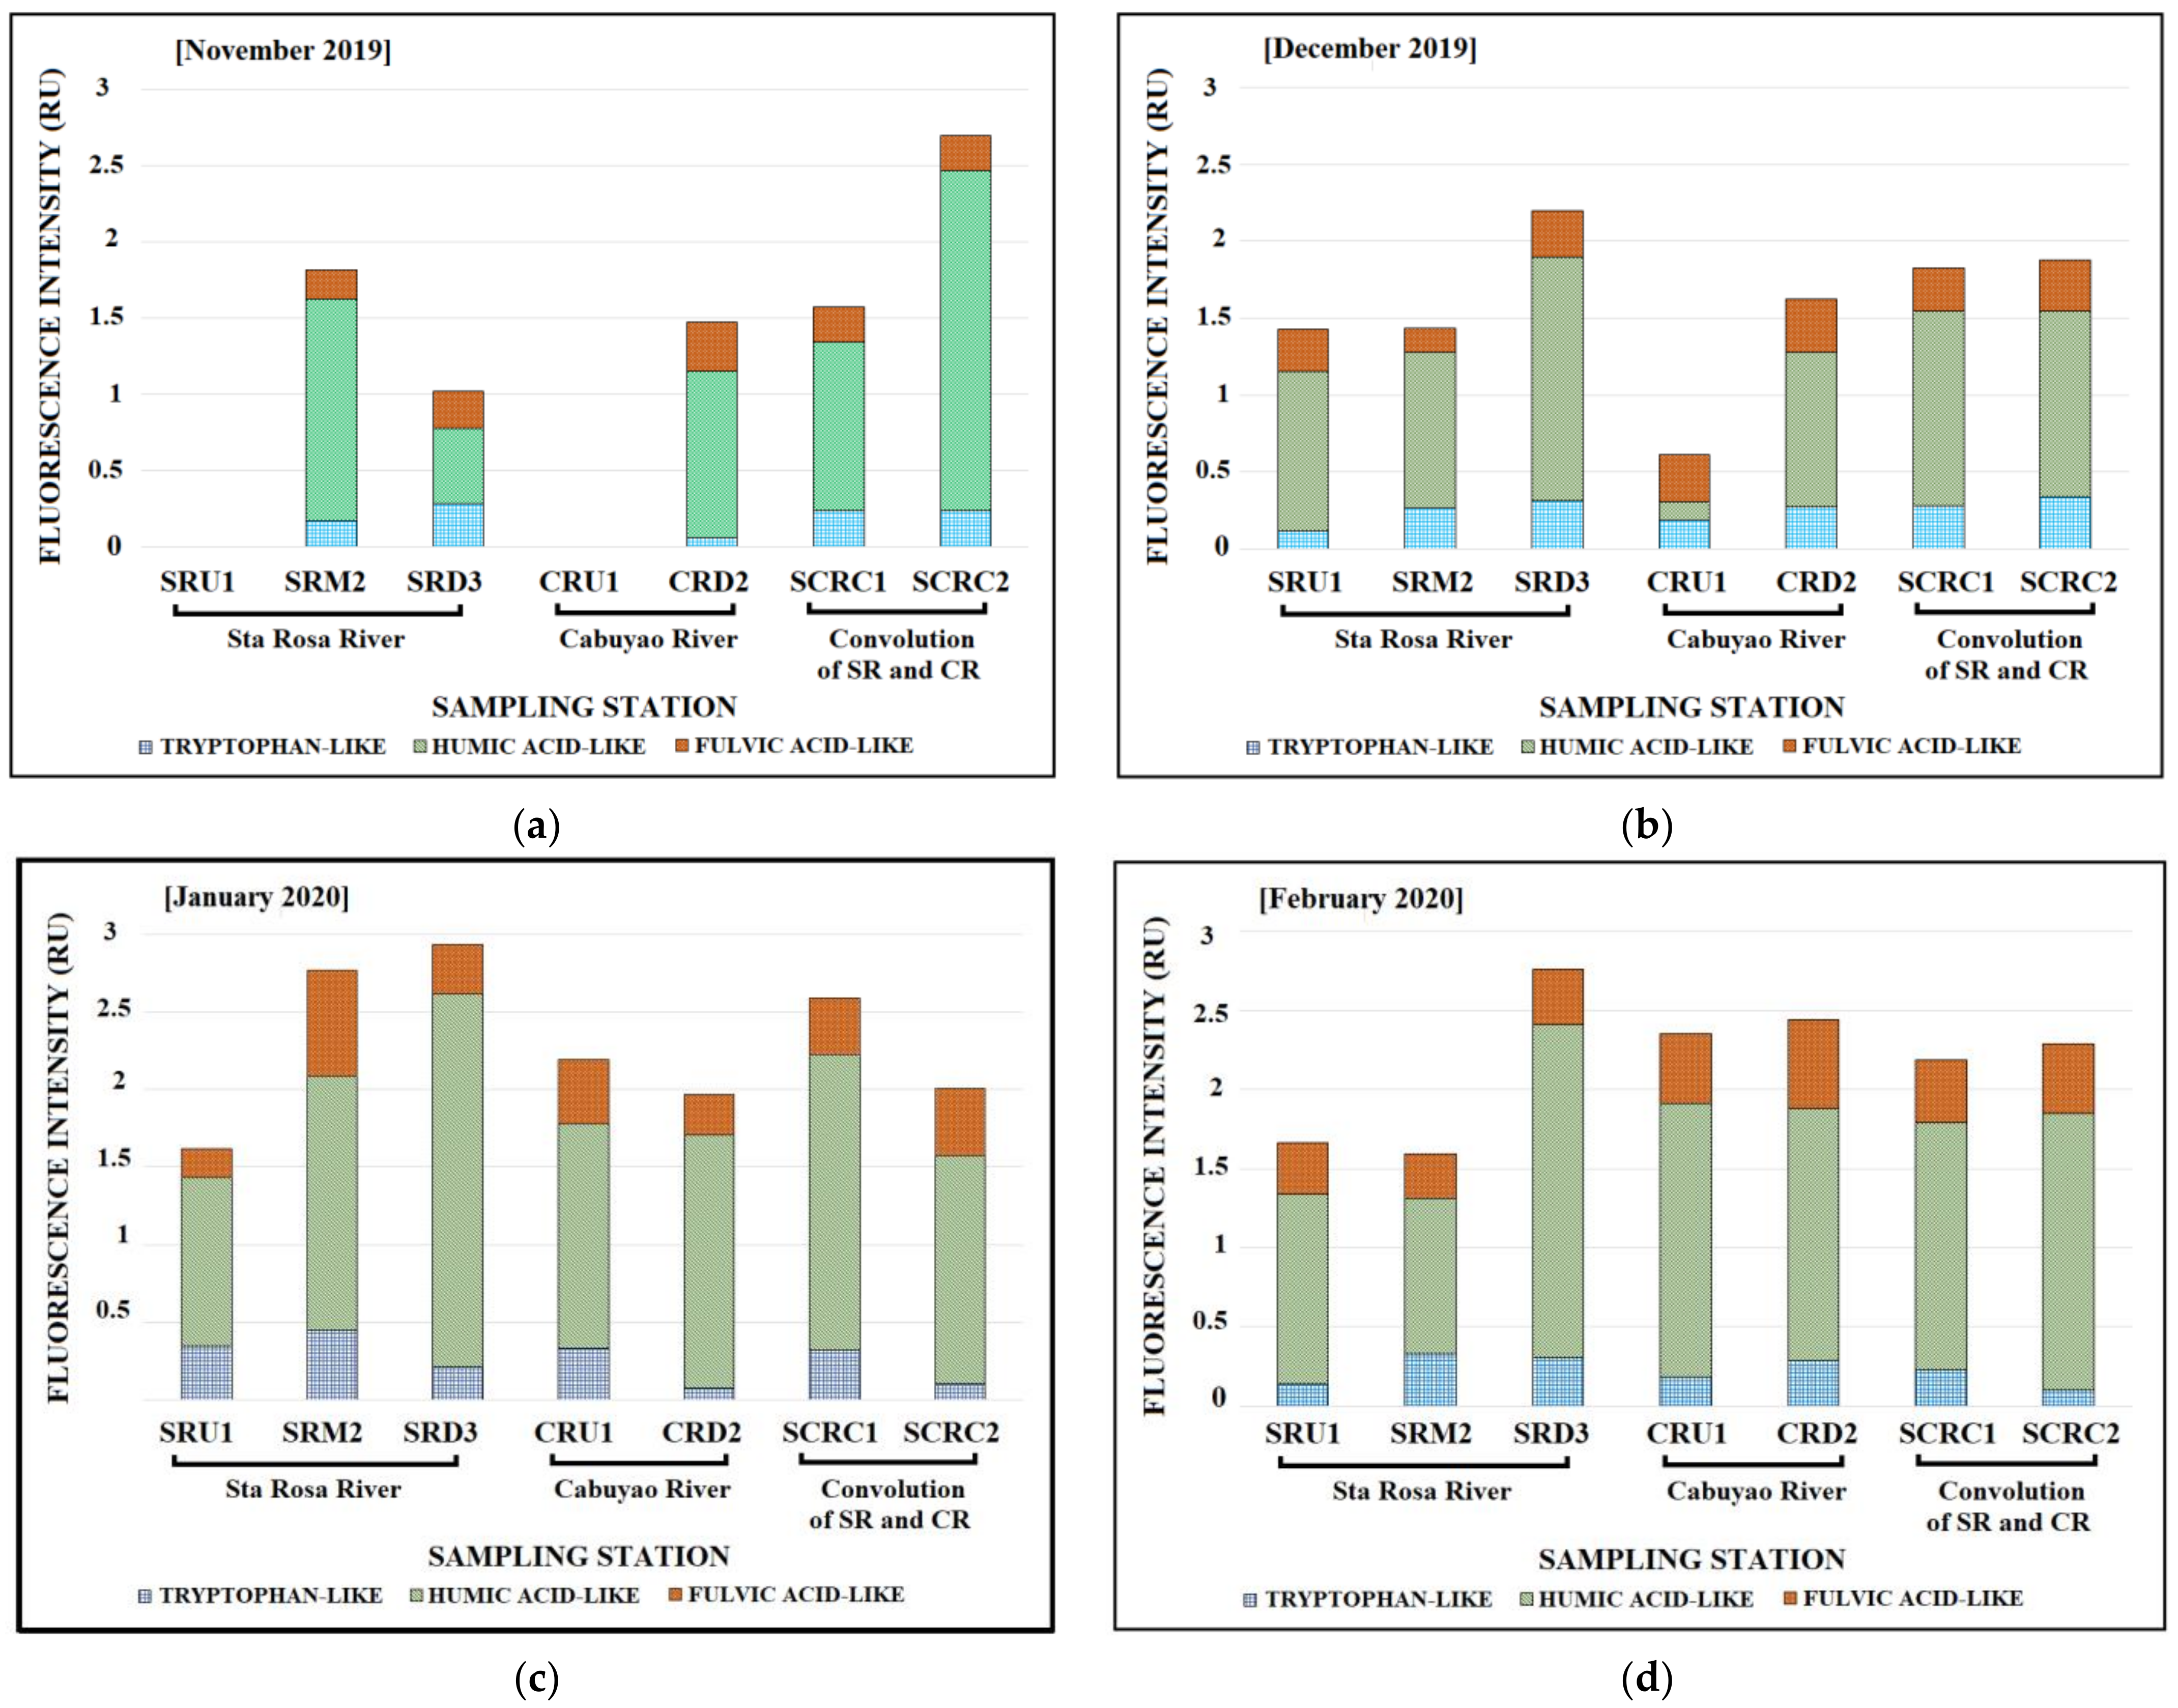
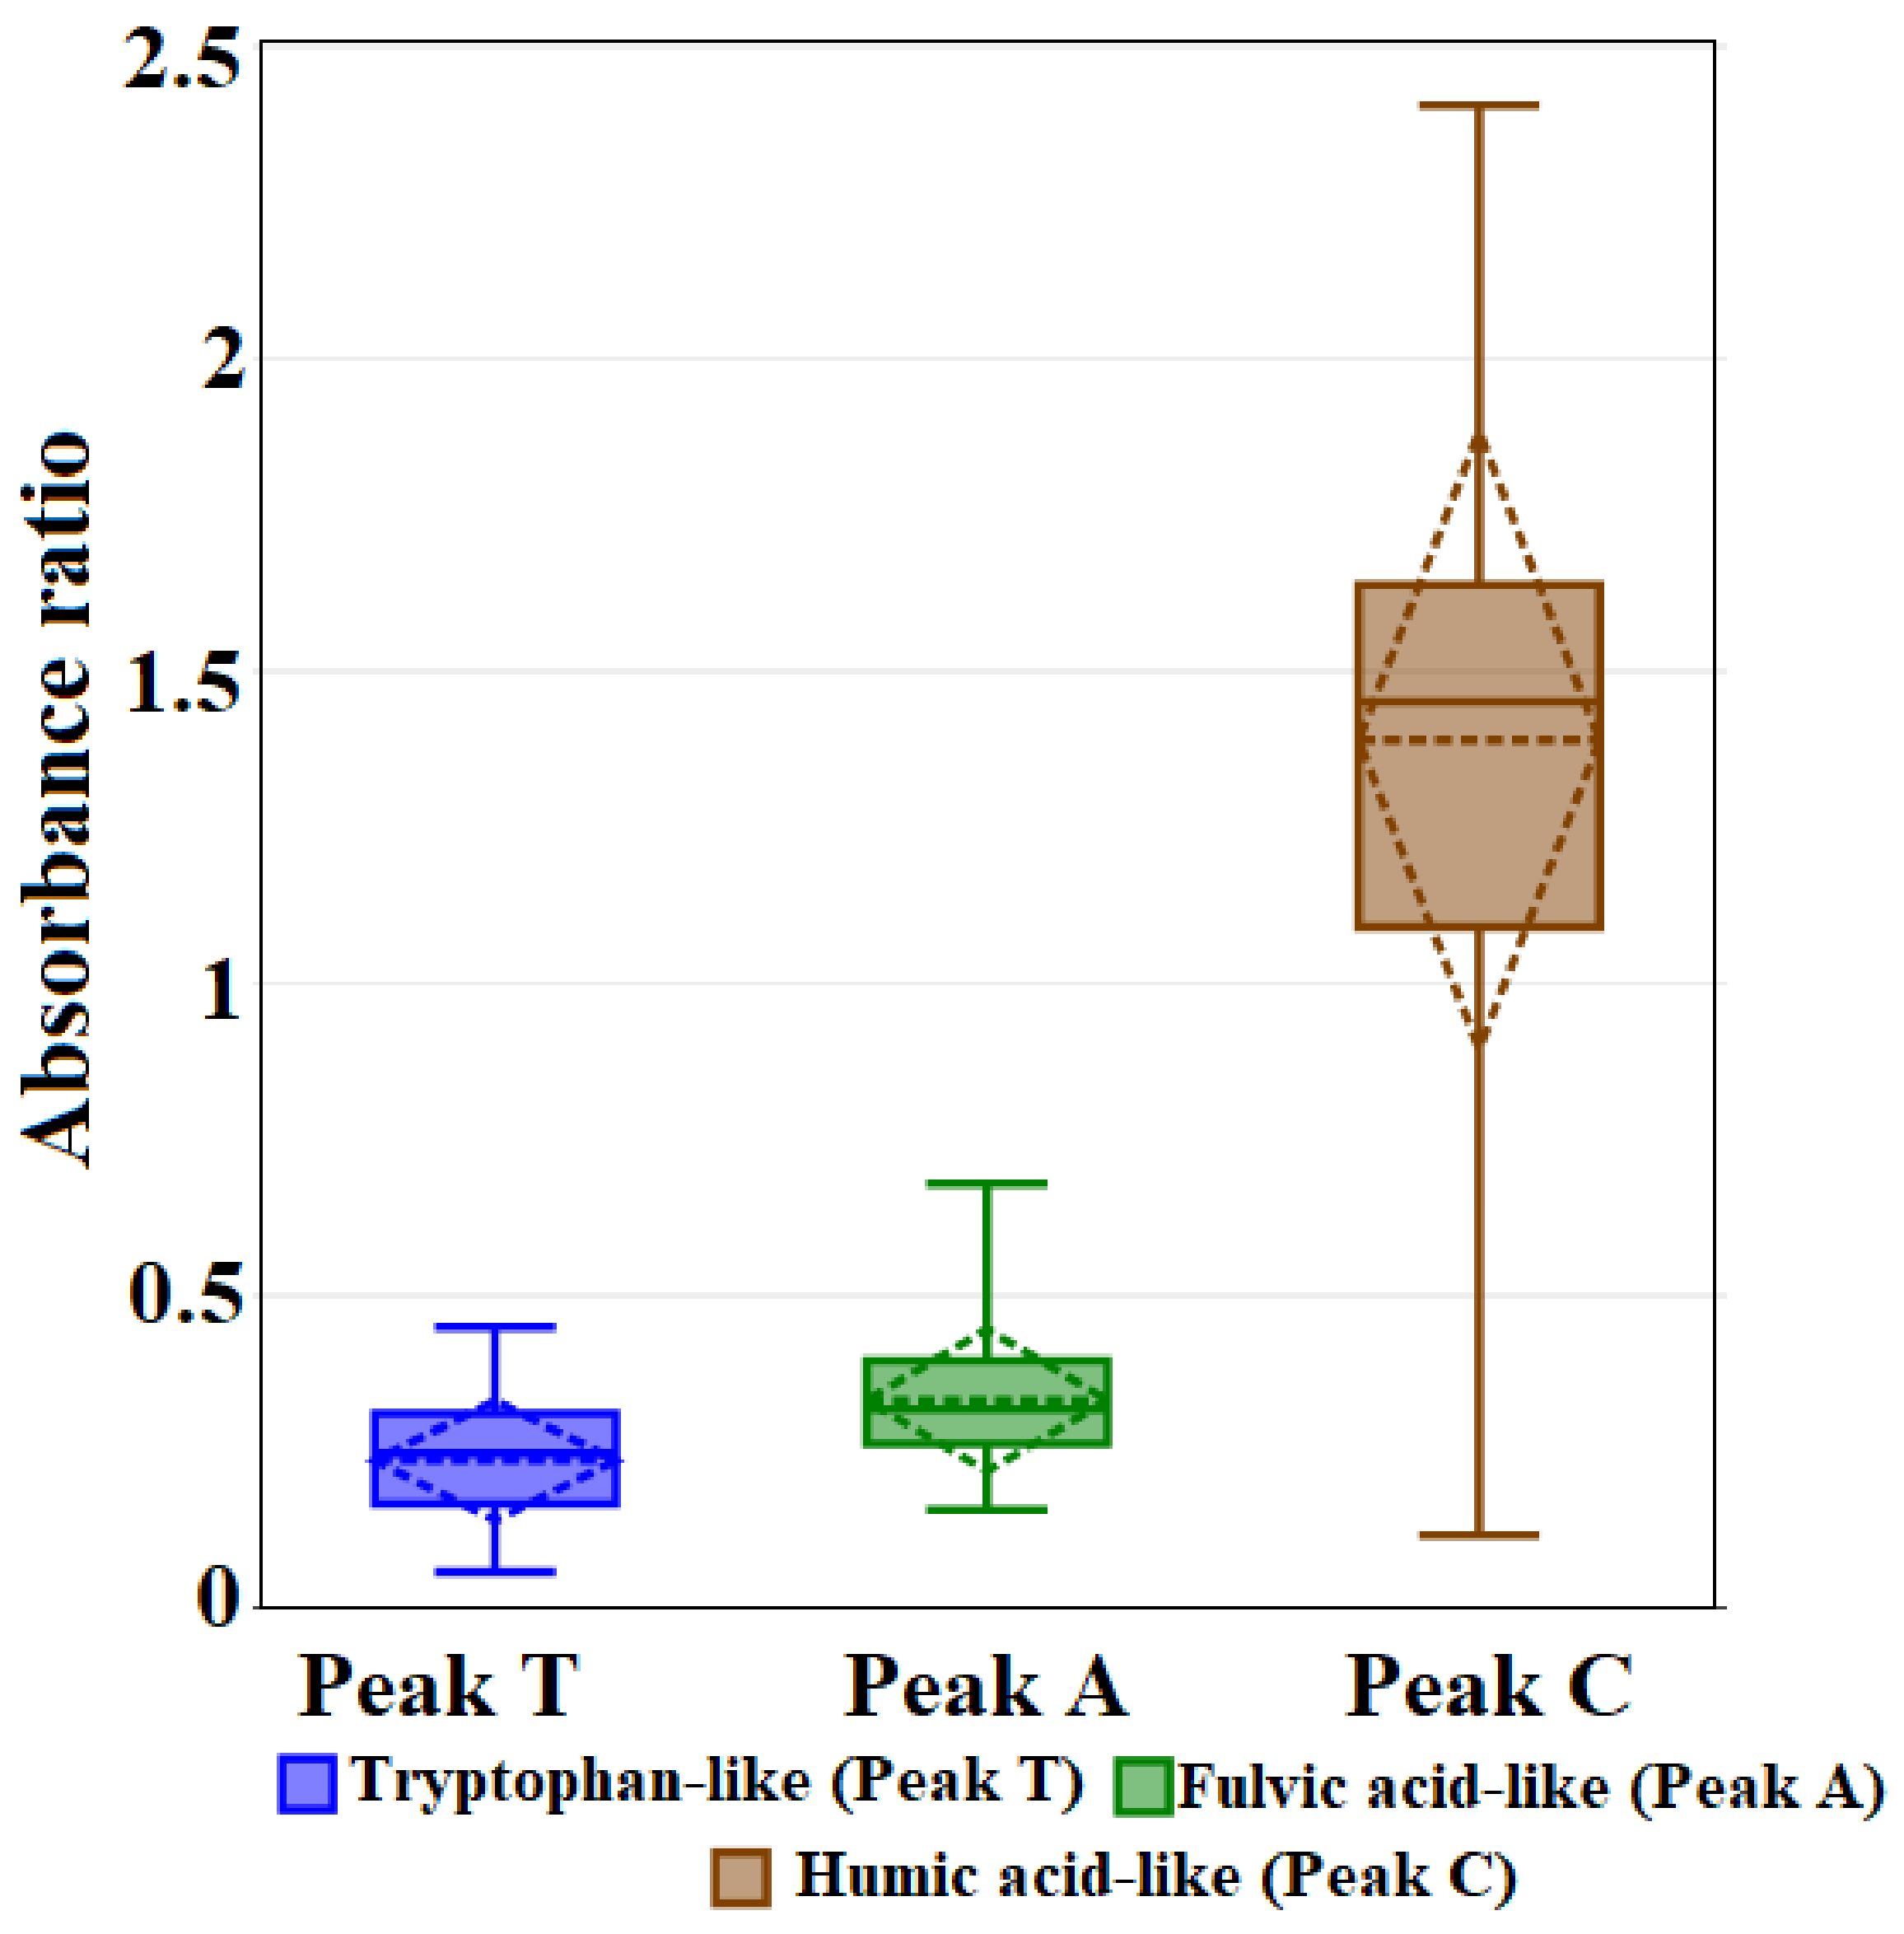
3.3. Fluorescence Peaks in SR and CR

The overall volume of the DOM components showed changes in SR and CR as shown in Figure 4. The DOM components were high in January 2020 and February 2020 and low in November 2019 and December 2019. In the SR, the DOM values follow an increasing trend (from upstream to downstream) from December 2019 to February 2020. For CR, the same increasing trend from upstream to downstream was observed for December 2019 and January 2020, however, a decreasing trend was observed for February 2020. The low value in the CRU1 sampling station in December 2019 is due to the dilution of water samples caused by the localized rains in the area.
The temporal variation of the two rivers was relatively stable based on the three components of DOM measured during the dry season (Figure 5). The orders of the proportions of the DOM components were as follows: Peak T < Peak A < Peak C. All water samples showed low values of peak T, which is commonly known as the tryptophan-like component of the DOM. These protein-like components are likely derived from a mixture of dissolved amino acids and other organic materials. This was related to elevated river water levels due to stormwater runoff discharge into rivers and the resulting dilution effect in summer to some extent. The tryptophan-like components of DOM are relatively low during summer (dry season) compared to the rest of the months due to the degradation of phytoplankton [71].
Tryptophan-like components of fluorescence DOM have a mean of 0.24 ± 0.095. The dominant component in all water samples is Peak C (Mean: 1.68, SD: 0.49), which is commonly known as the humic-like component of the DOM. The high intensity of humic-like components confirms the possible sources from sewage and domestic effluents. The contribution of labile organic matter and the presence of humic compounds varies from November 2019 to February 2020.

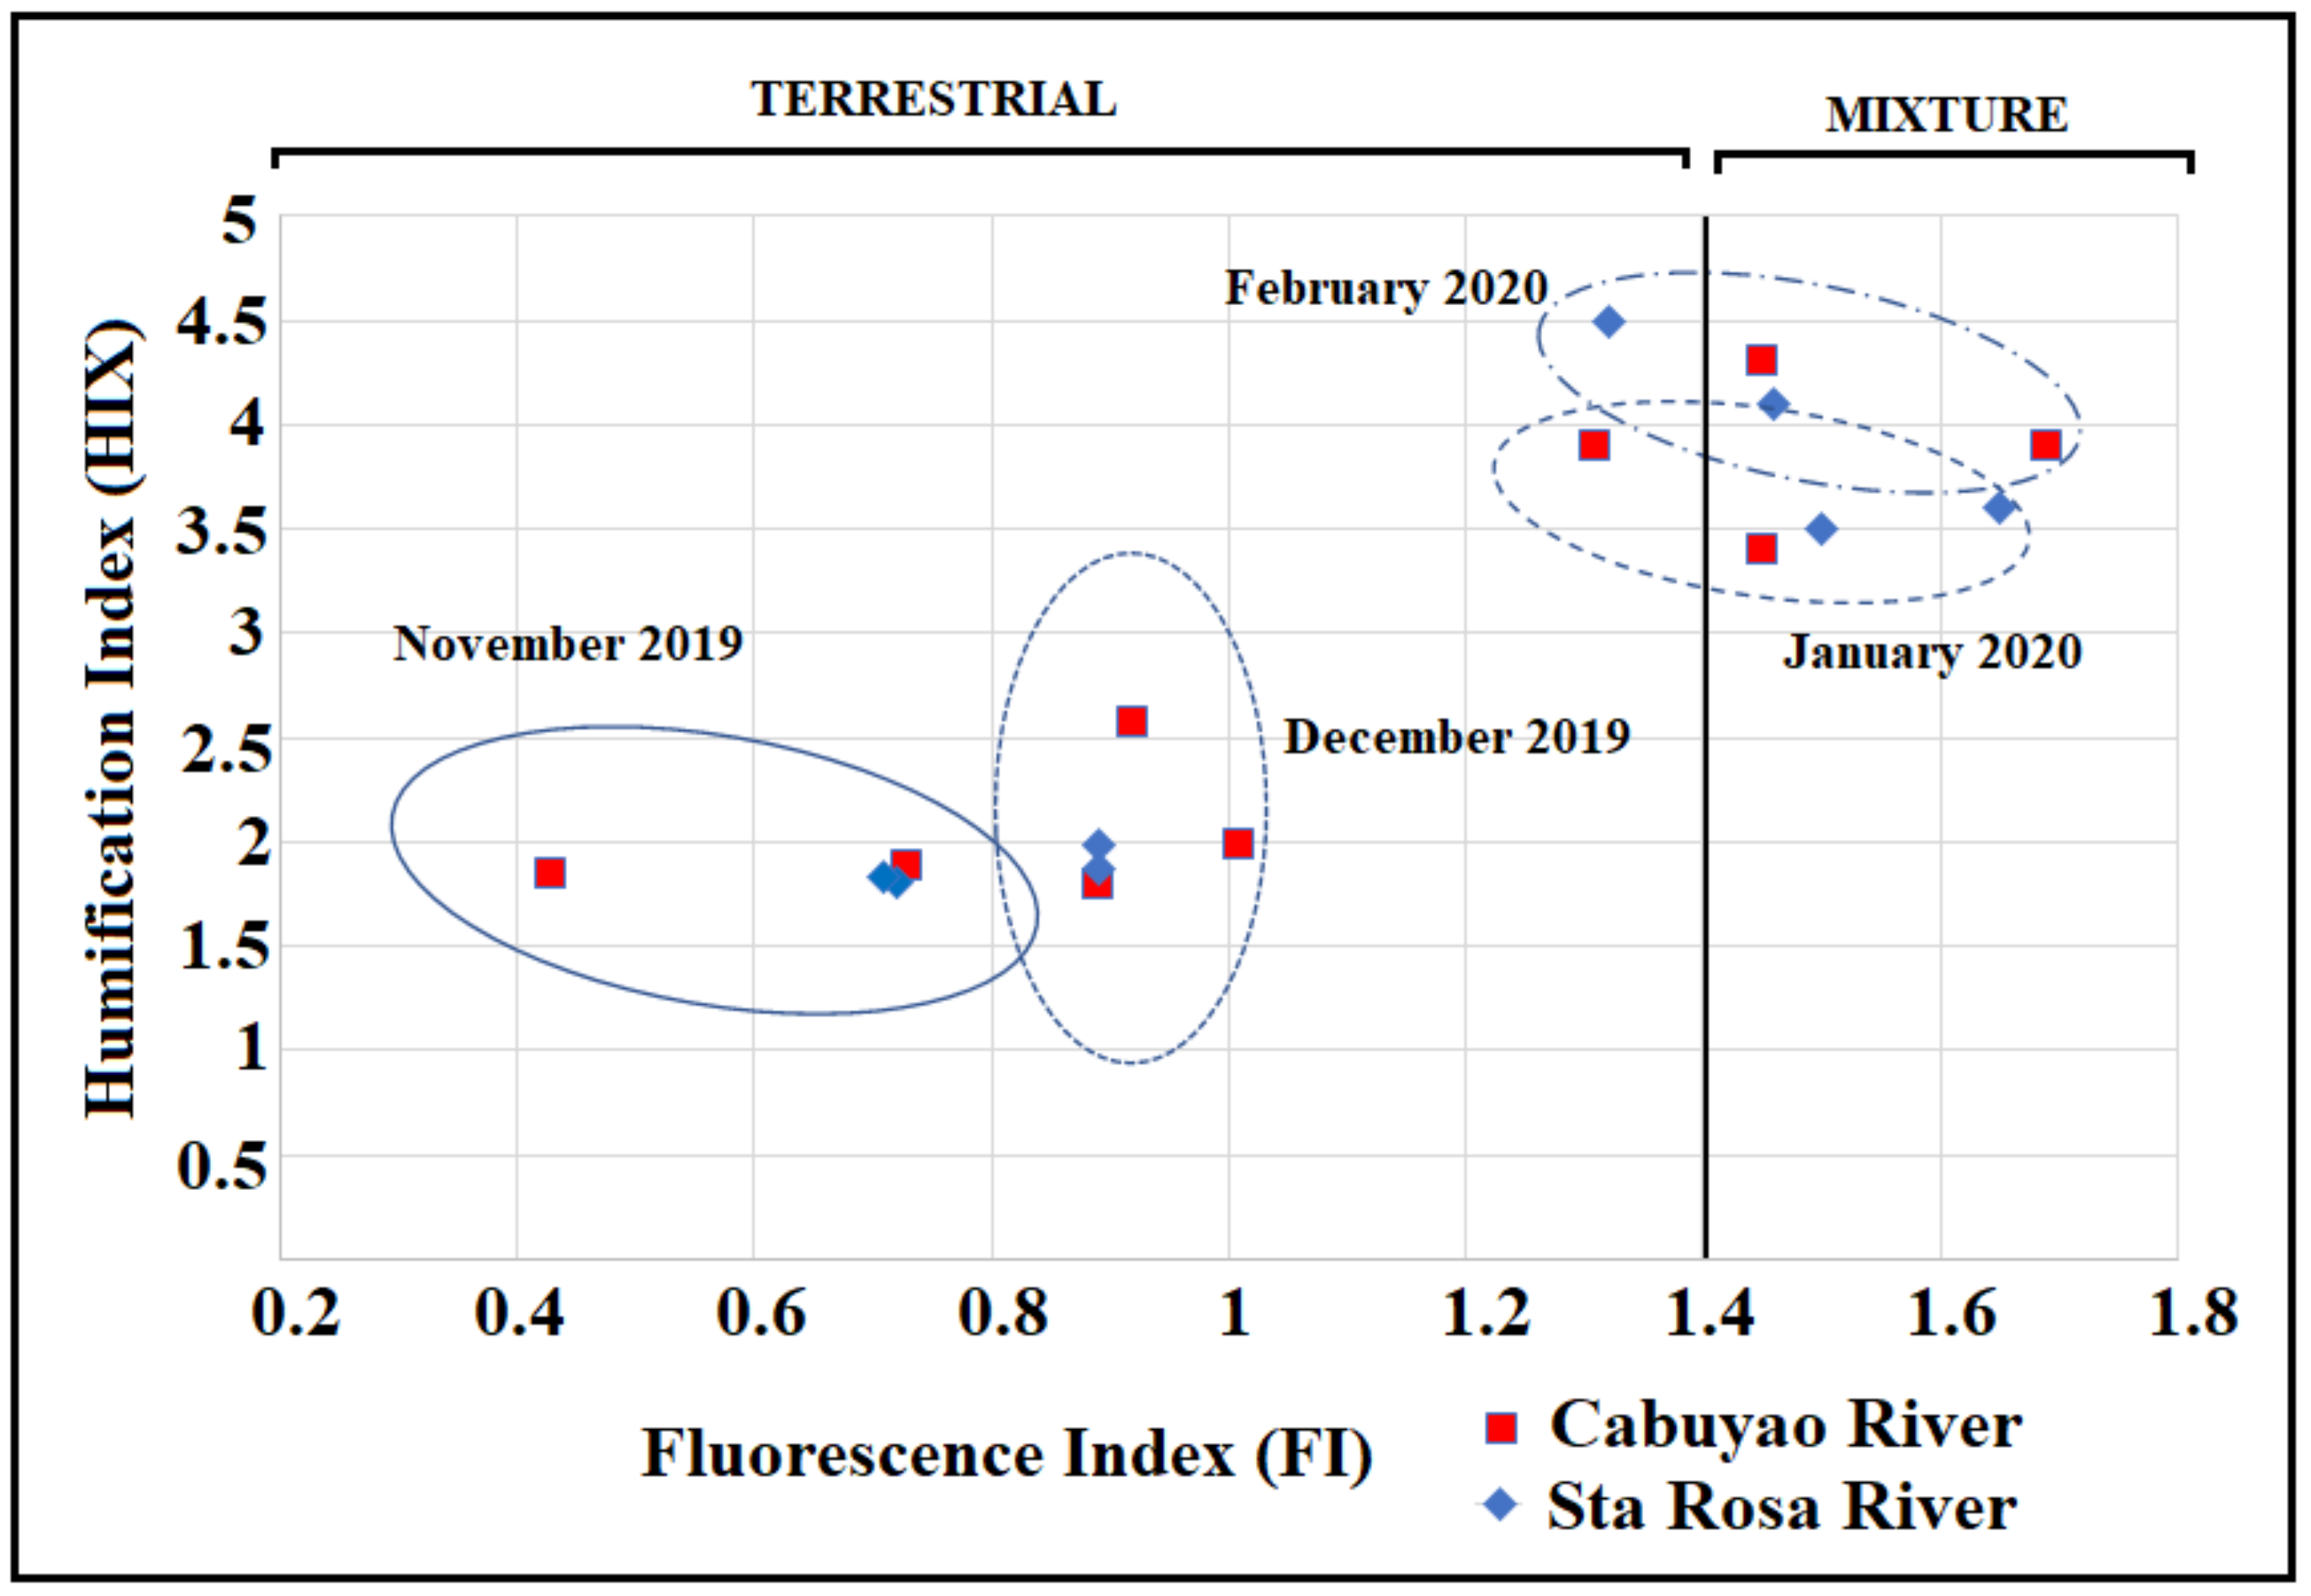
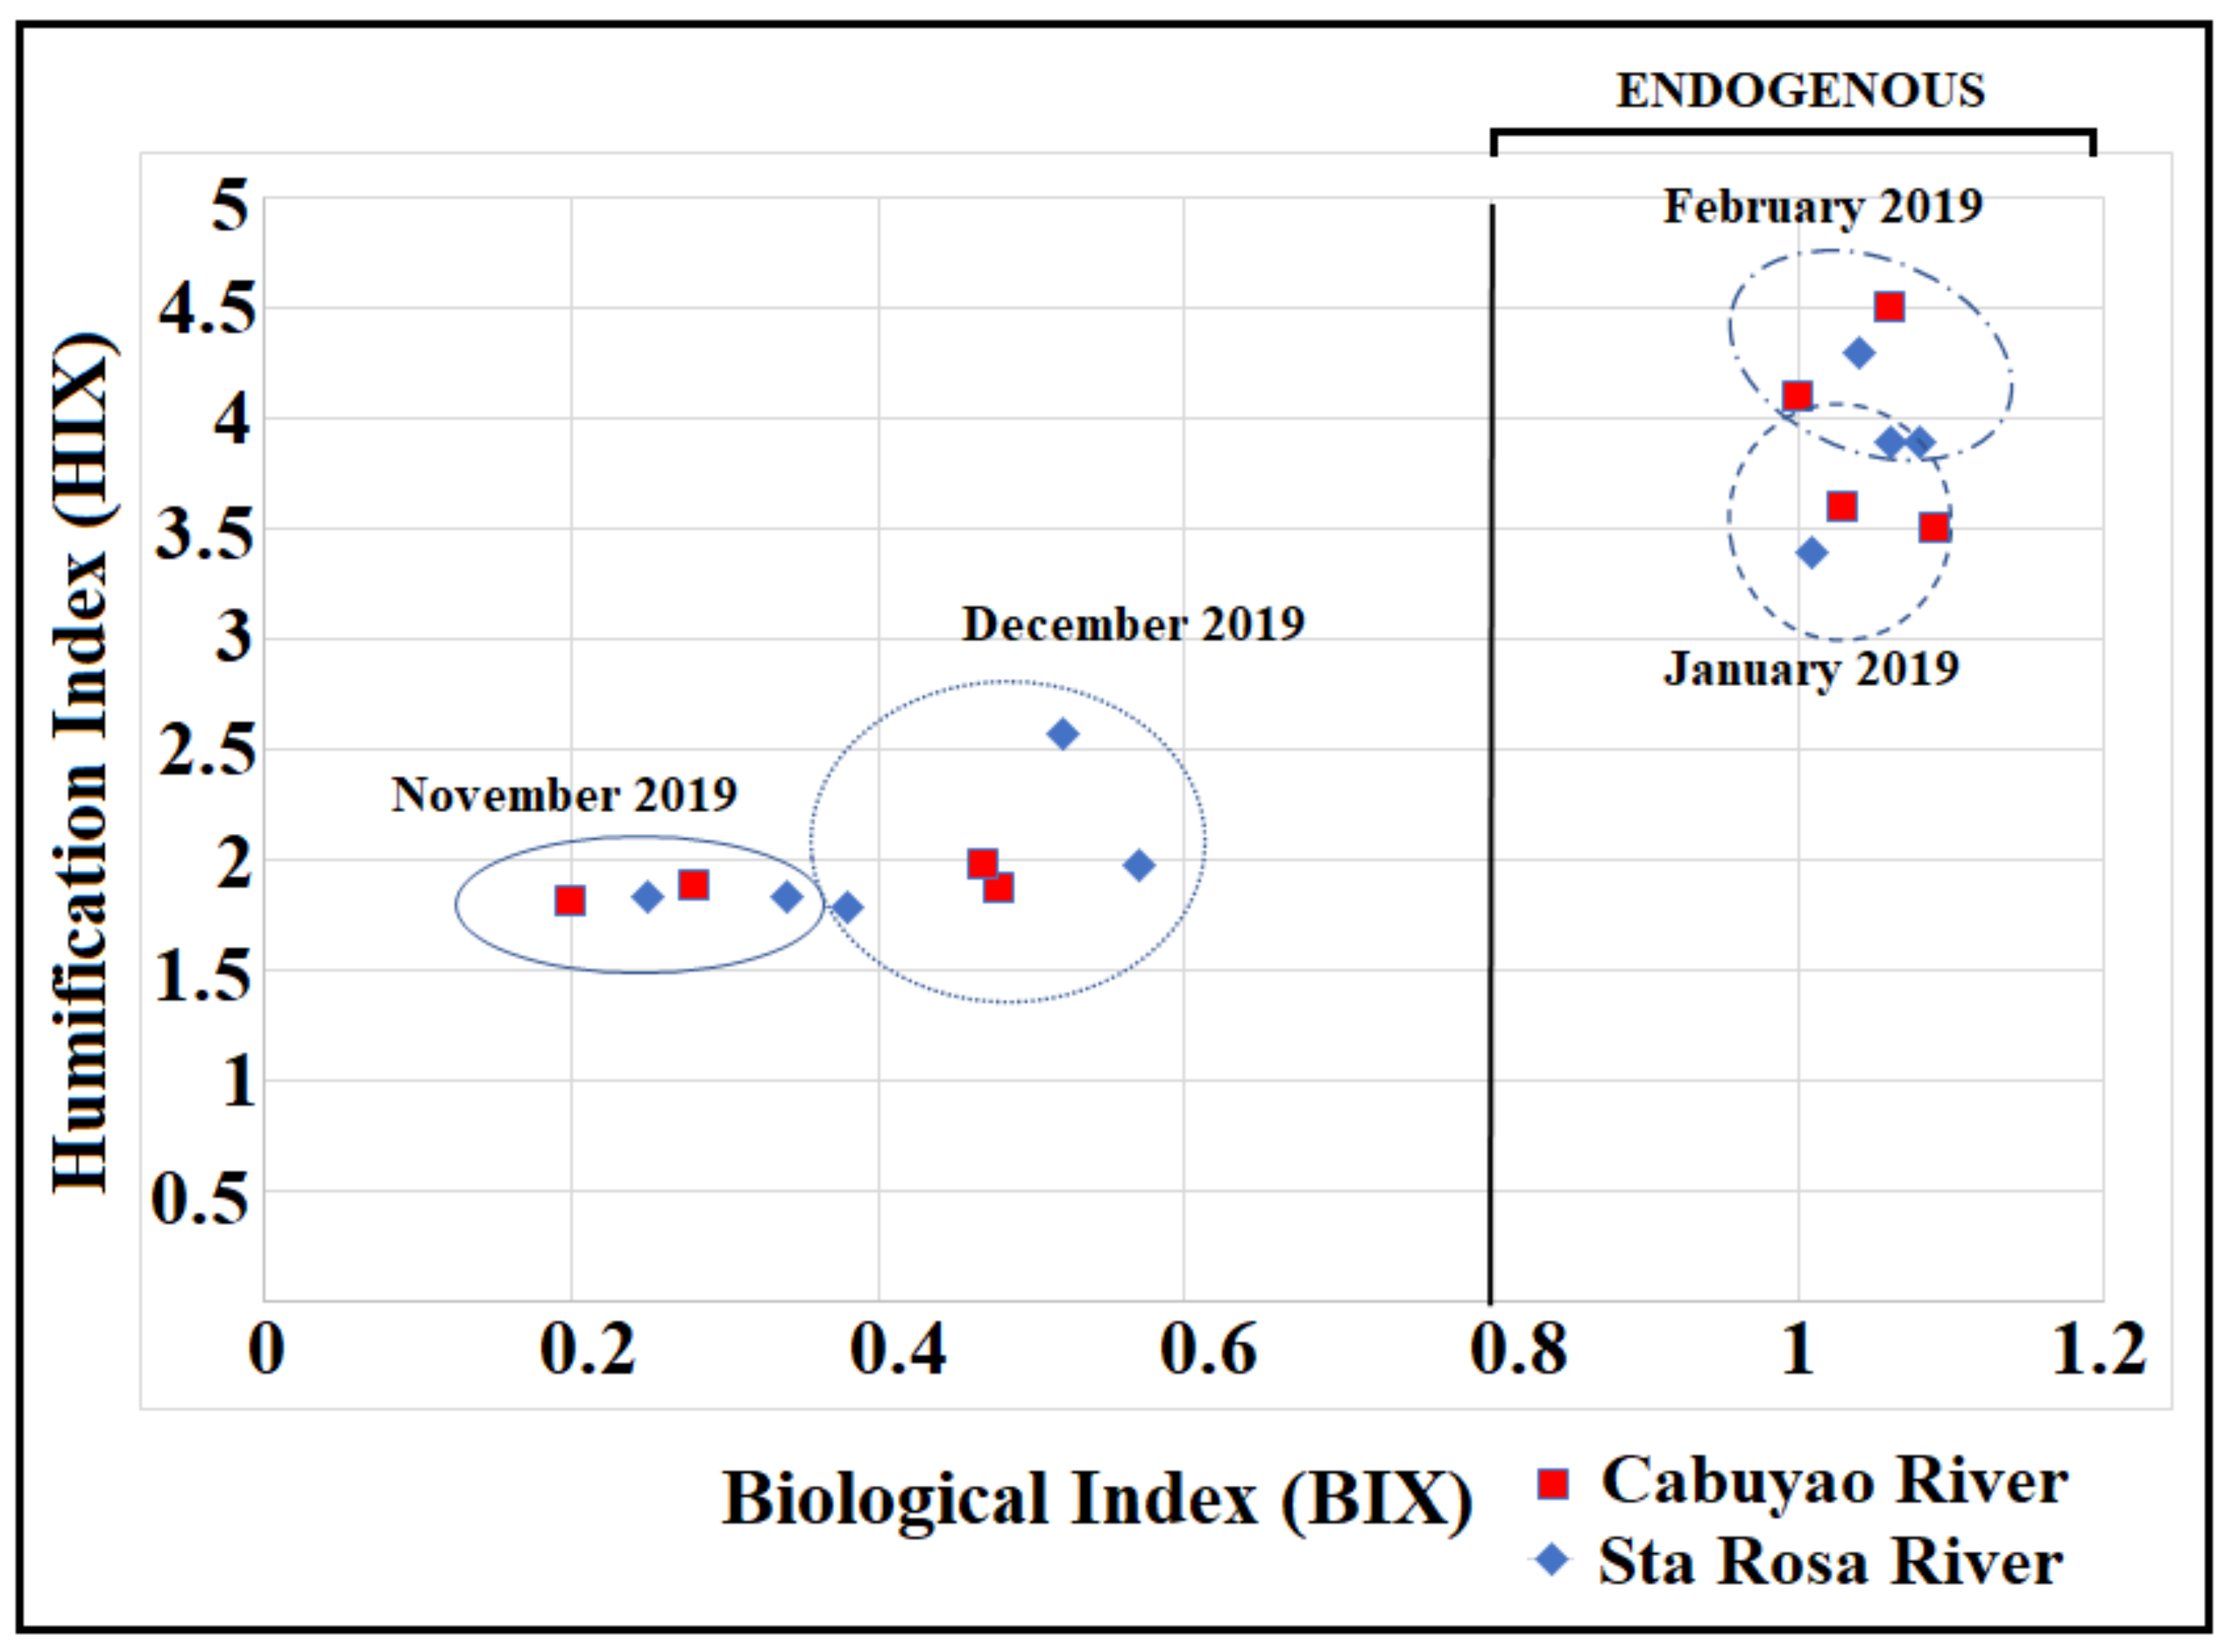
3.4. Fluorescence Indices of SR and CR

Indices were used to further understand the sources of DOM in SR and CR. FI lower than 1.4 indicates a terrestrial source derived from human activities, commercial and industrial water, and or agricultural run-off. On the other hand, FI higher than 1.9 is most likely to be derived from microorganisms and phytoplankton. The region of FI between 1.4 and 1.9 is usually considered a mixture of terrestrial and microbial-derived sources of DOM (Figure 6).
FI values from November 2019 showed the lowest values among all samples. They range from 0.40 to 0.89. In December 2019, the FI values range from 0.89 to 1.01. All samples collected from November 2019 and December 2019 were terrestrially derived DOM sources. In January 2020 and February 2020, they range from 1.31 to 1.69 which shows a mixture of terrestrially and microbially derived DOM in SR and CR. HIX values observed in all samples range from 1.81 to 4.5. HIX values higher than 10 denote a strong humification that may be derived from terrestrial sources. BIX values as stated in Table 5 explain the endogenous sources from DOM. This measures the freshly microbial-derived DOM in all water samples from November 2019 to February 2020. BIX values higher than 0.8 indicate that the DOM sources are endogenous (Figure 7). In November 2019 and December 2019, BIX values are lower than 0.8 in both SR and CR. However, for January 2020 and February 2020, it ranges from 1 to 1.09. There is no significant difference between SR and CR in these sampling months. It can be noted that from the BIX, an increasing trend was observed as the season changes from dry to wet.
These peaks are usually associated with humic substances and vary in its source and molecular size (Figure 8). High aromaticity and molecular size were observed in all downstream sampling stations based on the absorbance ratio at A250/363 which is supported by the high values of Peak C and Peak A (Figure 4).
A strong correlation between C:T and A:T ratios [72] was presented in Table 7 to describe the relative amount of humic-like DOM versus fresh-like DOM. Using these ratios, we can infer those higher values indicate a higher proportion of degraded material [72]. Low values in December 2019 for all sampling stations were measured due to stormwater run-off before sampling. For the two rivers, the degree of humification and DOM composition are highly influenced by the surrounding land use (Table 1).
Spatial correlations were observed for both C: T (p < 0.10) and A: T (p < 0.05). No significant monthly variations were observed.

4. Discussion

Several factors, such as hydrological, climatic, physico-chemical, and biological may affect the temporal and spatial dynamics of nutrients in rivers and lakes. Water temperature and pH values found in Table 6 are similar to LLDA 2019–2020 [73]. DO values measured in this study are also smaller. Reports on the EC values showed the effects of Laguna Lake on the convolution of the two rivers and the downstream area. Nitrates, total phosphorous, and chlorides in the two rivers show temporal changes. Higher values of nitrates, total phosphorous, and chlorides were found in SR sampling stations compared to CR sampling stations. All measured values from nitrates and chlorides were found to be within the range set by the DENR-DAO 2016-08. However, for the phosphates, only total phosphorous was measured in this study. Total phosphorous measures all forms of phosphates such as orthophosphate, condensed phosphate, and organic phosphate [11]. An increasing trend of total phosphates was observed in CR (from upstream to downstream) which ranges from 0.85 to 2.49. Midstream values in SR samplings stations from November 2019 to January 2020 are lower compared to upstream and downstream values. The dramatic changes in water quality results were caused by the changes in climatological parameters such as typhoons, ash flow, and rainfall. These factors showed a great relationship between water quality and seasonal impact.
To understand behaviors of organic matter in SR and CR, DOM was analyzed based on its compositions and sources. It was found that the DOM measured in SR and CR are terrestrially derived compounds during the dry season. Peaks A and C which are humic-like substances are derived from the decay and degradation of plant residues and organic wastes. Protein-like components such as Peak T (commonly known as tryptophan-like) in DOM compositions were utilized to trace endogenous and terrestrial DOM. In Figure 4, Peak T measurements are low during the dry season. This is associated with hydrologic characteristics of Laguna that feature tidal effects. Due to the tidal force, the river water in this study comes from Laguna Lake, which is closer to the downstream portion of the two rivers. The development of infrastructures and conversion of agricultural to commercial-industrial-residential sites near SR sampling stations can cause these variances. From these results, we can use these peaks as an ideal mark for wastewater and urban water with climatic changes during the dry-weather season. It can also explain the difference in quality and quantity of DOM components between SR and CR due to their different land uses and the effects of the dry season.
The indices such as FI, HIX, and BIX clearly showed the properties and sources of DOM [74,75,76]. The mean range of FI values in November 2019 and December 2019 were 0.70 and 0.93, respectively. This means that the river water samples are all terrestrial DOM, affected by the seasonal change (Figure 6). In January 2020 and February 2020, the mean FI values are 1.47 and 1.48, respectively, which are close enough to the limit of 1.4. These FI values explain the mixture of endogenous and terrestrial DOM in the two rivers. This is consistent with the temporal values of DOM components such as humic-like, and protein-like substances found in January 2020 and February 2020. The increasing values of FI from November 2019 to February 2020 show the behavior of DOM from terrestrial to endogenous sources, like season changes (Figure 6). The mean HIX values of November 2019, December 2019, January 2020, and February 2020 are 1.83, 2.1, 3.6, and 4.2, respectively. This indicates low humification values common during the dry season. The low humification in the two rivers is due to the changing land use in the Santa Rosa River basin. In the upstream of SR, a renovation around the sampling station caused the irregular values as observed (Figure 1, Table 1 and Table 2) as well as the increased amount of microbial byproducts, such as humic substances, degraded by microorganisms [77,78]. The BIX values in November 2019 and December 2019 were lower compared to January 2020 and February 2020. BIX values in November 2019 and December 2019 are lower than 0.8 which indicates terrestrial DOM. On the other hand, BIX values in January 2020 and February 2020 are higher than 0.8 which indicates the presence of endogenous DOM. These infer that the high FI values in these months have a small degree of humic substances. This may lead to an increase in the microorganisms such as phytoplankton production as the season changes from dry to wet [19,39].
The Santa Rosa watershed, where SR and CR are located, is important in flood control and a good source of water for human activities. However, reports showed poor water quality measurements in the Laguna rivers. There have been activities and programs which aim to promote and maintain cleanliness in the river systems and their tributaries. The various sources of organic pollution in rivers such as sewage, domestic and industrial effluents, and urban and agricultural run-off results in variances in absorbance ratios and fluorescence peaks. In this study, we were able to provide a preliminary analysis of the effects of river flow, climatic, and seasonal changes in the DOM composition and sources in river water samples. In summary, we were unable to quantify the effects of land use on the DOM in rivers, but we were able to describe the variations in DOM as provided in this study. The surrounding land use with the season variances can highlight the changes of loading impact on the rivers and tributaries. This study also promotes urgent action in describing DOM in rivers as the land-use change with time.

5. Conclusions

Santa Rosa watershed has been adapting to urbanization and industrialization which has seen an increase in population growth, intensive land development, and land-use changes. These changes have reduced its natural ability to retain water and hold rainfall during the wet season. The Santa Rosa and Cabuyao rivers are two of the major rivers located in the basin. Due to climate change and land-use changes, water quality analyses are reported regularly by LLDA. With the poor water quality results, this study aims to further understand the organic matter composition in the two rivers with the aid of absorbance and fluorescence measurements. The qualities and quantities of DOM in the SR and CR were analyzed using absorbance ratios and peaks from EEM fluorescence data. The absorbance ratios showed variance in the DOM sources and molecular weight at 280/665 and A250/363, respectively. The overall fluorescence peaks showed an increasing trend from upstream to downstream of SR and CR from November 2019 to February 2020. Tryptophan-like and humic-like characteristics downstream of SR were higher than in CR. These showed an order of DOM components in the two rivers: Tryptophan-like (Peak T) < Fulvic acid-like (Peak A) < Humic acid-like (Peak C). The variance in local climate and unexpected natural events showed a shift from terrestrial DOM to endogenous DOM, thus, changing the DOM compositions. It was observed that the sources of DOM change with land use and natural events such as rainfall, ashfall, and tidal effects. Sewage impacts from informal settlers and subdivisions, and sources from different activities such as industrial, and commercial effluents may cause variance in DOM composition. This paper, in general, provides a good reference on the quality and quantity of DOM as a water quality indicator and an assessment for future anthropogenic changes in rivers under natural conditions.

Author Contributions

Conceptualization and methodology, J.G.C., E.A.V., A.H.O., A.B.B. and M.C.D.G.; validation, J.G.C. and M.C.D.G.; formal analysis and investigation, J.G.C., A.B.B., A.H.O., and M.C.D.G.; resources, E.A.V., A.H.O., A.B.B. and M.C.D.G., data curation, J.G.C.; writing—original draft preparation, J.G.C., E.A.V., A.H.O., A.B.B. and M.C.D.G.; writing—review and editing, J.G.C., E.A.V., A.H.O., A.B.B. and M.C.D.G.; visualization, J.G.C.; supervision, A.H.O., A.B.B. and M.C.D.G. All authors have read and agreed to the published version of the manuscript.

Funding

This research received no external funding.

Institutional Review Board Statement

Not applicable.

Informed Consent Statement

Not applicable.

Acknowledgments

J.G.C. would like to acknowledge financial support from DOST ASTHRDP-NSC scholarship and UP Visayas. The researchers also acknowledge CENSER through EARTH lab of the De La Salle University for supporting this project. The researchers would like to thank DLSU-URCO project No. 16 IR 2TAY19-2TAY21 entitled “Water Quality and Fluorescence Measurements of Water Bodies”.

Conflicts of Interest

The authors declare no conflict of interest. The funders had no role in the design of the study; in the collection, analyses, or interpretation of data; in the writing of the manuscript, or in the decision to publish the results.

References

  1. Loucks, D.P.; van Beek, E. Water Resources Planning and Management: An Overview. In Water Resource Systems Planning and Management; Springer: Berlin/Heidelberg, Germany, 2017. [Google Scholar] [CrossRef] [Green Version]
  2. Khatri, N.; Tyagi, S. Influences of natural and anthropogenic factors on surface and groundwater quality in rural and urban areas. Front. Life Sci. 2015, 8, 23–39. [Google Scholar] [CrossRef]
  3. Sheldon, F.; Thomas, F.C.; Berry, O.; Puckridge, J. Using disaster to prevent catastrophe: Referencing the impacts of flow changes in large dryland rivers. Regul. Rivers Res. Manag. 2000, 16, 403–420. [Google Scholar] [CrossRef]
  4. Bertrand, C.; Siauve, V.; Fayolle, S.; Cazaubon, A. Effects of hydrological regime on the drift algae in a regulated Mediterranean river (River Verdon, southeastern France). Regul. Rivers Res. Manag. 2001, 17, 407–416. [Google Scholar] [CrossRef]
  5. DENR RA-9275, The Philippine Clean Water Act. 2015. Available online: https://emb.gov.ph/wp-content/uploads/2015/09/RA-9275.pdf (accessed on 10 November 2021).
  6. LLDA. Laguna Lake Development Authority Profile. Available online: https://llda.gov.ph/agency-profile/ (accessed on 11 October 2021).
  7. Cadondon, J.G.; Napal, J.P.D.; Abe, K.; de Lara, R.; Vallar, E.A.; Orbecido, A.H.; Belo, L.P.; Galvez, M.C.D. Characterization of water quality and fluorescence measurements of dissolved organic matter in Cabuyao river and its tributaries using excitation-emission matrix spectroscopy. J. Phys. Conf. Ser. 2020, 1593, 012033. [Google Scholar] [CrossRef]
  8. Barril, C.R.; Tumlos, E.T.; Moraga, W.C. Seasonal variations in water quality of Laguna de Bay, Philippines: Trends and implications. Philipp. Agric. Sci. 2001, 84, 19–20. [Google Scholar]
  9. De Jesus, A.L.M.; Baltazar, D.E.S.; Banalo, R.A.; Flavier, M.E. Water Quality Assessment of the Main River System flowing within Barangay Bucal, Calamba City, Laguna. In Proceedings of the 5th PNEE International Conference, Iloilo City, Philippines, 15–17 February 2012. [Google Scholar]
  10. Santos-Borja, A.; Nepomuceno, D.N. Laguna de Bay: Institutional development and charge for lake basin management. Lakes Reserv. Res. Manag. 2006, 11, 257–269. [Google Scholar] [CrossRef]
  11. DENR-DAO-06, Water Quality Guidelines and General Effluent Standards of 2016. Available online: https://denr.gov.ph/sectionpolicies/viewrec.php?id=4917&page=1&sort=tl&filter=&search (accessed on 4 June 2019).
  12. US EPA. Water Quality Criteria. Available online: https://www.epa.gov/wqc (accessed on 2 July 2021).
  13. Coble, P. Marine optical biogeochemistry: The chemistry of ocean color. Chem. Rev. 2007, 107, 402–418. [Google Scholar] [CrossRef]
  14. Guo, X.; Jiang, J.; Xi, B.; He, X.; Zhang, H.; Deng, Y. Study on the spectral and Cu (II) binding characteristics of DOM leached from soils and lake sediments in the Hetao region. Environ. Sci. Pollut. Res. 2012, 19, 2079–2087. [Google Scholar] [CrossRef]
  15. Fellman, J.; Hood, E.; Spenser, R. Fluorescence spectroscopy opens new windows into dissolved organic dynamics in freshwater ecosystems: A review. Limnol. Oceanogr. 2010, 55, 2452–2462. [Google Scholar] [CrossRef]
  16. Xu-jing, G.; Bel-dou, X.; Hui-bin, Y.; Wen-chao, M.; Xiao-song, H. The structure and origin of dissolved organic matter studied by UV-Vis spectroscopy and fluorescence spectroscopy in lake and semi-arid region. Water Sci. Technol. 2011, 63, 1004–1009. [Google Scholar] [CrossRef] [Green Version]
  17. Cory, R.; McKnight, D. Fluorescence spectroscopy reveals ubiquitous presence of oxidized and reduced quinones in dissolved organic matter. Environ. Sci. Technol. 2005, 39, 8142–81149. [Google Scholar] [CrossRef] [PubMed]
  18. Wilson, H.; Xenopoulos, M. Effects of agricultural land use on the composition of fluvial dissolved organic matter. Nat. Geosci. 2009, 2, 37–41. [Google Scholar] [CrossRef]
  19. Huguet, A.; Vacher, L.; Relexan, S.; Saubusse, S.; Froidefond, J.M.; Parlanti, E. Properties of fluorescent dissolved organic matter in the Gironde estuary. Org. Geochem. 2009, 40, 706–719. [Google Scholar] [CrossRef]
  20. Yao, X.; Zhang, Y.L.; Zhu, G.W.; Qin, B.Q.; Feng, L.Q.; Cai, L.L.; Gao, G. Resolving the variability of CDOM fluorescence to differentiate the sources and fate of DOM in Lake Tahu and its tributaries. Chemosphere 2011, 82, 145–155. [Google Scholar] [CrossRef]
  21. Zhang, Q.; Sun, P.; Chen, X.; Jiang, T. Hydrological extremes in the Poyang Lake basin, China: Changing properties, causes, and impacts. Hydrol. Process. 2011, 25, 3121–3130. [Google Scholar] [CrossRef]
  22. Brezonik, P.L.; Olmanson, L.G.; Finlay, J.C.; Bauer, M.E. Factors affecting measurement of CDOM by remote sensing of optically complex inland waters. Remote Sens. Environ. 2015, 157, 199–215. [Google Scholar] [CrossRef]
  23. Harvey, E.T.; Kratzer, S.; Anderson, A. Relationships between colored dissolved organic matter and dissolved organic carbon in different coastal gradients of the Baltic Sea. AMBIO 2015, 44 (Suppl. 3), 392–401. [Google Scholar] [CrossRef] [Green Version]
  24. Erlandsson, M.; Futter, M.N.; Kothawala, D.N.; Kohler, S.J. Variability in spectral absorbance metrics across boreal lake waters. J. Environ. Monit. 2012, 14, 2643–2652. [Google Scholar] [CrossRef]
  25. Kim, C.; Eom, J.; Jung, S.; Ji, T. Detection of organic compounds in water by an optical absorbance method. Sensors 2016, 16, 61. [Google Scholar] [CrossRef] [Green Version]
  26. Shen, Y.; Benner, R.; Robbins, L.L.; Wyan, J.G. Sources, distributions, and dynamics of dissolved organic matter in the Canada and Makarov Basins. Front. Mar. Sci. 2016, 3, 198. [Google Scholar] [CrossRef] [Green Version]
  27. Guo, M.X.; Chorover, J. Transport and fractionation of dissolved organic matter in soil columns. Soil Sci. 2003, 168, 108–118. [Google Scholar] [CrossRef]
  28. Santos, L.; Pinto, A.; Filipe, O.; Cunha, A.; Santos, E.B.H.; Almeida, A. Insights on the optical properties of estuarine DOM? Hydrological and biological influences. PLoS ONE 2016, 11, e0154519. [Google Scholar] [CrossRef] [PubMed] [Green Version]
  29. Duarte, R.M.B.O.; Pio, C.A.; Duarte, A.C. Spectroscopic study of the water-soluble organic matter isolated from atmospheric aerosols collected under different atmospheric conditions. Anal. Chim. Acta 2005, 530, 7–14. [Google Scholar] [CrossRef]
  30. Hunt, J.F.; Ohno, T. Characterization of fresh and decomposed dissolved organic matter using excitation-emission matrix fluorescence spectroscopy and multiway analysis. J. Agric. Food Chem. 2007, 55, 2121–2128. [Google Scholar] [CrossRef] [PubMed]
  31. Claret, F.; Schafer, T.; Bauer, A. Generation of humic and fulvic acid from Callovo-Oxfordian clay under high alkaline conditions. Sci. Total Environ. 2003, 317, 189–200. [Google Scholar] [CrossRef]
  32. Al-Juboori, R.A.; Yusaf, T.; Pittaway, P.A. Exploring the correlation between common UV measurements and chemical fractionation for natural waters. Desalination Water Treat. 2016, 57, 16324–16335. [Google Scholar] [CrossRef]
  33. Korshin, G.V.; Li, C.-W.; Bejamin, M.M. Monitoring the properties of natural organic matter through UV spectroscopy: A consistent theory. Water Res. 1997, 31, 1787–1795. [Google Scholar] [CrossRef]
  34. Jaffe, R.; Boyer, J.N.; Lu, X.; Maie, N.; Yang, C.; Scully, N.M.; Mock, S. Source characterization of dissolved organic matter in a subtropical mangrove-dominated estuary by fluorescence analysis. Mar. Chem. 2004, 84, 195–210. [Google Scholar] [CrossRef]
  35. Cieslewicz, J.; Gonet, S.S. Properties of humic acids as biomarkers of lake catchment management. Aquat. Sci. 2004, 66, 178–184. [Google Scholar] [CrossRef]
  36. Zhang, L.; Sun, Q.; Peng, Y.; Zhao, H.; Liu, H.; You, Y.; Zhang, Y. Components and structural characteristics of dissolved organic matter in the overlying water of the Beiyun River. Energy 2021, 221, 119921. [Google Scholar] [CrossRef]
  37. Chen, W.; Westerhoff, P.; Leenheer, J.A.; Booksh, K. Fluorescence excitation-emission matrix regional integration to quantify spectra for dissolved organic matter. Environ. Sci. Technol. 2003, 37, 5701–5710. [Google Scholar] [CrossRef] [PubMed]
  38. Yu, H.; Song, Y.; Gao, H.; Liu, L.; Yao, L.; Peng, J. Applying fluorescence spectroscopy and multivariable analysis to characterize structural composition of dissolved organic matter and its correlation with water quality in urban river. Environ. Earth Sci. 2015, 73, 5163–5171. [Google Scholar] [CrossRef]
  39. Williams, C.J.; Frost, P.C.; Morales-Williams, A.; Larson, J.H.; Richarson, W.; Chiandet, A.S.; Xenopoulos, M.A. Human activities cause distinct dissolved organic matter composition across freshwater ecosystems. Glob. Change Biol. 2015, 22, 613–626. [Google Scholar] [CrossRef] [PubMed]
  40. Mostofa, K.M.; Yoshioka, T.; Konohira, E.; Tanoue, E. Dynamics and characteristics of fluorescent dissolved organic matter in the groundwater, river, and lake water. Water Air Soil Pollut. 2007, 184, 157–176. [Google Scholar] [CrossRef]
  41. Herzsprung, P.; von Tumpling, W.; Hertkorn, N.; Harir, M.; Butner, O.; Bravidor, J.; Friese, K.; Schimtt-Kopplin, P. Variations of Dom quality in inflows of a drinking water reservoir: Linking of van Krevelen diagrams with EEMF spectra by rank correlation. Environ. Sci. Technol. 2012, 46, 5511–5518. [Google Scholar] [CrossRef]
  42. PSGC Interactive. “Province: Laguna (Province)”. Quezon City, Philippines: Philippine Statistics Authority. Available online: http://rsso04a.psa.gov.ph/laguna (accessed on 20 July 2021).
  43. DOH Census Population. Population Projections by Region, Province, City/Municipality and Baranngay from 2020–2025. 2015. Available online: https://doh.gov.ph/sites/default/files/publications/Population%20Projections%20by%20Region%2C%20Province%2C%20Cities%20and%20Municipalities%2C%202020-2025.pdf (accessed on 5 August 2021).
  44. Hydrology and Water Quality. 2012. Available online: https://www.srcity.org/DocumentCenter/View/4050/Draft-Environmental-Impact-Report-North-Santa-Rosa-Station-Area---DEIR-Chapter38-PDF?bidId= (accessed on 3 July 2021).
  45. PAGASA. Climate of the Philippines. Available online: https://www.pagasa.dost.gov.ph/information/climate-philippines (accessed on 17 April 2022).
  46. “CLIMATE: LAGUNA”. Available online: https://en.climate-data.org/asia/philippines/laguna-1844/ (accessed on 5 July 2021).
  47. “JICA Report”. Available online: https://openjicareport.jica.go.jp/pdf/11948882_02.pdf (accessed on 4 April 2022).
  48. Hu, C.; Muller-Karger, F.E.; Zepp, R.G. Absorbance, absorption coefficient, and apparent quantum yield: A comment on common ambiguity in the use of these optical concepts. Limnol. Oceanogr. 2002, 47, 1261–1267. [Google Scholar] [CrossRef]
  49. Li, P.; Hur, J. Utilization of UV-Vis spectroscopy and related data analyses for dissolved organic matter (DOM) studies: A review. Crit. Rev. Sci. Technol. 2017, 479, 131–154. [Google Scholar] [CrossRef]
  50. Jin, M.Y.; Oh, H.-J.; Shin, K.-H.; Jang, M.-H.; Kim, H.-W.; Choi, B.; Lin, Z.-Y.; Heo, J.S.; Oh, J.-M.; Chang, K.-H. The Response of Dissolved Organic Matter during Monsoon and Post-Monsoon Periods in the Regulated River for Sustainable Water Supply. Sustainability 2020, 53, 5310. [Google Scholar] [CrossRef]
  51. Altmann, J.; Massa, L.; Sperlich, A.; Gnirss, R.; Jekel, M. UV254 absorbance as real-time monitoring and control parameter for micropollutant removal in advanced wastewater treatment with powdered activated carbon. Water Res. 2016, 94, 240–245. [Google Scholar] [CrossRef]
  52. Ziska, A.D.; Park, M.; Anumol, T.; Snyder, S.A. Predicting trace organic compound attenuation with spectroscopic parameters in powdered activated carbon processes. Chemosphere 2016, 156, 163–171. [Google Scholar] [CrossRef]
  53. Stedmon, C.A.; Markager, S.; Kaas, H. Optical properties and signatures of chromophoric dissolved organic matter (CDOM) in Danish coastal waters. Estuar. Coast. Shelf Sci. 2000, 51, 267–278. [Google Scholar] [CrossRef]
  54. Peacock, M.; Burden, A.; Cooper, M.; Dunn, C.; Evans, C.D.; Fenner, N.; Freeman, C.; Gough, R.; Hughes, D.; Huges, S.; et al. Quantifying dissolved organic carbon concentrations in upland catchments using phenolic proxy measurements. J. Hydrol. 2013, 477, 251–260. [Google Scholar] [CrossRef] [Green Version]
  55. Osburn, C.L.; Boyd, T.J.; Montgomery, M.T.; Coffin, R.B.; Bianchi, T.S.; Paerl, H.W. Optical proxies for terrestrial dissolved organic matter in estuaries and coastal waters. Front. Mar. Sci. 2016, 36910, 2571–2581. [Google Scholar] [CrossRef] [Green Version]
  56. Giancoli Barreto, S.R.; Nozaki, J.; Barreto, W.J. Origin of dissolved organic carbon studies by UV-Vis spectroscopy. Acta Hydrochim. Hydrobiol. 2003, 31, 513–518. [Google Scholar] [CrossRef]
  57. Yamashita, Y.; Maie, N.; Briceno, H.; Jaffe, R. Optical characterization of dissolved organic matter in tropical rivers of the Guayana Shield, Venezuela. J. Geophys. Res. Biogeosci. 2010, 115. [Google Scholar] [CrossRef] [Green Version]
  58. Baker, A.; Spencer, R.G.M. characterization of dissolved organic matter from source to sea using fluorescence and absorbance spectroscopy. Sci. Total Environ. 2004, 333, 217–232. [Google Scholar] [CrossRef]
  59. Cadondon, J.G.; Vallar, E.A.; Belo, L.P.; Orbecido, A.H.; Galvez, M.C.D. UV-Vis absorbance and fluorescence characterization of Pasig River surface water samples towards the development of an LED fluorescence lidar system. IJASEIT 2021, 11, 968–980. [Google Scholar] [CrossRef]
  60. Matsuoka, A.; Bricaud, A.; Benner, R.; Para, J.; Sempere, R.; Prieur, L.; Belanger, S.; Babin, M. Tracing the transport of colored dissolved organic matter in water masses of the Southern Beaufort Sea: Relationship with hydrographic characteristics. Biogeosciences 2012, 9, 925–940. [Google Scholar] [CrossRef] [Green Version]
  61. Rodriguez, F.J.; Schlenger, P.; Garcia-Valverde, M. Monitoring changes in the structure and properties of humic substances following ozonation using UV-Vis, FTIR and 1H-NMR techniques. Sci. Total Environ. 2016, 541, 623–637. [Google Scholar] [CrossRef]
  62. Ikeya, K.; Watanabe, A. Direct expression of an index for the degree of humification of humic acids using organic carbon concentration. Soil Sci. Plant Nutr. 2003, 49, 47–53. [Google Scholar] [CrossRef]
  63. Yakimenko, O.; Khundzhua, D.; Izosimov, A.; Yuzhakov, V.; Patsaeva, S. Sources indicator of commercial humic products: UV-Vis and fluorescence proxies. J. Soils Sediments 2016, 18, 1279–1291. [Google Scholar] [CrossRef]
  64. Hur, J.; Williams, M.A.; Schlautman, M.A. Evaluating spectroscopic and chromatographic techniques to resolve dissolved organic matter via end member mixing analysis. Chemosphere 2006, 63, 387–402. [Google Scholar] [CrossRef] [PubMed]
  65. Goldman, J.H.; Rounds, S.A.; Needoba, J.A. Applications of Fluorescence Spectroscopy for Predicting Percent Wastewater in an Urban Stream. Environ. Sci. Technol. 2012, 46, 4374–4381. [Google Scholar] [CrossRef]
  66. Chen, M.F.; Wu, J.; Lv, Y.L.; Chen, Q.J. Fluorescence properties of municipal wastewater. Acta Opt. Sin. 2008, 28, 578–582. [Google Scholar] [CrossRef]
  67. Yin, H.; Wang, Y.; Yang, Y.; Huang, J.; Xu, Z. Tryptophan-like fluorescence as a fingerprint of dry-weather misconnections into storm drainage system. Environ. Sci. Eur. 2020, 32, 61. [Google Scholar] [CrossRef] [Green Version]
  68. Cory, R.M.; Miller, M.P.; McKnight, D.M.; Guerard, J.J.; Miller, P.L. Effect of instrument-specific response on the analysis of fulvic acid fluorescence spectra. Limnol. Oceanogr. Methods 2010, 8, 67–78. [Google Scholar]
  69. Ohno, T.; Fernandez, I.J.; Hiradate, S.; Sherman, J.F. Effects of soil acidification and forest type on water soluble soil organic matter properties. Geoderma 2007, 140, 176–187. [Google Scholar] [CrossRef]
  70. Regis, E. The Pasig River: Caring for a Dying Ecosystem; The Pasig River Rehabilitation Commission: Quezon City, Philippines, 2001. [Google Scholar]
  71. Parlanti, E.; Worz, K.; Geoffroy, L.; Lamotte, M. Dissolved organic matter fluorescence spectroscopy as a tool to estimate biological activity in a coastal zone submitted to anthropogenic inputs. Org. Geochem. 2000, 31, 1765–1781. [Google Scholar] [CrossRef]
  72. Baker, A.; Bolton, L.; Newson, M.; Spencer, R.G.M. Spectrophotometric properties of surface water dissolved organic matter in an afforested upland peat catchment. Hydrol. Process. 2008, 22, 2325–2336. [Google Scholar] [CrossRef]
  73. LLDA Water Quality Monitoring Report 2019–2020. Available online: https://llda.gov.ph/annual-report/ (accessed on 1 July 2021).
  74. Zhang, Y.; Liu, M.; Qin, B.; Feng, S. Phytochemical degradation of chromophoric-dissolved organic matter exposed to simulated UV-B and natural solar radiation. Hydrobiologia 2009, 627, 159–168. [Google Scholar] [CrossRef]
  75. Jiang, T.; Skyllberg, U.; Bjorn, E.; Green, N.W.; Tang, J.; Wang, D.; Gao, J.; Li, C. Characteristics of dissolved organic matter (DOM) and relationship with dissolved mercury in Xiaoqing River-Laizhou Bay estuary, Bohai Sea, China. Environ. Pollut. 2017, 223, 19–30. [Google Scholar] [CrossRef] [PubMed] [Green Version]
  76. Catalan, N.; Obrador, B.; Felip, M.; Pretua, J.L. Higher reactivity of allochthonous vs autochthonous DOC sources in a shallow lake. Aquat. Sci. 2013, 75, 581–593. [Google Scholar] [CrossRef]
  77. Park, S.M.; Shin, Y.K. The impact of monsoon rainfall on the water quality in the upstream watershed of southern Han River. Korean J. Ecol. Environ. 2011, 44, 373–384. [Google Scholar]
  78. Bianchi, T.S. The role of terrestrially derived organic carbon in the coastal ocean: A changing paradigm and the priming effect. Proc. Natl. Acad. Sci. USA 2013, 108, 19473–19481. [Google Scholar] [CrossRef] [Green Version]
Figure 1. Water quality measurements and collection were done from seven sampling locations in SR and CR. The red arrow represents the water flow from upstream to downstream of both rivers.
Water 14 01444 g001
Figure 2. Distribution of absorbance ratio in SR and CR. The absorbance ratios used for the analysis are as follows: (1) Molecular weight at A250/363, (2) DOM sources at A254/436, (3) DOM sources at A250/665, and (4) Humification at A300/400. These measurements were conducted for all sampling stations in the month of (a) November 2019, (b) December 2019, (c) January 2020, and (d) February 2020.
Water 14 01444 g002
Figure 3. Box and Whisker plot of the absorbance ratios for molecular weight (A340/254), humification (A300/400), DOM sources (A254/436), and DOM sources (A280/665).
Water 14 01444 g003
Figure 4. Distributions of DOM components in SR and CR. DOM components such as Tryptophan-like (T), humic acid-like (C), and fulvic acid-like (A) were measured for all sampling stations in the month of (a) November 2019, (b) December 2019, (c) January 2020, and (d) February 2020.
Water 14 01444 g004
Figure 5. Box and whisker plot of fluorescence peaks such as tryptophan-like, fulvic acid-like, and humic acid-like substances.
Water 14 01444 g005
Figure 6. Index distributions of FI vs. HIX from November 2019 to February 2020 in SR and CR.
Water 14 01444 g006
Figure 7. Index distributions of BIX vs. HIX from November 2019 to February 2020.
Water 14 01444 g007
Figure 8. Scatter plot of Molecular weight vs. humification in SR and CR.
Water 14 01444 g008
Table 1. Watershed area and land use in Santa Rosa (SR) and Cabuyao (CR) Rivers [45,46].
RiverWatershed Area (km2)Approximate Length (km)Land Use (%)
Commercial-ResidentialGrass LandsIndustrialMixed CropRice Lands
SR115270.120.110.040.050.07
CR19.50.080.060.020.020.08
Table 2. Description and land use of the seven sampling stations along with the coordinates.
StationDescriptionCoordinatesLand Use Type
SRU1Upstream flow of Sta. Rosa River14°15′12.6023″ E
121°03′14.8066″ N
Grassland, commercial or industrial, Low residential
SRM2Midstream flow of Sta Rosa River14°16′34.3380″ E
121°4′16.9716″ N
Low residential
SRD3Downstream flow of Sta Rosa River14°17′46.9860″ E
121°7′40.2996″ N
High residential, commercial or industrial
CRU1Upstream flow of Cabuyao River14°16′32.1385″ E
121°7′5.5740″ N
High residential, commercial, or industrial
CRD2Downstream flow of Cabuyao River14°17′46.1256″ E
121°7′40.0736″ N
Cropland, Low residential
SCRC1Convolution of SR and CR14°17′47.2644″ E
121°7′41.8080″ N
High residential, fishing
SCRC2Connected to Laguna Lake14°17′52.7532″ E
121°7′48.3724″ N
High residential, fishing
U—Upstream; M—Midstream, D—Downstream.
Table 3. Weather conditions and observations during the sampling period [47].
Sampling MonthWeather ConditionsObservations
Air Temp. (°C)Mean Precipitation (mm)Humidity (%)
November 2019260.0872Cloudy
December 2019250.9970Cloudy; sampling conducted after Typhoon Tisoy (PAGASA typhoon name)
January 2020270.1874Sunny to Cloudy; sampling conducted after Taal Volcano eruption
February 202027075Cloudy, dusty in some areas due to the eruption
Table 4. Absorbance ratio used in interpreting DOM of SR and CR.
Target CharacteristicsAbsorbance RatioPossible Sources
Molecular weightA250/363Lake
DOM sourcesA254/436Estuary/River
DOM sourcesA280/665Humic acid from lake sediments
HumificationA300/400Soil humic and soil fulvic acids; Lake
Table 5. Compositions and indices of fluorescence DOM of SR and CR.
Target Characteristics/IndexComponent TypeExcitation (nm)Emission (nm)
TTryptophan-like210–250320–380
AFulvic acid-like210–250380–550
CHumic acid-like250–430380–550
FITo differentiate DOM sources370470/520
BIXEndogenous sources/freshly derived microbial produced DOM310380/430
HIXDegree of humification254(435–480) + (380–550)
Table 6. Water quality parameters measured in SR and CR.
Sampling Stationsp Value
ParametersAcceptable Range by DENR [12] Sta Rosa RiverCabuyao RiverConvolution of SR and CRSpatialMonthly
SRU1SRM2SRD3CRU1CRD2SCRC1SCRC2
Temperature (°C)25–31Mean
SD
27.70
0.89
28.98
0.48
28.65
0.47
28.67
0.23
28.03
0.39
27.91
0.26
27.88
0.54
0.34230.1446
pH6.5–9.0Mean
SD
8.34
2.17
7.06
0.69
7.78
0.46
7.50
0.26
7.81
0.60
7.65
0.27
7.84
0.46
0.68100.0682
DO (mg/L)5Mean
SD
1.58
2.49
3.84
0.45
0.16
0.01
2.03
1.17
1.33
0.81
0.36
0.13
0.13
0.01
0.26500.8381 c
EC (mS/cm)-Mean
SD
1.25
0.13
0.93
0.32
0.94
0.35
1.00
0.22
0.74
0.18
0.96
0.24
1.06
0.09
0.23260.2972
TSS (mg/L)80Mean
SD
12.67
6.02
59
57.98
31.25
19.46
7.33
1.25
9.25
3.34
15.00
7.84
13.00
3.39
0.60620.4254
Nitrates (mg/L)7Mean
SD
0.20
0.04
0.82
1.06
0.51
0.27
0.23
0.04
0.50
0.54
0.52
0.42
0.31
0.18
0.67410.0005 a
TP (mg/L)-Mean
SD
1.72
0.08
1.24
0.23
2.63
0.57
1.89
0.16
1.91
0.63
2.09
0.55
1.75
0.21
0.0002 a0.05828 c
Chlorides (mg/L)350Mean
SD
114.50
15.50
78.67
52.85
77.00
17.11
48.00
23.00
42.67
25.20
71.00
33.74
66.33
48.60
--
Oil and Grease (mg/L)2Mean
SD
1.43
0.38
1.38
0.34
2.43
1.15
0.82
0.34
1.14
0.28
1.50
0.36
1.27
0.41
0.0399 b0.7191
BOD (mg/L)7Mean
SD
51.00
10.61
30.25
16.08
66.75
33.30
20.67
13.02
9.00
4.30
30.50
21.59
63.75
26.04
0.0106 b0.3442
DOC (mg/L)-Mean
SD
39.33
7.54
34.67
1.70
30.67
4.03
19.67
6.65
18.67
1.25
28.67
3.86
40.33
11.26
0.0004 a-
a—Statistically significant at p < 0.01; b—Statistically significant at p < 0.05; c—Statistically significant at p < 0.10.
Table 7. Mean fluorescence peak ratio of C: T and A: T in SR and CR.
Sampling Stationsp Value
Ratio Sta. Rosa RiverCabuyao RiverConvolution of SR and CRSpatialMonthly
SRU1SRM2SRD3CRU1CRD2SCRC1SCRC2
Humic-like: Tryptophan-like (C:T)Mean SD6.83
2.61
4.79
2.28
6.55
3.58
4.82
3.63
12.2
7.58
5.55
0.94
11.36
5.30
0.0768 b0.3133
Fulvic-like: Tryptophan-like (A:T)Mean SD1.73
0.84
1.02
0.34
1.12
0.25
3.63
0.48
3.012
1.61
1.22
0.31
2.68
1.68
0.0109 a0.6350
a—Statistically significant at p < 0.05; b—Statistically significant at p < 0.10.
Publisher’s Note: MDPI stays neutral with regard to jurisdictional claims in published maps and institutional affiliations.

