1. Introduction
Karst collapse is a dynamic geological phenomenon in which the surface rock and soil bodies sink downward under the action of natural or human factors and form collapse pits (holes) in the ground, which is one of the main types of geological disasters in karst areas [
1,
2,
3,
4,
5]. According to the statistics, 17 countries have been plagued by karst collapse problems. China is one of the countries with the most extensive karst collapse development in the world, covering 23 provinces and cities in China, among which karst collapse is especially serious in Guangxi, Guizhou, and Hubei, greatly affecting the economic construction and livable environment. Therefore, it is extremely necessary to solve the problem of karst collapse, which must be theoretically analyzed and mastered first. It is extremely important to select an effective evaluation method of karst collapse susceptibility, and then select the corresponding prevention measures on this basis, which will often achieve better results. However, due to the influence of many factors, the formation of karst collapse has a large degree of uncertainty, both in time and space [
6,
7,
8]. The selection of suitable evaluation methods has always puzzled researchers [
9,
10,
11], for which they have made a lot of efforts. From the 1960s to the present, the studies on karst collapse evaluation have been fruitful. Wang Fei [
12], Yang Yang [
13], Miao Shixian [
14], Mu Chunmei [
15], Wan Zhibo [
16], Gao Xuechi [
17], etc. have analyzed the evolution mechanism of karst collapse through field monitoring, experiments, and the analysis of triggering factors.
Since the factors affecting karst collapse are multi-faceted, multi-layered, interrelated, and mutually restrictive, their degrees of influence are different, meaning many methods cannot be directly applied to karst collapse evaluation. Therefore, Hengheng [
6], Zhong Yu [
18], Wu Liqing [
19], Duan Xianqian [
20], Ouyang Hui [
21], Cui Yuliang [
22], etc. carried out quantitative predictive evaluations of karst collapse in time and space through different evaluation index systems and methods and achieved certain results. In order to seek a reliable evaluation method of karst collapse, through continuous exploration and application research, many experts and scholars, such as Pan Zongyuan [
3], Zhang Jie [
5], Zeng Bin [
8], Li Xi [
23], Chen Juyan [
24], etc., have gradually confirmed that AHP methods and GIS technologies have better applicability and good reliability in karst collapse evaluation. The advantages of AHP methods and GIS technologies are also obvious [
25,
26,
27,
28,
29]. For the karst collapse problem, Xiao Jianqiu [
30], Peng Yuhuan [
31], Zhang Baozhu [
32], Luo Xiaojie [
33], etc., based on the effective evaluation of karst collapse susceptibility and combined with karst collapse-inducing factors and the karst geological structure, proposed a management plan and prevention measures for karst collapse and achieved better results.
In order to adapt to the economic development of the ASEAN region and ensure smooth and safe economic transportation, it is necessary to renovate and expand section K1379+300-K1471+920 of the Quannan Expressway. The total length of the route is 92.62 km, 72% of which is located in the karst area. The karst collapse is the main risk factor in the construction and operation of the expressway. It is of great significance to carry out the prediction and evaluation of karst collapse and propose prevention and control methods for the whole route to ensure the safe construction and operation of the expressway after completion, and to promote the steady economic development of the ASEAN region. In this paper, based on the previous research results, the evaluation index system and evaluation model of the karst collapse susceptibility are established by the AHP method, the evaluation of the karst collapse susceptibility of the K1379+300-K1471+920 section of the Quannan Expressway is carried out by ArcGIS analysis technology, and the prevention measures for karst collapse are proposed to provide a reference for disaster prevention and mitigation work. The research of this paper plays a guiding role in the safe construction and operation of the expressway after completion, which is of great practical significance. At the same time, it is of certain academic research value, as it promotes and draws reference from the research on the karst collapse of several route projects.
2. Overview of the Research Area
2.1. Natural Geography
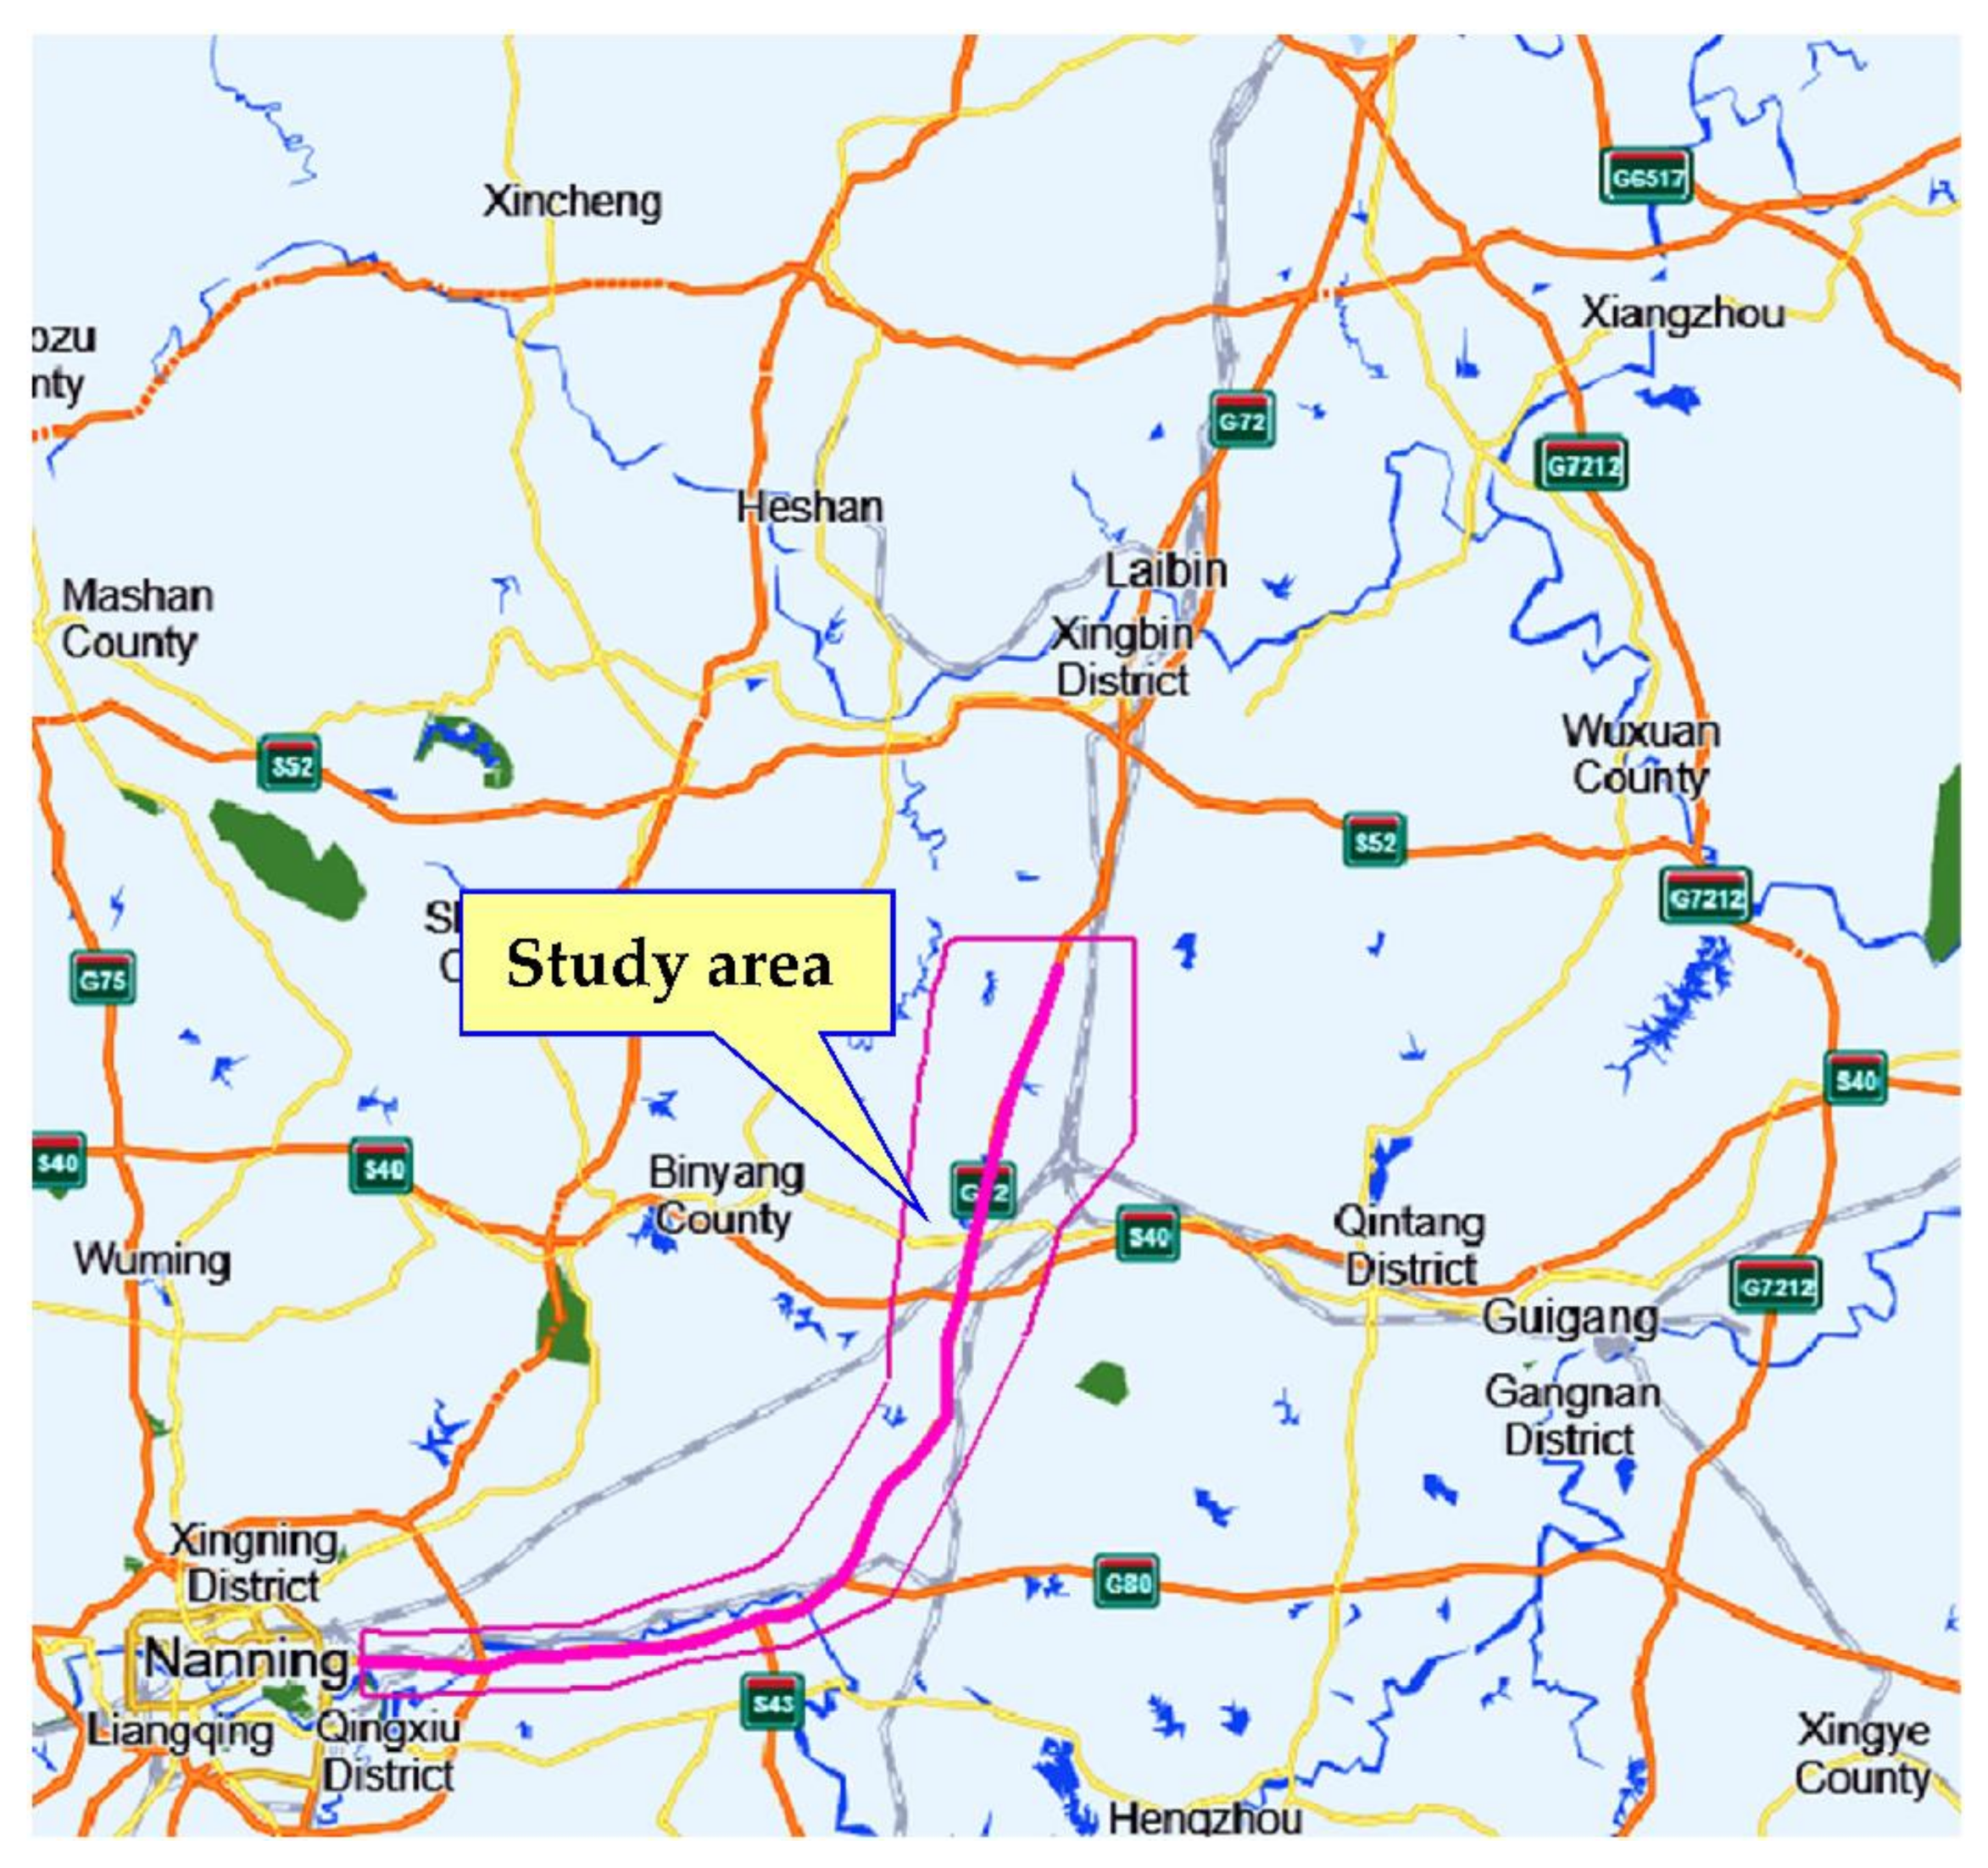
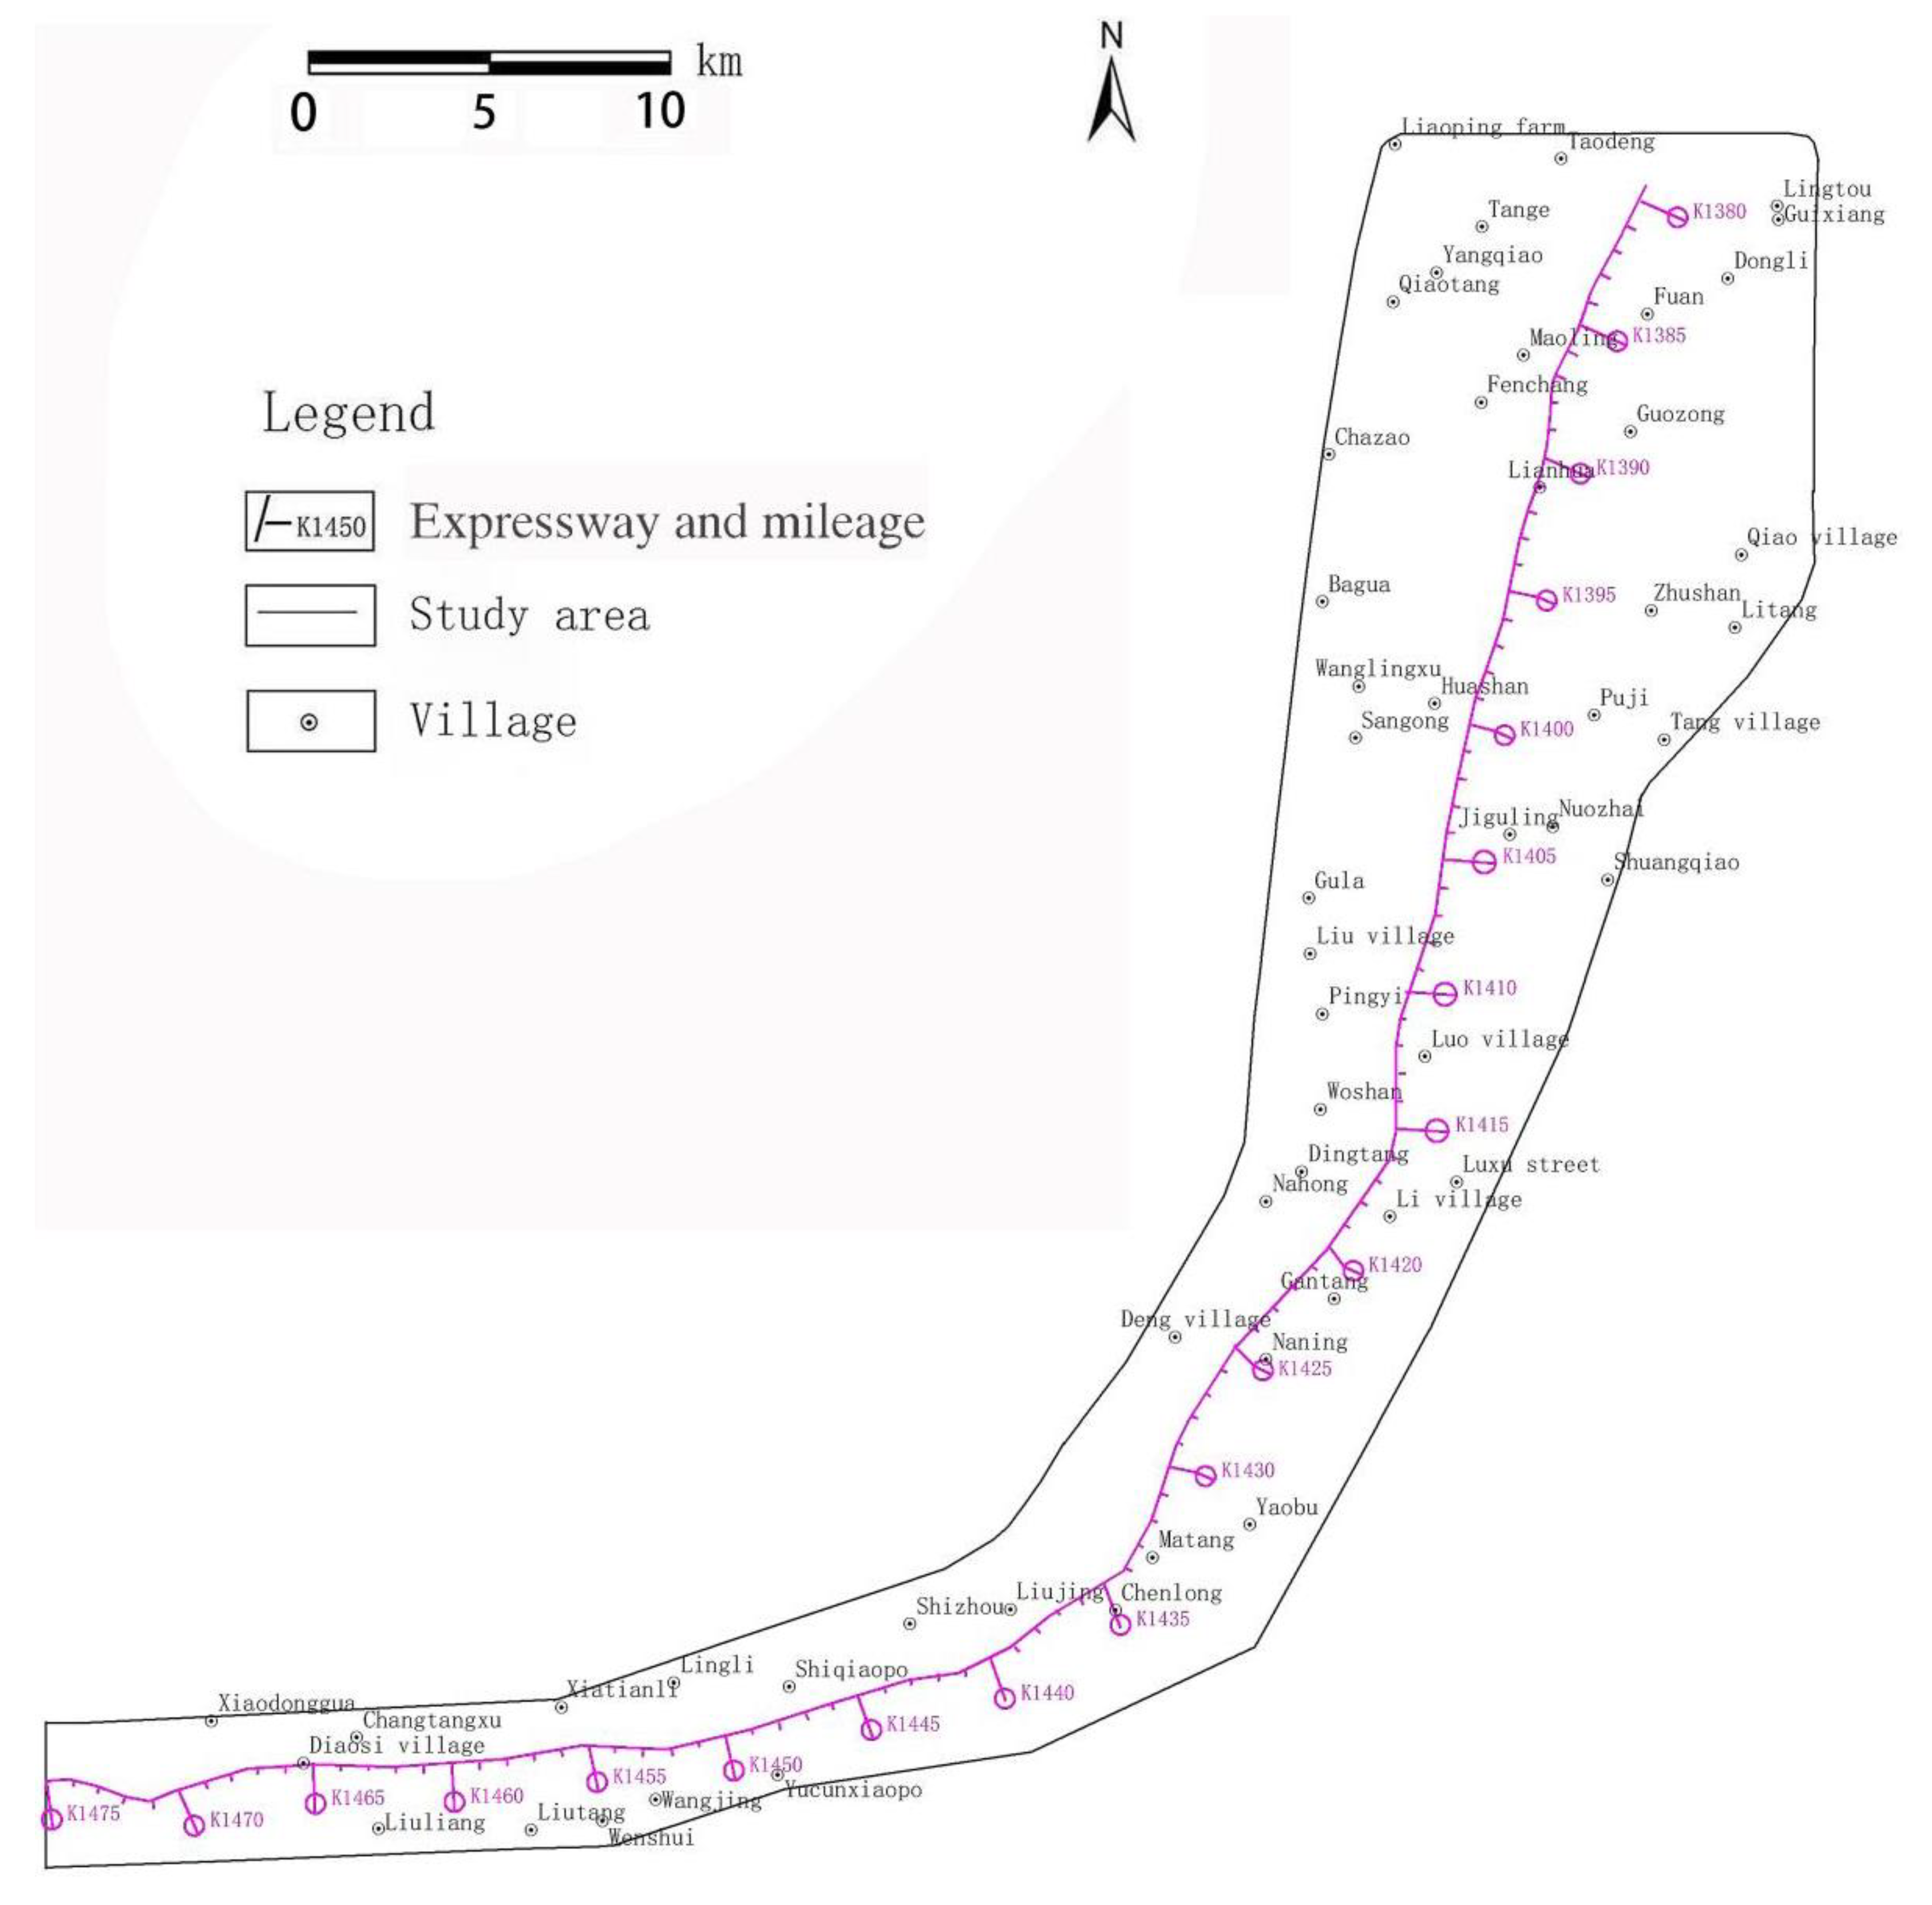
The range of the study area is the K1379+300–K1471+920 section of the Quannan Expressway Expansion Project, which belongs to Binyang County, Heng County, and the Yongning District of Guangxi and passes through the karst area. The range of the research area is shown in
Figure 1,
Figure 2 and
Figure 3.
The research area is located in the south of central Guangxi, China, south of a latitude of 23.5° N, has a subtropical monsoon climate, is rich in light and heat, and has abundant rainfall. The annual average temperature is 21.8 °C, and the annual average rainfall is 1300 mm. The rainy season is concentrated from April to September, accounting for more than 76% of the annual rainfall. The rainfall is the least from November to February, which is the annual dry season. The northern part of the research area is located in the Guizhong Basin and its edge, while the southern part is mainly located in the Yong (Yu) River valley. The landform types are divided into mountainous and plain landforms, mainly karst landforms.
2.2. Geological Structure
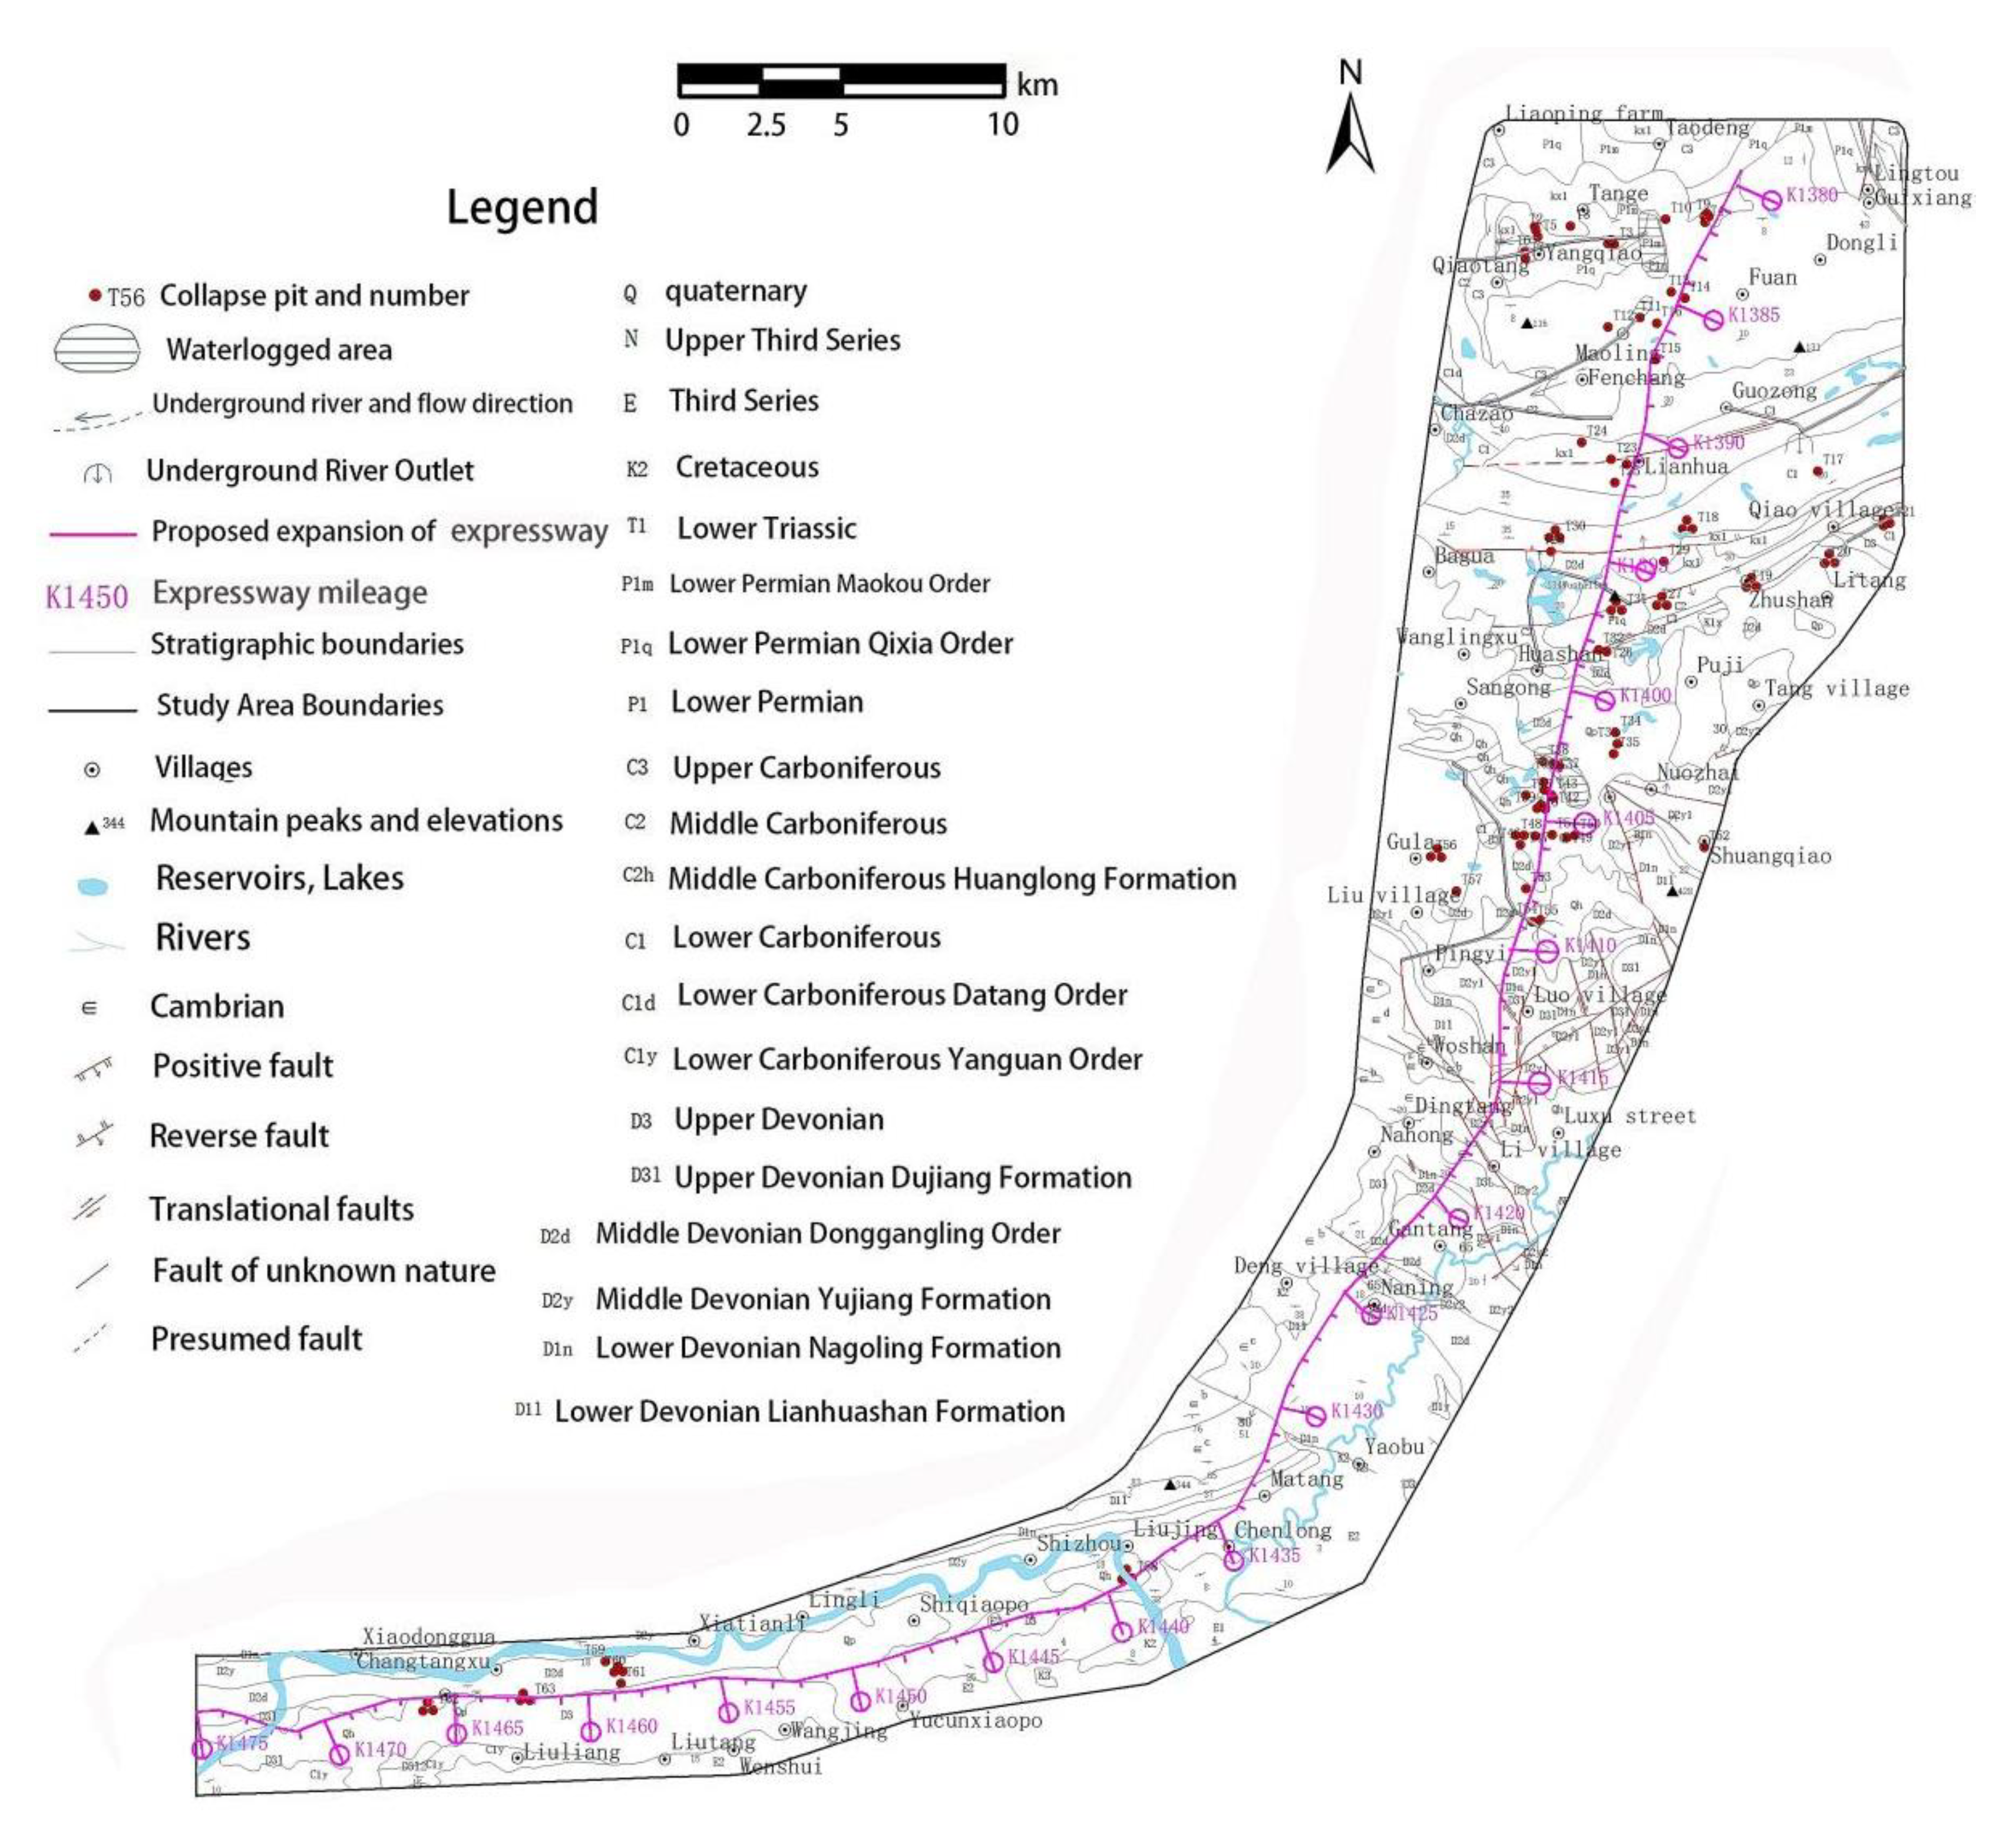
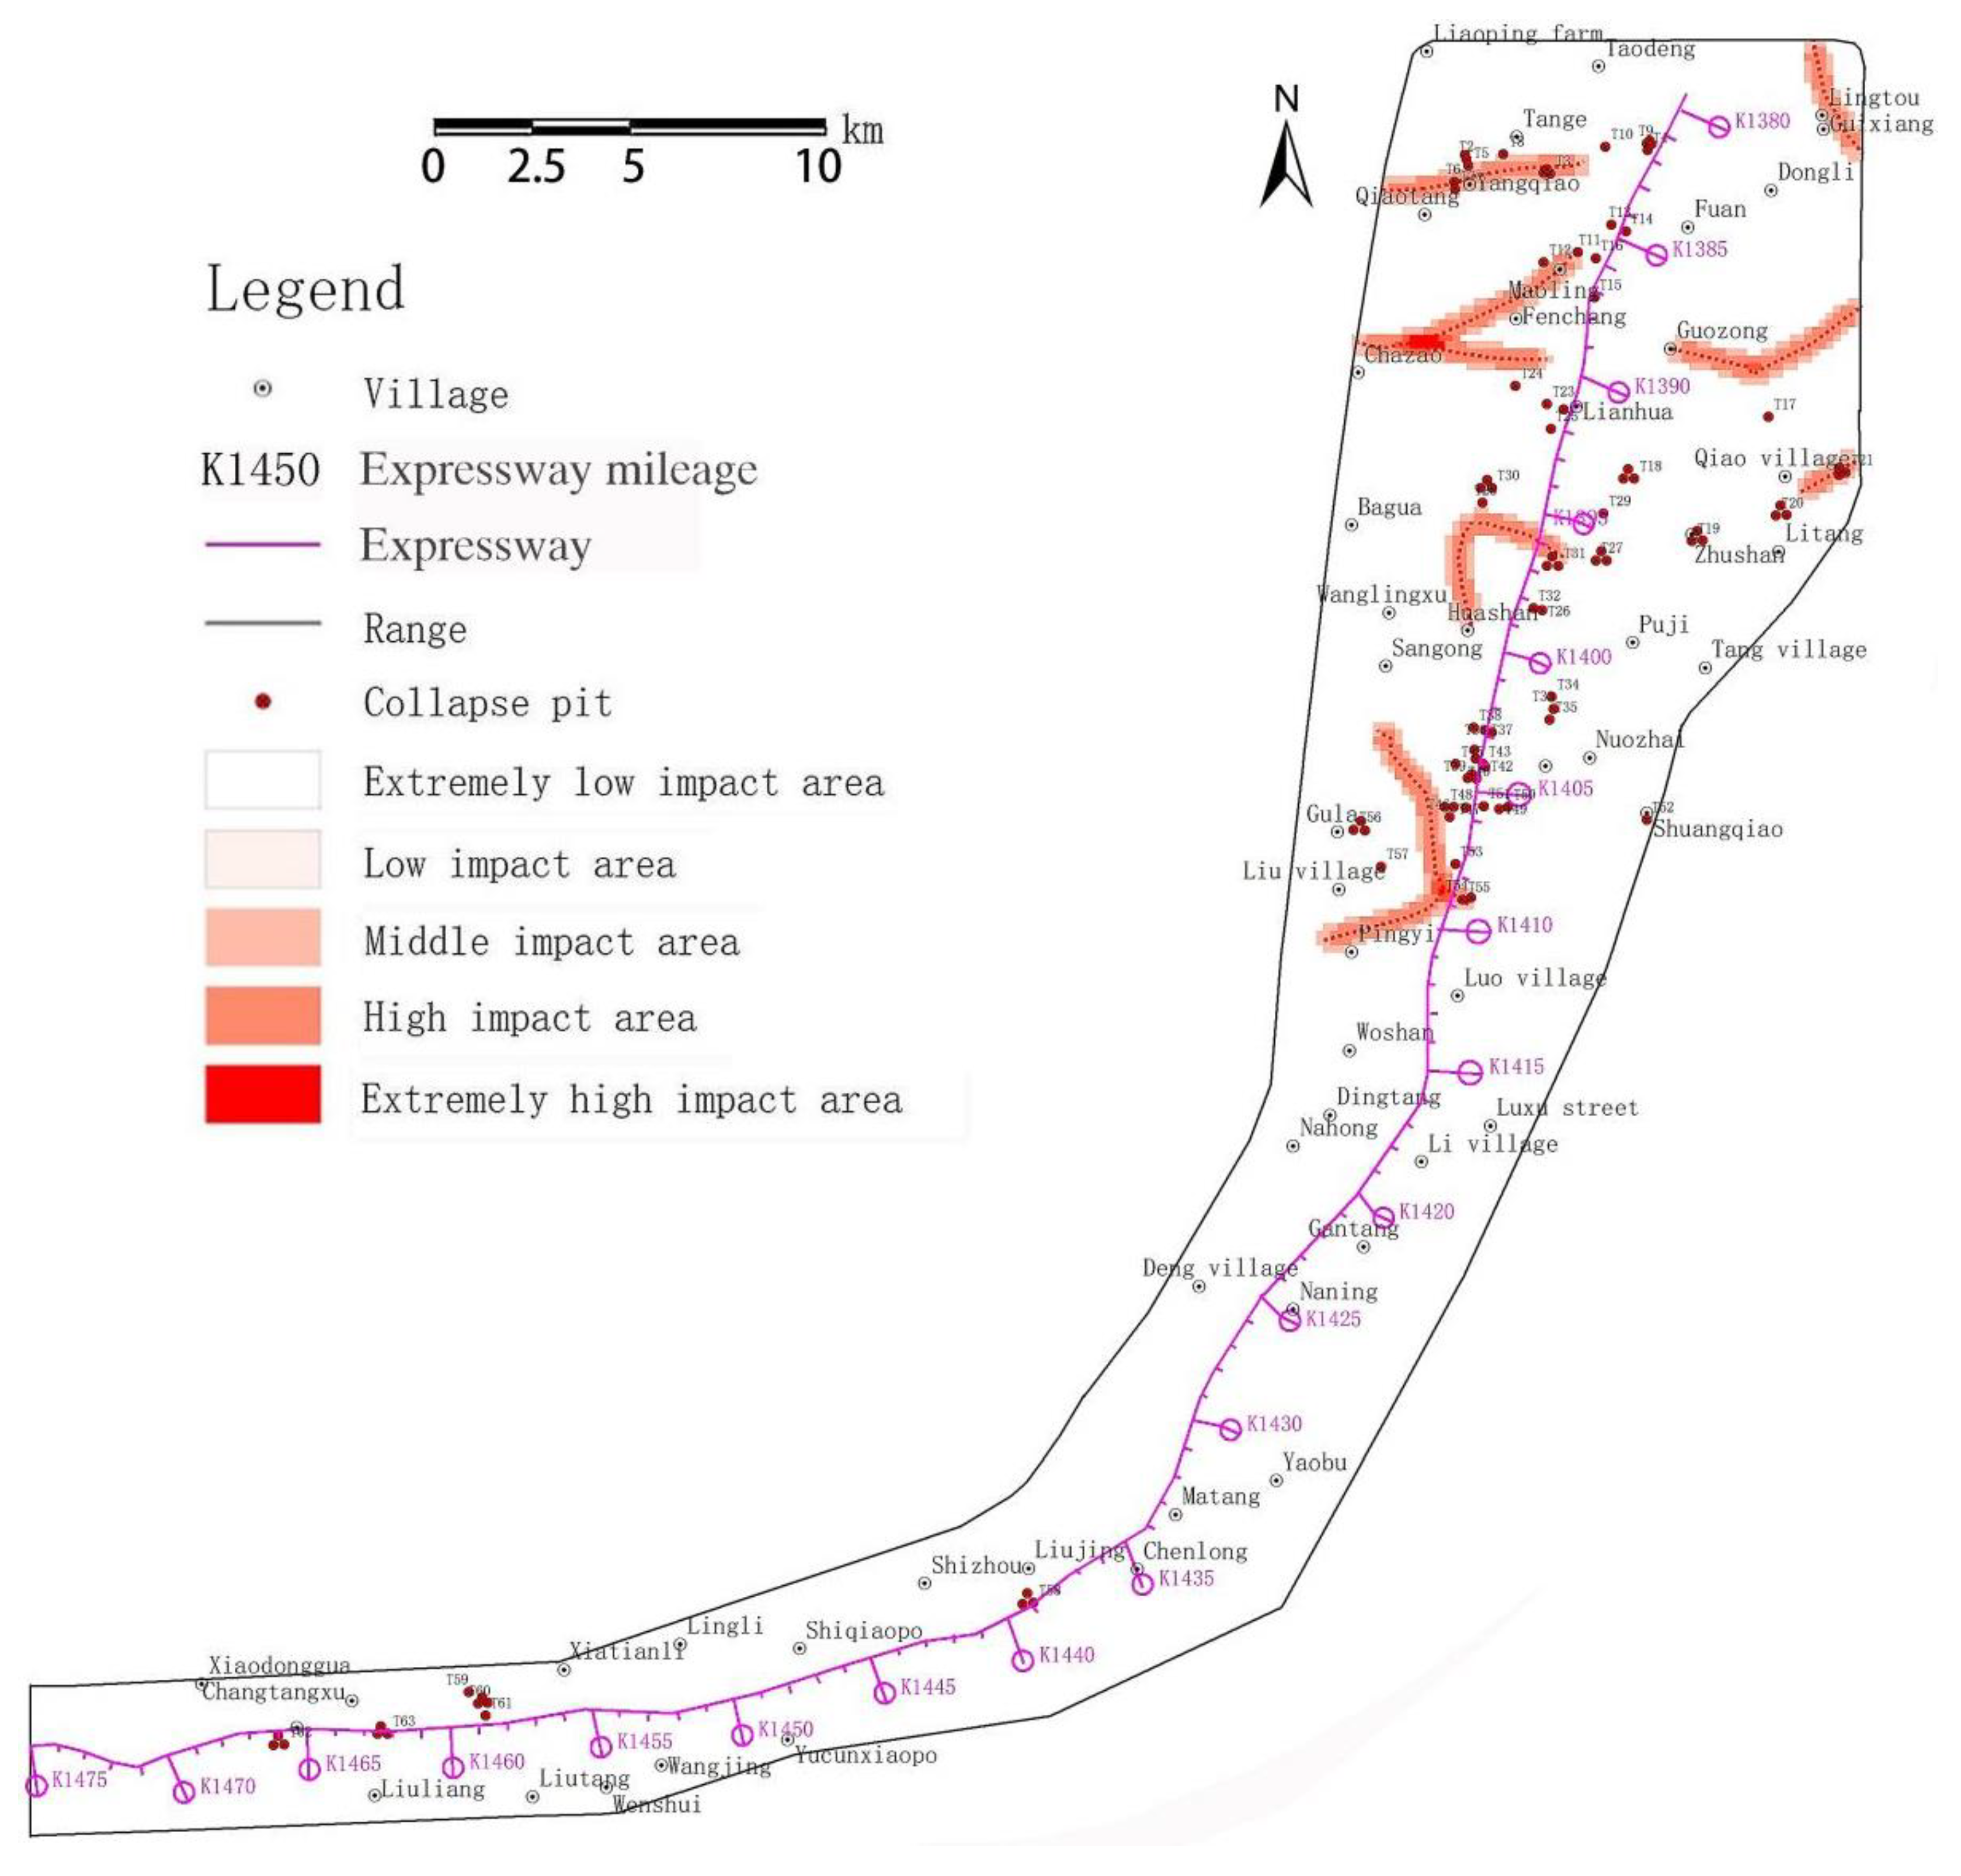
The northern part of the research area is located in the Guizhong Basin and its edge, while the southern part is mainly located in the Yong (Yu) River valley. The geological structure is relatively complex, and the folds are generally not developed. Faults dominate the geological and tectonic background of the study area. The faults in the study area are mainly concentrated in the area from K1389 to K1431, are mainly compressive or compressive–torsional faults, and mainly in the Litang Fracture Zone, the Luxu–Liantang–Hengxian Fault System, and the Tianma–Lucun Regional Fault. There are 12 faults intersecting along the line, five of which are distributed in the karst area. The folds are mainly in the Liujing–Shangzhou gentle monoclinic structure and the Gantang short-axis oblique. According to the combination relationship and genesis of the structure in the study area, it can be divided into three structural systems: the Guangxi mountain-shaped structural system, the north-west structural belt, and the east–west structural belt. The east–west structure is the earliest formation, mainly manifested as wide and gentle folds; the north-west-trending structural belt formed later than the east–west structure, and the latest is the Guangxi mountain-shaped structure, which is dominated by compressive–torsional faults. The three types of structures are all the result of compression. Due to the later formation of the Guangxi mountain-shaped structure and the multiple tectonic movements after its formation superimposed and transformed the EW-trending and NW-trending structures, these two groups of structures experienced the alternating action of left and right twisting. Compression failure and tectonic traction along the fault zone are more common, thus controlling the development direction of karst in the study area. Therefore, the east–west structure has the greatest impact on the line, followed by the north-west structure, and the mountain-shaped structure with the lowest. The relationships between the main fault and the folds and lines in the research area and their influence are shown in
Table 1 and
Figure 3.
2.3. Landform
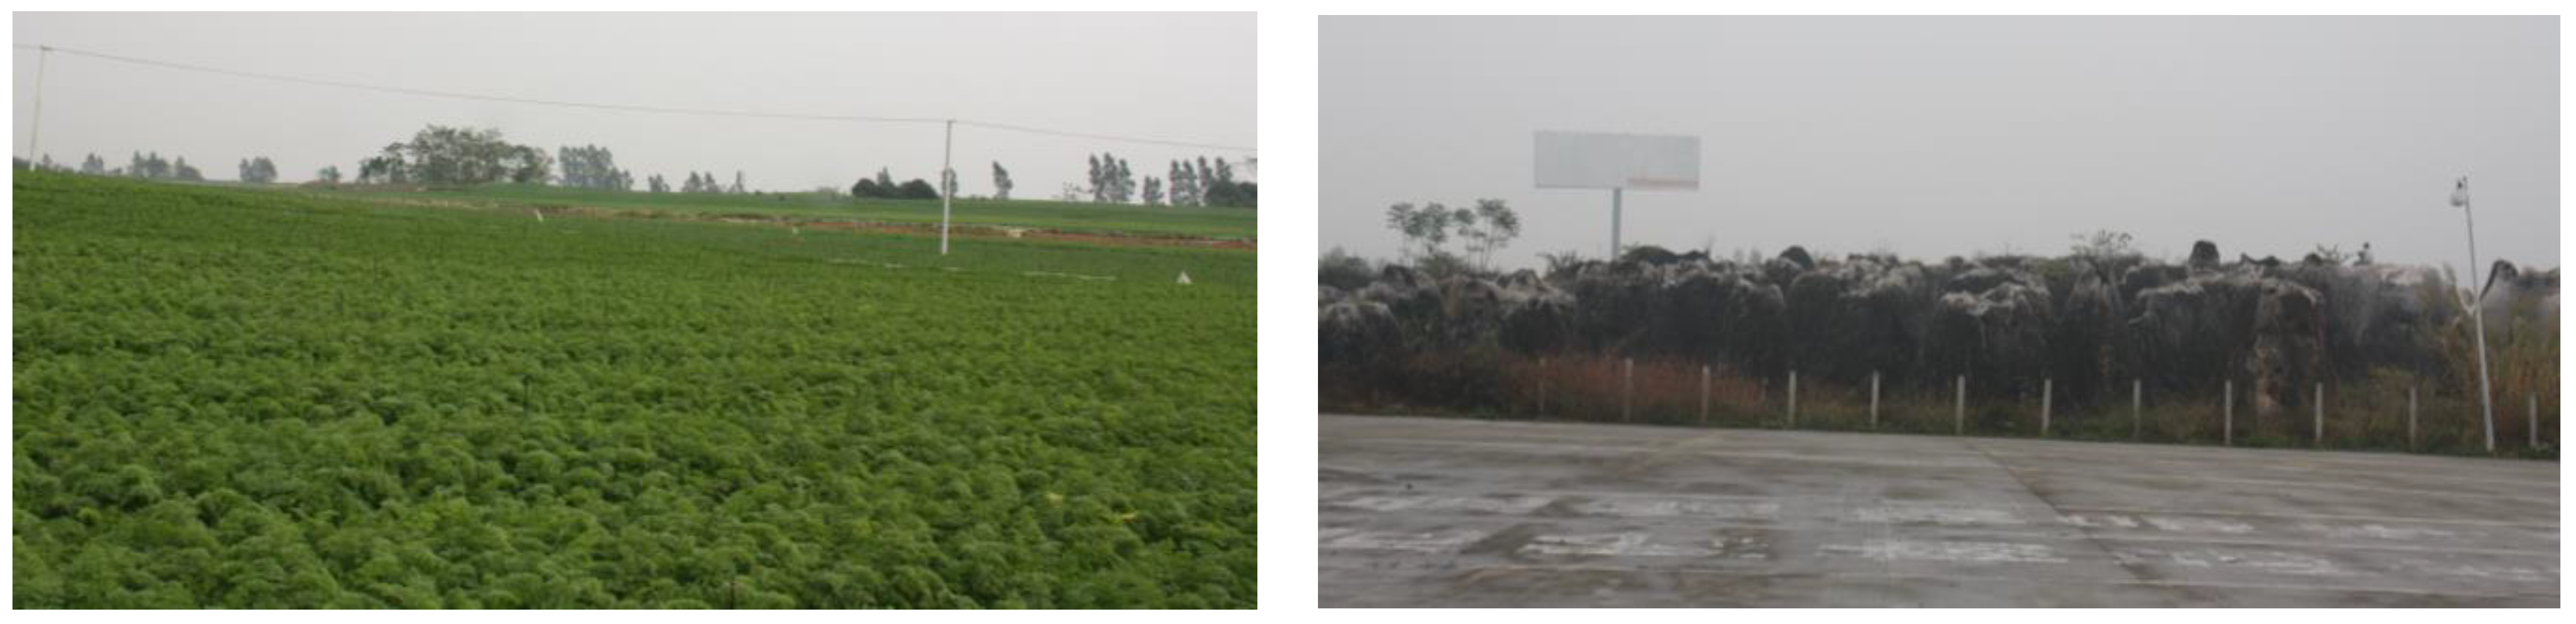
The types of landforms in the study area can be divided into karst landforms and non-karst landforms according to the lithology. Non-karst landforms are composed of erosion and accumulation landforms. The erosion landforms are mainly formed by tectonic erosion. The terrain is characterized by gentle slopes, low mountains, and hills, and the terrain is undulating. The typical types of depositional landforms include alluvial–proluvial fans and river terraces, which are relatively flat. Karst landforms are formed by the combined action of dissolution and erosion. When a karst area is dominated by carbonate rocks, dissolution is the main action, and erosion is the supplement. When a karst area is dominated by clastic rocks, erosion is the main action, and dissolution is the supplement. Dissolution–erosion and erosion–dissolution landforms are mainly developed in the interbedded hydrochloride and clastic rocks, marl and argillaceous limestone, or non-carbonate rocks intercalated with carbonate rocks. Due to the low purity of carbonate rock or the influence of non-carbonate rock, the dissolution effect of carbonate rock is reduced, the karst development is relatively weak, the erosion effect of water flow is strong, and the weathering and denudation effects are also significant. Therefore, erosion plays an important role in the shaping of landforms. The landform formed when dissolution is dominant and erosion is secondary is called erosion–dissolution landform; otherwise, it is dissolution–erosion landform, with relatively gentle terrain and large fluctuations. Dissolution landforms are the key landform types in the study area. They are developed in relatively pure carbonate rock distribution areas. The typical dissolution landform types are dissolving residual hills and ridge plains. The terrain is generally flat and slightly undulating, locally. The karst collapse in the study area is influenced by karst landforms, and the types of landforms in the study area are shown in
Figure 3 and
Table 2. The typical dissolution landforms of the study area are shown in
Figure 4.
2.4. Overburden
As shown in
Figure 3, more than 80% of the surface of the research area is covered by the Quaternary strata. The Quaternary overburden is of the Holocene and Pleistocene ages. The Holocene series layers are mainly distributed in the first terrace of the river, and the Pleistocene series layers are mainly distributed in the second and third terraces. According to its genesis, it is mainly divided into residual slope sediments, residual sediments, and alluvial sediments, which are in the form of clay, silty clay, silt and sand, pebble, and heterogeneous soil. According to the results of the field survey, field investigation, and geophysical exploration and drilling, the thickness of the Quaternary soil layer is small in the foothills and slopes, generally less than 8 m. In the karst plains and valleys, the thickness of the overlying soil layer varies greatly, generally from 1 to 10 m, and the maximum thickness is mainly less than 20 m.
The engineering geological properties of the Quaternary soil layers in the karst area of the research area vary greatly, and there is a tendency for gradual deterioration from top to bottom. Especially in the deeper solution ditch and solution trough, there is thick soft plastic and soft plastic flow soil, which easily produces karst collapse under the influence of groundwater level fluctuation. The karst collapse that has occurred in the study area is mainly the collapse of soil layers with a thickness of around or within 10 m. It is closely related and has a great impact on the construction of the expressway project.
2.5. Hydrogeology
The stratigraphy of the study area is divided into three major types of groundwater-bearing rock groups: carbonate rock, clastic rock, and loose rock, and the corresponding groundwater types are karst water, fracture water of clastic rock, and pore water of loose accumulation of the Quaternary. Karst water is divided into three subcategories: karst fissure water, fissure–cave water, and cave–fissure water, which are mainly developed in the Devonian and Carboniferous carbonate strata, with rich groundwater, mainly pipeline flow, springs, and dark rivers developed along the tectonic line and fracture zone. The fracture water of clastic rocks is mainly controlled by tectonics and weathering, which is distributed in the clastic rock formations of Devonian, Cambrian, Cretaceous, and Tertiary systems, and the groundwater is relatively poor. The pore water of loose accumulation includes the pore phreatic water of the Holocene and Pleistocene series of the Quaternary, which is mainly distributed in the riverbeds, river mudflats, terraces, plains, and depressions of intermountain streams and gullies in the river valleys. Except for the riverbeds, river mudflats, and terraces, which are richer, the rest of the water is poor. The groundwater in the clastic area is mainly recharged by the infiltration of atmospheric rainfall, while the groundwater in the karst area is recharged by the infiltration of atmospheric rainfall collected by negative karst topography, infiltration through waterfall holes, underground river skylights, vertical wells, karst fissures, etc., and the infiltration of groundwater in the Quaternary, while there is a lateral recharge of fissure water from neighboring non-soluble rocks in the research area. The fluctuation of the groundwater level in the karst area, especially at the rock–soil interface, is one of the main factors leading to the formation of karst collapse.
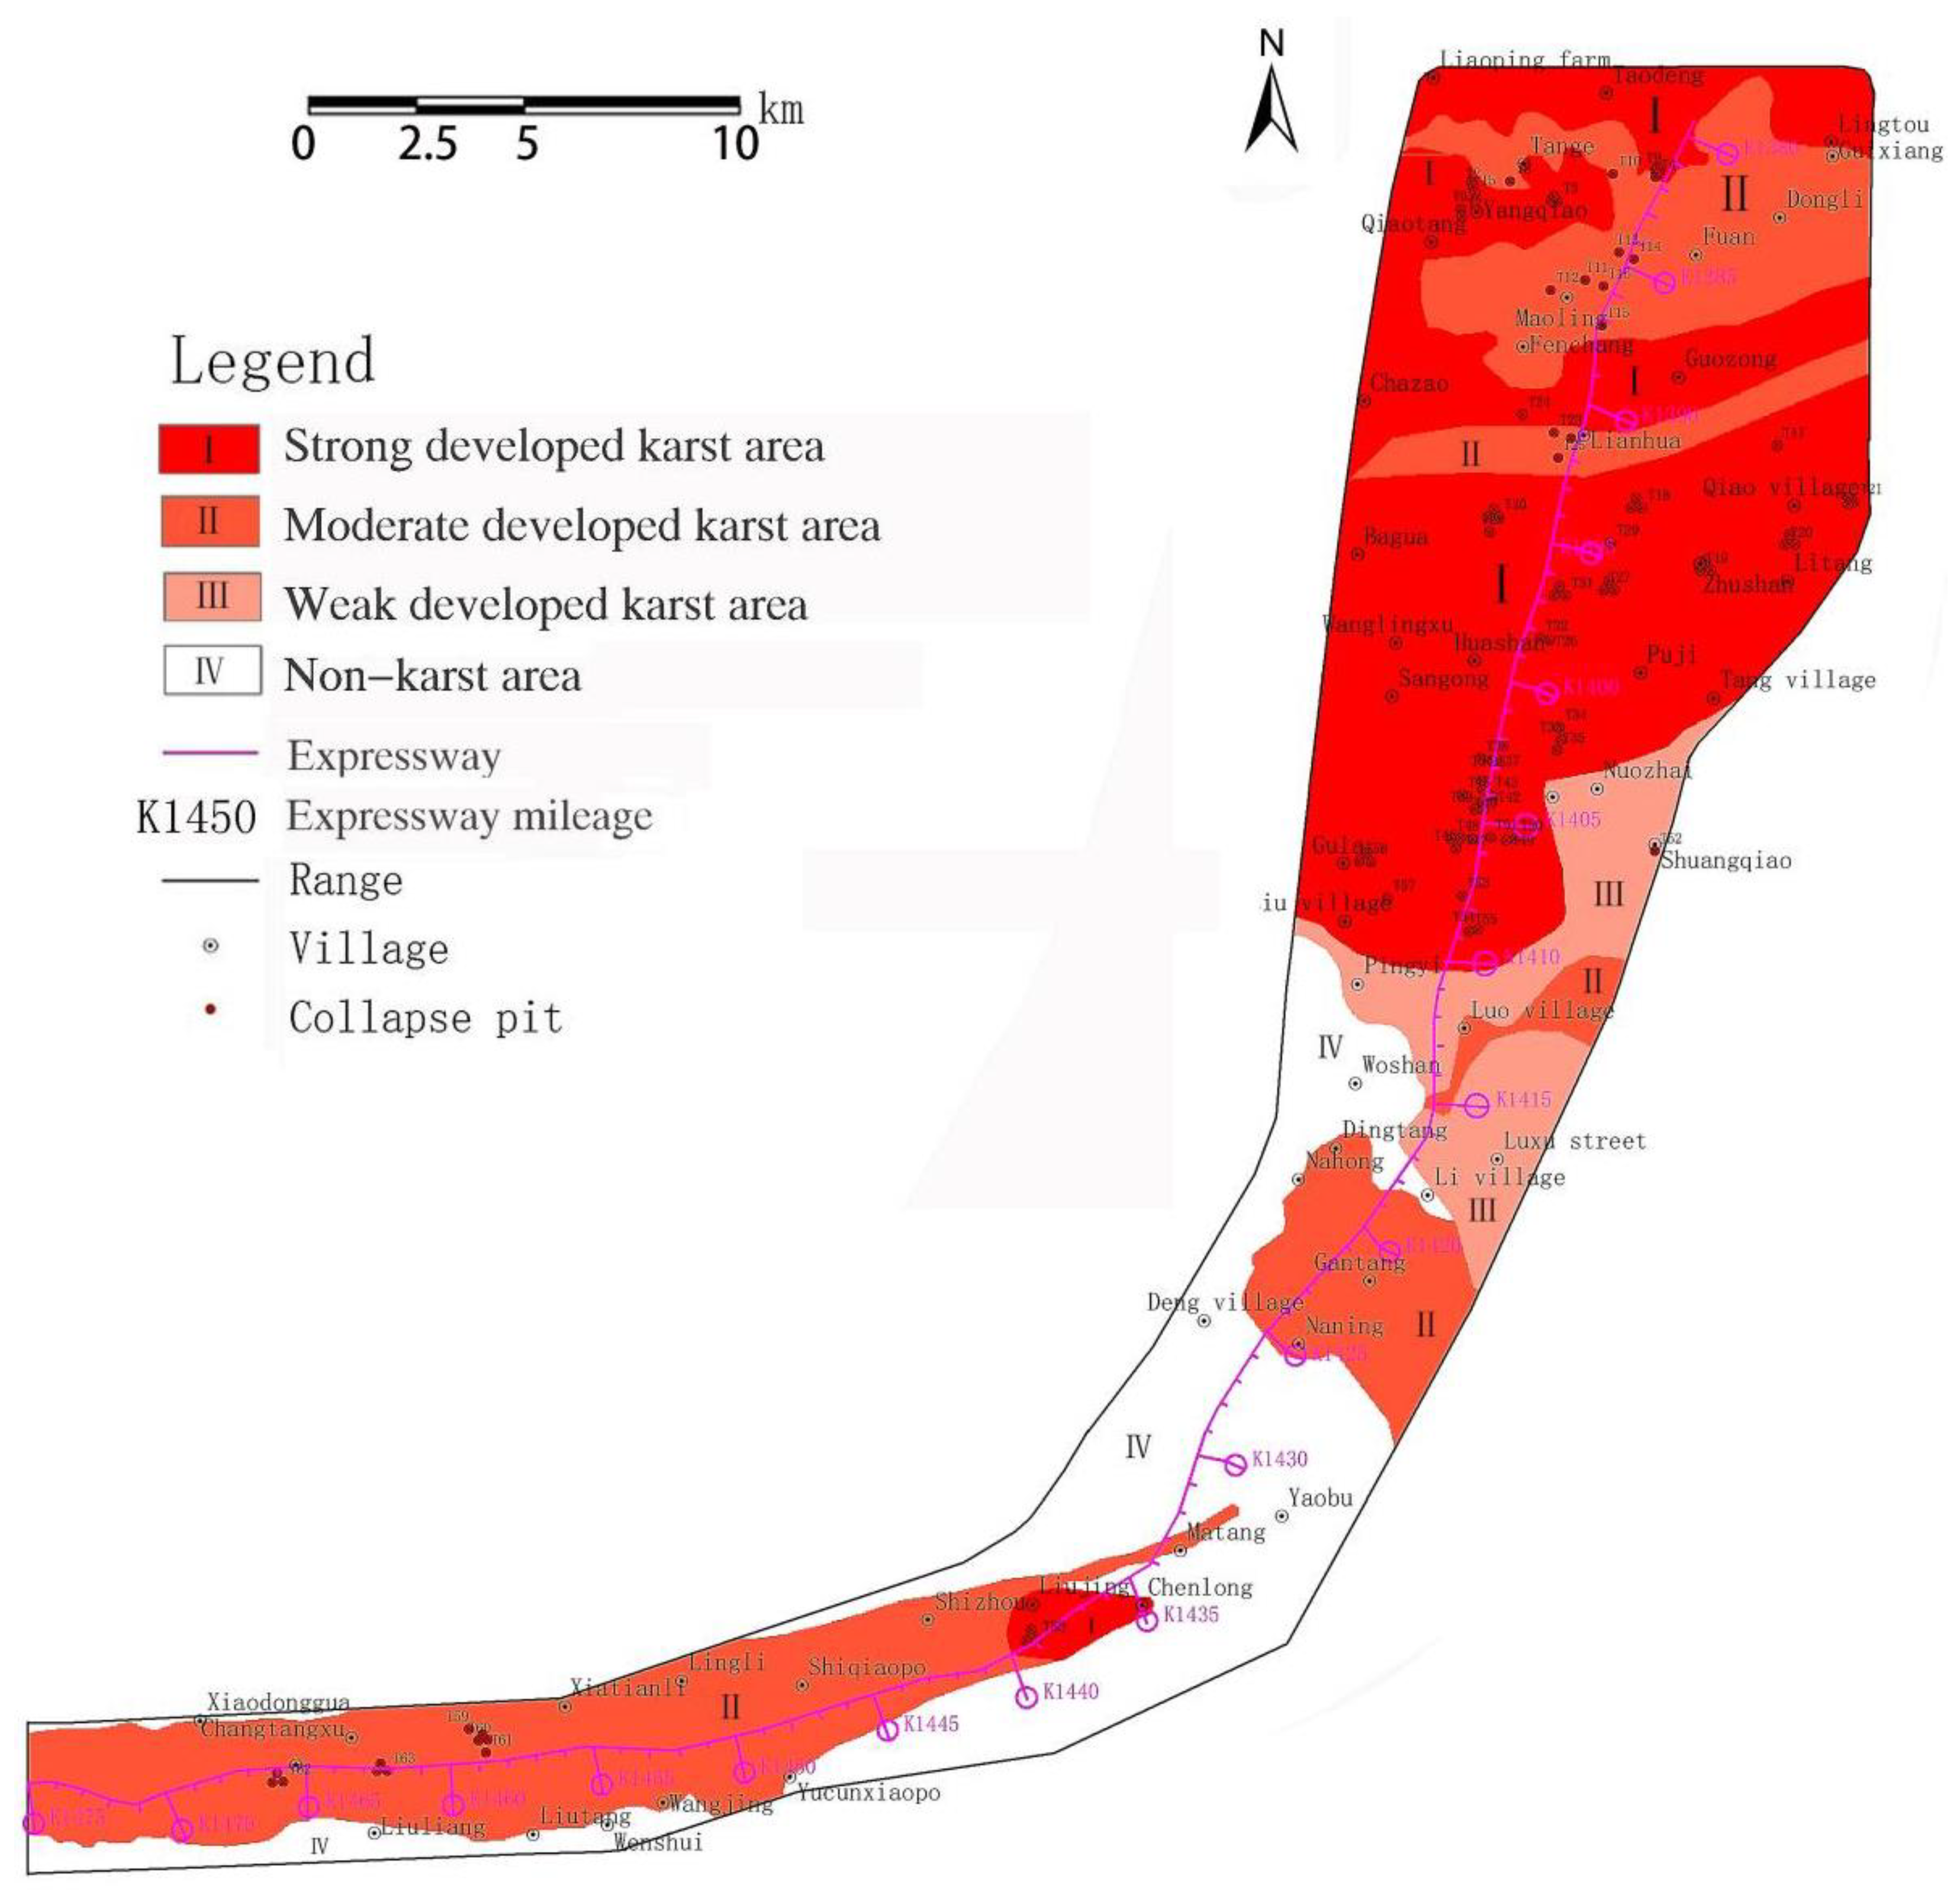
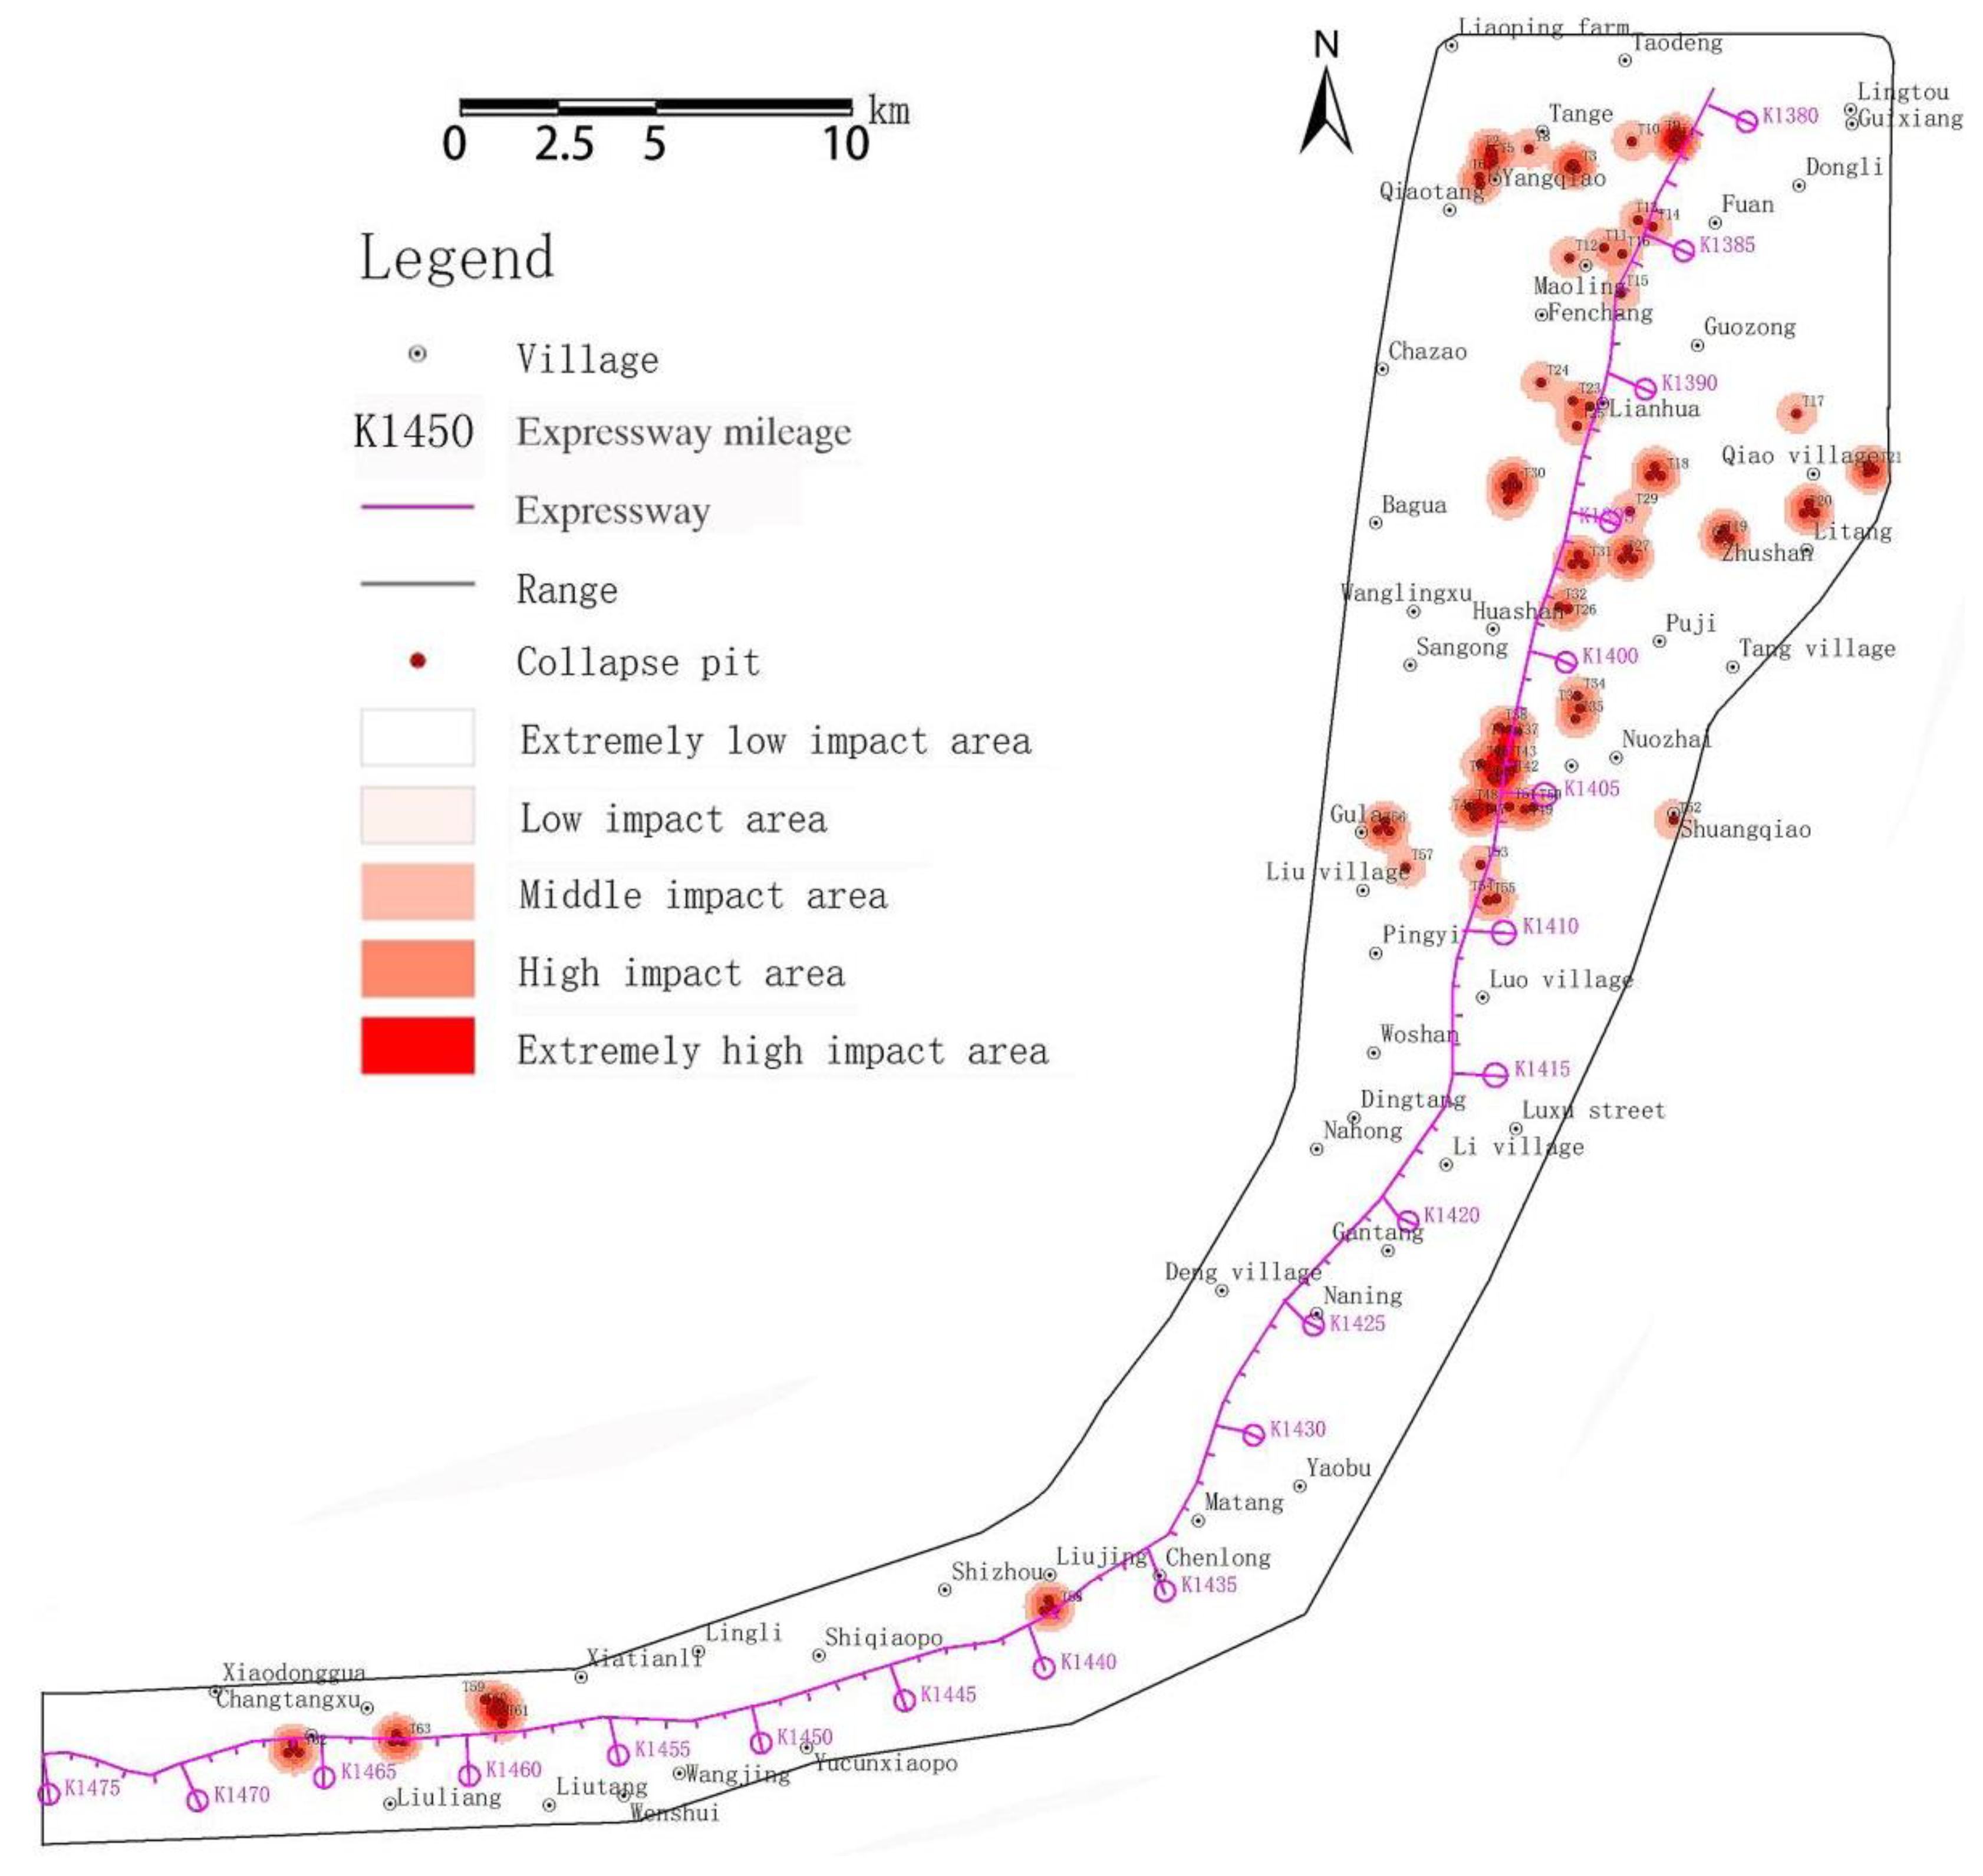
2.6. Karst Development
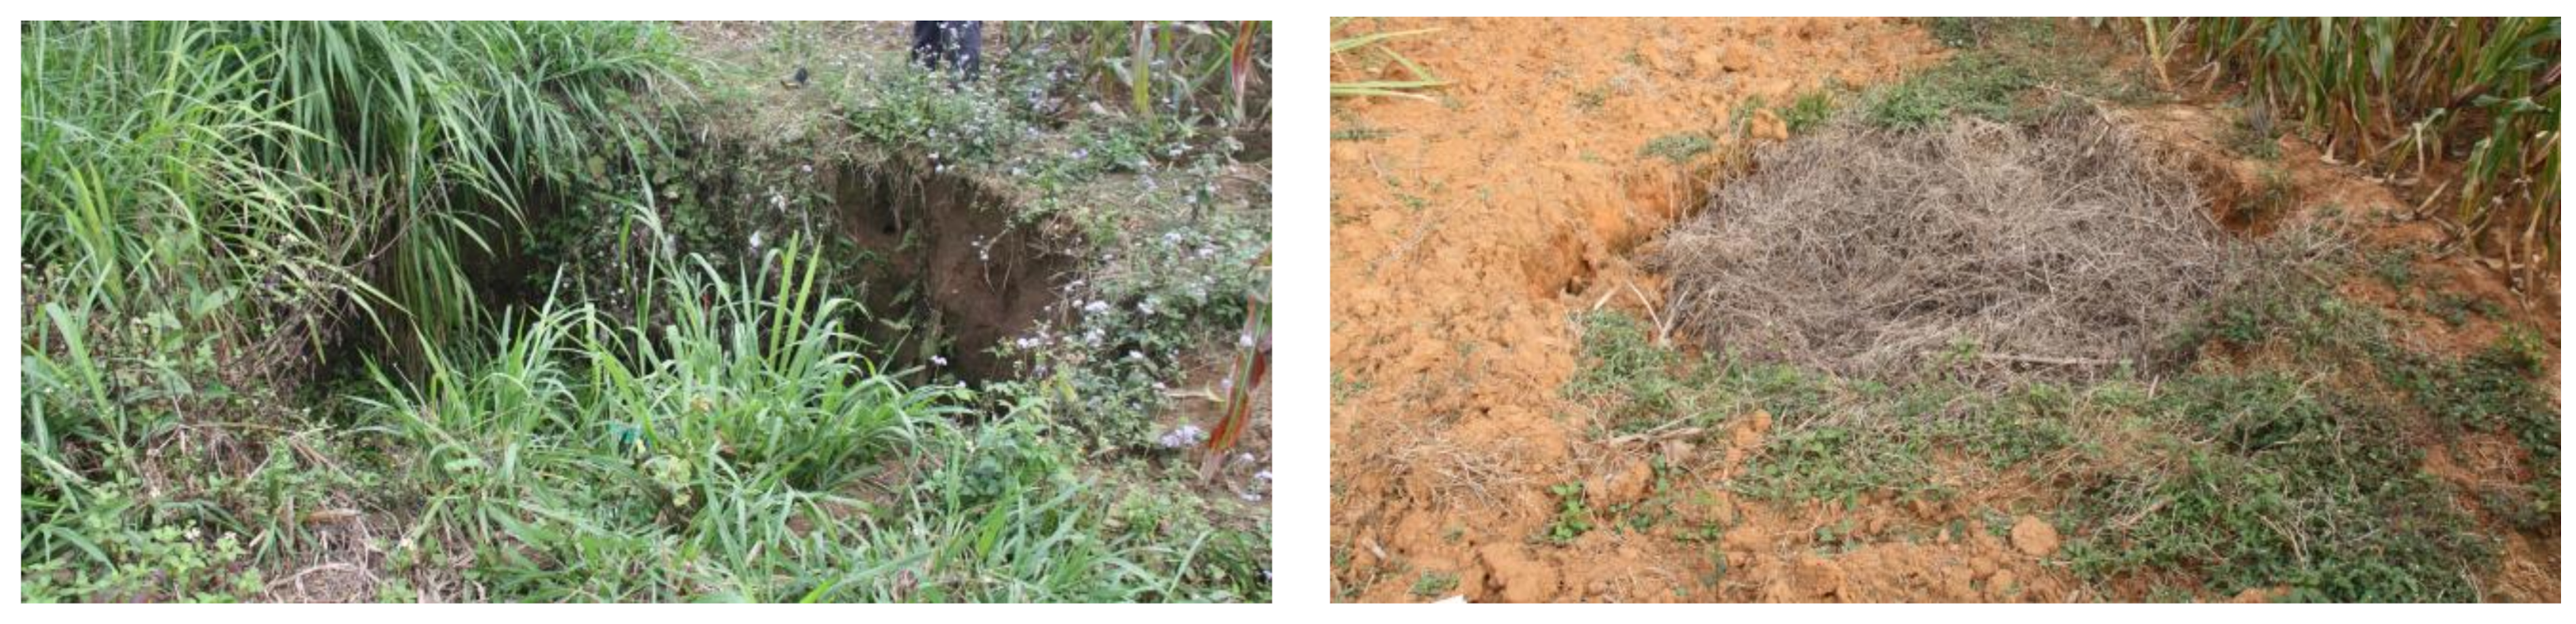
The bedrock stratum in the research area is Cambrian to Tertiary, mainly sedimentary rocks, of which the Devonian stratum is the most widely distributed. The length of the karst development section in the research area is 79.8 km, accounting for 86.18% of the total length. The bedrock stratum with the greatest influence on the line is the pure carbonate rock with strong karst development, mainly including the Upper Devonian Liujiang Group (D
3l), Middle Devonian Donggangling Group (D
2d), Middle Carboniferous Tai Po Group (C
2d), and Lower Carboniferous Datang Group (C
1d). the rock group has developed seven underground rivers. According to the field survey, there have been 45 natural collapses and 151 collapse pits. More than 90% of them are concentrated in the karst-developed section of k1380–k1410, mainly with soil collapse and no bedrock collapse. The thickness of the collapsed soil layer is about 10 m or less, the thickness of the soil layer is more than 20 m, and the scale of the collapse pits is larger, which seriously affects the engineering construction in the research area. The typical karst collapse of the study area is shown in
Figure 5.
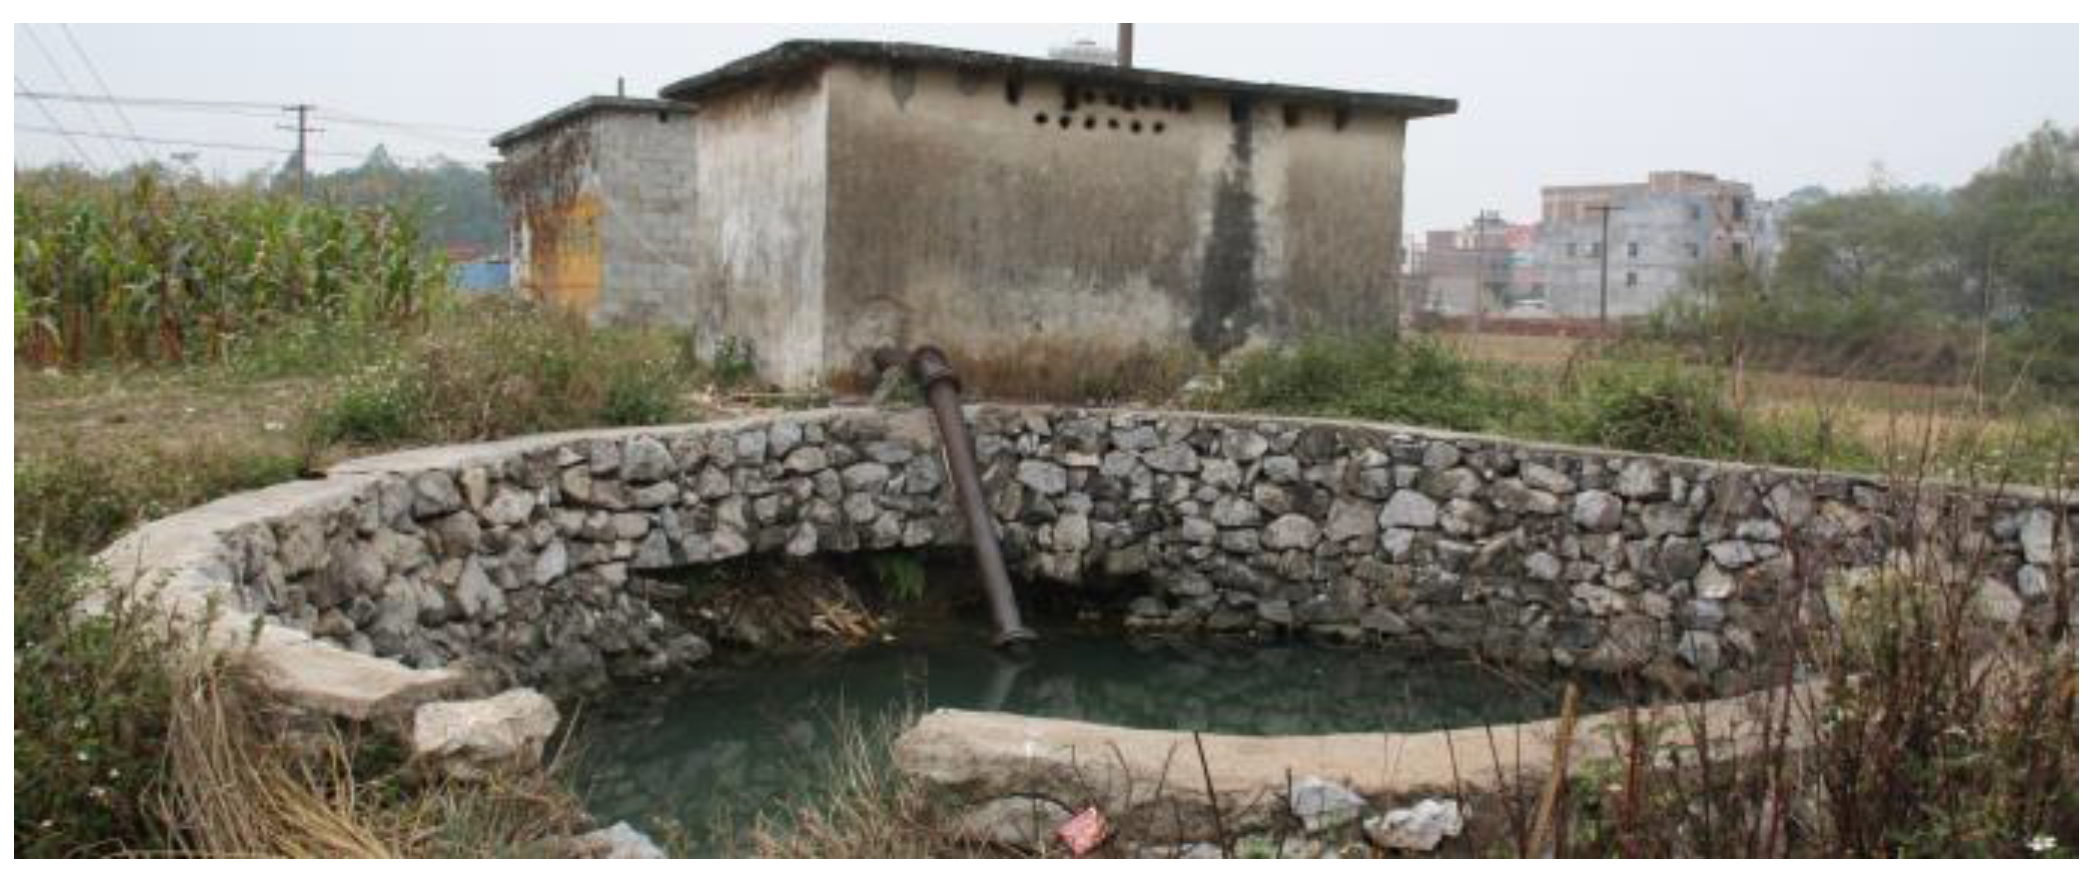
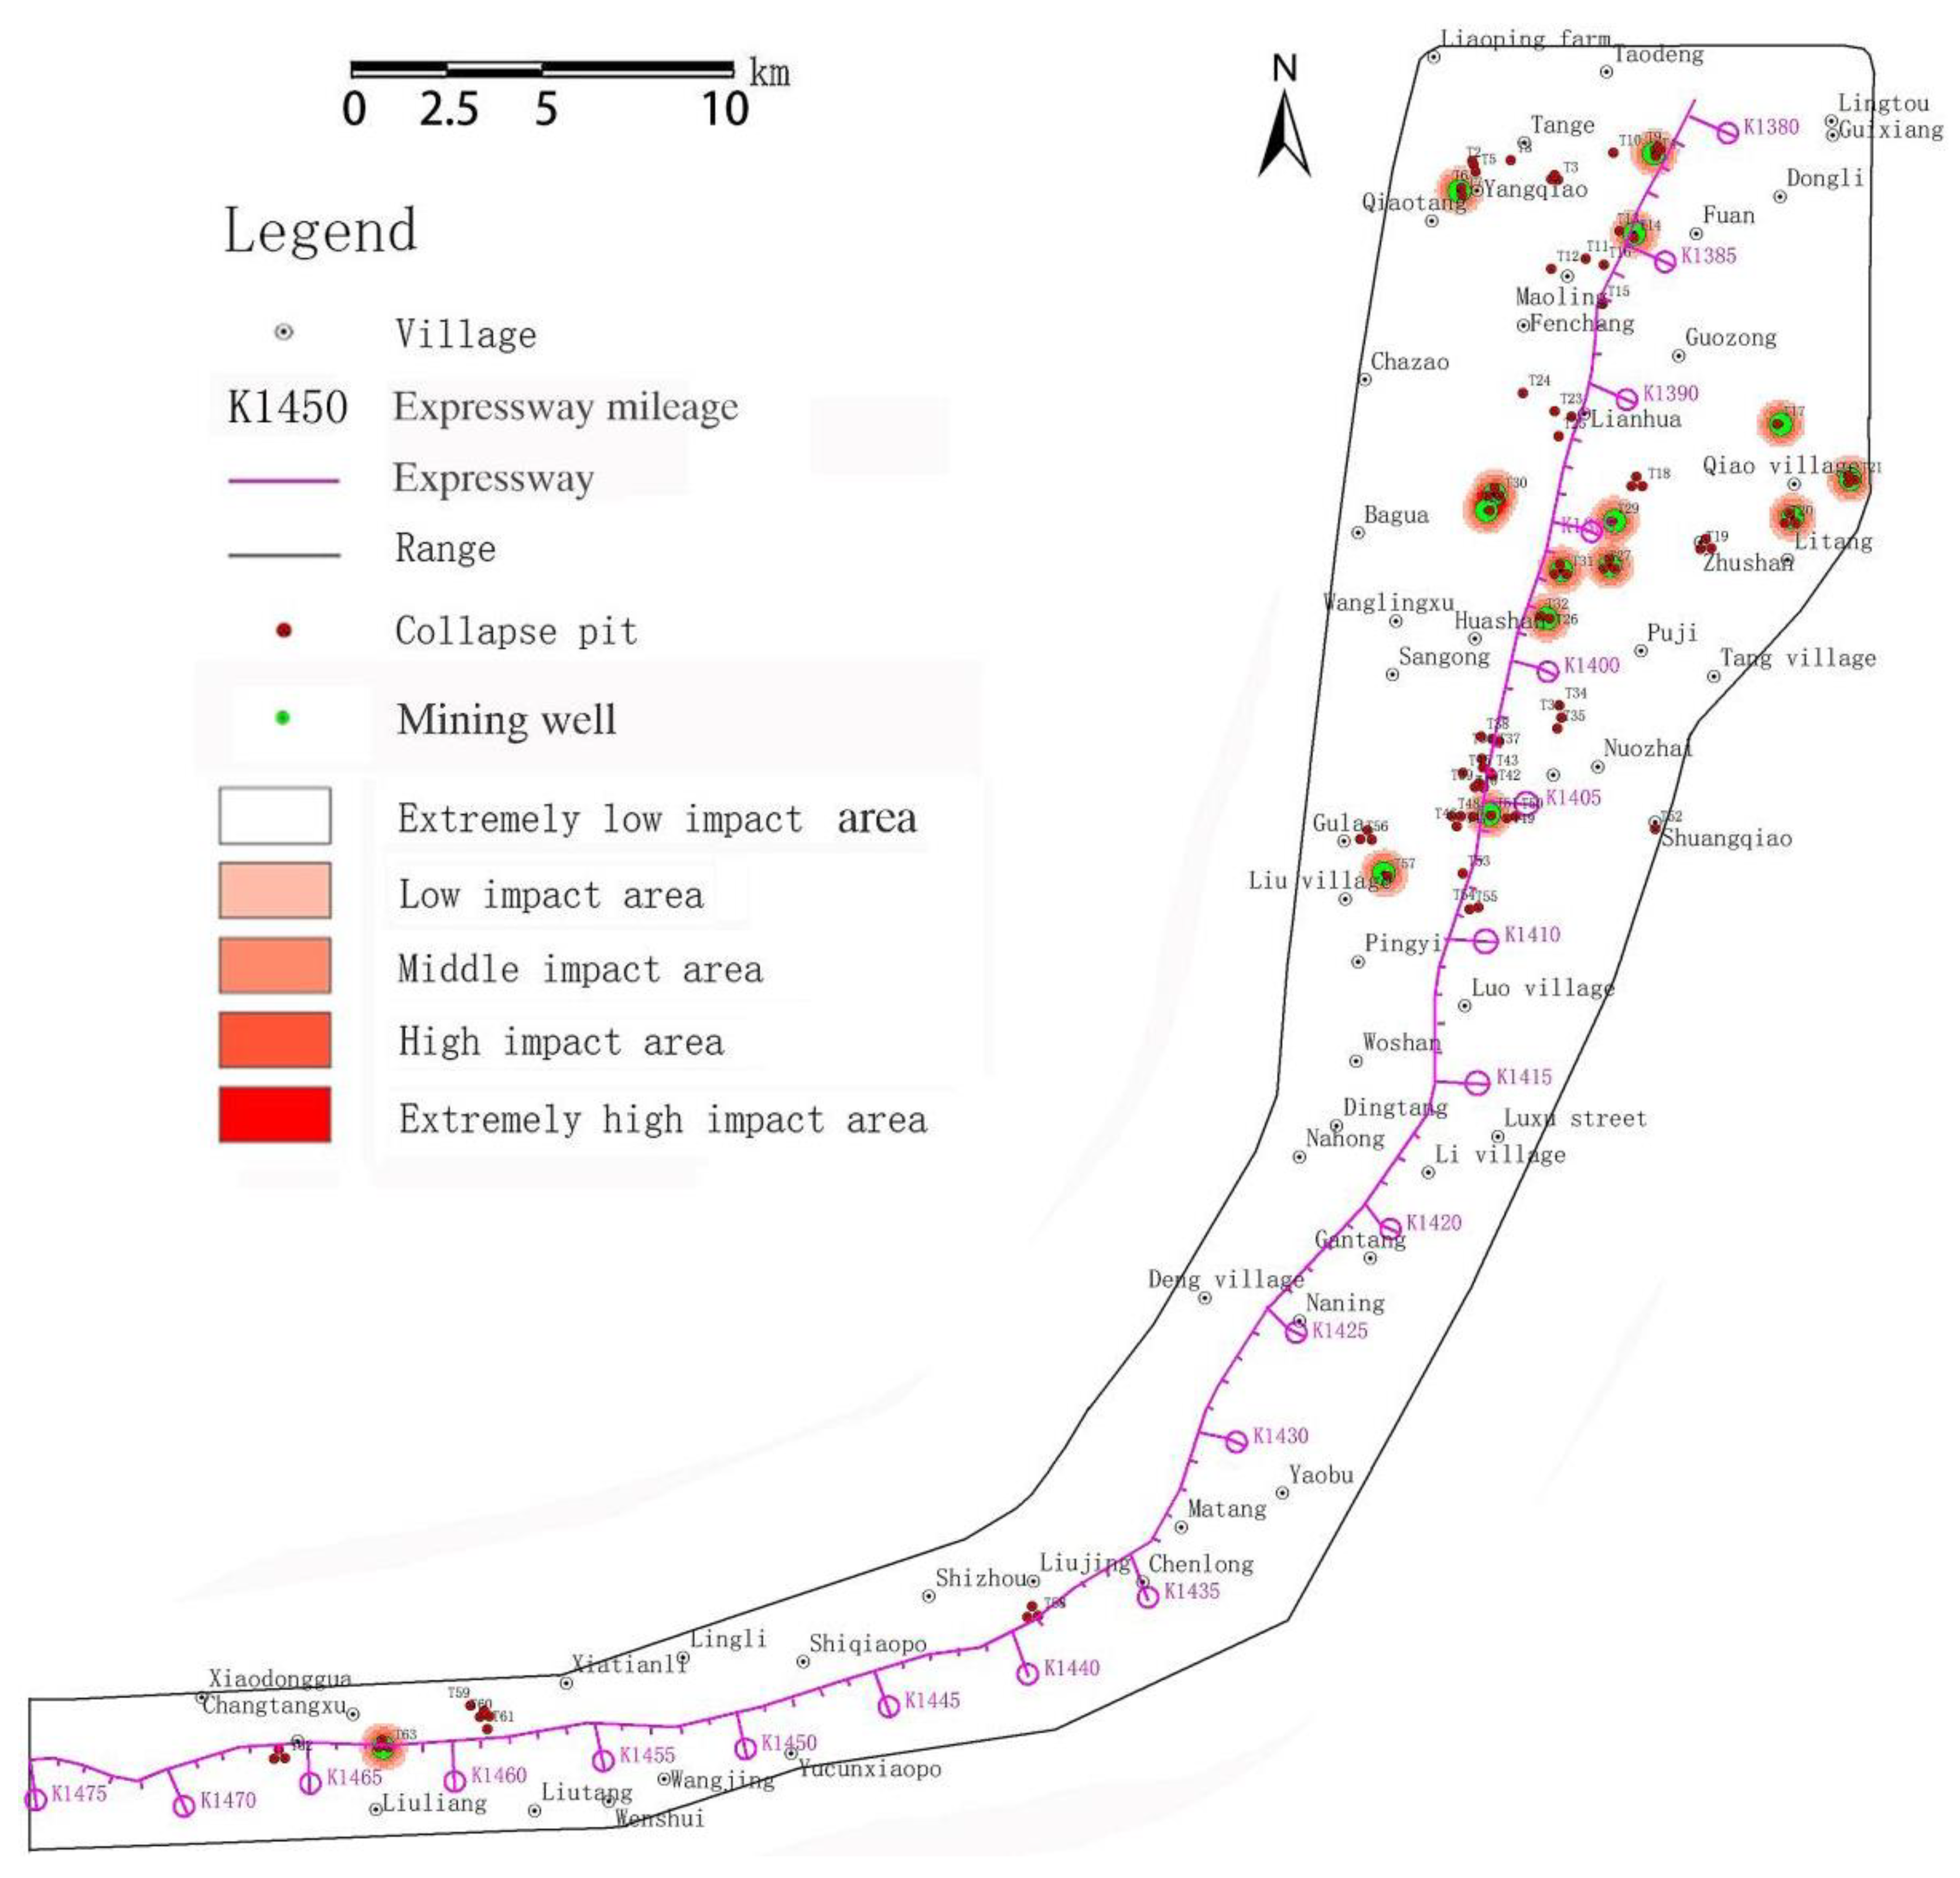
2.7. Human Activities
The domestic water source in the study area is mostly groundwater (mainly karst groundwater). In most cases, there is one well in a village. The amount of groundwater exploitation is not high, but a few villages and townships need a centralized water supply, and the amount of groundwater exploitation is high in these areas, which has caused the subsidence and cracking of many houses near the mining wells. Local farms in the area have been massively converted to vegetable cultivation and drilling wells to extract groundwater for irrigation, which has led to karst collapse in many places. High-frequency vibration during expressway construction and operation, ground piling, and blasting vibration can trigger collapse. For example, in 2012, during the construction of the Liunan Intercity High-Speed Railway, ground collapse was triggered in Ma’an Village due to punching pile construction. According to the on-site investigation, it was found that there were 18 artificially triggered (groundwater pumping- or construction-induced) collapses. Most of the collapses caused by groundwater pumping and draining occurred within 400 m around the mining well. Therefore, groundwater pumping or construction has had a greater impact on the formation and occurrence of karst collapses in the study area. A typical groundwater mining well in the study area is shown in
Figure 6.
3. Evaluation Index System Construction
3.1. Evaluation Methodology
Karst collapse has the characteristics of concealment and suddenness, and it is difficult to accurately predict its location and occurrence time before it happens. It is extremely harmful to the engineering construction and operation of the research area. Karst collapse is the most serious risk factor facing engineering construction in the research area; therefore, it is extremely important to carry out the prediction and evaluation of karst collapse susceptibility and screen out the potential karst collapse-susceptible areas for engineering construction. In the evaluation of karst collapse susceptibility, qualitative and quantitative evaluation methods are mainly used at present, but qualitative evaluation often cannot fully reflect the joint effect of multiple factors on karst collapse. Therefore, the evaluation of karst collapse susceptibility mostly adopts quantitative evaluation methods, such as the analytic hierarchy process, comprehensive fuzzy analysis, artificial neural network, and the logistic regression method.
The analytical hierarchy process involves decomposing the problem into different component factors according to the nature of the problem and the total goal to be achieved, and combining the factors at different levels according to their mutual influence relationship and affiliation to form a multi-level analysis structure model, and finally, simplifying the system analysis for the determination of the relative importance weights of the bottom level relative to the top level (total goal). The advantage is that when calculating the ranking weights of all elements of the same level for the highest level, the consistency ratio (CR) can be checked and corrected. If it is not satisfied, the judgment matrix can be readjusted until it is satisfied, which reduces the blindness and arbitrariness of relying entirely on experts’ scores and avoids the bias caused by other evaluation methods in which experts only assign values based on their experience. It is a combination of qualitative and quantitative decision analysis methods [
34,
35,
36].
Therefore, in this study, first, the mature analytic hierarchy process was used to decompose the complex evaluation target of karst collapse susceptibility into the criterion layer with the main karst collapse-inducing factors, and then to decompose the criterion layer into the index layer. On this basis, the single-level ranking (weight) and total ranking were calculated by the method of qualitative index quantification, and the evaluation model of karst collapse susceptibility was established. Finally, ArcGIS technology was used to superimpose the influence zoning map of each index according to the evaluation model, and the prediction evaluation map reflecting the susceptibility of karst collapse was obtained.
3.2. Evaluation System Construction
Due to the characteristics of sudden and unpredictable karst collapse, the evaluation of its susceptibility has been an important technical tool in the current comprehensive prevention and control of karst collapse. Although karst collapse is influenced by many factors, the occurrence of karst collapse cannot be separated from the three factors of rock, soil, and water [
37]. Based on the results of the geological survey of karst collapse in the research area, combined with the hydrological engineering geological conditions and the previous research results on karst collapse-inducing factors [
3,
4,
5,
6,
7,
8,
9,
10,
11,
12,
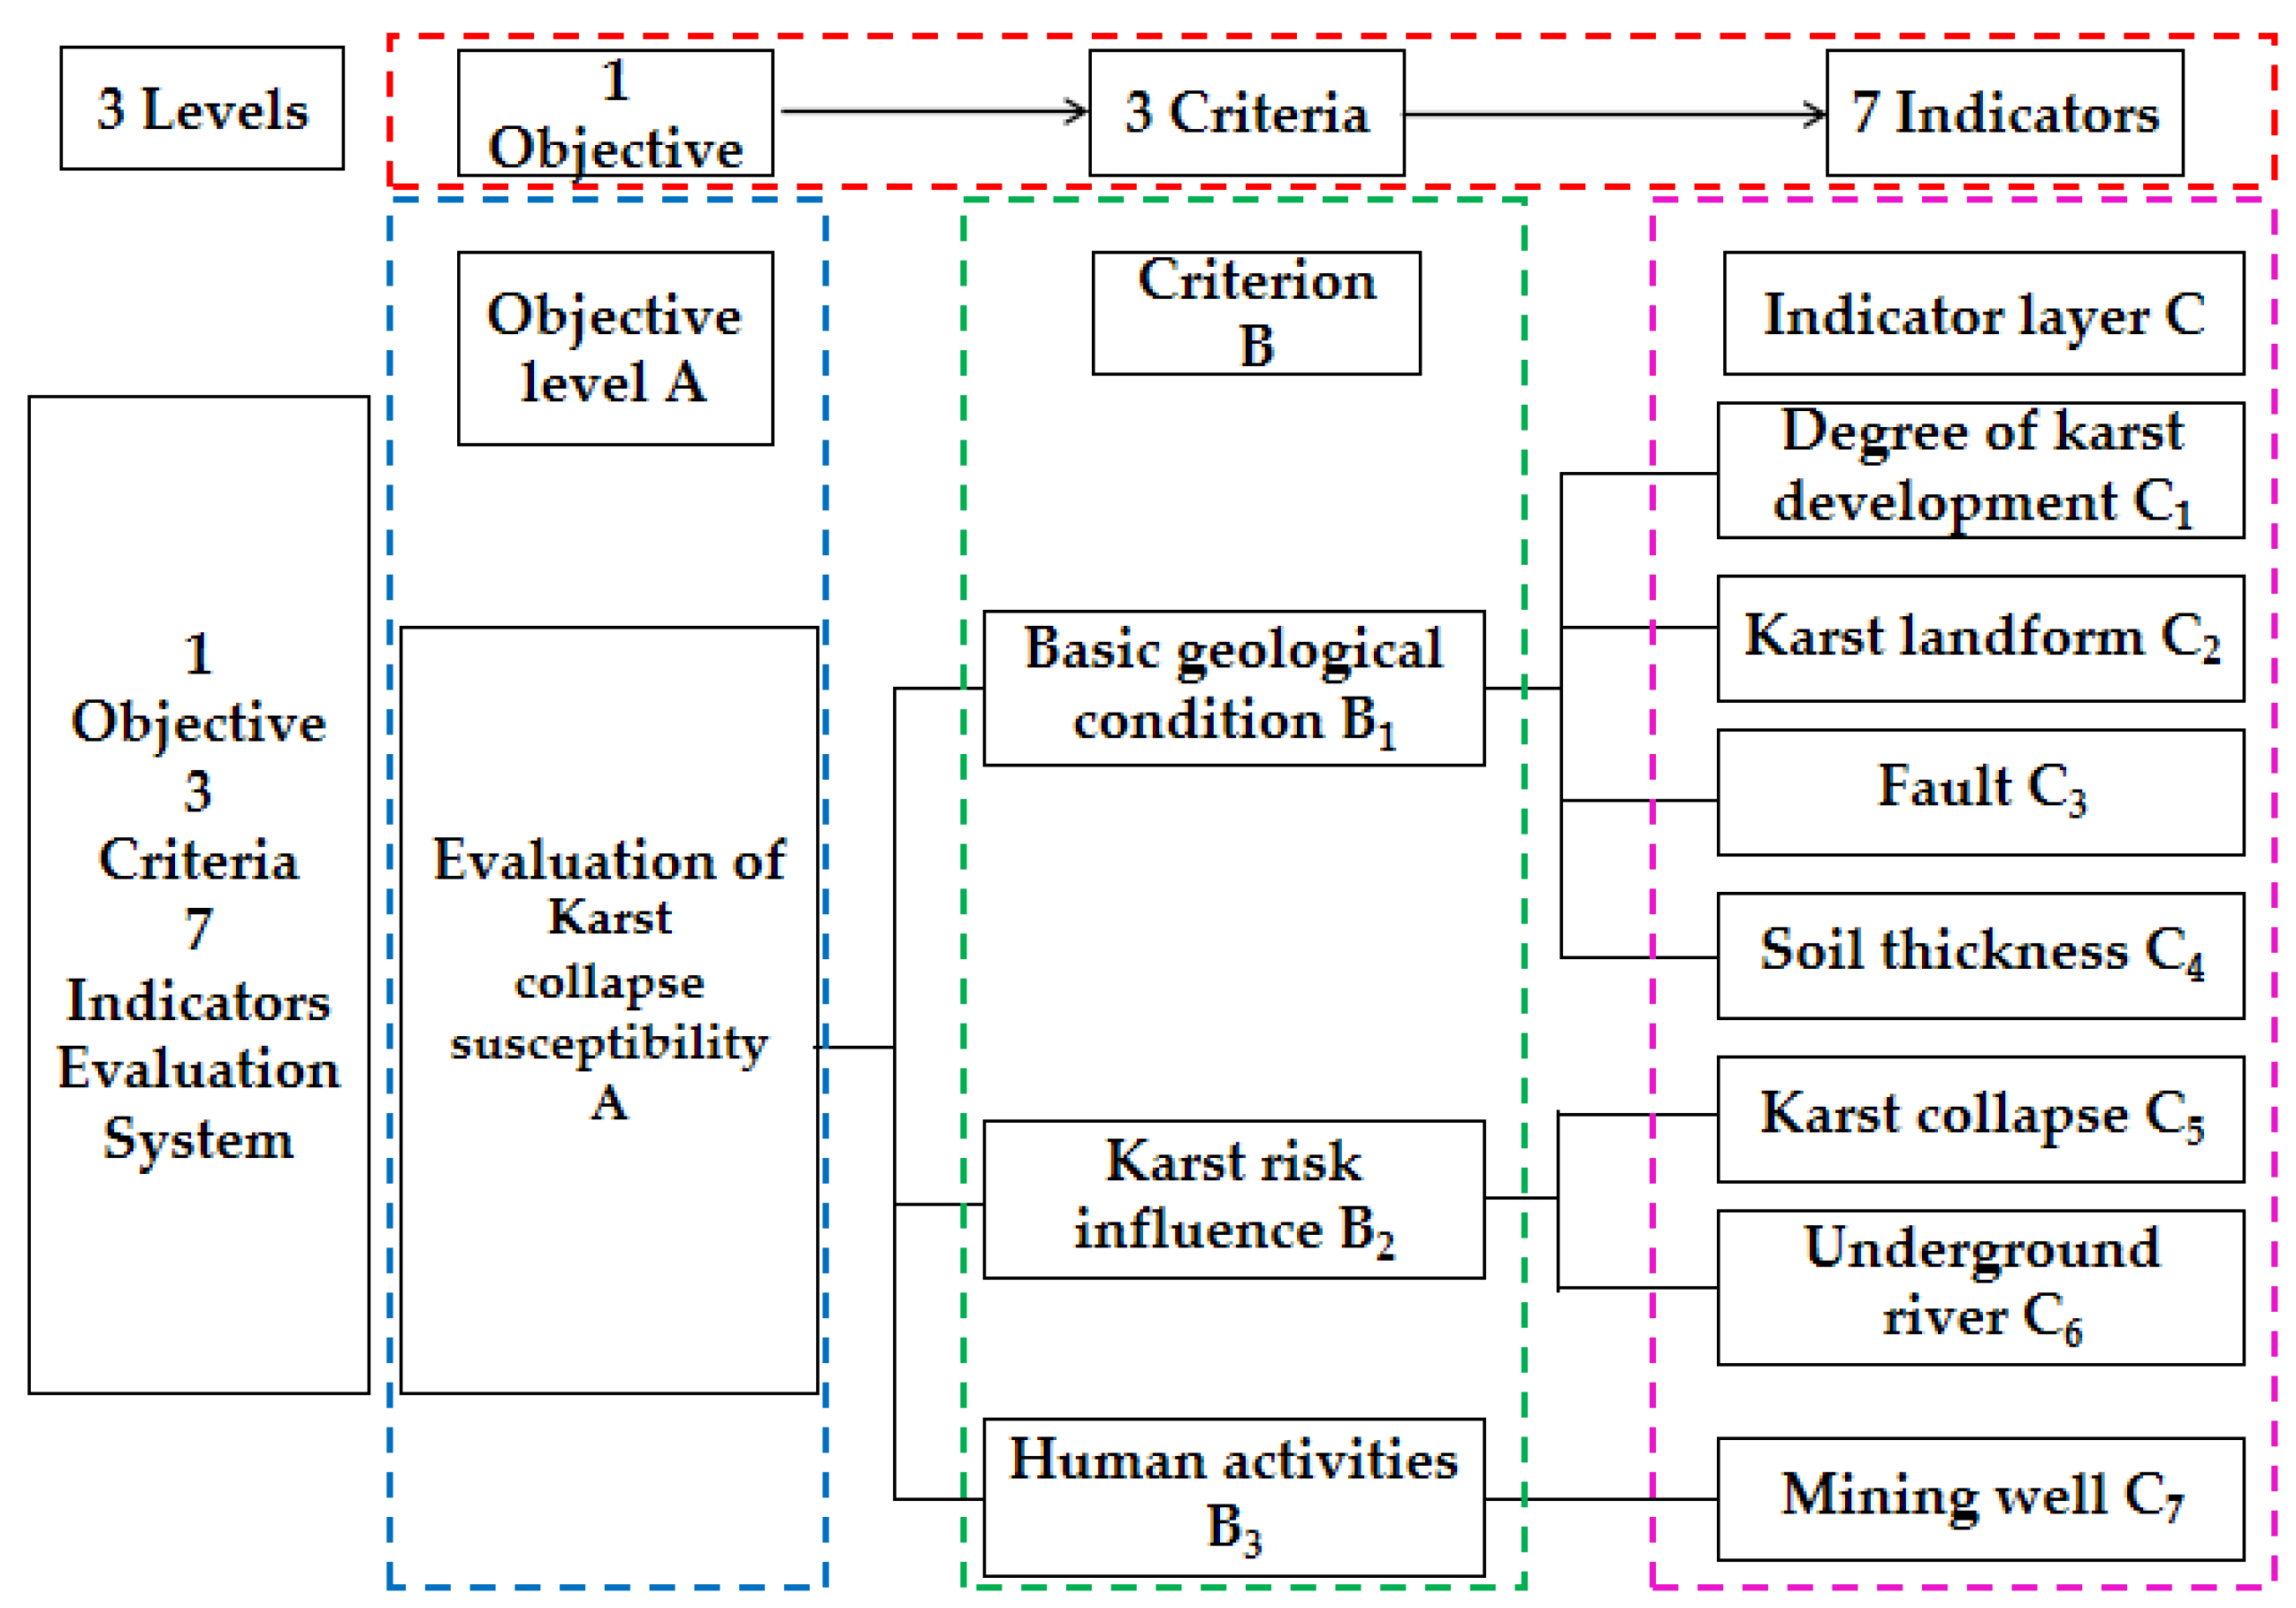
13], a hierarchical evaluation system of three levels, one objective, three criteria, and seven indicators was constructed by selecting three susceptible factors in a total of seven aspects [
38,
39,
40], as shown in
Figure 7. The evaluation of karst collapse susceptibility as the objective layer contains three criterion layers (basic geological conditions, karst risk influence, and human activities) and seven indicator layers (degree of karst development (H
karst), karst landform (H
landform), fault (H
fault), soil thickness (H
soil), karst collapse (H
collapse), underground river (H
groundriver), and mining well (H
well)).
3.3. Evaluation Model Construction
The evaluation model of the karst collapse susceptibility was constructed according to the principle of mathematical multi-factor fitting or prediction using a polynomial of one-dimensional based on the established karst collapse susceptibility = evaluation index system. A quantitative database of seven major indicators was established using the analytical hierarchy process to establish the weights of each indicator and classify each indicator according to its influence on karst collapse, giving normalized indicators. Using the ArcGIS spatial analysis tools, the indicator value of each evaluation factor was superimposed according to the weights. The evaluation model is as follows:
where
H is the susceptible evaluation result;
Xi is the weight of the influence factor of this layer determined by the analytical hierarchy process method (AHP);
Hi is the value of the impact factor of this layer. Each layer of impact factors can include multiple sub-level impact factors, and the upper-level impact factors are derived from the sub-level factors using a similar model.
4. Evaluation Model of the Karst Collapse Susceptibility
4.1. Quantification of Evaluation Index Assignment
According to the characteristics of the geological environment of the study area and the degree of influence of each index on karst collapse based on a questionnaire survey of experts, as well as referring to the method of assigning influence factors to karst collapse in similar projects, and combined with the previous research results on the inducing factors of karst collapse [
3,
4,
5,
6,
7,
8,
9,
10,
11,
12,
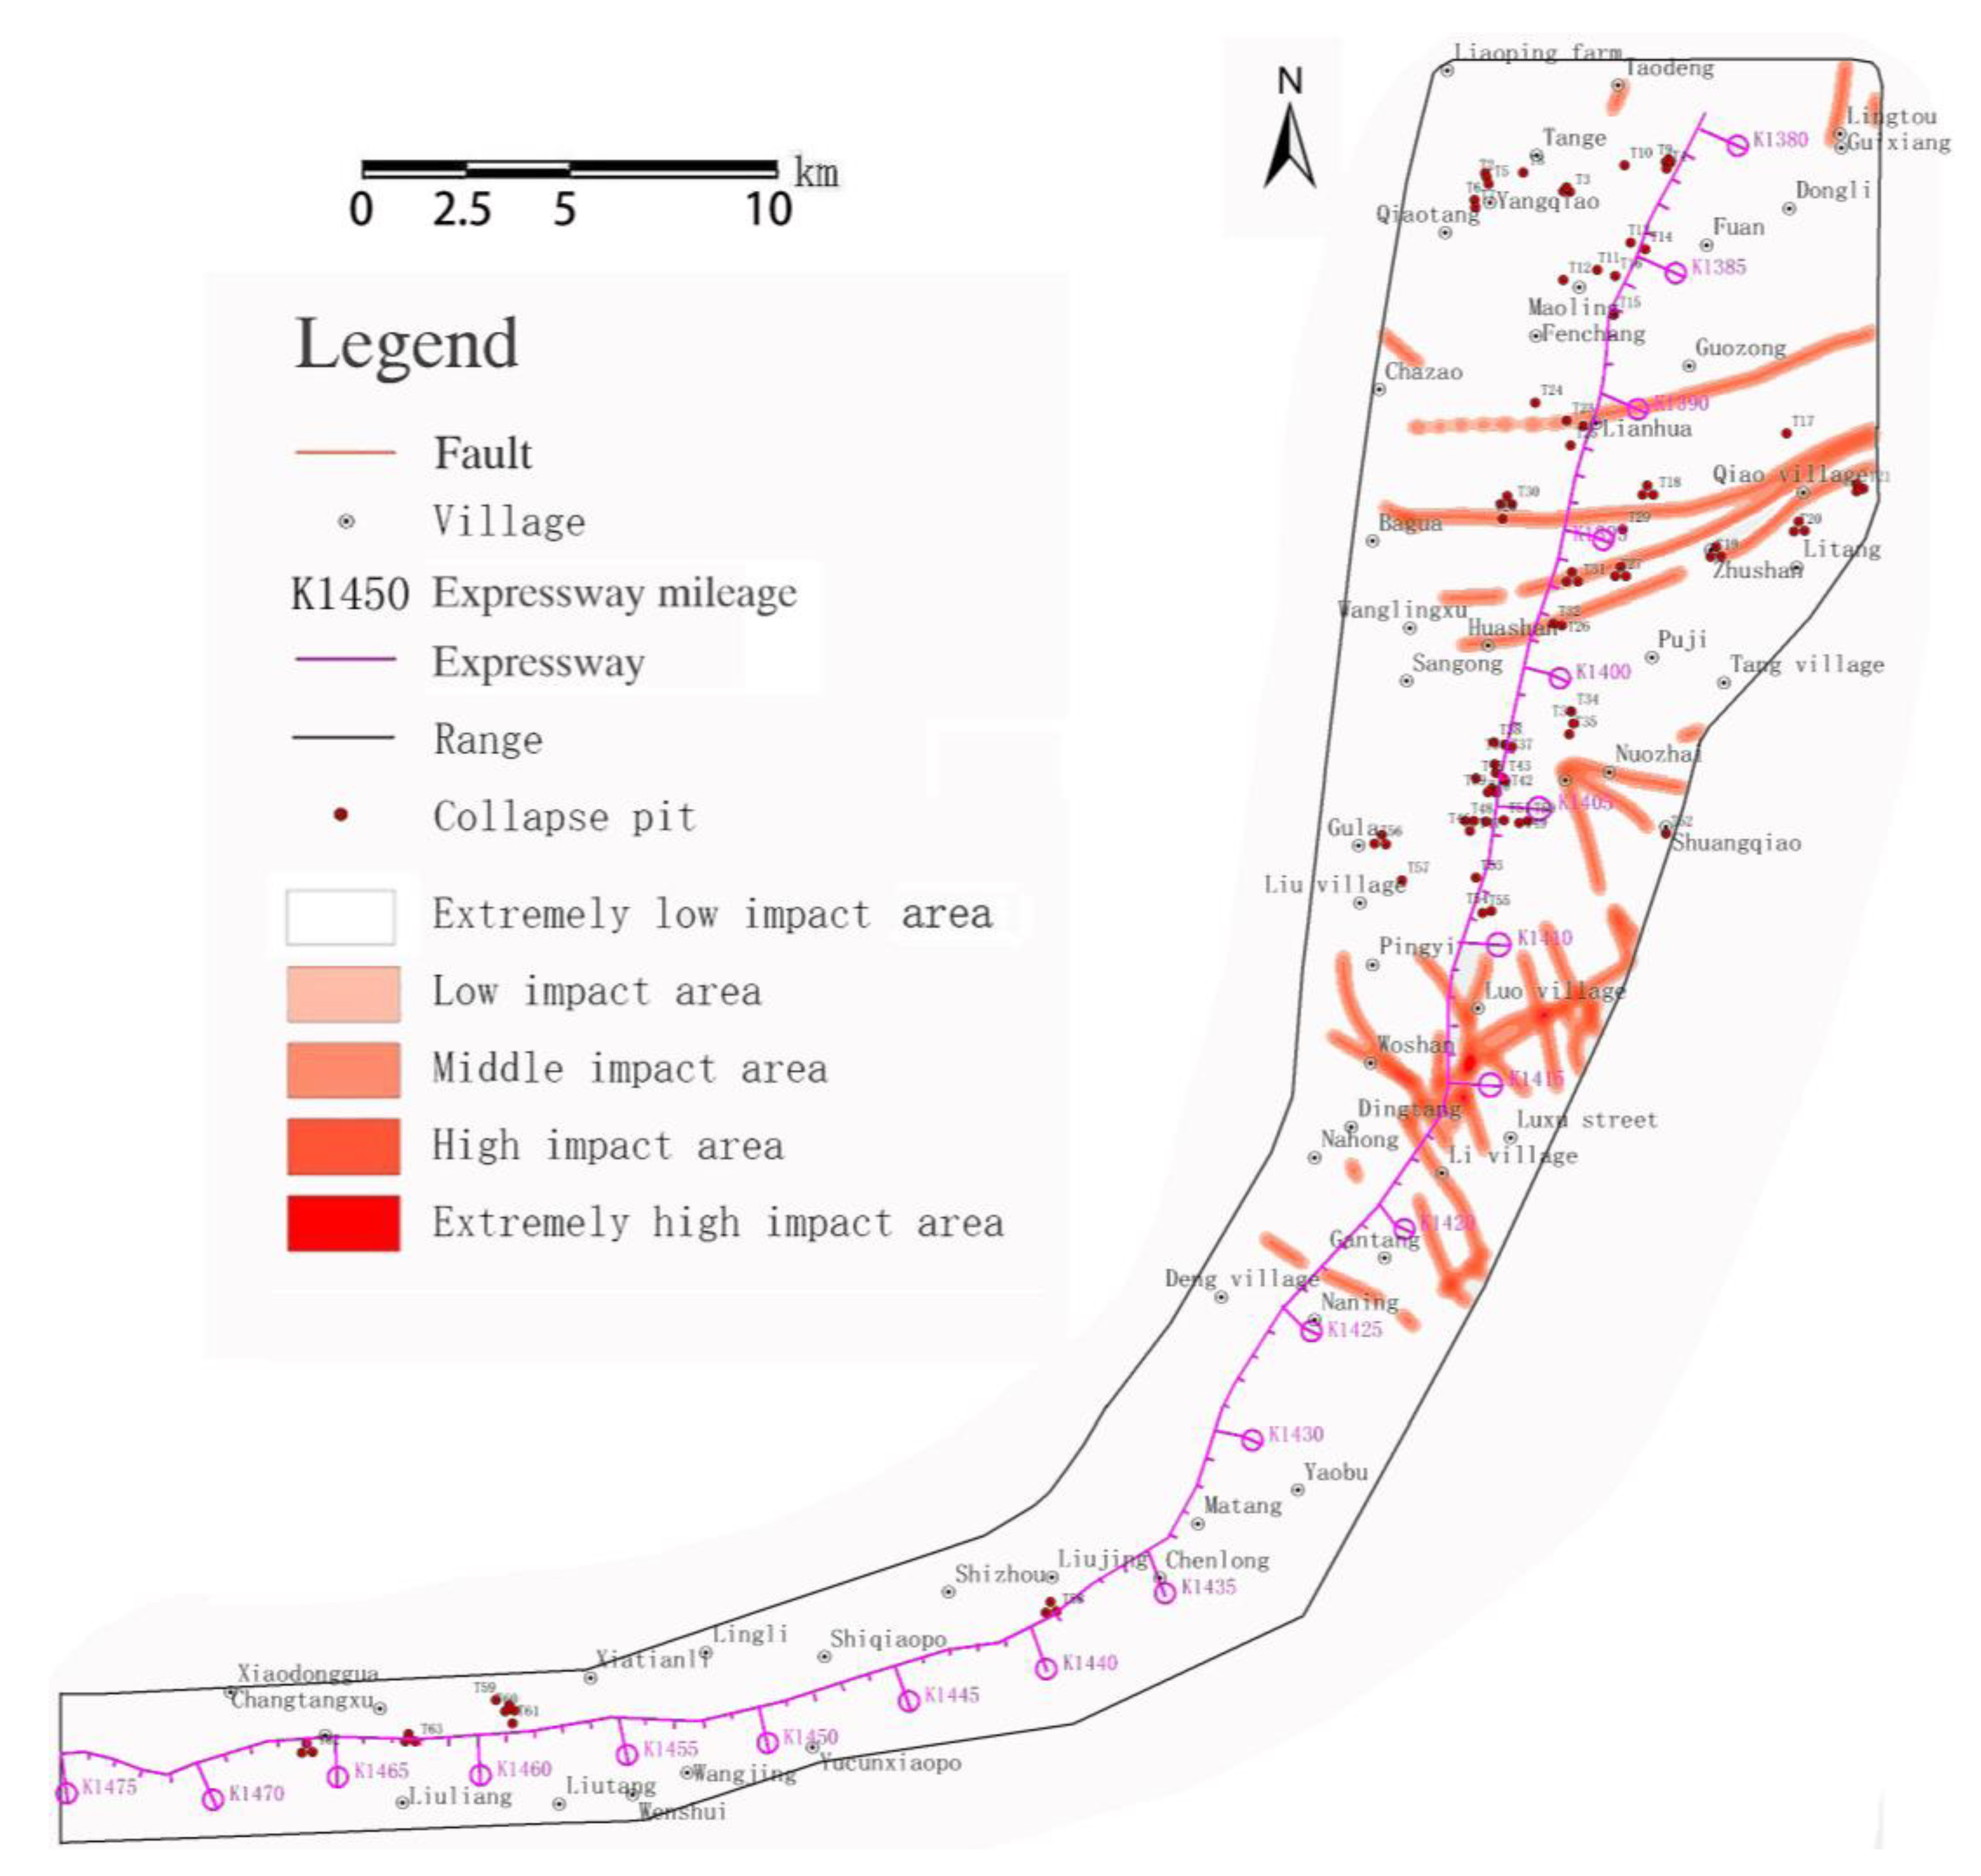
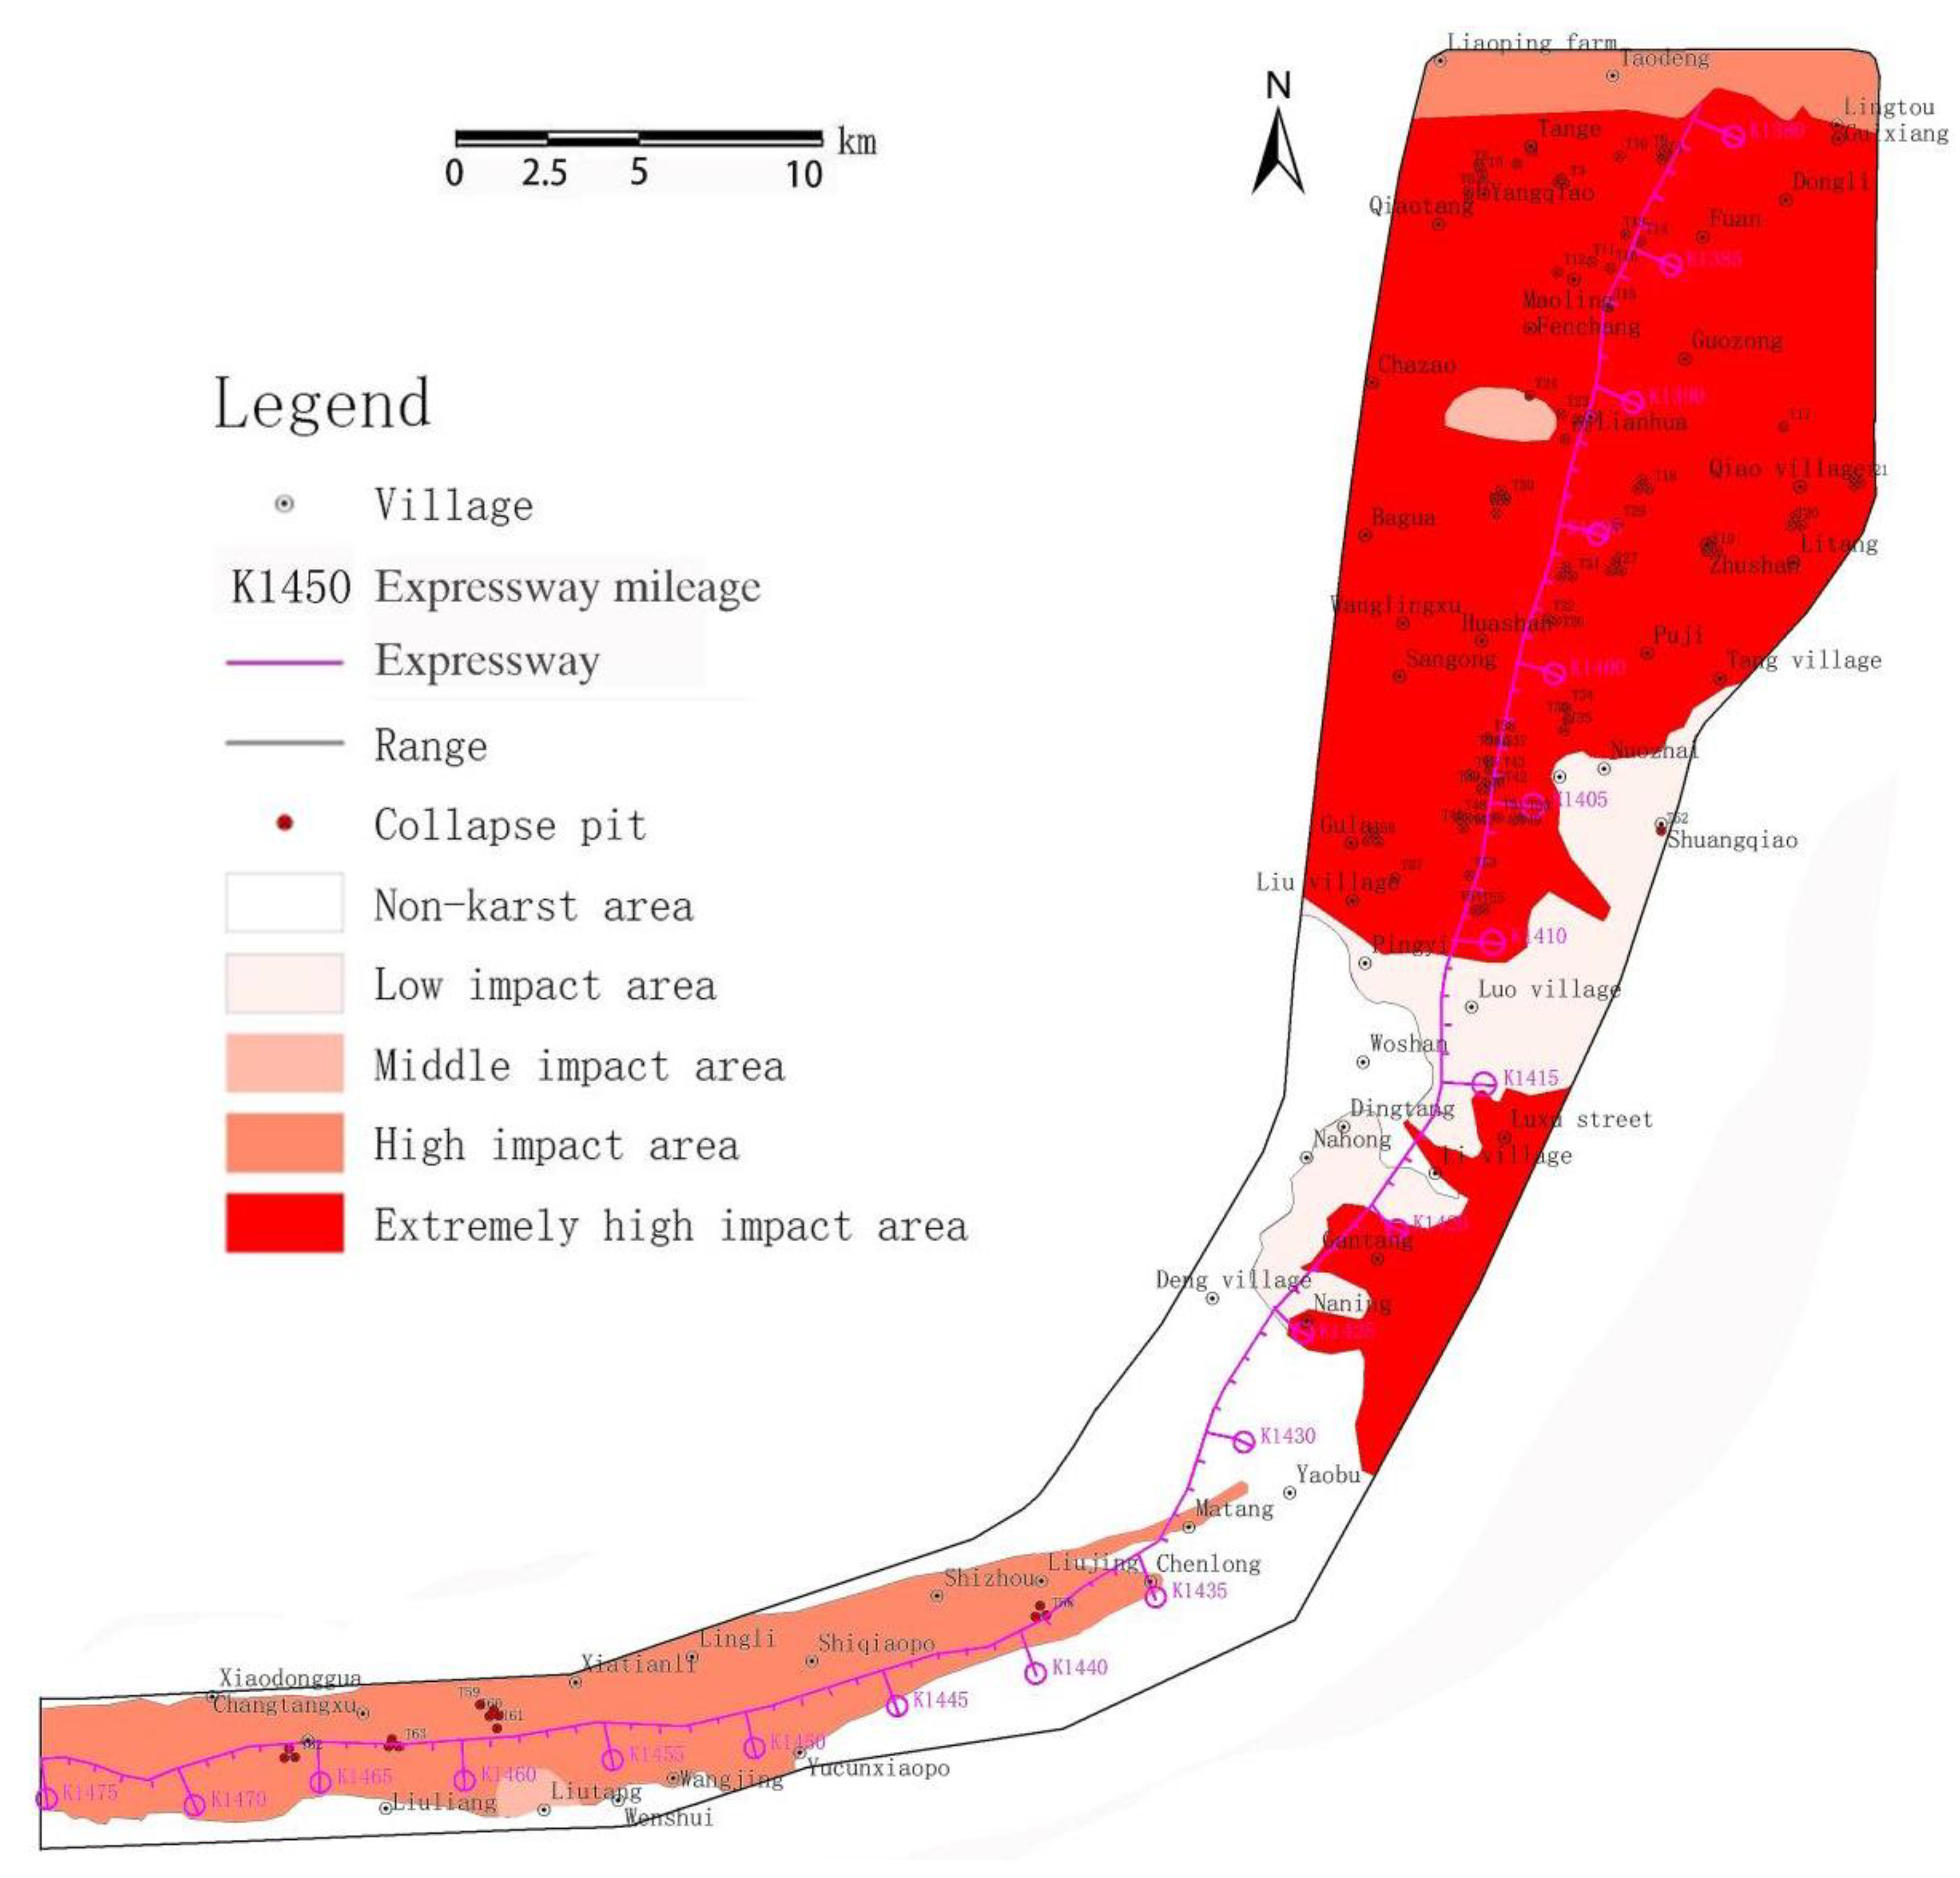
13] and the expert group’s review recommendations for this research, the quantitative indicators were finally determined, and the impact level of each impact factor was divided into five levels, namely extremely high impact, high impact, medium impact, low impact, and extremely low impact. The larger the score, the higher the degree of influence, and vice versa. On this basis, the zoning map of the degree of influence of each influence factor on karst collapse was derived, as detailed in
Table 3 and
Figure 8,
Figure 9,
Figure 10,
Figure 11,
Figure 12,
Figure 13 and
Figure 14.
4.2. Constructing the Judgment Matrix and Assigning Values
The method of constructing the judgment matrix is that each element with downward affiliation (called criterion) is the first element of the judgment matrix (located in the upper left corner), and each element affiliated to it is arranged in the first row and the first column in turn.
In analyzing the relationship between the factors of the evaluation target, a judgment matrix can be constructed according to the importance of the two factors in the hierarchical structure evaluation system. In order to ensure the reliability and accuracy of the criterion of importance between two factors, in this study, the evaluation of the importance of each factor was based on the previous research results on karst collapse-inducing factors [
3,
4,
5,
6,
7,
8,
9,
10,
11,
12,
13] and the expert group’s review recommendations for this research. Then, the final judgment matrix was obtained by synthesizing the judgment matrix independently constructed by each expert. The construction judgment matrix was constructed according to a nine-level scale, and the specific results are listed in
Table 3. In order to eliminate the influence of prejudice caused by experts participating in the determination of weighting factors, the judgment results of each expert can be judged by the consistency of the test results of the judgment matrix. In addition, the unreasonable judgment results of experts were eliminated, which reduced the blindness and randomness of relying solely on expert scores. This avoids the deviation caused by experts only assigning values based on experience, reduces the influence of human factors, and ensures the reliability of the AHP method.
According to the importance criterion between the two factors (
Table 4), the susceptible factors were assigned and combined with the karst collapse hierarchy in
Table 3. The judgment matrices
KA-Bi and
KBi-Ci were established for the association between the different layers of objective layer
A and criterion layer
Bi, and criterion layer
Bi and indicator layer
Ci. For example, if the ratio of the importance of criterion layer
B1 to indicator layer
C3 is 3, then the ratio of the importance of indicator layer
C3 to criterion layer
B1 is 1/3; if the ratio of the importance of criterion layer
B1 to indicator layer
C2 is 2, then the ratio of the importance of indicator layer C
2 to criterion layer
B1 is 1/2. Based on this approach, the matrices were constructed, and Equations (2)–(4) are the correlation judgment matrices
KA-Bi,
KB1-Ci, and
KB2-Ci for objective layer
A–criterion layer
Bi, criterion layer
B1–criterion layer
Ci, and criterion layer
B2–indicator layer
Ci, respectively.
4.3. Hierarchical Single Ranking and Validation
Taking the criterion layer B1–indicator layer Ci judgment matrix (3) as an example, the weight of indicator layer Ci in criterion layer B1 was calculated. The square root method was used for the hierarchical analysis to calculate the following:
(1) Calculate the product of each element of each row of the judgment matrix, the , same argument ,,;
(2) Calculate the nth power root of (n = 4),, same argument ,, ;
(3) Normalized to , , same argument ,,;
So, is the desired eigenvector;
(4) Calculate the maximum characteristic root of the judgment matrix
,
where (KW)
1 = 1 × 0.4965 + 2 × 0.2668 + 3 × 0.1540 + 6 × 0.0827 = 1.9885, and (KW)
2, (KW)
3, and (KW)
4 are calculated as 1.073, 0.6184, and 0.3314, respectively.
(5) In order to test whether the qualitative judgment of the constructed judgment matrix logically meets the requirement of transmissibility, it is necessary to conduct a consistency test, and the consistency index
CR is used as the criterion to measure the consistency of the judgment matrix. The judgment matrix can be considered to have satisfactory consistency when
CR < 0.10; otherwise, it is necessary to adjust the judgment matrix;
,
, where
RI is the average random consistency index, and the
RI values of its judgment matrix are shown in
Table 5. When
n = 4,
RI = 0.9; since
CR < 0.1, the consistency satisfies the requirement.
Similarly, the weights of all evaluation factors can be calculated, as shown in
Table 6.
4.4. Karst Collapse Susceptibility Evaluation Model
From the above calculations, A = [0.3285, 0.1770, 0.1023, 0.0548, 0.1494, 0.0830, 0.1050], and the karst collapse susceptibility prediction and evaluation model can be established as follows:
5. Analysis of Evaluation Results
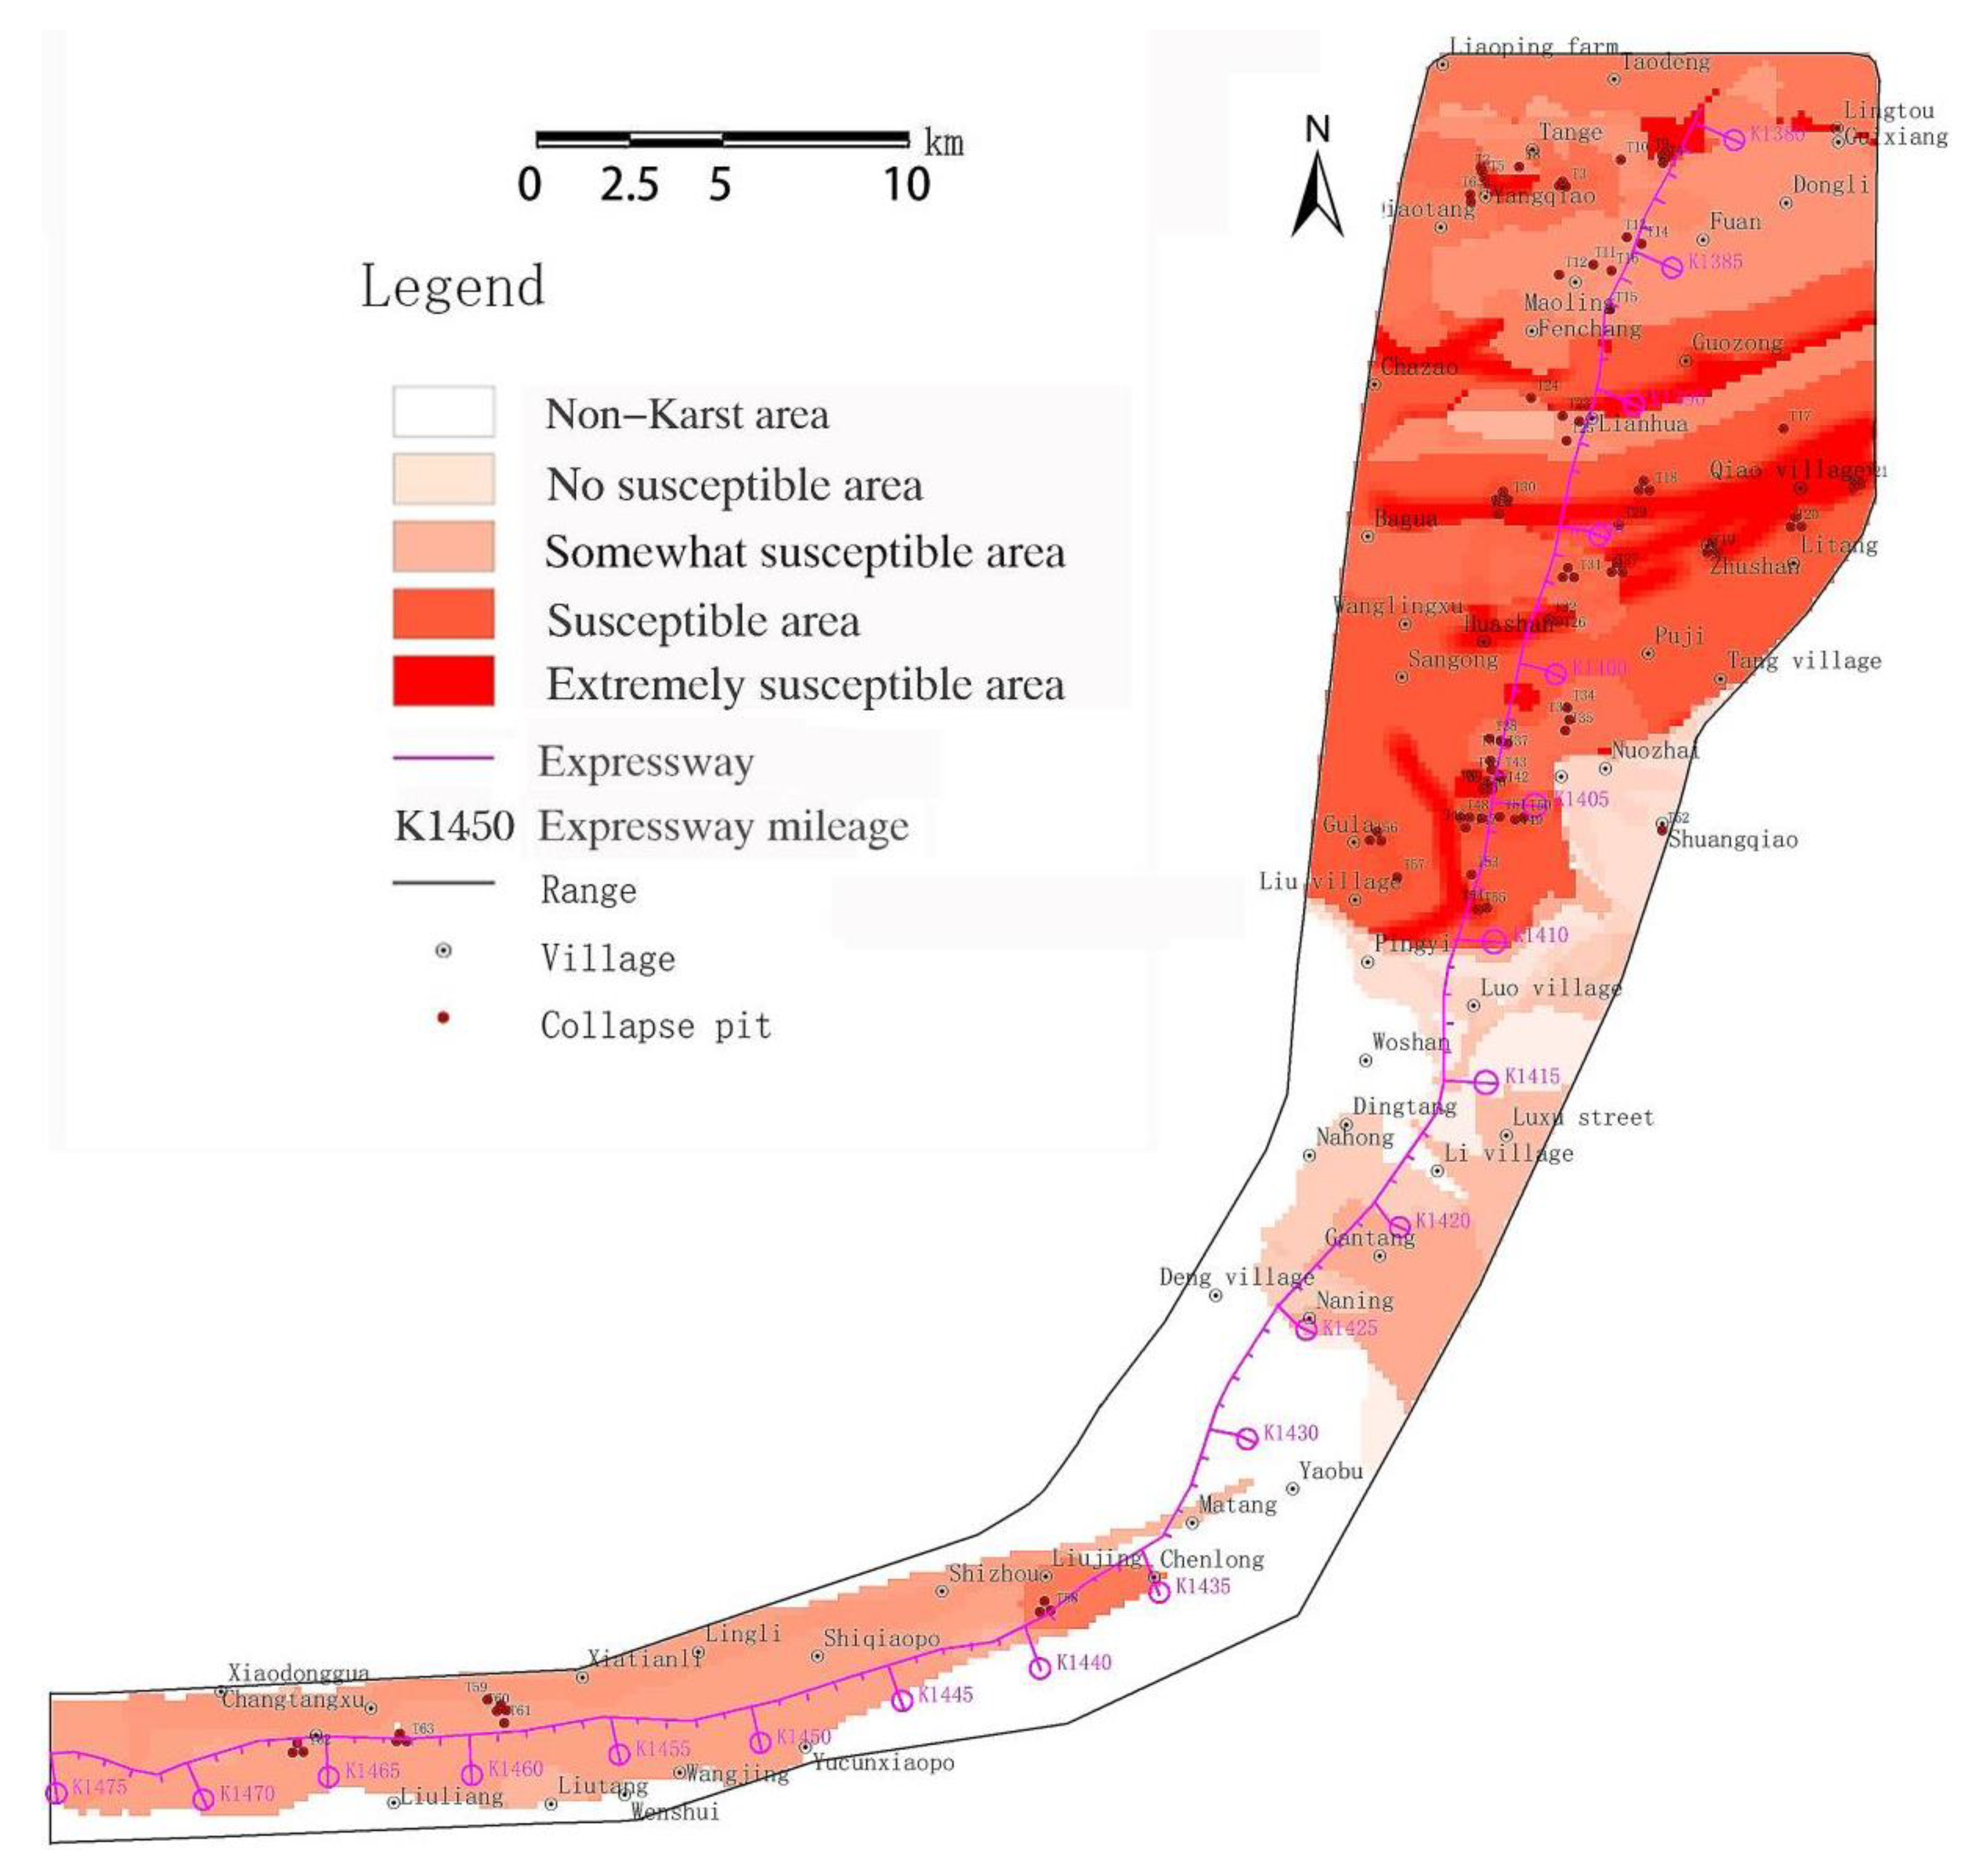
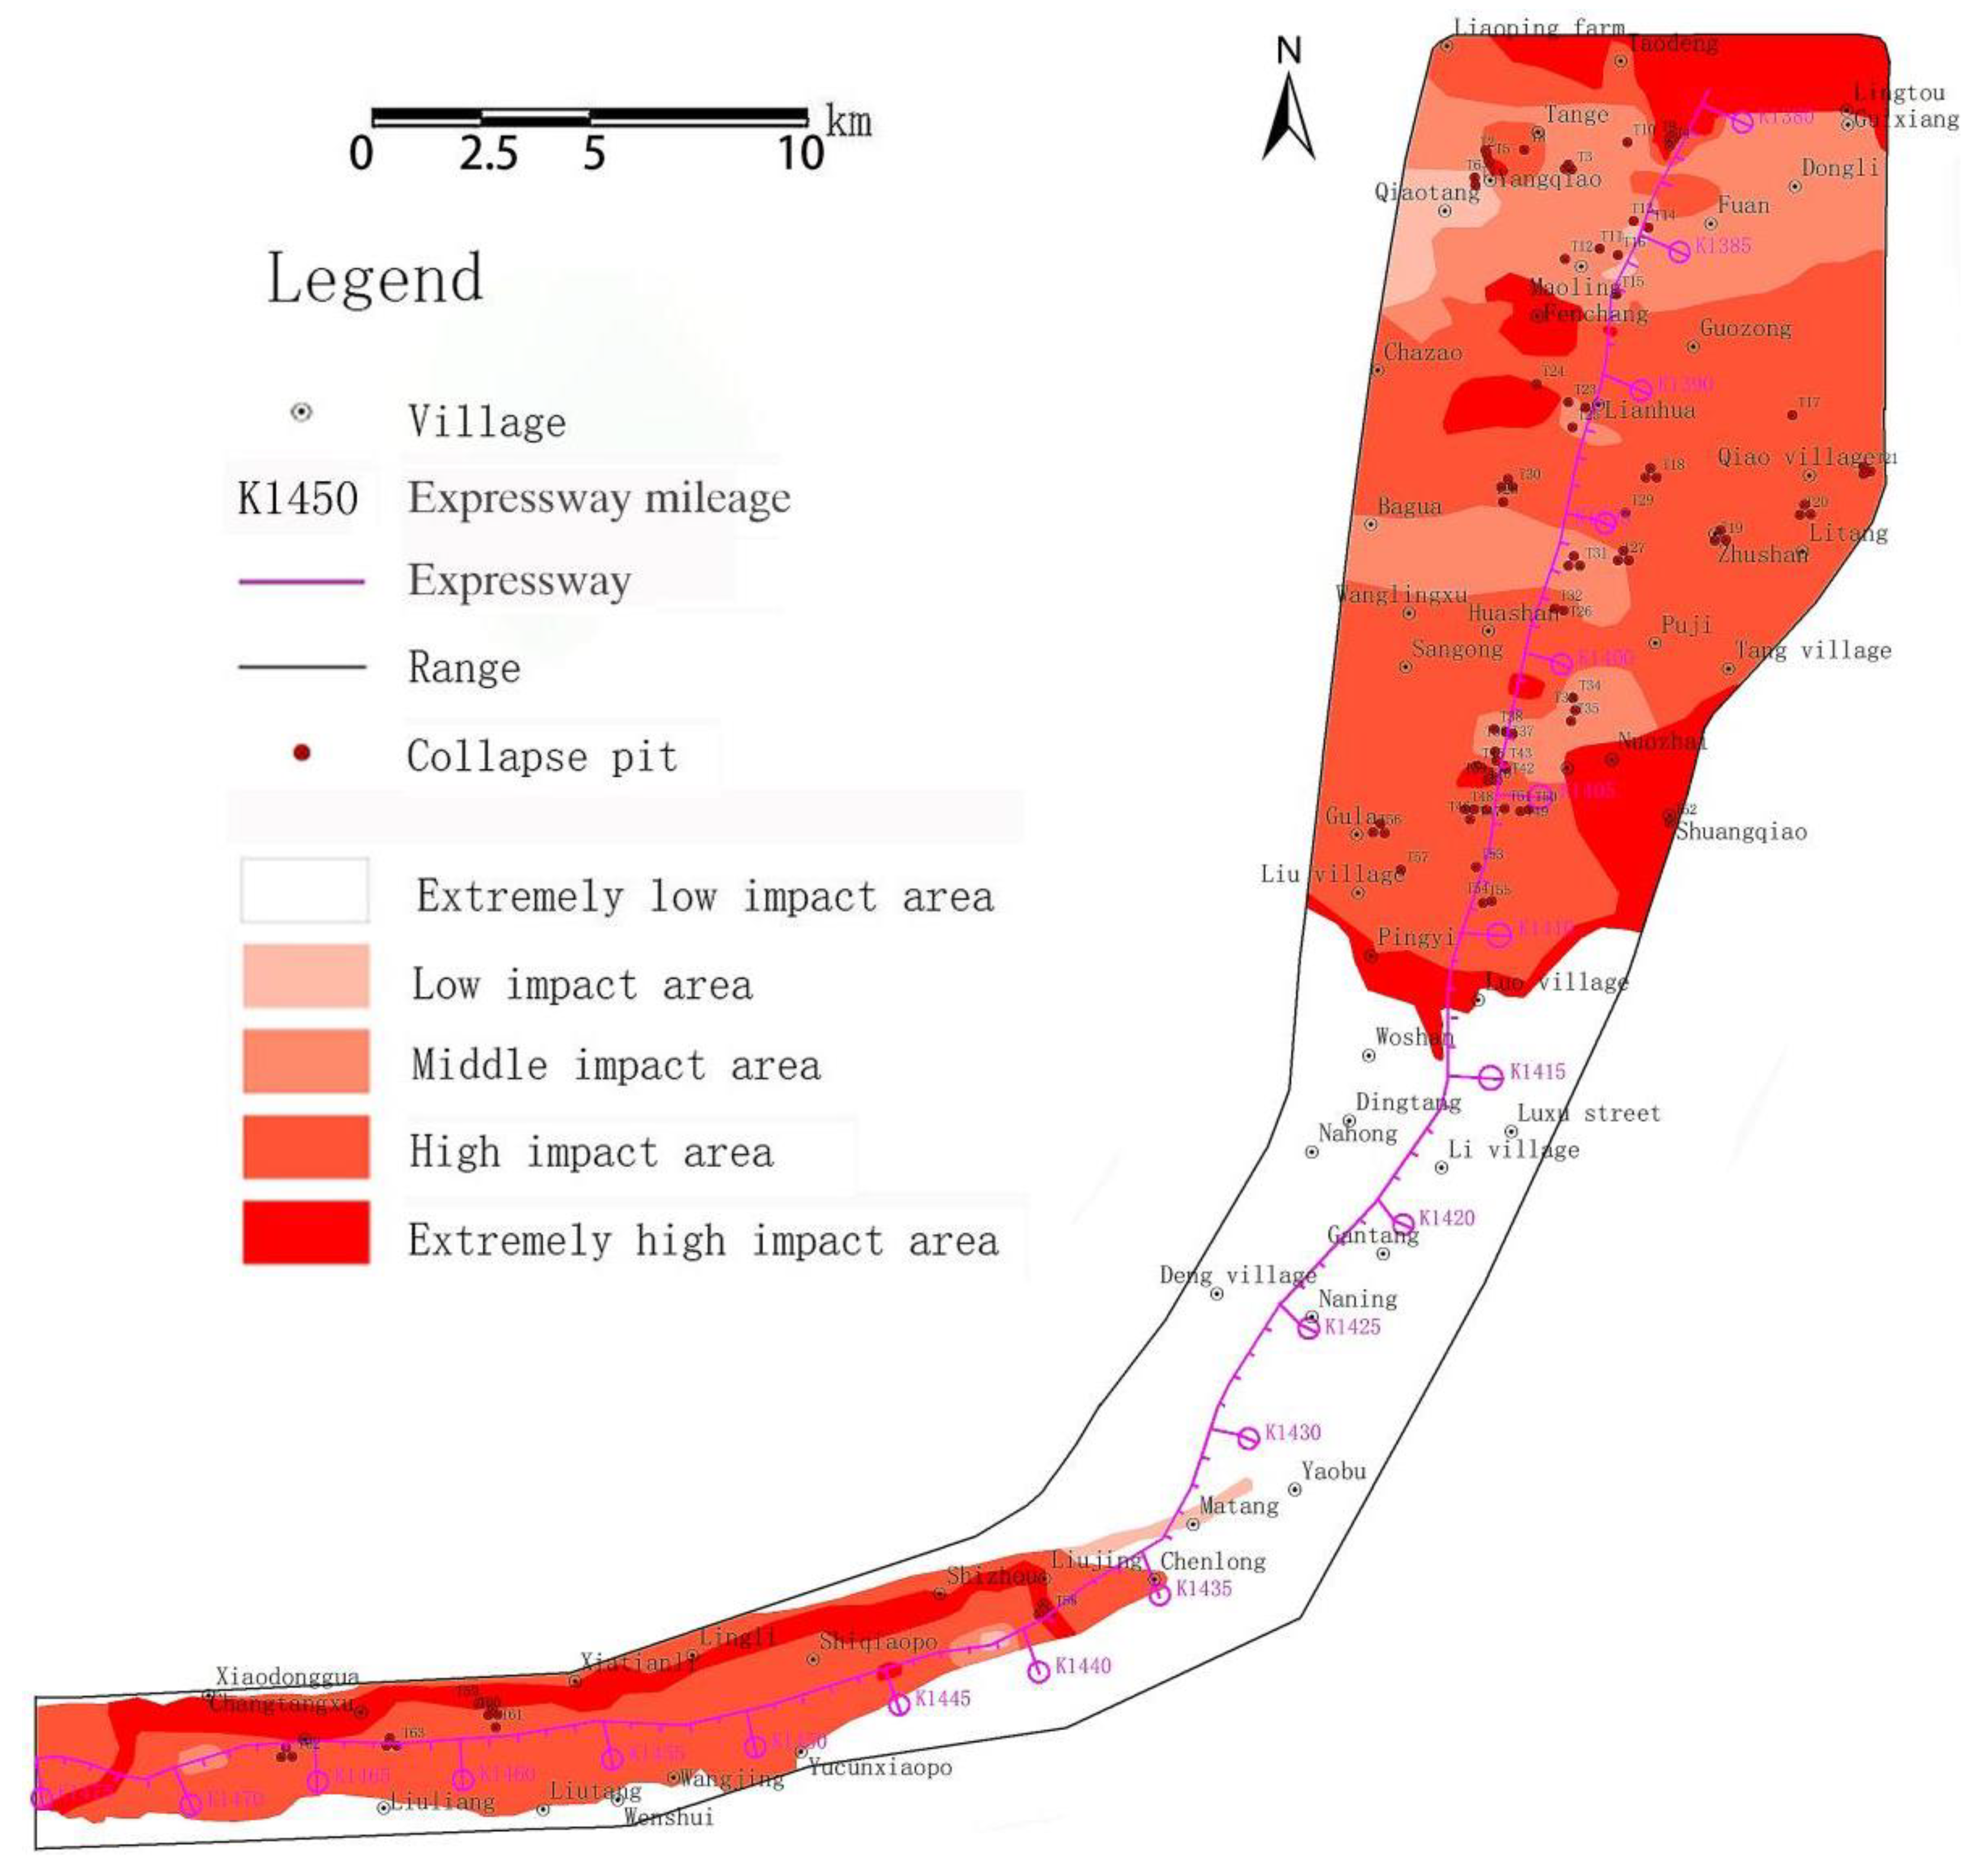
By using the spatial analysis function of ArcGIS, the zoning map of the influence of the seven assigned factors of the degree of karst collapse was superimposed according to the AHP prediction and evaluation model to obtain the prediction and evaluation map reflecting the karst collapse susceptibility, as shown in
Figure 15. According to the size of the H value, the study area was divided. There are four levels of karst collapse susceptibility, including extremely susceptible areas (2.64–2.81), susceptible areas (2.43–2.64), somewhat susceptible areas (1.88–2.43), and non-susceptible areas (1.04–1.88), and one non-karst level (0.51–1.04), as shown in
Figure 15 and
Table 7. In
Table 7, in the karst collapse-susceptible areas, the length of the extremely susceptible area is 11.9 km, accounting for about 12.85% of the total length of the line, and the remaining three susceptible areas are 23.2 km (25.05%), 36.62 km (39.54%), and 10.2 km (11.01%), respectively. The length of the non-karst area is 10.7 km, accounting for about 11.55% of the total length of the line. The sections of the expressway passing through the extremely susceptible area and susceptible area account for about 37.90% of the total length of the line.
According to the analysis results, the susceptibility of karst collapse in the study area is mainly affected by factors such as the degree of karst development, karst landform, and soil thickness, and locally by faults, karst collapse, underground rivers, and mining well. The extremely susceptible and susceptible areas of karst collapse coincide with the existing karst collapse area, and the research results are consistent with the actual situation. The total length of the extremely susceptible and susceptible areas of karst collapse equals 34.3 km, mainly distributed in the dissolution plain landform (88.05%). Only 4.1 km (11.95%) of the susceptible area is distributed in the erosion–dissolution landform, 99.10% of the 11.1 km of the extremely susceptible area is distributed in the strong developed karst area, 63.36% of the 23.2 km of the susceptible area is distributed in the strong developed karst area, and the rest are distributed in the moderate developed karst area. The soil thickness in the extremely susceptible area is less than 10 m or 5–10 m, and it is affected by faults, underground channels, karst collapse, and mining wells. Areas with soil thickness of 5–10 m have increased susceptibility. The somewhat susceptible and non-susceptible areas of karst collapse are mainly controlled by the degree of karst development, and they are located in the areas with moderate developed karst or weak developed karst. The non-karst area is not affected by any karst collapse-susceptible factors. Because the extremely susceptible and susceptible areas of karst collapse are very dangerous to the project, corresponding control measures must be taken, and the strong developed karst area, dissolution plain landform areas, and soil thickness of less than 10 m in the study area should be treated. The karst area should be taken seriously and control measures can be taken. In the areas with somewhat susceptible and non-susceptible areas of karst collapse, attention should also be paid to the moderate developed or weak developed karst areas with a soil thickness of less than 10 m, such as the K1410+300-K1410+600 and K1440+000-K1471+920 sections.
Combined with the hydrological engineering geological conditions, karst development, karst landform, and other influencing factors in the study area, the evaluation results coincide with the locations of karst collapse in the K1379+300-K1471+920 section of the Quannan Expressway in recent years, indicating that it is feasible to use the combination of the AHP method of ArcGIS to evaluate the susceptibility to karst collapse. The results can provide a scientific basis and technical support for the prevention and control of geological disasters, the planning of key areas, and the development and utilization of land.
The basic factors of karst collapse, such as soil thickness and underground river in the study area, were mainly obtained through borehole data, which can reflect the geological situation of the study area well but cannot reveal it completely due to the limits of the number and spacing of boreholes. Moreover, the development and degree of karst are dynamic, so the data of the field investigation are time-sensitive. Karst collapse is sudden and unpredictable. Therefore, the results of this study have certain limitations.
6. Suggestions for Prevention Measures
According to the evaluation conclusions of the AHP method of ArcGIS, as shown in
Table 7 and
Figure 15, it can be seen that the extremely susceptible and susceptible areas of karst collapse have a greater impact on the construction of the project and the safety after the project is completed, and the possibility of roadbed instability and damage is high. It is very necessary to take necessary prevention measures in the section. The specific prevention measures are proposed based on actual engineering experience and evaluation conclusions, as shown in
Table 8. At the same time, it is recommended to carry out a key exploration of the hidden karst soil caves and karst caves in the K1379+300-K1471+920 section to further identify the hidden karst situation. In addition, there is also the danger of karst collapse in the somewhat susceptible areas, but the degree of susceptibility to karst collapse is lower than that of the susceptible area. It is recommended to detect hidden karst soil caves and karst caves according to the actual situation to further identify the hidden karst situation, paying attention to the possible karst collapse and referring to the prevention measures for the corresponding treatment of the susceptible areas. For the non-susceptible areas of the road section, the degree of karst collapse susceptibility is low. During construction, attention should be paid to the possible karst collapse in local areas, and corresponding treatment can also be made with reference to the prevention measures for the karst collapse-susceptible areas.
7. Conclusions
The evaluation of karst collapse susceptibility is a complex and comprehensive research topic. In the evaluation process, it is very important to use scientific evaluation methods and establish a practical and perfect comprehensive evaluation system for karst collapse susceptibility evaluation. In this study, based on the AHP method of ArcGIS, the prediction and evaluation of the karst collapse susceptibility of section K1379+320-K1471+920 of the Quannan Expressway were carried out, and the conclusions are as follows:
- (1)
With the full integration of karst collapse-inducing factors, through the AHP hierarchical analysis method, it is reasonable to build a hierarchical structure evaluation system of three levels, one objective, three criteria, and seven indicators to derive the karst collapse susceptibility evaluation model.
- (2)
Through the spatial analysis function of ArcGIS, the prediction and evaluation map of karst collapse susceptibility was obtained. According to the size of the H value, the study area was divided into five levels. There are four levels of karst collapse susceptibility, including extremely susceptible areas (2.64–2.81), susceptible areas (2.43–2.64), somewhat susceptible areas (1.88–2.43), and non-susceptible areas (1.04–1.88), and one non-karst level (0.51–1.04). The length of the extremely susceptible area is 11.9 km, accounting for about 12.85% of the total length of the line, and the remaining three susceptible areas are 23.2 km (25.05%), 36.62 km (39.54%), and 10.2 km (11.01%), respectively. The research conclusions are consistent with the geographical location of karst collapse and the susceptibility to karst collapse in recent years, and the research results are consistent with the actual situation.
- (3)
According to the analysis results, the total length of the extremely susceptible and susceptible areas of karst collapse is 34.3 km, mainly distributed in the dissolution plain landform (88.05%). Only 4.1 km (11.95%) of the susceptible area is distributed in the erosion–dissolution landform; 99.10% of the 11.1 km of the extremely susceptible area is distributed in the strong developed karst area, 63.36% of the 23.2 km of the susceptible area is distributed in the strong developed karst area, and the rest are distributed in the moderate developed karst area. The soil thickness in the extremely susceptible area is less than 10 m or 5–10 m, and it is affected by faults, underground water, karst collapse, and mining well. Areas with soil thickness of 5–10 m have increased susceptibility. The somewhat susceptible and non-susceptible areas of karst collapse are mainly controlled by the degree of karst development, and they are located in the areas with moderate developed karst or weak developed karst. The non-karst areas are not affected by any karst collapse susceptible factors.
- (4)
In view of the prediction and evaluation conclusions and with reference to similar engineering experience, effective karst collapse prevention measures are put forward, which can provide a reference for disaster prevention and mitigation in engineering construction.
- (5)
The research results have played a guiding role in the safe construction and safe operation of the project after completion, which is of great practical significance and has certain academic research value, as it promotes and draws reference from the development of karst collapse research for several route projects. At the same time, the research method provides a reference for similar projects to evaluate the susceptibility of karst collapse and also provides a scientific basis for the planning and layout of route engineering and its geological disaster prevention.
- (6)
Although the research results can provide guidance for prevention in the study area, the research results have certain limitations due to the difficulty of collecting basic research data comprehensively.
Author Contributions
Writing—review and editing, Y.-H.X.; Supervision, B.-H.Z.; Writing—original draft, Y.-X.L.; Data curation, B.-C.L.; Software, C.-F.Z.; Investigation, Y.-S.L. All authors have read and agreed to the published version of the manuscript.
Funding
This research was funded by the Project on Improving the Basic Research Ability of Young and Middle-aged Teachers in Guangxi Universities (Grant No. 2022KY0786) and the Natural Science Foundation of Guangxi Province, China (Grant No. 2020GXNSFAA297078).
Institutional Review Board Statement
Not applicable.
Informed Consent Statement
Not applicable.
Data Availability Statement
Conflicts of Interest
The authors declare that they have no known competing financial interests or personal relationships that could have appeared to influence the work reported in this paper.
References
- Zheng, Z.J.; Ao, W.L.; Zeng, J.; Gan, F.P.; Zhang, W. Application of integrated geophysical methods to karst collapse investigation in the Sijiao village near Liuzhou. Hydrogeol. Eng. Geol. 2017, 44, 143–149. [Google Scholar]
- Yi, S.M.; Lu, W.; Zhou, X.J. The Formation Investigation and Remediation of Sinkhole in the Xiamao Village, Guangzhou. Trop. Geogr. 2021, 41, 801–811. [Google Scholar]
- Pan, Z.Y.; Jia, L.; Liu, B.C. Risk evaluation of karst collapse based on technology of AHP and ArcGIS—A case of Yongle Town in Zunyi City. J. Guilin Univ. Technol. 2016, 36, 464–470. [Google Scholar]
- Wei, Y.Y.; Sun, S.L.; Huang, J.J. Spatial-temporal distribution and causes of karst collapse in the Xuzhou area. Carsologica Sin. 2015, 34, 52–57. [Google Scholar]
- Zhang, J.; Bi, P.; Wei, A.; Tao, Z.B.; Zhu, H.C. Assessment of susceptibility to karst collapse in the Qixia Zhongqiao district of Yantai based on fuzzy comprehensive method. Carsologica Sin. 2021, 40, 215–220. [Google Scholar]
- Wang, H.H.; Zhang, F.W.; Guo, C.Q.; Sun, C.T. Urban karst collapse hazard assessment based on analytic hierarchy process:An example of southern Wuhan City. Carsologica Sin. 2016, 35, 667–673. [Google Scholar]
- Perrin, J.; Cartannaz, C.; Noury, G.; Vanoudheusden, E. A Multi-criteria Approach to Karst Subsidence Hazard Mapping Supported by Weights-of-evidence Analysis. Eng. Geol. 2015, 197, 296–305. [Google Scholar] [CrossRef]
- Zeng, B.; Yang, M.Y.; Shao, C.J.; Chen, Z.H.; Peng, D.M.; Zheng, S.N. Susceptibility Assessment of Karst Collapse of Hangchang Expressway Projects Based on Analytic Hierarchy Process. Saf. Environ. Eng. 2018, 25, 29–38. [Google Scholar]
- Wu, Y.N. Process and influencing factors of karst ground collapse in the water source area of Taian-Jiuxian. Carsologica Sin. 2020, 39, 225–231. [Google Scholar]
- Tu, J.; Li, H.J.; Peng, H.; Wei, X.; Jia, L. Analysis on collapse model of the karst area covered by clay in Wuhan City Jiangxia district Hongqi village. Carsologica Sin. 2018, 37, 112–119. [Google Scholar]
- Wang, G.L.; Qiang, Z.; Cao, C.; Chen, Y.; Hao, J.Y. Assessment of susceptibility to karst collapse based on geodetector and analytichierarchy process: An example of Zhongliangshan area in Chongqing. Carsologica Sin. 2021. Available online: https://kns.cnki.net/kcms/detail/45.1157.P.20210310.1716.004.html (accessed on 11 March 2021).
- Wang, F.; Chai, B.; Xu, G.L.; Chen, L.; Xiong, Z.T. Evolution Mechanism of Karst Sinkholes in Wuhan City. J. Eng. Geol. 2017, 25, 824–832. [Google Scholar]
- Yang, Y.; Cao, X.M.; Feng, F.; Ding, J.P. Mechanism analysis of karst collapse at polie of Yanyu, Guizhou. J. Liaoning Tech. Univ. (Nat. Sci.) 2016, 35, 1081–1084. [Google Scholar]
- Miao, S.X.; Huang, J.J.; Wu, J.Q.; Li, S.M. Mechanism Analysis of Karst Collapse and Ground Fissures Disasters in Dayanglin, Zhenjiang. J. Disaster Prev. Mitig. Eng. 2013, 33, 679–685. [Google Scholar]
- Mu, C.M.; He, Y.C.; Li, C.J. The Cause of Formation Analysis and Preventive Treatment to the Karstic Collapse of a Stadium in Guilin. Ind. Constr. 2013, 43, 459–463. [Google Scholar]
- Wan, Z.B.; Wu, X.; Xu, S.; Li, Y.H.; Yang, R.Y.; Chen, H.H.; Gao, M.X.; Zhang, S.F. Mechanism of karst collapse in Shiliquan area in Zaozhuang City. Hydrogeol. Eng. Geol. 2006, 4, 109–111. [Google Scholar]
- Gao, X.C. Mechanism Analysis of Karst Subgrade Subsidence of Laixin Expressway. J. Highw. Transp. Res. Dev. 2004, 4, 42–44. [Google Scholar]
- Zhong, Y.; Zhang, M.K.; Pan, L.; Zhao, S.K.; Hao, Y.H. Risk assessment for urban karst collapse in Wuchang District of Wuhan based on GIS. J. Tianjin Norm. Univ. (Nat. Sci. Ed.) 2015, 35, 48–53. [Google Scholar]
- Wu, L.Q.; Liao, J.J.; Wang, W.; Pi, W.; Zhou, L.L. Risk Assessment of Karst Surface Collapse in Wuhan Region Based on AHP-Information Method. J. Yangtze River Sci. Res. Inst. 2017, 34, 43–47. [Google Scholar]
- Duan, X.Q.; Chu, X.W.; Li, B. Risk prediction and evaluation of the karst collapse based on the set pair mechanism analysis. J. Saf. Environ. 2016, 16, 72–76. [Google Scholar]
- Ou, Y.F.; Xu, G.L.; Zhang, X.J.; Li, Y.F.; Dong, J.X. Static Analysis and Hazard Assessment of Karst Ground Collapse in Vital Project. J. Yangtze River Sci. Res. Inst. 2016, 33, 88–93. [Google Scholar]
- Cui, Y.L.; Wang, G.H.; Li, Z.Y. Risk assessment of karst collapse areas based on the improved fish bone model:An example of the Liuzhou area in Guangxi Province. Carsologica Sin. 2015, 34, 64–71. [Google Scholar]
- Li, X.; Yin, K.L.; Chen, B.D.; Li, Y.; Jiang, C.; Yi, J. Evaluation of karst collapse susceptibility on both sides of Yangtze River in Baishazhou, Wuhan and countermeasures for prevention and control during subway construction. Geol. Sci. Technol. Bull. 2020, 39, 121–130. [Google Scholar]
- Chen, J.Y.; Zhu, B.; Peng, S.X.; Shan, H.M. AHP and GIS-based assessment of karst collapse susceptibility in mining areas—A case study of karst mining area in Lingyu, Guizhou. J. Nat. Hazards 2021, 30, 226–236. [Google Scholar]
- Abedini, M.; Tulabi, S. Assessing LNRF, FR, and AHP models in landslide susceptibility mapping index: A comparative study of Nojian watershed in Lorestan province, Iran. Environ. Earth Sci. 2018, 77, 405. [Google Scholar] [CrossRef]
- Hammami, S.; Zouhri, L.; Souissi, D.; Souei, A.; Zghibi, A.; Marzougui, A.; Dlala, M. Application of the GIS based multi-criteria decision analysis and analytical hierarchy process (AHP) in the flood susceptibility mapping (Tunisia). Arab. J. Geosci. 2019, 12, 653. [Google Scholar] [CrossRef]
- Azarafza, M.; Akgün, H.; Atkinson, P.M.; Derakhshani, R. Deep learning-based landslide susceptibility mapping. Sci. Rep. 2021, 11, 24112. [Google Scholar] [CrossRef] [PubMed]
- Subedi, P.; Subedi, K.; Thapa, B.; Subedi, P. Sinkhole susceptibility mapping in Marion County, Florida: Evaluation and comparison between analytical hierarchy process and logistic regression based approaches. Sci. Rep. 2019, 9, 7140. [Google Scholar] [CrossRef] [Green Version]
- Di Napoli, M.; Di Martire, D.; Bausilio, G.; Calcaterra, D.; Confuorto, P.; Firpo, M.; Pepe, G.; Cevasco, A. Rainfall-induced shallow landslide detachment, transit and runout susceptibility mapping by integrating machine learning techniques and GIS-based approaches. Water 2021, 13, 488. [Google Scholar] [CrossRef]
- Xiao, J.Q.; Qiao, S.F. Interaction between karst-subsidence foundation and subgrade in Lou-Xing freeway and its treatment methods. J. Railw. Sci. Eng. 2009, 6, 33–38. [Google Scholar]
- Peng, Y.H. Analysis of ground collapse mechanism and engineering management in karst areas. China Rural. Water Hydropower 2004, 4, 40–42. [Google Scholar]
- Zhang, B.Z.; Chen, Z.D. Mechanism and comprehensive management of karst collapse in mines. Geol. China 1997, 4, 27–29. [Google Scholar]
- Luo, X.J. Prevention, control and emergency disposal of covered karst ground collapse. Yangtze River 2016, 47, 38–44. [Google Scholar]
- Nanehkaran, Y.A.; Mao, Y.; Azarafza, M.; Kockar, M.K.; Zhu, H.H. Fuzzy-based multiple decision method for landslide susceptibility and hazard assessment: A case study of Tabriz, Iran. Geomech. Eng. 2021, 24, 407–418. [Google Scholar]
- Das, S. Flood susceptibility mapping of the Western Ghat coastal belt using multi-source geospatial data and analytical hierarchy process (AHP). Remote Sens. Appl. Soc. Environ. 2020, 20, 100379. [Google Scholar] [CrossRef]
- Ghorbanzadeh, O.; Feizizadeh, B.; Blaschke, T. An interval matrix method used to optimize the decision matrix in AHP technique for land subsidence susceptibility mapping. Environ. Earth Sci. 2018, 77, 584. [Google Scholar] [CrossRef]
- Wu, Y.B.; Liu, Z.K.; Yin, R.Z.; Lei, M.T.; Dai, J.L.; Luo, W.Q.; Pan, Z.Y. Evaluation and application of karst collapse susceptibility in Huaihua, Hunan based on AHP and GIS techniques. Carsologica Sin. 2021. Available online: https://kns.cnki.net/kcms/detail/45.1157.P.20211221.1205.002.html (accessed on 12 December 2021).
- Arabameri, A.; Rezaei, K.; Pourghasemi, H.R.; Lee, S.; Yamani, M. GIS-based gully erosion susceptibility mapping: A comparison among three data-driven models and AHP knowledge-based technique. Environ. Earth Sci. 2018, 77, 628. [Google Scholar] [CrossRef]
- Azarafza, M.; Ghazifard, A.; Akgün, H.; Asghari-Kaljahi, E. Landslide susceptibility assessment of South Pars Special Zone, southwest Iran. Environ. Earth Sci. 2018, 77, 805. [Google Scholar] [CrossRef]
- Souissi, D.; Zouhri, L.; Hammami, S.; Msaddek, M.H.; Zghibi, A.; Dlala, M. GIS-based MCDM–AHP modeling for flood susceptibility mapping of arid areas, southeastern Tunisia. Geocarto Int. 2020, 35, 991–1017. [Google Scholar] [CrossRef]
Figure 1.
The location map of the study area.
Figure 1.
The location map of the study area.
Figure 2.
The range of study area.
Figure 2.
The range of study area.
Figure 3.
Engineering geological map of the study area.
Figure 3.
Engineering geological map of the study area.
Figure 4.
Typical dissolution landforms.
Figure 4.
Typical dissolution landforms.
Figure 5.
Typical karst collapse.
Figure 5.
Typical karst collapse.
Figure 6.
A typical groundwater mining well.
Figure 6.
A typical groundwater mining well.
Figure 7.
Evaluation system.
Figure 7.
Evaluation system.
Figure 8.
Zoning map of influence degree of karst development on karst collapse.
Figure 8.
Zoning map of influence degree of karst development on karst collapse.
Figure 9.
Zoning map of influence degree of karst landform on karst collapse.
Figure 9.
Zoning map of influence degree of karst landform on karst collapse.
Figure 10.
Zoning map of influence degree of fault on karst collapse.
Figure 10.
Zoning map of influence degree of fault on karst collapse.
Figure 11.
Zoning map of influence degree of soil thickness on karst collapse.
Figure 11.
Zoning map of influence degree of soil thickness on karst collapse.
Figure 12.
Zoning map of influence degree of existing karst collapse in the research area.
Figure 12.
Zoning map of influence degree of existing karst collapse in the research area.
Figure 13.
Zoning map of influence degree of underground river on karst collapse.
Figure 13.
Zoning map of influence degree of underground river on karst collapse.
Figure 14.
Zoning map of influence degree of mining well on karst collapse.
Figure 14.
Zoning map of influence degree of mining well on karst collapse.
Figure 15.
Zoning map of karst collapse susceptible prediction evaluation in the study area.
Figure 15.
Zoning map of karst collapse susceptible prediction evaluation in the study area.
Table 1.
List of main structures in the research area.
Table 1.
List of main structures in the research area.
| Number | Name | Characteristic | Intersection Area | Impact Degree |
|---|
| F1 | Bazha fault | Fracture of unknown nature | K1389+750 | High |
| F2 | Yangshan fault | Normal fault | K1393+020 | High |
| F3 | Bianshan fault | Normal fault | K1397+100 | High |
| F4 | Yao Village fault | Fracture of unknown nature | K1398+570 | High |
| F5 | Xingu Ling-Hengxian fault | Compressive fracture | K1404+340 | High |
| F6 | Gaoshan fault | Normal fault | K1412+020 | Medium |
| F7 | Fault of unknown nature | Fracture of unknown nature | K1415+050 | Low |
| F8 | Fault of unknown nature | Fracture of unknown nature | K1416+200 | Low |
| F9 | Li village fault | Normal fault | K1417+480 | Low |
| F10 | Lijianpo fault | Normal fault | K1421+020 | Low |
| F11 | Liantang fault | Retrograde fault | K1423+530 | Low |
| F12 | Wangbuna fault | Retrograde fault | K1431+000 | Medium |
| 1 | Liujing-Shangzhou gentle monoclinal fault | Monoclinic structure | Liujing, Lingli, Wuhe to Shangzhou area | High |
| 2 | Gantang short-axis
syncline | Syncline | Gantang area | Medium |
Table 2.
List of landform types in the study area.
Table 2.
List of landform types in the study area.
| Lithological Classification | Genetic Classification | The Distribution of Section |
|---|
| Non-karst landforms | Erosion landforms | K1410+500~K1420+400, K1431+000~K1434+100 |
| Accumulation landforms | K1420+400~K1423+600, K1425+100~K1435+900 |
| Karst landforms | Dissolution landforms | K1379+300K1410+500, K1449+500~K1456+800, K1468+300~K1471+920 |
| Dissolution–erosion landforms or erosion–dissolution landforms | K1423+600~K1431+000, K1435+900~K1449+500, K1456+800~K1468+300 |
Table 3.
Evaluation factors and assignment table of structural karst collapse susceptibility level.
Table 3.
Evaluation factors and assignment table of structural karst collapse susceptibility level.
| Objective Layer A | Criteria Layer B | Indicator Layer C | Impact Degree/Assignment |
|---|
Extremely
High Impact/5 | High Impact/4 | Middle
Impact/3 | Low Impact/2 | Extremely
Low Impact/1 |
|---|
| Evaluation of karst collapse susceptibility | Basic geological conditions B1 | Degree of karst development
C1 Hkarst | Strong | Moderate | Weak | | None |
Karst landform
C2 Hlandform | Plain | Erosion–karst hills valley (depression) | Dissolution–erosion low hills | Solitary and residual peak
Peak clump or peak forest | Non-karst landforms |
| FaultC3Hfault | 0~250 m | 250~500 m | 500~750 m | 750~1000 m | >1000 m |
Soil thickness C4
Hsoil | <5 m | 5~10 m | 10~20 m | 20~30 m | >30 m |
| Karst risk influence B2 | Karst collapse C5
Hcollapse | >4/km2 | 2~4/km2 | 1~2/km2 | 1/km2 | 0 |
Underground river C6
Hgroundriver | <1.5 m | 1.5~3 m | 3~6 m | 6~10 m | >10 m |
| Human activities B3 | Mining well C7
Hwel | 0~250 m | 250~500 m | 500~750 m | 750~1000 m | >1000 m |
Table 4.
Importance scales.
Table 4.
Importance scales.
| Importance Scales | Meaning |
|---|
| 1 | When two elements are compared, they are of equal importance |
| 3 | When comparing two elements, the former is slightly more important than the latter |
| 5 | When comparing two elements, the former is more important than the latter |
| 7 | When comparing two elements, the former is significantly more important compared to the latter |
| 9 | When comparing two elements, the former is extremely more important compared to the latter |
| 2, 4, 6, 8 | The intermediate values of the above judgments |
| Reciprocal | If the ratio of the importance of element I to element j is aij, then the ratio of the importance of element j to element I is aji = 1/aij |
Table 5.
Average random consistency index allocation table.
Table 5.
Average random consistency index allocation table.
| Number of Steps n | 1 | 2 | 3 | 4 | 5 | 6 | 7 | 8 | 9 | 10 |
|---|
| RI | 0 | 0 | 0.58 | 0.90 | 1.12 | 1.24 | 1.32 | 1.41 | 1.45 | 1.49 |
Table 6.
Evaluation factor weight allocation table.
Table 6.
Evaluation factor weight allocation table.
| Objective Layer A | Evaluation of Karst Collapse Susceptibility |
|---|
| Criterion layer B | Basic geological conditions B1 | Karst risk influence B2 | Human activities B3 |
| Criterion layer weights relative to objective layer | 0.6626 | 0.2324 | 0.1050 |
| Indicator layer C | Degree of karst development C1 | Karst landform C2 | Fault C3 | Soil thickness C4 | Karst collapse C5 | Underground river C6 | Mining well C7 |
| Criterion layer weights relative to indicator layer weights | 0.4965 | 0.2668 | 0.1540 | 0.0827 | 0.6429 | 0.3571 | 1.0000 |
| Indicator layer weights relative to objective layer weights | 0.3285 | 0.1770 | 0.1023 | 0.0548 | 0.1494 | 0.0830 | 0.1050 |
Table 7.
Table of evaluation conclusions of karst collapse susceptibility.
Table 7.
Table of evaluation conclusions of karst collapse susceptibility.
| Mileage | Susceptible Level | Length/km | Mileage | Susceptible Level | Length/km |
|---|
| k1379+300-k1381+800 | Extremely susceptible area | 2.5 | k1409+300-k1410+300 | Susceptible area | 1.0 |
| k1381+800-k1388+000 | Susceptible area | 6.2 | k1410+300-k1410+600 | Somewhat susceptible area | 0.3 |
| k1388+000-k1389+000 | Extremely susceptible area | 1.0 | k1410+600-k1414+500 | Non-susceptible area | 3.9 |
| k1389+000-k1390+000 | Susceptible area | 1.0 | k1414+500-k1415+400 | Somewhat susceptible area | 0.9 |
| k1390+000-k1391+000 | Extremely susceptible area | 1.0 | k1415+400-k1416+900 | Non-susceptible area | 1.5 |
| k1391+000-k1394+000 | Susceptible area | 3.0 | k1416+900-k1417+200 | Somewhat susceptible area | 0.3 |
| k1394+000-k1395+600 | Extremely susceptible area | 1.6 | k1417+200-k1418+100 | Non-karst area | 0.9 |
| k1395+600-k1397+500 | Susceptible area | 1.9 | k1418+100-k1420+000 | Non-susceptible area | 1.9 |
| k1397+500-k1399+700 | Extremely susceptible area | 2.2 | k1420+000-k1423+200 | Somewhat susceptible area | 3.2 |
| k1399+700-k1400+500 | Susceptible area | 0.8 | k1423+200-k1425+100 | Non-susceptible area | 1.9 |
| k1400+500-k1401+600 | Extremely susceptible area | 1.1 | k1425+100-k1433+000 | Non-karst area | 7.9 |
| k1401+600-k1403+800 | Susceptible area | 2.2 | k1433+000-k1434+000 | Non-susceptible area | 1.0 |
| k1403+800-k1405+000 | Extremely susceptible area | 1.2 | k1434+000-k1435+900 | Non-karst area | 1.9 |
| k1405+000-k1408+000 | Susceptible area | 3.0 | k1435+900-k1440+000 | Susceptible area | 4.1 |
| k1408+000-k1409+300 | Extremely susceptible area | 1.3 | k1440+000-k1475+000 | Somewhat susceptible area | 35.0 |
Table 8.
Table of prevention measures.
Table 8.
Table of prevention measures.
| Road Section | Susceptible Level | Prevention Measures |
|---|
| k1379+300-k1381+800 | Extremely susceptible area | If the karst is developed in a large area and the bedrock surface is violently undulating, a large excavation program will be adopted to cut the height, fill the low level, and reinforce the substrate; on the contrary, if the solution trench and solution trough are locally developed, a local excavation and backfill or structure span program will be adopted. If the burial depth is shallow, excavation and backfill will be used to reinforce the hidden soil cave and karst cave, and if the burial depth is deep, grouting or structure can be used to span according to the specific situation. |
| k1381+800-k1387+700 | Extremely susceptible area, susceptible area |
| K1387+700-K1410+500 | Extremely susceptible area |
| K1418+400-K1425+100 | Susceptible area |
| K1436+700-K1439+700 | Extremely susceptible area |
| K1439+700-K1471+920 | Susceptible area |
| Publisher’s Note: MDPI stays neutral with regard to jurisdictional claims in published maps and institutional affiliations. |
© 2022 by the authors. Licensee MDPI, Basel, Switzerland. This article is an open access article distributed under the terms and conditions of the Creative Commons Attribution (CC BY) license (https://creativecommons.org/licenses/by/4.0/).


