
Patterns and Drivers of Groundwater and Stream Nitrate Concentrations in Intensively Managed Agricultural Catchments


Abstract
:
1. Introduction
2. Materials and Methods
2.1. Study Catchments
2.2. Monitoring Infrastructure and Data Collection
2.3. Agronomy
2.4. Meteorology
2.5. Statisitical Approach
3. Results
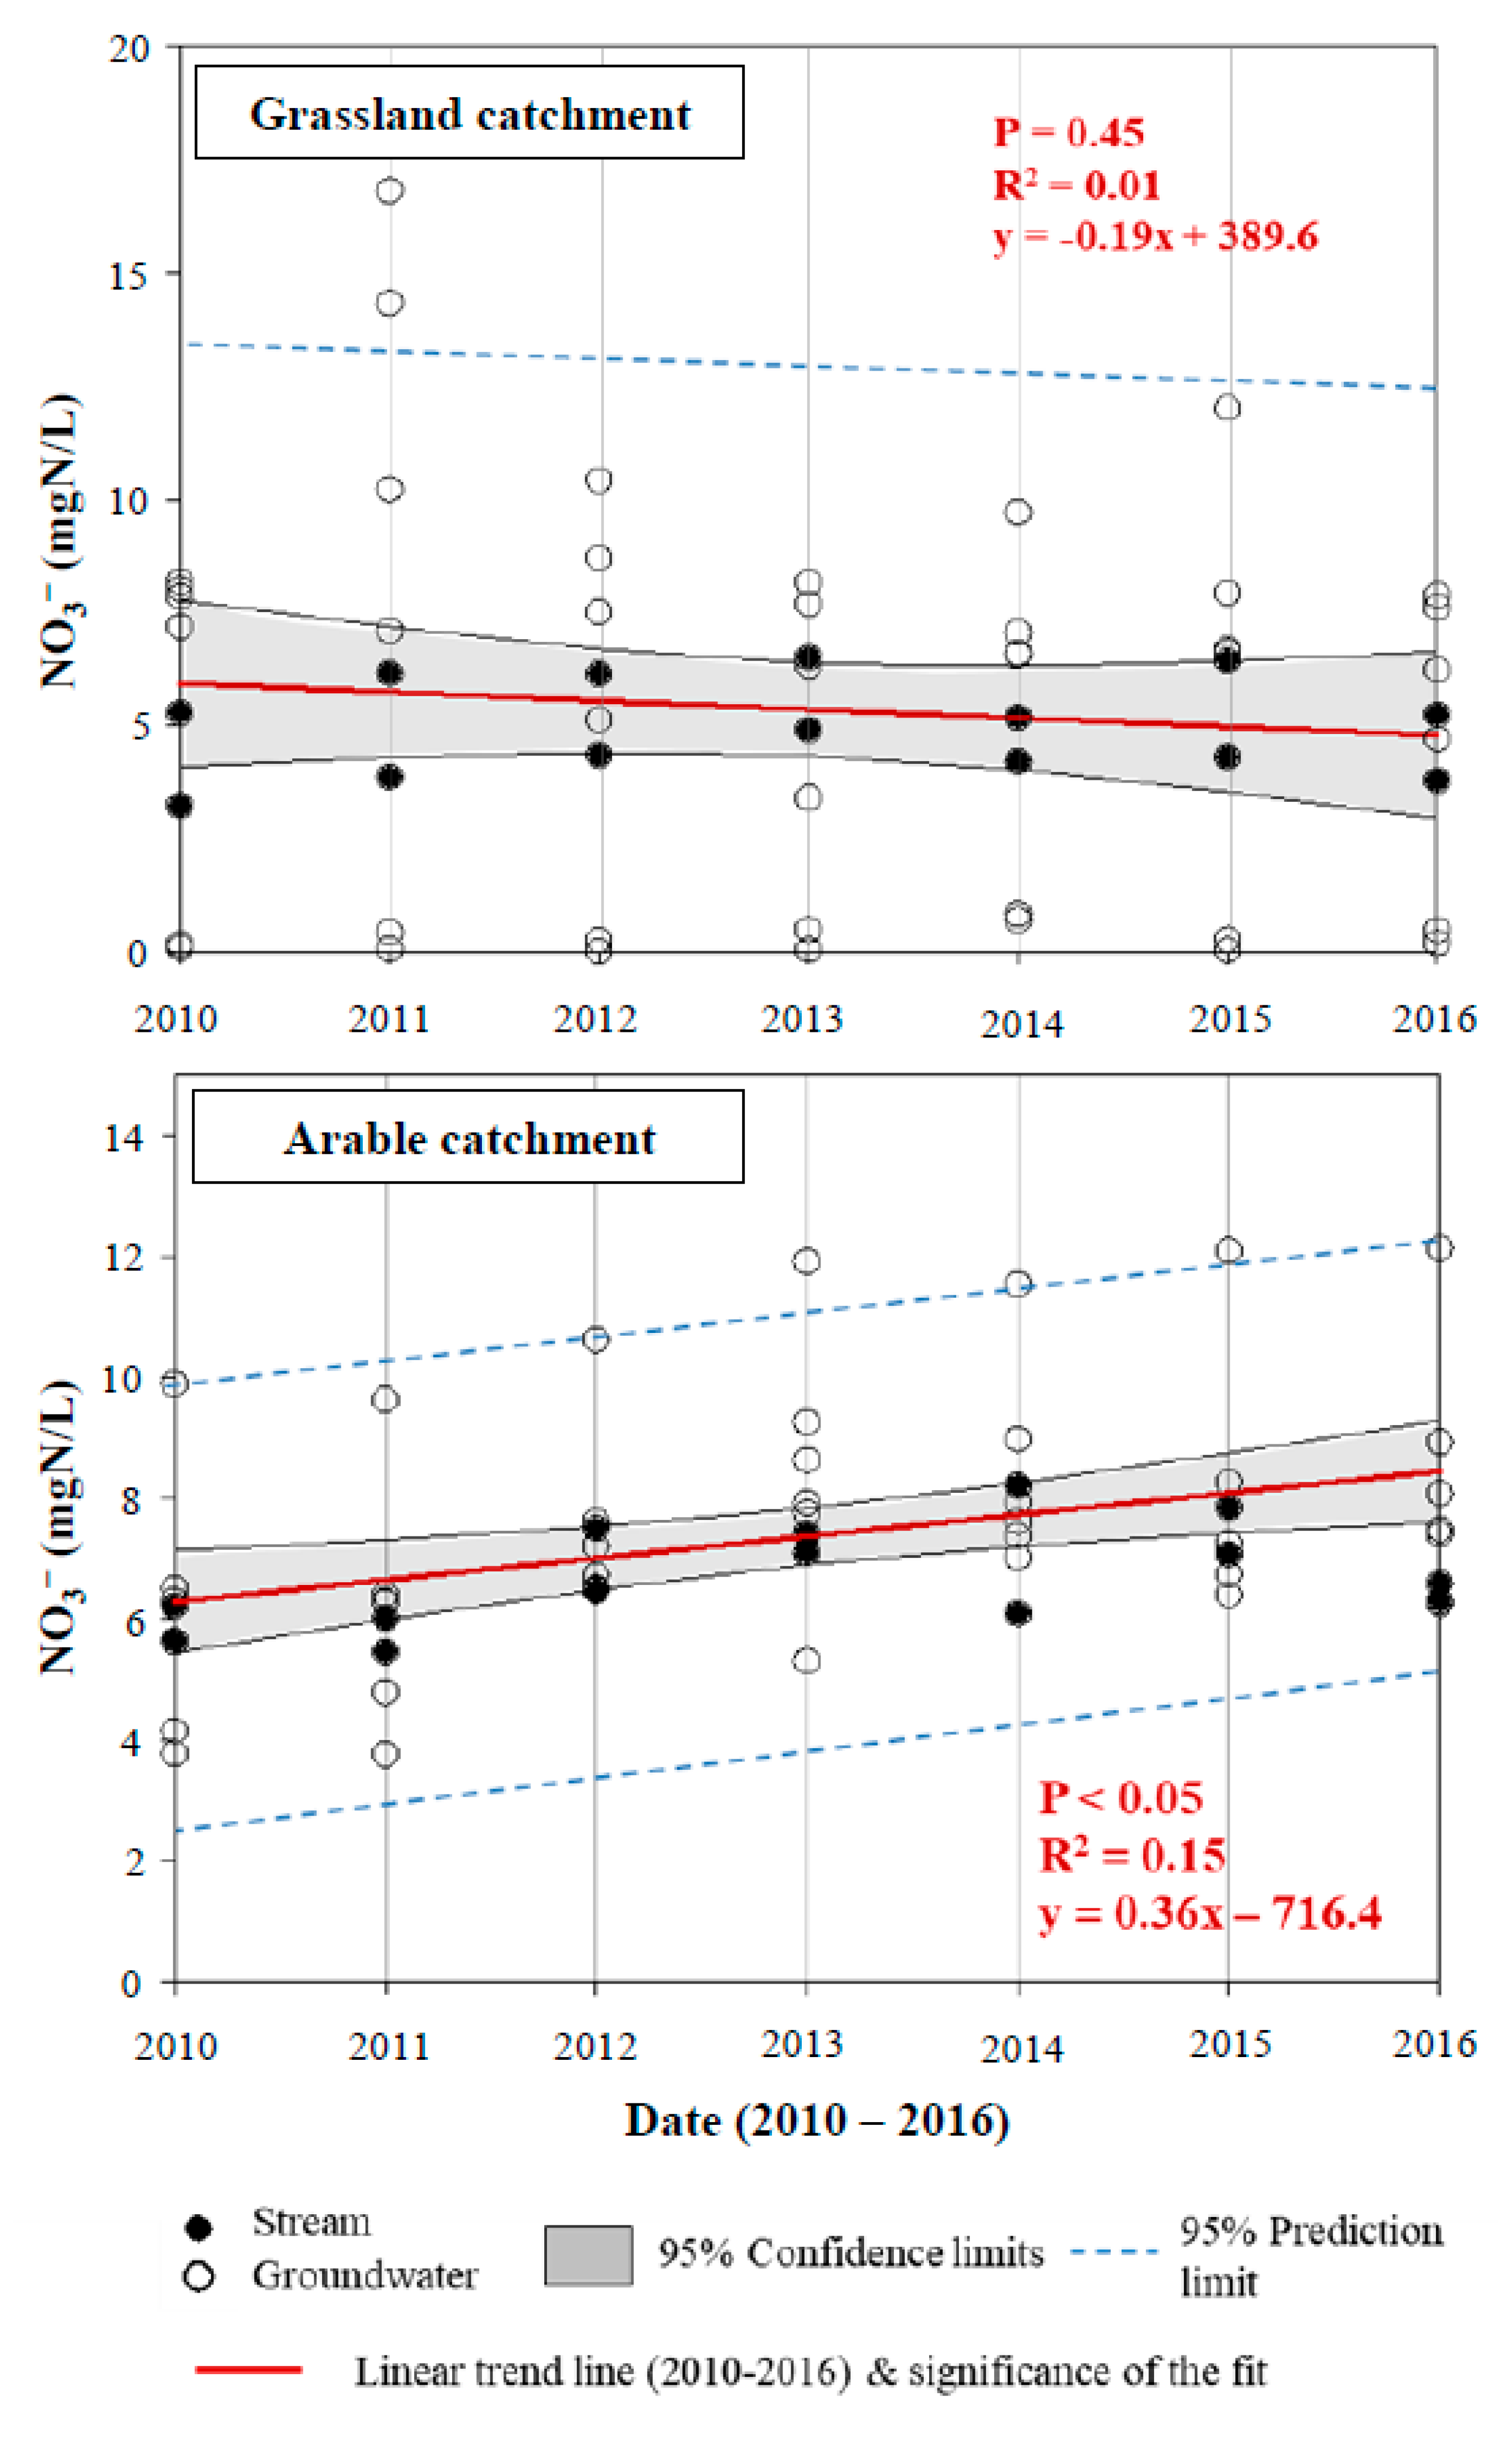
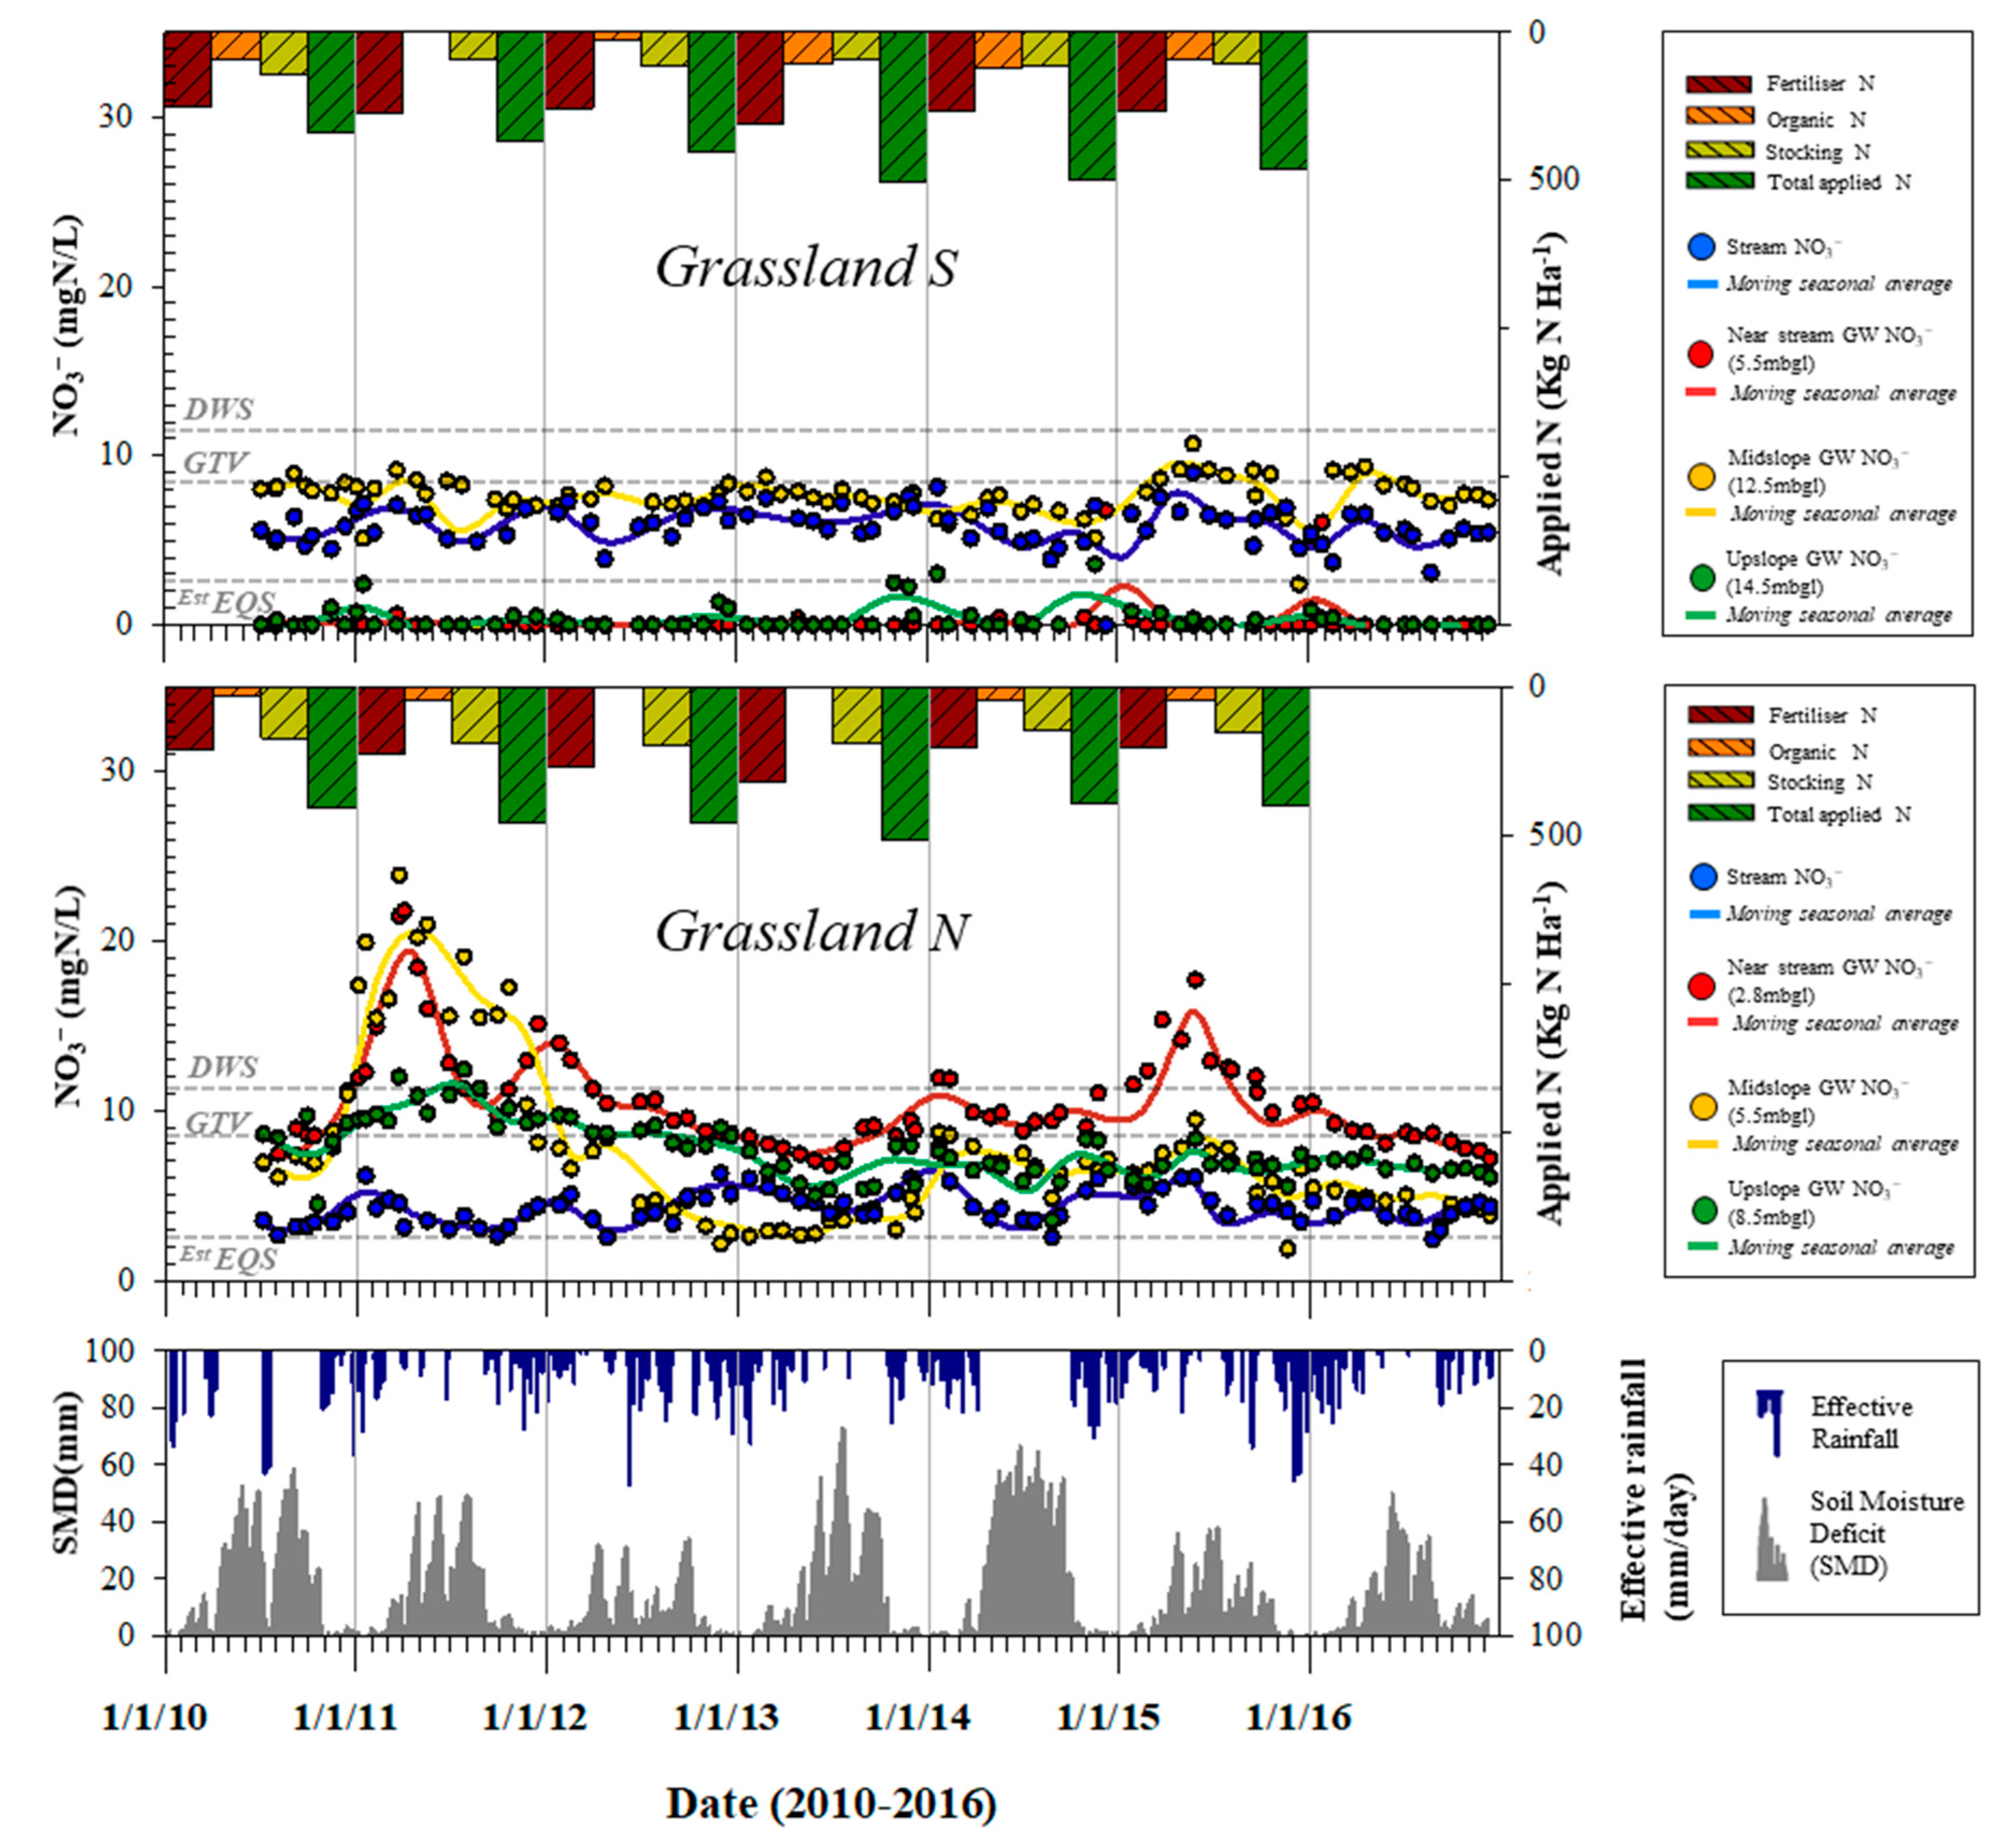
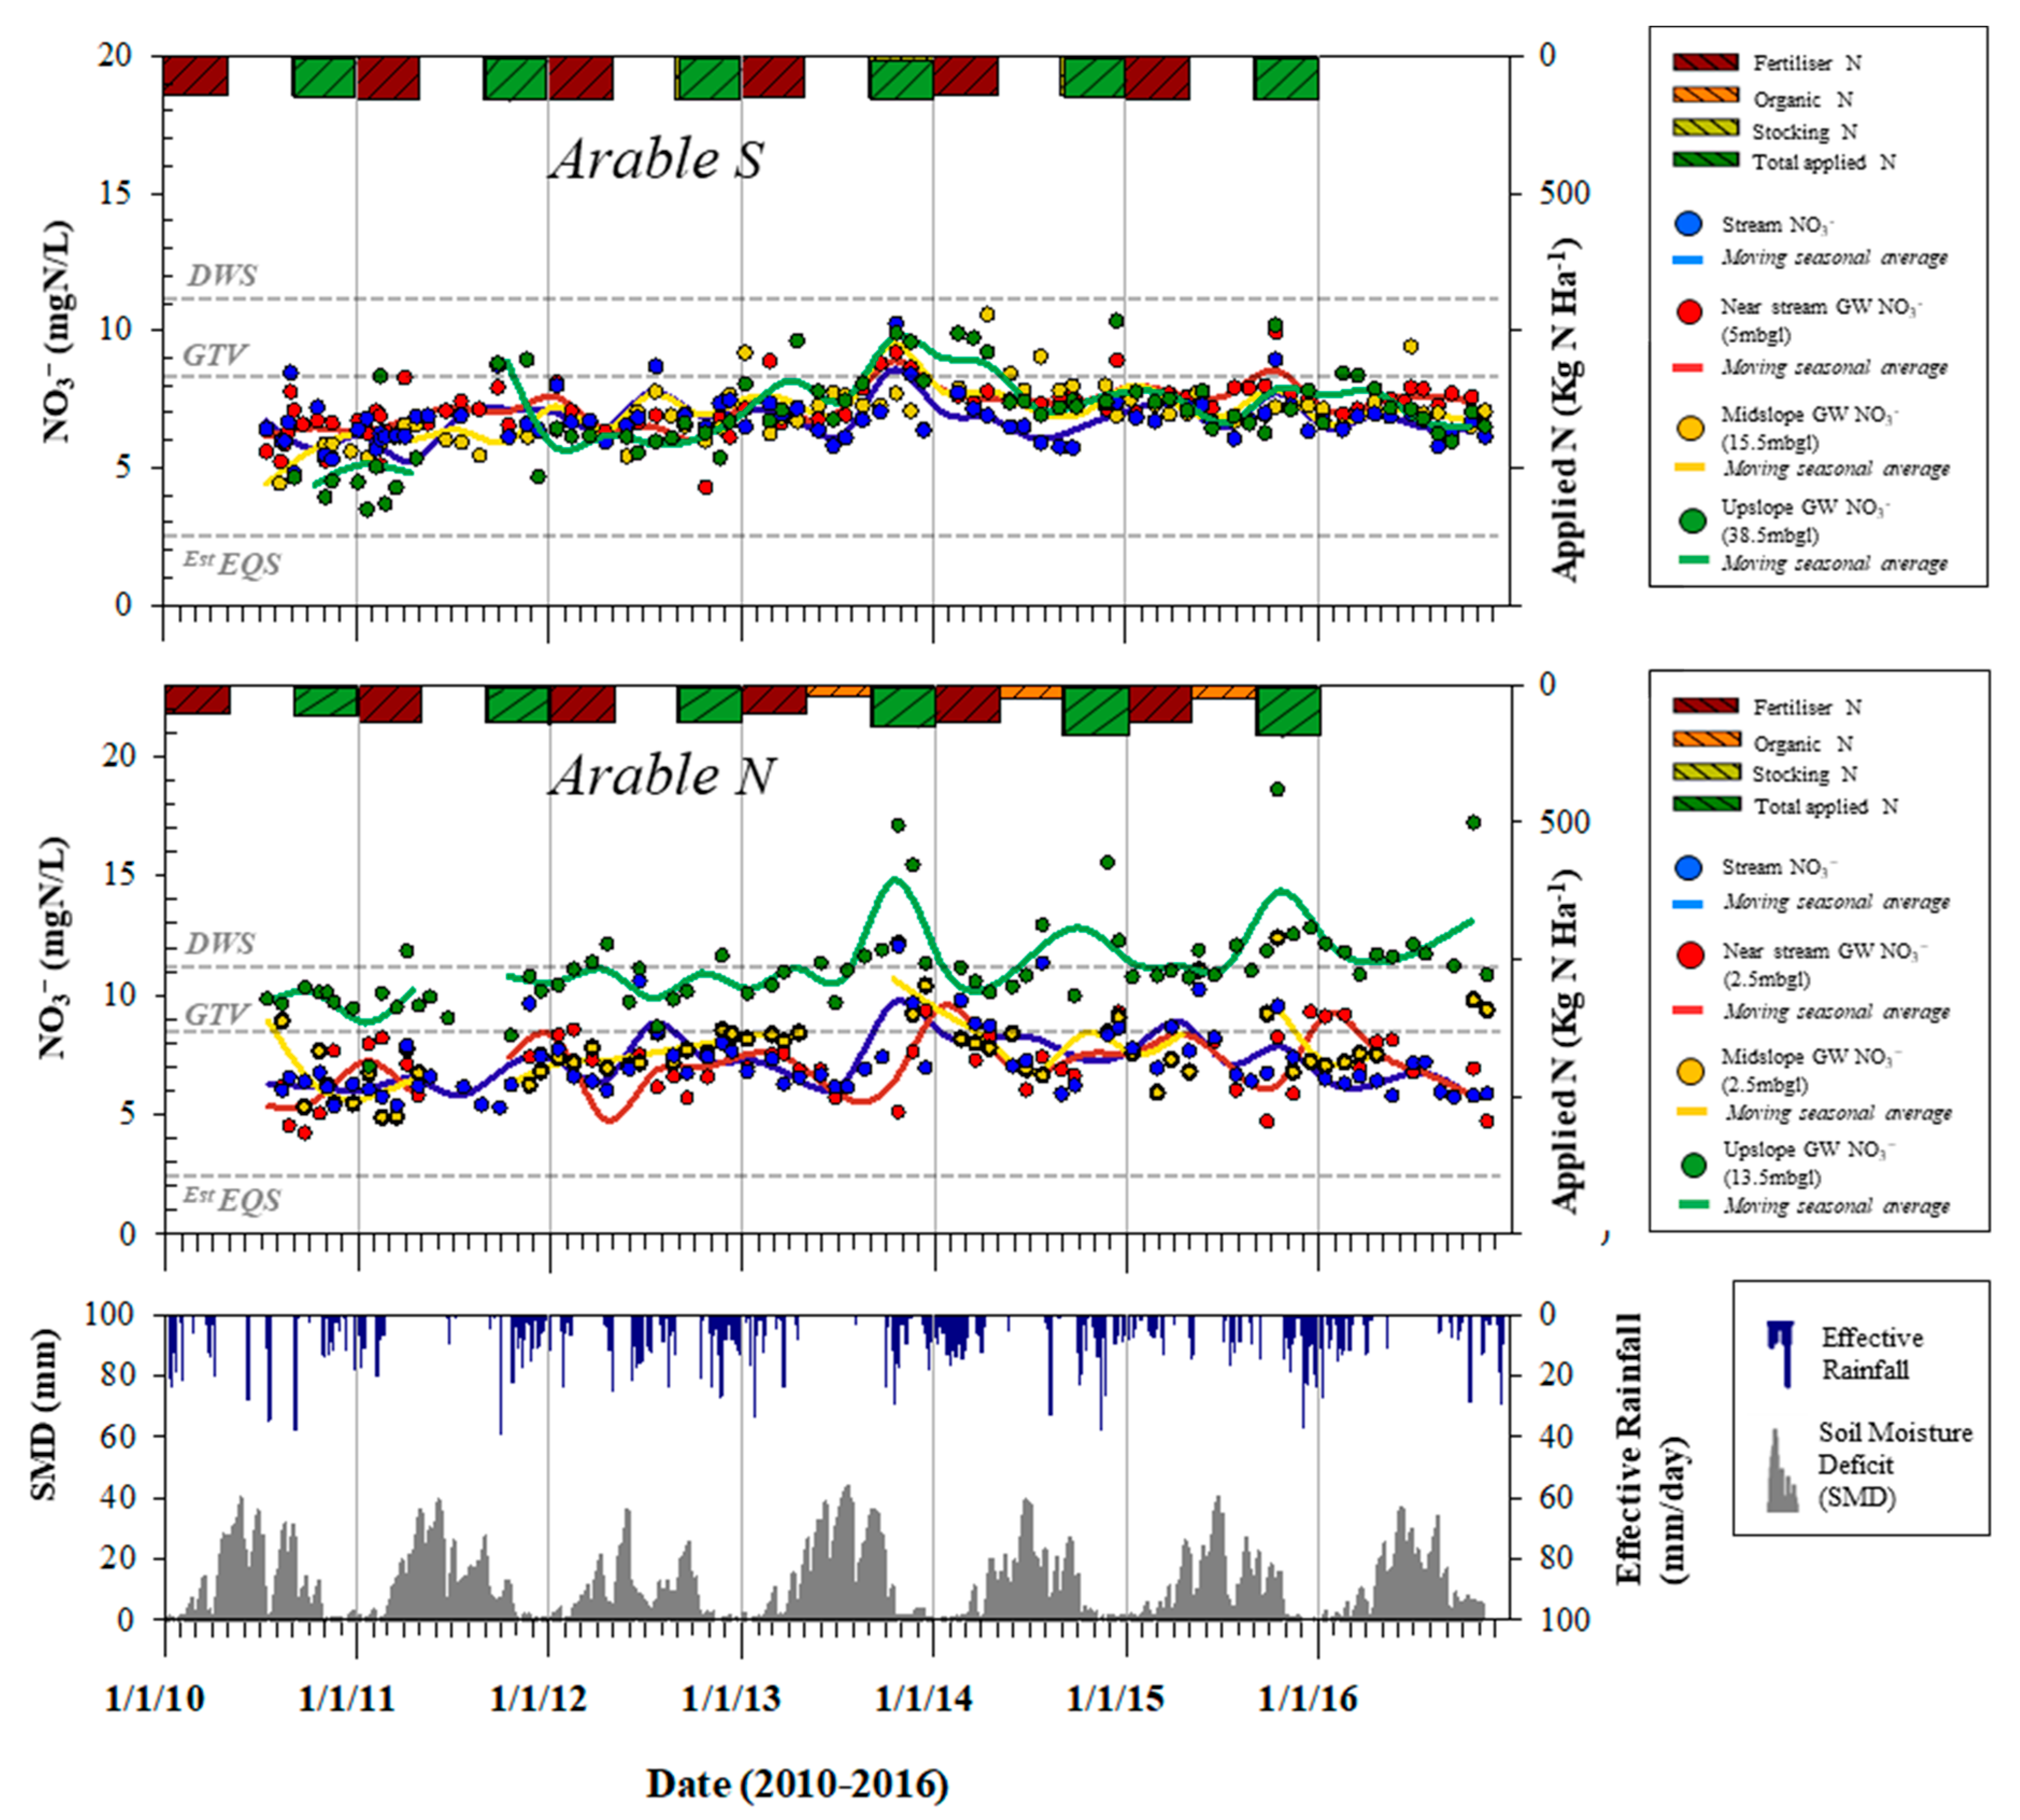
3.1. Groundwater and Stream NO3− Concentrations
3.2. Meteorology and Agronomy
3.3. Multiple Regression Analysis
3.3.1. Joint Model for Catchments
3.3.2. Catchment Specific Model: Grassland Catchment
3.3.3. Catchment Specific Model: Arable Catchment
4. Discussion
4.1. Groundwater and Stream NO3− Concentrations
4.2. Agronomic Factors
4.3. Meteorological Factors
4.4. Hydrogeological Factors
5. Conclusions
Author Contributions
Funding
Acknowledgments
Conflicts of Interest
References
- Stark, C.H.; Richards, K.G. The continuing challenge of agricultural nitrogen loss to the environment in the context of global change and advancing research. Dyn. Soil Dyn. Plant 2008, 2, 1–12. [Google Scholar]
- O’Boyle, S.; Trodd, W.; Bradley, C.; Tierney, D.; Wilkes, R.; Ní Longphuirt, S.; Smith, J.; Stephens, A.; Barry, J.; Maher, P.; et al. Water Quality in Ireland; Environmental Protection Agency, Johnstown Castle, Co.: Wexford, Ireland, 2019. [Google Scholar]
- Bruning-Fann, C.S.; Kaneene, J.B. The effects of nitrate, nitrite, and N-nitroso compounds on human health: A review. Vet. Hum. Toxicol. 1993, 35, 521–538. [Google Scholar] [PubMed]
- Weymann, D.; Well, R.; Flessa, H.; Heide, C.; Deurer, M.; Meyer, K.; Konrad, C.; Walther, W. Groundwater N2O emission factors of nitrate-contaminated aquifers as derived from denitrification progress and N2O accumulation. Biogeosciences 2008, 5, 1215–1226. [Google Scholar] [CrossRef] [Green Version]
- Kasimir-Klemedtsson, Å.; Klemedtsson, L.; Berglund, K.; Martikainen, P.; Silvola, J.; Oenema, O. Greenhouse gas emissions from farmed organic soils: A review. Soil Use Manag. 1997, 13, 245–250. [Google Scholar] [CrossRef]
- Tomer, M.D.; Burkart, M.R. Long-term effects of nitrogen fertilizer use on ground water nitrate in two small watersheds. J. Environ. Qual. 2003, 32, 2158–2171. [Google Scholar] [CrossRef] [PubMed]
- Ocampo, C.J.; Oldham, C.E.; Sivapalan, M.; Turner, J.V. Hydrological versus biogeochemical controls on catchment nitrate export: A test of the flushing mechanism. Hydrol. Processes 2006, 20, 4269–4286. [Google Scholar] [CrossRef]
- Huebsch, M.; Horan, B.; Blum, P.; Richards, K.G.; Grant, J.; Fenton, O. Impact of local weather conditions and agronomic practices on groundwater nitrogen content in a karst aquifer on an intensive dairy farm in Southern Ireland. Agric. Ecosyst. Environ. 2013, 179, 187–199. [Google Scholar] [CrossRef] [Green Version]
- Huebsch, M.; Fenton, O.; Horan, B.; Hennessy, D.; Richards, K.G.; Jordan, P.; Goldscheider, N.; Butscher, C.; Blum, P. Mobilisation or dilution? Nitrate response of karst springs to high rainfall events. Hydrol. Earth Syst. Sci. 2014, 18, 4423–4435. [Google Scholar] [CrossRef] [Green Version]
- Stuart, M.E.; Chilton, P.J.; Kinniburgh, D.G.; Cooper, D.M. Screening for long-term trends in groundwater nitrate monitoring data. Q. J. Eng. Geol. Hydrogeol. 2007, 40, 361–376. [Google Scholar] [CrossRef]
- Ferrier, R.C.; Whitehead, P.G.; Sefton, C.; Edwards, A.C.; Pugh, K. Modelling impacts of land use change and climate change on nitrate-nitrogen in the River Don, Northeast Scotland. Water Res. 1995, 29, 1950–1956. [Google Scholar] [CrossRef]
- Aubert, A.H.; Gascuel-Odoux, C.; Gruau, G.; Akkal, N.; Faucheux, M.; Fauvel, Y.; Grimaldi, C.; Hamon, Y.; Jaffrezic, A.; Le Coz-Bouhnik, M.; et al. Solute transport dynamics in small, shallow groundwater-dominated agricultural catchments: Insights from a high-frequency, multisolute 10 yr-long monitoring study. Hydrol. Earth Syst. Sci. 2013, 17, 1379–1391. [Google Scholar] [CrossRef]
- Aubert, A.H.; Gascuel-Odoux, C.; Merot, P. Annual hysteresis of water quality: A method to analyse the effect of intra-and inter-annual climatic conditions. J. Hydrol. 2013, 478, 29–39. [Google Scholar] [CrossRef]
- Bjarnason, S. Calculation of gross nitrogen immobilization and mineralisation in soil. Eur. J. Soil Sci. 1988, 39, 393–406. [Google Scholar] [CrossRef]
- Emmet, B.A.; Beier, C.; Estiarte, M.; Tietema, A.; Kristensen, H.L.; Williams, D.; Sowerby, A. The response of soil processes to climate change: Results from manipulation studies of shrublands across an environmental gradient. Ecosystems 2004, 7, 625–637. [Google Scholar] [CrossRef] [Green Version]
- Schulte RP, O.; Richards, K.; Daly, K.; Kurz, I.; McDonald, E.J.; Holden, N.M. Agriculture, meteorology, and water quality in Ireland: A regional evaluation of pressures and pathways of nutrient loss to water. Biol. Environ. Proc. R. Ir. Acad. 2006, 106, 117–133. [Google Scholar] [CrossRef] [Green Version]
- Borken, W.; Matzner, E. Reappraisal of drying and wetting effects on C and N mineralisation and fluxes in soils. Glob. Chang. Biol. 2009, 15, 808–824. [Google Scholar] [CrossRef]
- Leiros, M.C.; Trasar-Cepeda, C.; Seoane, S.; Gil-Sotres, F. Dependence of mineralisation of soil organic matter on temperature and moisture. Soil Biol. Biochem. 1999, 31, 327–335. [Google Scholar] [CrossRef]
- Morecroft, M.D.; Burt, T.P.; Taylor, M.E.; Rowland, A.P. Effects of the 1995–1997 drought on nitrate leaching in lowland England. Soil Use Manag. 2000, 16, 117–123. [Google Scholar] [CrossRef]
- McNeill, A.; Unkovich, M. The nitrogen cycle in terrestrial ecosystems. In Nutrient Cycling in Terrestrial Ecosystems; Springer: Berlin/Heidelberg, Germany, 2007; pp. 37–64. [Google Scholar]
- Bende-Michl, U.; Verburg, K.; Cresswell, H. High-frequency nutrient monitoring to infer seasonal patterns in catchment source availability, mobilisation and delivery. Environ. Monit. Assess. 2013, 185, 9191–9219. [Google Scholar] [CrossRef]
- Liu, R.; Zhang, P.; Wang, X.; Chen, Y.; Shen, Z. Assessment of effects of best management practices on agricultural non-point source pollution in Xiangxi River watershed. Agric. Water Manag. 2013, 117, 9–18. [Google Scholar] [CrossRef]
- Di, H.J.; Cameron, K.C.; Moore, S.; Smith, N.P. Nitrate leaching and pasture yields following the application of dairy shed effluent or ammonium fertilizer under spray or flood irrigation: Results of a lysimeter study. Soil Use Manag. 1998, 14, 209–214. [Google Scholar] [CrossRef]
- Whitehead, D.C. Grassland Nitrogen; CAB International: Varanasi, India, 1995. [Google Scholar]
- Francis, G.S.; Haynes, R.J.; Williams, P.H. Effects of the timing of ploughing-in temporary leguminous pastures and two winter cover crops on nitrogen mineralisation, nitrate leaching and spring wheat growth. J. Agric. Sci. 1995, 124, 1–9. [Google Scholar] [CrossRef]
- Hooker, K.V.; Coxon, C.E.; Hackett, R.; Kirwan, L.E.; O’Keeffe, E.; Richards, K.G. Evaluation of cover crop and reduced cultivation for reducing nitrate leaching in Ireland. J. Environ. Qual. 2008, 37, 138–145. [Google Scholar] [CrossRef] [PubMed]
- Premrov, A.; Coxon, C.E.; Hackett, R.; Kirwan, L.; Richards, K.G. Effects of over-winter green cover on groundwater nitrate and dissolved organic carbon concentrations beneath tillage land. Sci. Total Environ. 2014, 438, 144–153. [Google Scholar] [CrossRef] [PubMed]
- McAleer, E.; Coxon, C.; Richards, K.G.; Jahangir, M.; Grant, J.; Mellander, P.E. Groundwater nitrate reduction versus dissolved gas production: A tale of two catchments. Sci. Total Environ. 2017, 586, 372–389. [Google Scholar] [CrossRef] [PubMed] [Green Version]
- Fenton, O.; Coxon, C.E.; Haria, A.H.; Horan, B.; Humphreys, J.; Johnson, P.; Richards, K.G. Variations in travel time for N loading to groundwaters in four case studies in Ireland: Implications for policy makers and regulators. Ir. J. Agri-Environ. Res. 2009, 7, 129–142. [Google Scholar]
- Baily, A.; Rock, L.; Watson, C.J.; Fenton, O. Spatial and temporal variations in groundwater nitrate at an intensive dairy farm in south-east Ireland: Insights from stable isotope data. Agric. Ecosyst. Environ. 2011, 144, 308–318. [Google Scholar] [CrossRef]
- Fenton, O.; Schulte, R.P.; Jordan, P.; Lalor, S.T.; Richards, K.G. Time lag: A methodology for the estimation of vertical and horizontal travel and flushing timescales to nitrate threshold concentrations in Irish aquifers. Environ. Sci. Policy 2011, 14, 419–431. [Google Scholar] [CrossRef]
- Rivett, M.O.; Buss, S.R.; Morgan, P.; Smith, J.W.; Bemment, C.D. Nitrate attenuation in groundwater: A review of biogeochemical controlling processes. Water Res. 2008, 42, 4215–4232. [Google Scholar] [CrossRef]
- Jahangir MM, R.; Johnston, P.; Barrett, M.; Khalil, M.; Groffman, P.; Boeckx, P.; Fenton, O.; Murphy, J.; Richards, K.G. Denitrification and indirect N2O emissions in groundwater: Hydrologic and biogeochemical influences. J. Contam. Hydrol. 2013, 152, 70–81. [Google Scholar] [CrossRef]
- Hill, A.R.; Cardaci, M. Denitrification and organic carbon availability in riparian wetland soils and subsurface sediments. Soil Sci. Soc. Am. J. 2004, 68, 320–325. [Google Scholar] [CrossRef]
- Clague, J.C.; Stenger, R.; Clough, T.J. Evaluation of the stable isotope signatures of nitrate to detect denitrification in a shallow groundwater system in New Zealand. Agric. Ecosyst. Environ. 2015, 202, 188–197. [Google Scholar] [CrossRef]
- Nielsen, L.P.; Glud, R.N. Denitrification in a coastal sediment measured in situ by the nitrogen isotope pairing technique applied to a benthic flux chamber. Mar. Ecol. Prog. Ser. 1996, 137, 181–186. [Google Scholar] [CrossRef] [Green Version]
- Archbold, M.; Deakin, J.; Bruen, M.; Desta, M.; Flynn, R.; Kelly-Quinn, M.; Gill, L.; Maher, P.; Misstear, B.; Mockler, E.; et al. Contaminant Movement and Attenuation along Pathways from the Land Surface to Aquatic Receptors (Pathways Project); Synthesis Report; Environmental Protection Agency, Johnstown Castle, Co.: Wexford, Ireland, 2016. [Google Scholar]
- Mellander, P.E.; Melland, A.R.; Jordan, P.; Wall, D.P.; Murphy, P.N.; Shortle, G. Quantifying nutrient transfer pathways in agricultural catchments using high temporal resolution data. Environ. Sci. Policy 2012, 24, 44–57. [Google Scholar] [CrossRef]
- Wall, D.; Jordan, P.; Melland, A.; Mellander, P.-E.; Buckley, C.; Reaney, S.; Shortle, G. Using the nutrient transfer continuum concept to evaluate the European Union Nitrates Directive National Action Programme. Environ. Sci. Policy 2011, 14, 664–674. [Google Scholar] [CrossRef]
- Wall, D.P.; Murphy, P.N.C.; Melland, A.R.; Mechan, S.; Shine, O.; Buckley, C.; Mellander, P.E.; Shortle, G.; Jordan, P. Evaluating nutrient source regulations at different scales in five agricultural catchments. Environ. Sci. Policy 2012, 24, 34–43. [Google Scholar] [CrossRef]
- Mellander, P.-E.; Melland, A.; Murphy, P.; Wall, D.; Shortle, G.; Jordan, P. Coupling of surface water and groundwater nitrate-N dynamics in two permeable agricultural catchments. J. Agric. Sci. 2014, 152, 107–124. [Google Scholar] [CrossRef]
- Mellander, P.E.; Jordan, P.; Shore, M.; McDonald, N.T.; Wall, D.P.; Shortle, G.; Daly, K. Identifying contrasting influences and surface water signals for specific groundwater phosphorus vulnerability. Sci. Total Environ. 2016, 541, 292–302. [Google Scholar] [CrossRef]
- Thomas, I.; Jordan, P.; Mellander, P.-E.; Fenton, O.; Shine, O.; Ó Huallacháin, D.; Creamer, R.; McDonald, N.; Dunlop, P.; Murphy, P. Improving the identification of hydrologically sensitive areas using LiDAR DEMs for the delineation and mitigation of critical source areas of diffuse pollution. Sci. Total Environ. 2016, 556, 276–290. [Google Scholar] [CrossRef] [Green Version]
- Geological Survey of Ireland. Bandon GWB: Summary of Initial Characterisation. 2004. Available online: http://www.gsi.ie/nr/rdonlyres/2028caeb-3aee-4235-b1d5-7ebe575e139e/0/bandon.pdf (accessed on 1 July 2017).
- Daly, D.; Warren, W.P. Mapping groundwater vulnerability: The Irish perspective. In Groundwater Pollution, Aquifer Recharge and Vulnerability; Robins, N.S., Ed.; Special Publication; Geological Society: London, UK, 1998; Volume 130, pp. 170–190. [Google Scholar]
- Geological Survey of Ireland. Ballyglass GWB: Summary of Initial Characterisation. 2004. Available online: http://www.gsi.ie/NR/rdonlyres/977592CA-95B0-457C-88F5-AFA335D0F88C/0/Ballyglass.pdf (accessed on 1 July 2017).
- EPA. EPA Water Maps. Available online: https://gis.epa.ie/EPAMaps/Water (accessed on 1 January 2020).
- Schulte RP, O.; Diamond, J.; Finkele, K.; Holden, N.M.; Brereton, A.J. Predicting the soil moisture conditions of Irish grasslands. Ir. J. Agric. Food Res. 2005, 2019, 95–110. [Google Scholar]
- Premrov, A.; Schulte, R.P.O.; Coxon, C.E.; Hackett, R.; Richards, K.G. Predicting soil moisture conditions for Irish tillage free draining soil. Ir. J. Agric. Food Res. 2010, 49, 99–113. [Google Scholar]
- Allen, R.G.; Pereira, L.S.; Raes, D.; Smith, M. Crop Evapotranspiration-Guidelines for Computing Crop Water Requirements; FAO Irrigation and drainage paper 56; FAO: Rome, Italy, 1998; Volume 300, p. D05109. [Google Scholar]
- Vero, S.E.; Healy, M.G.; Henry, T.; Creamer, R.E.; Ibrahim, T.G.; Richards, K.G.; Mellander, P.-E.; McDonald, N.T.; Fenton, O. A framework for determining unsaturated zone 177 water quality time lags at catchment scale. Agric. Ecosyst. Environ. 2017, 236, 234–242. [Google Scholar] [CrossRef] [Green Version]
- EU Commission. Report from the Commission to the Council and the European Parliament on the Implementation of Council Directive 91/676/EEC Concerning the Protection of Waters Against Pollution Caused by Nitrates from Agricultural Sources Based on Member State Reports for the Period 2008–2011; EU Commission: Brussels, Belgium, 2018. [Google Scholar]
- Mockler, E.M.; Deakin, J.; Archbold, M.; Gill, L.; Daly, D.; Bruen, M. Sources of nitrogen and phosphorus emissions to Irish rivers and coastal waters: Estimates from a nutrient load apportionment framework. Sci. Total Environ. 2017, 601, 326–339. [Google Scholar] [CrossRef] [PubMed]
- Packham, I.; Mockler, E.; Archbold, M.; Mannix, A.; Daly, D.; Deakin, J.; Bruen, M. Catchment characterisation tool: Prioritising critical source areas for managing diffuse nitrate pollution. Environ. Modeling Assess. 2020, 25, 23–39. [Google Scholar] [CrossRef]
- Jahangir MM, R.; Fenton, O.; Müller, C.; Harrington, R.; Johnston, P.; Richards, K.G. In situ denitrification and DNRA rates in groundwater beneath an integrated constructed wetland. Water Res. 2017, 111, 254–264. [Google Scholar] [CrossRef] [PubMed]
- Cameron, K.C.; Wild, A. Potential aquifer pollution from nitrate leaching following the ploughing of temporary grassland. J. Environ. Qual. 1984, 13, 274–278. [Google Scholar] [CrossRef]
- Shepherd, M.A.; Hatch, D.J.; Jarvis, S.C.; Bhogal, A. Nitrate leaching from reseeded pasture. Soil Use Manag. 2001, 17, 97–105. [Google Scholar] [CrossRef]
- Velthof, G.L.; Hoving, I.E.; Dolfing, J.; Smit, A.; Kuikman, P.J.; Oenema, O. Method and timing of grassland renovation affects herbage yield, nitrate leaching, and nitrous oxide emission in intensively managed grasslands. Nutr. Cycl. Agroecosyst. 2010, 86, 401–412. [Google Scholar] [CrossRef] [Green Version]
- Ryden, J.C.; Ball, P.R.; Garwood, E.A. Nitrate leaching from grassland. Nature 1984, 311, 50–53. [Google Scholar] [CrossRef]
- Cameron, K.C.; Di, H.J.; Moir, J.L. Nitrogen losses from the soil/plant system: A review. Ann. Appl. Biol. 2013, 162, 145–173. [Google Scholar] [CrossRef]
- Dennis, S.J.; Moir, J.L.; Cameron, K.C.; Di, H.J.; Hennessy, D.; Richards, K.G. Urine patch distribution under dairy grazing at three stocking rates in Ireland. Ir. J. Agric. Food Res. 2011, 50, 149–160. [Google Scholar]
- Addiscott, T.M. Nitrate, Agriculture and the Environment; CABI Publishing: Cambridge, MA, USA, 2005. [Google Scholar]
- Di, H.J.; Cameron, K.C. Nitrate leaching in temperate agroecosystems: Sources, factors and mitigating strategies. Nutr. Cycl. Agroecosystems 2002, 64, 237–256. [Google Scholar] [CrossRef]
- Gabriel, J.L.; Muñoz-Carpena, R.; Quemada, M. The role of cover crops in irrigated systems: Water balance, nitrate leaching and soil mineral nitrogen accumulation. Agric. Ecosyst. Environ. 2012, 155, 50–61. [Google Scholar] [CrossRef] [Green Version]
- Hart, S.C. Potential impacts of climate change on nitrogen transformations and greenhouse gas fluxes in forests: A soil transfer study. Glob. Change Biol. 2006, 12, 1032. [Google Scholar] [CrossRef]
- Schmidt, I.K.; Tietema, A.; Williams, D.; Gundersen, P.; Beier, C.; Emmett, B.A.; Estiarte, M. Soil solution chemistry and element fluxes in three European heathlands and their responses to warming and drought. Ecosystems 2004, 7, 638–649. [Google Scholar] [CrossRef]
- Goulding, K. Nitrate leaching from tillage and horticultural land. Soil Use Manag. 2000, 16, 145–151. [Google Scholar] [CrossRef]
- Tyson, K.C.; Scholefield, D.; Jarvis, S.C.; Stone, A.C. A comparison of animal output and nitrogen leaching losses recorded from drained fertilized grass and grass/clover pasture. J. Agric. Sci. 1997, 129, 315–323. [Google Scholar] [CrossRef]
- Richards, K. Sources of Nitrate Leached to Groundwater in Grasslands of Fermoy, Co. Cork. Ph.D. Thesis, Trinity College Dublin, Dublin, Ireland, 1999. Unpublished. [Google Scholar]
- McDonald, N.T.; Watson, C.J.; Laughlin, R.J.; Lalor, S.T.J.; Grant, J.; Wall, D.P. Soil tests for predicting nitrogen supply for grassland under controlled environmental conditions. J. Agric. Sci. 2014, 152, 82. [Google Scholar] [CrossRef] [Green Version]
- Trolove, S.; Thomas, S.; van der Klei, G.; Beare, M.; Cichota, R.; Meenken, E. Nitrate leaching losses during pasture renewal–Effects of treading, urine, forages and tillage. Sci. Total Environ. 2019, 651, 1819–1829. [Google Scholar] [CrossRef]
- Seidel, K.; Kayser, M.; Müller, J.; Isselstein, J. The effect of grassland renovation on soil mineral nitrogen and on nitrate leaching during winter. J. Plant Nutr. Soil Sci. 2009, 172, 512–519. [Google Scholar] [CrossRef]
- Weier, K.L.; Doran, J.W.; Power, J.F.; Walters, D.T. Denitrification and the dinitrogen/nitrous oxide ratio as affected by soil water, available carbon, and nitrate. Soil Sci. Soc. Am. J. 1993, 57, 66–72. [Google Scholar] [CrossRef] [Green Version]
- Parkin, T.B. Soil microsites as a source of denitrification variability. Soil Sci. Soc. Am. J. 1987, 51, 1194–1199. [Google Scholar] [CrossRef] [Green Version]
- Jahangir, M.M.; Khalil, M.I.; Johnston, P.; Cardenas, L.M.; Hatch, D.J.; Butler, M.; Barrett, M.; O’Flaherty, V.; Richards, K.G. Denitrification potential in subsoils: A mechanism to reduce nitrate leaching to groundwater. Agric. Ecosyst. Environ. 2012, 147, 13–23. [Google Scholar] [CrossRef] [Green Version]
- Craswell, E.T. Some factors influencing denitrification and nitrogen immobilization in a clay soil. Soil Biol. Biochem. 1978, 10, 241–245. [Google Scholar] [CrossRef]
- Jahangir, M.M.R.; Johnston, P.; Khalil, M.; Richards, K.G. Linking hydrogeochemistry to nitrate abundance in groundwater in agricultural settings in Ireland. J. Hydrol. 2012, 448, 212–222. [Google Scholar] [CrossRef] [Green Version]
- Healy, R.W.; Cook, P.G. Using groundwater levels to estimate recharge. Hydrogeol. J. 2002, 10, 91–109. [Google Scholar] [CrossRef]


| Site | Soil Type (WRB) | Sand (%) | Silt (%) | Clay (%) | Textural Class | Bulk Density (g/cm3) | pH | Total C (%) | Total N (%) |
|---|---|---|---|---|---|---|---|---|---|
| Arable | Cambisol | 38 | 35 | 27 | Loam | 1.14 | 6.7 | 2.95 | 0.29 |
| Grassland | Cambisol | 46 | 37 | 17 | Loam | 1.2 | 6.5 | 3.84 | 0.37 |
| Grassland Catchment | ||||
|---|---|---|---|---|
| Grassland N | Grassland S | |||
| Hillslope Zone | a Well screen | Lithology | a Well screen | Lithology |
| Upslope | 7–10 | Bedrock | 13–16 | Bedrock |
| Midslope | 4–7 | c Fractured rock | 10.5–13.5 | Bedrock |
| Near stream | 2–3.5 | b Subsoil | 4–7 | c Fractured rock |
| Arable Catchment | ||||
| Arable N | Arable S | |||
| Hillslope Zone | a Well screen | Lithology | a Well screen | Lithology |
| Upslope | 12–15 | Bedrock | 16–19 | Bedrock |
| Midslope | 1–4 | Bedrock | 10.5–13.5 | c Fractured rock |
| Near stream | 1–4 | b Subsoil | 3.5–6.5 | c Fractured rock |
| Year | J | F | M | A | M | J | J | A | S | O | N | D | ||||||||||
|---|---|---|---|---|---|---|---|---|---|---|---|---|---|---|---|---|---|---|---|---|---|---|
| Arable catchment | ||||||||||||||||||||||
| Ploughing—spring crops | ||||||||||||||||||||||
| Sowing—spring crops | ||||||||||||||||||||||
| Spring N fertilizer applications | ||||||||||||||||||||||
| Ploughing—winter crops | ||||||||||||||||||||||
| Sowing—winter crops | ||||||||||||||||||||||
| Winter N fertilizer applications | ||||||||||||||||||||||
| Tillage harvest | ||||||||||||||||||||||
| Cover crops | ||||||||||||||||||||||
| Grassland catchment | ||||||||||||||||||||||
| Grazing grass | ||||||||||||||||||||||
| Grassland N fertilizer application | ||||||||||||||||||||||
| Grass Silage | ||||||||||||||||||||||
| Slurry applications | ||||||||||||||||||||||
| High application rates | ||||||||||||||||||||||
| Lower application rates | ||||||||||||||||||||||
| Category | Explanatory variable | Unit | Description | Range (Grassland) | Range (Arable) |
|---|---|---|---|---|---|
| Agronomic variables | Inorganic N | (kg N ha−1) | Annual inputs of inorganic fertiliser | 204–324 | 108–158 |
| Organic N | Annual inputs of slurry/manure | 0–121 | 0–47 | ||
| Stocking N | Annual inputs of organic N from stock | 92–194 | 0 | ||
| Total applied N | Total N application (chemical N + organic N + stocking N) | 341–516 | 104–186 | ||
| Meteorological variables | Total rainfall | (mm) | Total rainfall | 1003.2–1535.2 | 845.0–1175.0 |
| SMD | (mm) | Soil moisture deficit. | 0–72.9 | 0–43.7 | |
| Effective rainfall | (mm) | Total rainfall—actual evapotranspiration—SMD | 484.0–903.0 | 397.9–706.3 | |
| Hydrogeological variables | Watertable elevation | (maOD) | Monthly water table elevation above Ordnance Datum | 25.4–65.2 | 38.8–85.1 |
| Ground elevation | (maOD) | Ground elevation of each piezometer above Ordnance Datum | 25.8–70.8 | 39.8–85.4 | |
| First rock appearance | (m BGL) | First rock appearance (m BGL) | 1.4–7.3 | 2.8–4.0 | |
| Piezometer top | (maOD) | Top of each piezometer well screen above Ordnance Datum | 21.8–57.8 | 36.3–78.4 | |
| Piezometer bottom | (maOD) | Bottom of each piezometer well screen above Ordnance Datum | 18.8–54.8 | 33.3–74.4 | |
| Well screen length | (m) | Length of aquifer screened by piezometer | 1.5–3 | 3–4 | |
| Total GW depth | (m) | Total depth of each piezometer from ground surface to bottom of screen | 3.5–16 | 4–19 | |
| EM ground conductivity | (ms/m) | EM 38 electrical conductivity at each piezometer location (Figure 1 and Figure 2) | 3–12 | 1–12 |
| Hydrological Year 1 | Hydrological Year 2 | |||||||||||||||||||||||
|---|---|---|---|---|---|---|---|---|---|---|---|---|---|---|---|---|---|---|---|---|---|---|---|---|
| O | N | D | J | F | M | A | M | J | J | A | S | O | N | D | J | F | M | A | M | J | J | A | S | |
| Agronomic drivers: Annualised per calendar year | ||||||||||||||||||||||||
| Meteorological drivers: | ||||||||||||||||||||||||
| Four-month driver integration | ||||||||||||||||||||||||
| Nine-month driver integration | ||||||||||||||||||||||||
| Six-month driver integration incorporating maximum lag | 5-month lag | |||||||||||||||||||||||
| * Six-month driver integration (zero lag) | ||||||||||||||||||||||||
| NO3− recharge (response) period | ||||||||||||||||||||||||
| Year | 2010 | 2011 | 2012 | 2013 | 2014 | 2015 | 2016 |
|---|---|---|---|---|---|---|---|
| Catchment Meteorology | |||||||
| Rainfall (mm/year) | 1012.7 | 1029.2 | 1129.4 | 1003.2 | 1175.6 | 1468.0 | 1011.8 |
| SMD (max) | 58.3 | 49.1 | 34.4 | 72.9 | 66.4 | 37.8 | 49.7 |
| % of year with a SMD > 5mm | 55.9 | 46.3 | 35.5 | 48.2 | 49.9 | 43.0 | 45.5 |
| Effective rainfall (mm/year) | 554.3 | 494.8 | 716.0 | 484.0 | 632.4 | 903.0 | 484.4 |
| Catchment Agronomy | |||||||
| b Grassland N | |||||||
| Inorganic N (kg N ha−1) | 211.3 | 225.2 | 266.9 | 323.7 | 203.5 | 203.5 | a nd |
| Organic N (kg N ha−1) | 28.1 | 44.9 | 0.0 | 0.0 | 44.9 | 44.9 | a nd |
| Stocking N (kg N ha−1) | 172.0 | 192.0 | 194.0 | 192.0 | 145.0 | 151.0 | a nd |
| Total available N (kg N ha−1) | 411.4 | 462.1 | 460.9 | 515.7 | 393.5 | 399.5 | a nd |
| c Grassland S | |||||||
| Inorganic N (kg N ha−1) | 252.0 | 276.1 | 255.9 | 307.3 | 264.8 | 267.7 | a nd |
| Organic N (kg N ha−1) | 89.9 | 0.0 | 30.0 | 106.3 | 121.3 | 91.4 | a nd |
| Stocking N (kg N ha−1) | 142.7 | 91.7 | 116.7 | 91.7 | 112.7 | 104.3 | a nd |
| Total available N (kg N ha−1) | 340.6 | 367.8 | 402.6 | 505.3 | 498.8 | 463.4 | a nd |
| Year | 2010 | 2011 | 2012 | 2013 | 2014 | 2015 | 2016 |
|---|---|---|---|---|---|---|---|
| Catchment Meteorology | |||||||
| Rainfall (mm/year) | 942.1 | 845.0 | 1115.0 | 886.6 | 1175.0 | 1103.4 | 923.8 |
| SMD (max) | 36.8 | 40.4 | 39.3 | 43.7 | 36.2 | 39.2 | 39.8 |
| % of year with a SMD > 5mm | 33.9 | 32.3 | 34.8 | 44.4 | 23.2 | 46.6 | 37.3 |
| Effective rainfall (mm/year) | 517.5 | 397.9 | 628.7 | 484.3 | 706.3 | 619.2 | 503.7 |
| Catchment Agronomy | |||||||
| b Arable N | |||||||
| Inorganic N (kg N ha−1) | 103.8 | 137.1 | 137.1 | 107.7 | 139.0 | 139.0 | a nd |
| Organic N (kg N ha−1) | 0 | 0 | 0 | 42.5 | 47.2 | 47.2 | a nd |
| Stocking N (kg N ha−1) | 0 | 0 | 0 | 0 | 0 | 0 | a nd |
| Total available N (kg N ha−1) | 103.8 | 137.1 | 137.1 | 150.2 | 186.2 | 186.2 | a nd |
| c Arable S | a nd | ||||||
| Inorganic N (kg N ha−1) | 144.5 | 156.6 | 158.3 | 151.3 | 144.5 | 155.5 | a nd |
| Organic N (kg N ha−1) | 0 | 0 | 0 | 0 | 0 | 0 | a nd |
| Stocking N (kg N ha−1) | 0 | 0 | 0 | 0 | 0 | 0 | a nd |
| Total available N (kg N ha−1) | 144.5 | 156.6 | 158.3 | 151.3 | 144.5 | 155.5 | a nd |
Publisher’s Note: MDPI stays neutral with regard to jurisdictional claims in published maps and institutional affiliations. |
© 2022 by the authors. Licensee MDPI, Basel, Switzerland. This article is an open access article distributed under the terms and conditions of the Creative Commons Attribution (CC BY) license (https://creativecommons.org/licenses/by/4.0/).
Share and Cite
McAleer, E.; Coxon, C.; Mellander, P.-E.; Grant, J.; Richards, K. Patterns and Drivers of Groundwater and Stream Nitrate Concentrations in Intensively Managed Agricultural Catchments. Water 2022, 14, 1388. https://doi.org/10.3390/w14091388
McAleer E, Coxon C, Mellander P-E, Grant J, Richards K. Patterns and Drivers of Groundwater and Stream Nitrate Concentrations in Intensively Managed Agricultural Catchments. Water. 2022; 14(9):1388. https://doi.org/10.3390/w14091388
Chicago/Turabian StyleMcAleer, Eoin, Catherine Coxon, Per-Erik Mellander, Jim Grant, and Karl Richards. 2022. "Patterns and Drivers of Groundwater and Stream Nitrate Concentrations in Intensively Managed Agricultural Catchments" Water 14, no. 9: 1388. https://doi.org/10.3390/w14091388
APA StyleMcAleer, E., Coxon, C., Mellander, P.-E., Grant, J., & Richards, K. (2022). Patterns and Drivers of Groundwater and Stream Nitrate Concentrations in Intensively Managed Agricultural Catchments. Water, 14(9), 1388. https://doi.org/10.3390/w14091388