Next Article in Journal
Salt Removal by Chemically Modified Graphene in Capacitive Deionization (CDI)
Next Article in Special Issue
Correction: Ortega Guerrero, M.A. Numerical Analysis of the Groundwater Flow System and Heat Transport for Sustainable Water Management in a Regional Semi-Arid Basin in Central Mexico. Water 2022, 14, 1377
Previous Article in Journal
Analysis of Climate Variability in a Time Series of Precipitation and Temperature Data: A Case Study in Cartagena de Indias, Colombia
Previous Article in Special Issue
Effect of Fault Extension Relevant to Unconformity on Hydrothermal Fluid Flow, Mass Transport, and Uranium Deposition
 
 
Correction published on 2 June 2022, see Water 2022, 14(11), 1797.
Article

Numerical Analysis of the Groundwater Flow System and Heat Transport for Sustainable Water Management in a Regional Semi-Arid Basin in Central Mexico

by
Marcos Adrián Ortega Guerrero
Centro de Geociencias, Campus Juriquilla, Universidad Nacional Autónoma de México, Blvd. Juriquilla No. 3001, Santiago de Querétaro 76230, Mexico
Water 2022, 14(9), 1377; https://doi.org/10.3390/w14091377
Submission received: 1 March 2022 / Revised: 19 April 2022 / Accepted: 20 April 2022 / Published: 24 April 2022 / Corrected: 2 June 2022

Abstract

:
The Independence Basin is located in a semi-arid region of Mexico, delimited predominantly by volcanic mountains. Around 30 m3/s of water are extracted from regional aquifers mainly for agro-export activities, causing declines in the water table of up to 10 m/a, increased temperature and dissolved elements that are harmful to health and the environment. Regional groundwater coupled flow and heat transport under current conditions were studied on a basin-wide scale (7000 km2) using a three-dimensional finite-element model under steady-state conditions to provide support for water management decisions and transient modeling. Isothermal, forced and free thermal convection under existing hydrological conditions prior to pumping are analyzed. The results show that the interaction of topography-driven groundwater flow and buoyancy-driven free thermal convection are consistent with historical hydrological records, the characteristics of the water table, and thermal anomalies observed in the basin. The simulated groundwater recharge is near 7 ± 0.25 m3/s, a balance broken since the 1980s by extensive pumping. The results show the importance of considering the groundwater temperature, its transient response in the evolution of groundwater extraction, and the upward migration of a thermal front through the fractured aquifer that has increased risks for health and sustainability.

1. Introduction

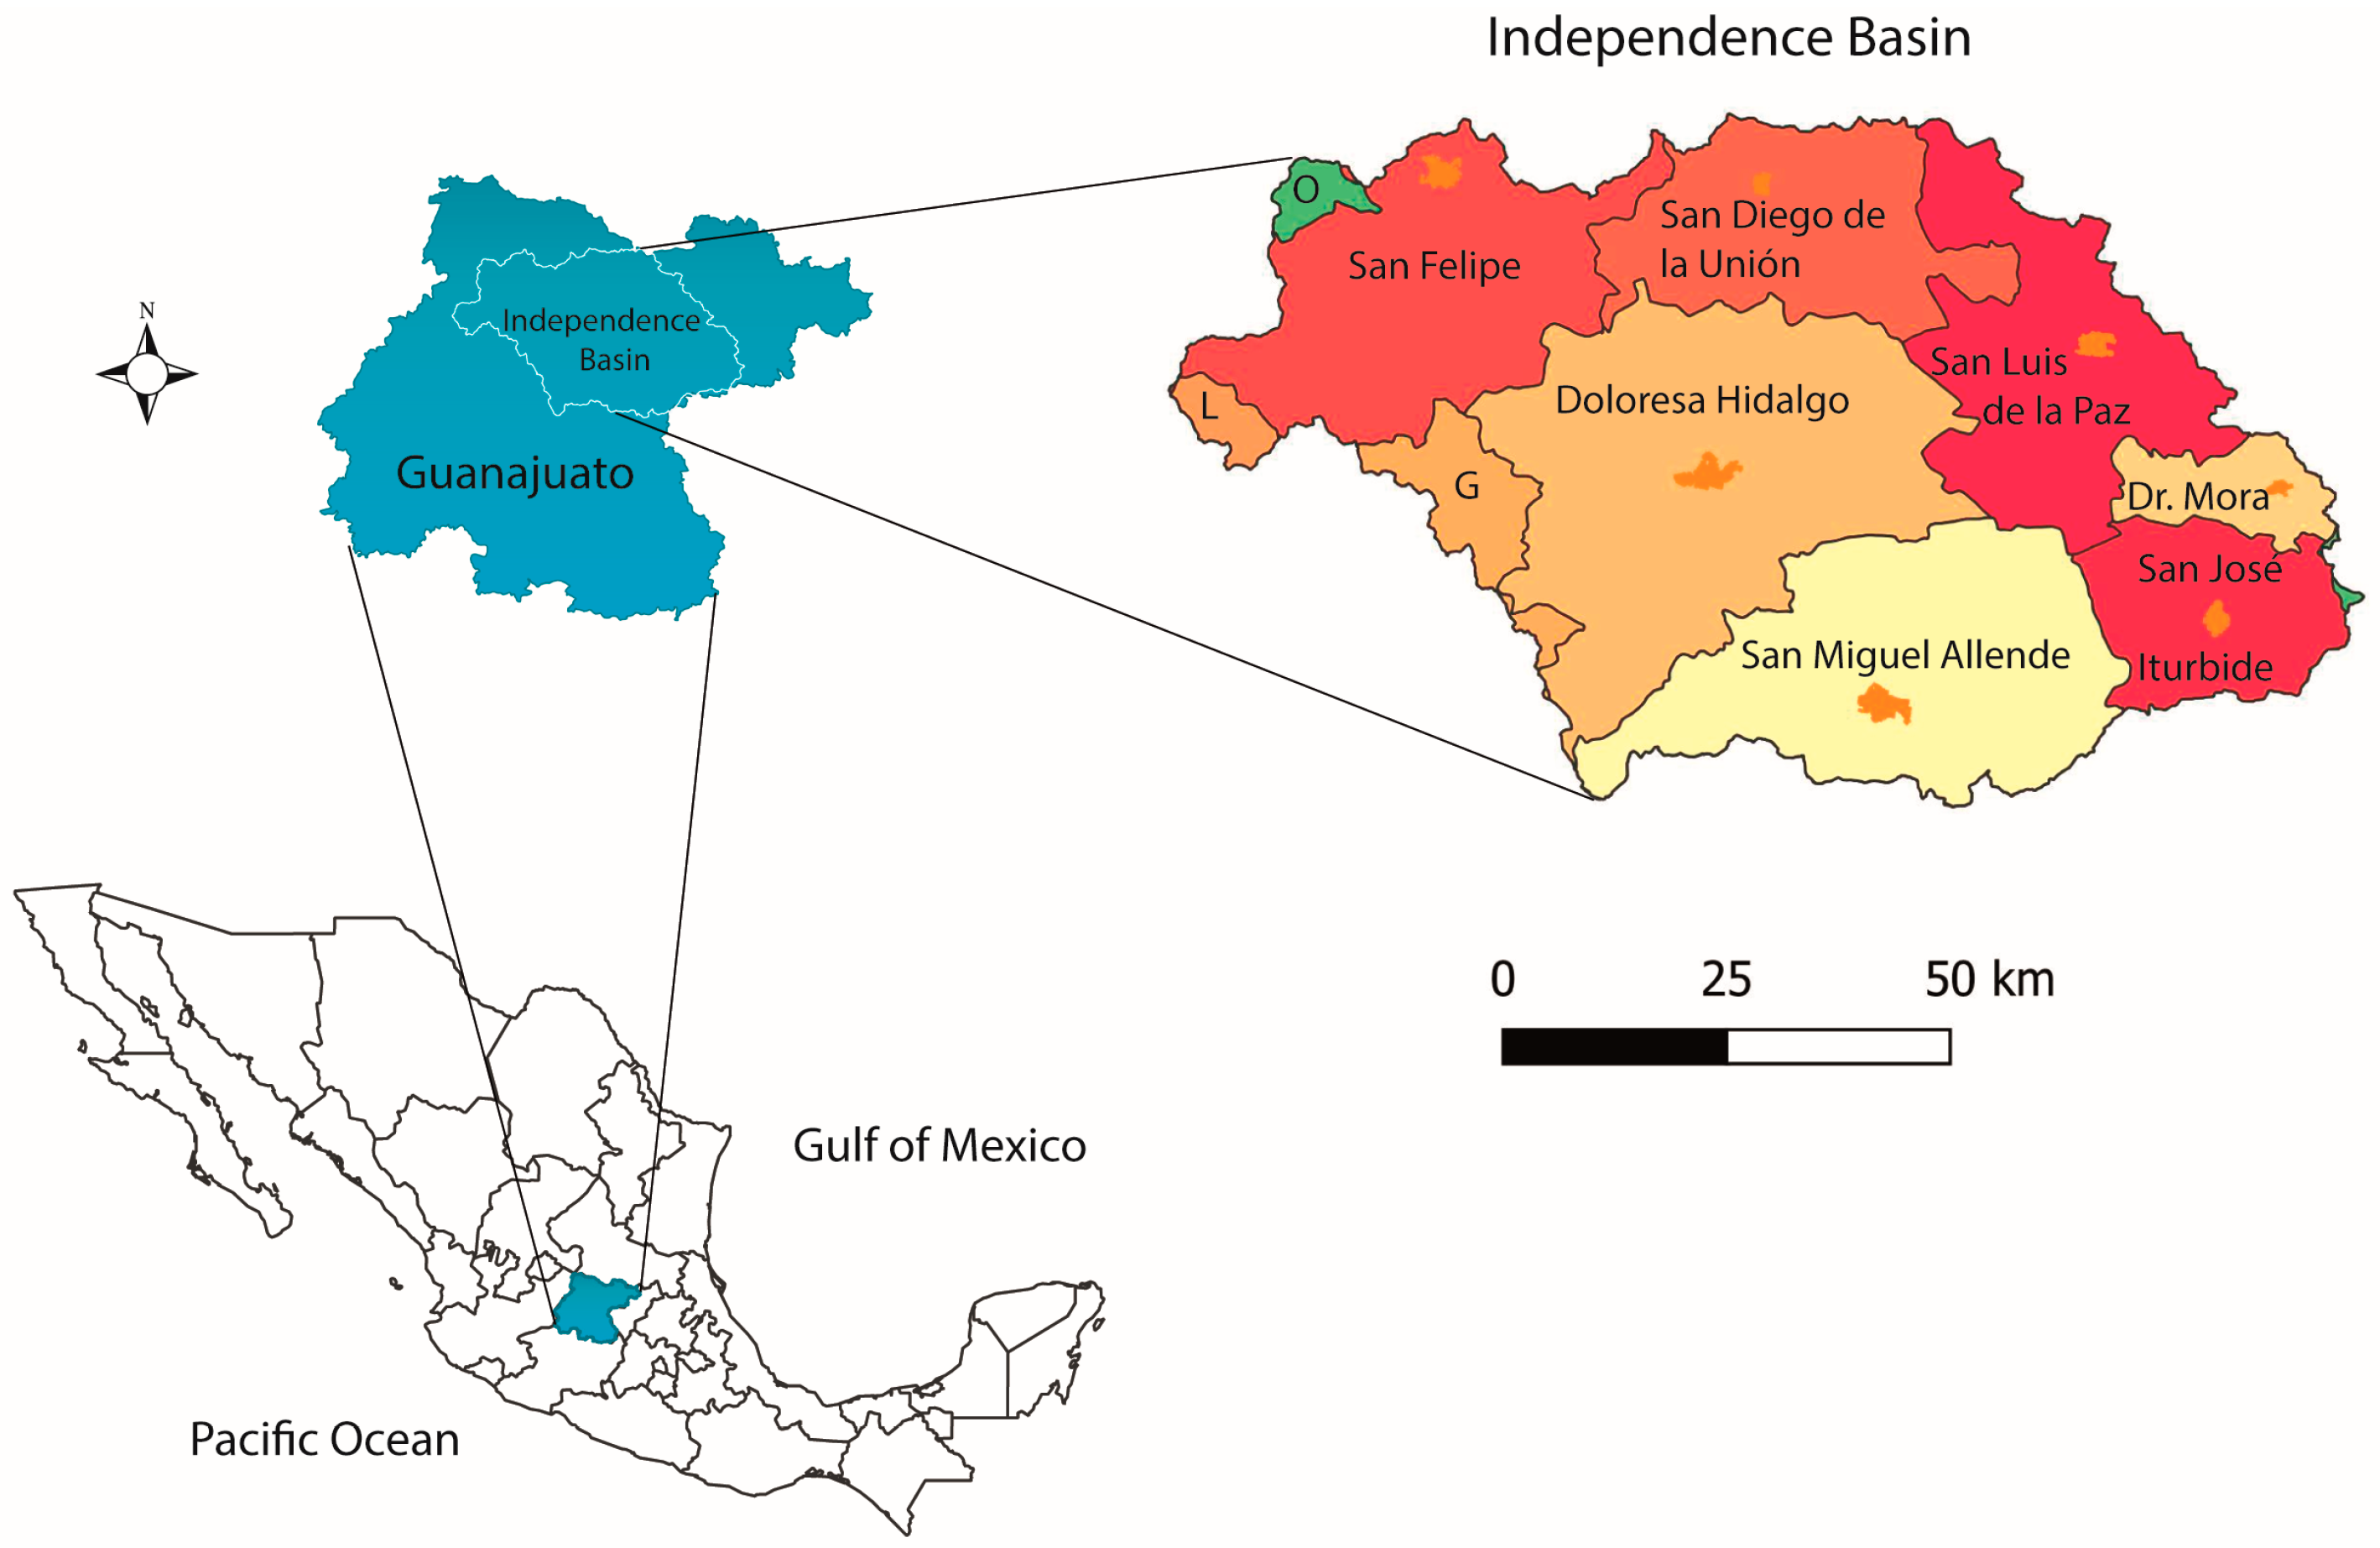
Description of the Study Basin

The Independence Basin (IB) is representative of the new paradigm of water management in Mexico, introduced in 2000 with the incorporation of the Gravitational Systems of Groundwater Flow into the comprehensive study of water on the scale of hydrological basins. The earlier paradigm was characterized by artificial administrative limits imposed on watersheds and aquifers that began to dominate in the 1970s and 1980s. That approach divided the natural basin, officially called the Cuenca Alta del Río La Laja (Upper La Laja River Basin), into four or six artificial administrative units [1,2].
Covering an area of 7000 km2, the IB is in the state of Guanajuato in the semi-arid region of Mexico (Figure 1). It forms part of the continental watershed that separates the Lerma-Chapala basin, which drains towards the Pacific Ocean, from the Pánuco basin that drains into the Gulf of Mexico. Seven important municipalities exist in the IB: Dolores Hidalgo, San Felipe, San Diego de la Unión, San Luis de la Paz, Dr. Mora, San José Iturbide, and San Miguel de Allende (Figure 1). They have a combined population of over 500,000 inhabitants who depend almost exclusively on groundwater for human consumption, agriculture, and industry. Around 30 m3/s are currently being extracted from two aquifers, one granular and the other fractured. Around 80% is for agro-export industries. Various thermal anomalies are observable in springs and wells in the basin [2].
Elevations in the basin vary from 1840 m above sea level (masl) at its exit from the Allende Dam to 2900 masl in the San José Iturbide (S-SJI), San Diego de la Unión (S-SDU) and Guanajuato sierras (S-G). In the central area, an elevation of 2000 masl predominates, while altitudes in the other mountains range from 2500 to 2800 masl: Sierra Santa Bárbara (S-SB), Sierra San Luis de la Paz-Mineral de Pozos (S-SLP-MP), Sierra Doctor Mora (S-DM), Sierra San José Iturbide-Zamorano (S-SJI), Sierra Picachos-Támbula, and Sierra Codornices (S-C) (Figure 2).
Two shallow lakes (Juagué Nandé, Curi Nitz) existed until the second half of the 16th century in the eastern part of the IB, but were drained during the conquest. Curi Nitz remained as a wetland [3,4] (Figure 2). Pumping from the main aquifers began in the early 20th century with the drilling of the first wells. Extraction increased substantially in the early 1980s, causing a lowering of the water table, a temperature increase over time, and regional contamination of groundwater, with severe impacts for health and the environment [1,2]. While several studies of groundwater flow and water quality have been carried out in the IB, none have included a comprehensive analysis of the regional flow considering the effects of temperature. Numerous mathematical models have been applied to the study of artificial administrative aquifers since the 1980s, but they have relied on the assumed boundary conditions of the aquifers. Factors such as mountain massifs, the configuration of the water table in the mountains, and the hydraulic connections between mountains and the main aquifers have not yet been evaluated, despite the importance of understanding the long-term response of the basin and its aquifers to intense pumping and harmful solute migration.
The purpose of this research was to determine the hydrological influence of the mountain ranges on hydraulic conditions in the main aquifers in the IB by identifying the limits between the major units using three-dimensional modeling of evidence on the natural conditions of flow and heat transport that existed before the destruction of forests by mining activity in the 17th century and the progressive increase in pumping since the 1950s. The study is significant because it provides insight into the coupled analysis of flow system-heat transport to support realistic modeling of the aquifers’ transient, long-term response to pumping. It also provides a basis for understanding solute transport, a condition that exists in other regions of Mexico due to the country’s geological evolution.
This long-term study will also improve our understanding of the groundwater flow system in the region to help prevent, control, and mitigate negative impacts on health and the environment caused by the migration of thermal water rich in arsenic, fluoride, and other elements, possibly induced by the accelerated lowering of the water table.

2. Hydrogeology of the Basin

2.1. Geology

The IB is located in the vicinity of three geological provinces: the Sierra Madre Occidental, Trans-Mexican Neovolcanic Belt, and North American plate, where various types of rocks and sediments exist due to complex geological evolution. The lithological units that outcrop in the IB are divided into two large groups: basal complex and Cenozoic cover [5,6]. The former is composed of volcano-sedimentary rocks of Lower Cretaceous age related to the Guerrero Terrain, and a sequence of island arcs [7,8]. The latter has two members: (1) volcanic rocks of predominantly rhyolitic composition and sediments that date from the Eocene to the early Miocene, associated with the evolution of the Sierra Madre Occidental (SMOc); and (2) intermediate-to-mafic volcanic rocks and sediments with trace back to the late Miocene to late Pliocene [9,10,11].
Volcanic activity in the region has alternated with periods of intense erosion and sedimentation that filled tectonic depressions, forming the current granular aquifer in the central area. During the Cenozoic, the main structures were faults and fractures, products of extension which cut stratigraphic units that allow us to distinguish several faulting events that occurred from the Paleocene-Eocene to the Pliocene, and possibly into the Pleistocene [5,12]. The Basin is also at the limits of two geothermal provinces: the Central Intraplate Volcanism and Mexican Volcanic Belt (MVB) [13].

2.2. Hydrostratigraphy

From a hydrogeological perspective, there are two main aquifers, one fractured generally with volcanic rocks of rhyolitic and ignimbritic composition, and the other granular, made up of lacustrine and volcanoclastic deposits [2]. The fractured aquifer outcrops mainly in the mountains that delimit the basin and in Tertiary volcanic assemblages that extend underground. The granular aquifer covers the fractured aquifer inside the basin with average thicknesses of 100–200 m and, though only in four areas associated with rift valleys, 300–400 m. Approximately 80% and 20%, respectively, of existing wells are in the granular and fractured aquifers, which are exploited individually and in a mixed mode indicative of hydraulic continuity between them.

2.3. Natural Manifestations of Groundwater Conditions

Figure 2 shows the different types of evidence associated with the regional groundwater flow systems in the basin, such as lacustrine zones, springs, saline soils, and phreatophytic vegetation. Evidence is concentrated in two specific zones: (1) the eastern zone (San Luis de la Paz-Dr. Mora-San José Iturbide); and (2) the central-southeastern zone (Dolores Hidalgo-San Miguel de Allende).
In pre-Hispanic times, two important lakes — Juagué-Nandé and Curi-Nitz (Figure 2) — existed, both regulated by the Chichimecas (a First Nation People that inhabited north and lower-west Mexico) by means of dams [4]. Based on digital topographic information, the Juagué-Nandé Lake (now known as Laguna Seca [dry lake]) is delimited by the elevation of 1990 masl, while the lacustrine influence on the Curi-Nitz Lake (site of the La Cebada dam) extended to the town of Dr. Mora, formerly Charcas (i.e., accumulation of water on the ground [pond]) (Figure 2). Saline soils developed in two main areas: El Salitre, where the Curi Nitz Lake existed, and Tequisquiapan (place on the tequesquite (salt) river, or saltpeter) in the main area of groundwater discharge in the central area of the IB delimited by the area inside the blue circle (Figure 2).
The founding of major cities in the basin occurred in zones with springs (SF, SLP, SDU, SMA,) and areas with shallow water tables (SJI-DM). Important thermal springs have been described near the La Laja River, between the cities of SMA and DH, called Xoté, Montecillo, and Atotonilco (place of hot water) [3]. All these cities are in the main discharge zone in the central area of the basin. Numerous springs have been reported over time in mountainous areas, but most have disappeared.

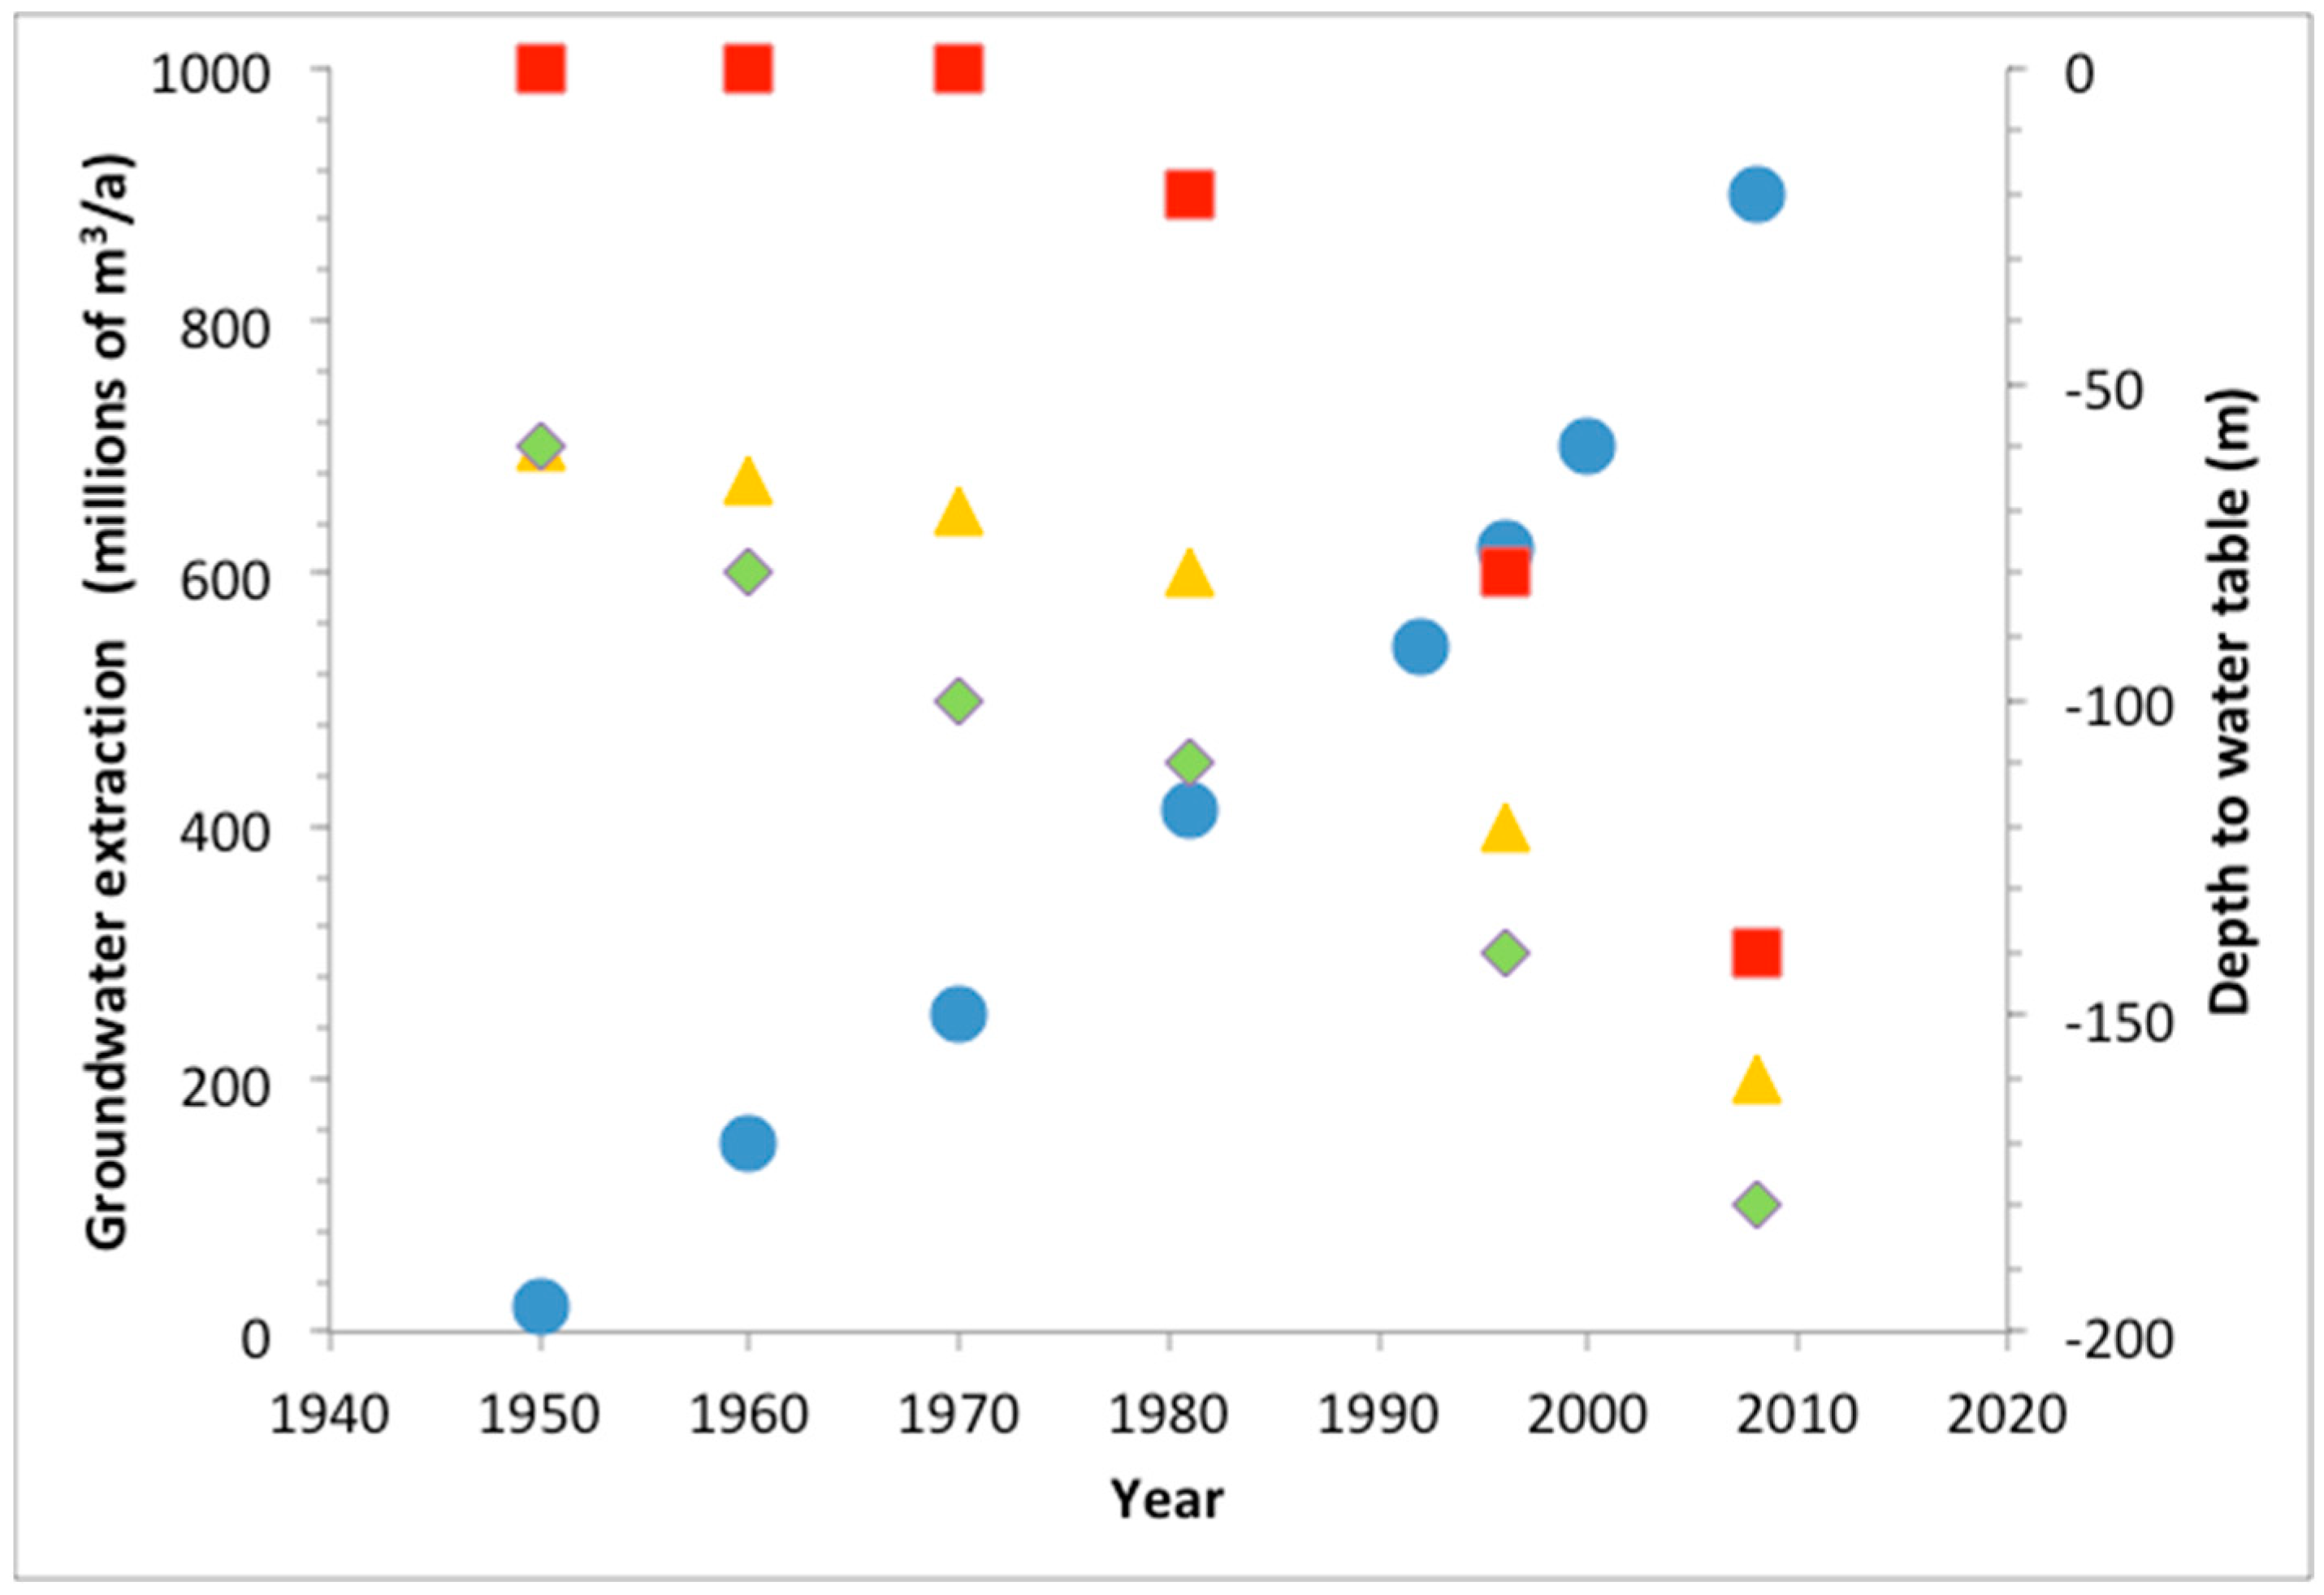
2.4. Historical and Current Manifestations of Groundwater Conditions

The presence of a water table in the mountain massifs surrounding the IB is evident from the mining activity that has been ongoing since the 18th century, especially in the Mineral de Pozos and Guanajuato districts (Figure 2). In the late 19th century, many mines were flooded during a period when mining had been suspended due to Mexico’s War of Independence (1810–1821) [14,15]. Based on the depth of the flood levels and the elevation of the terrain, the position of the hydraulic head in the mountains was estimated in the range of 2200–2400 m. In the central area of the basin and the proximities of the La Laja River, various thermal groundwater anomalies are still observable in springs in the Atotonilco-Tequisquiapan discharge area, the site of numerous spas, and in the temperature of several wells near the basin.

2.5. Preliminary Water Budget

Three methods were applied to estimate the range of values for the groundwater budget in the basin: (a) infiltration rates from average precipitation; (b) base flow from total streamflow in the La Laja River based on old records; and (c) the evolution of water table decline due to groundwater extraction in 1950–2010. Annual average precipitation over a 50-year period was 477.6 ± 119.9 mm; evaporation was 1906.6 ± 167 mm and the aridity index was 0.2547 ± 0.0747 in the central area of the basin [16] and 850 mm in the Sierra de Guanajuato [17]. At the outlet from the basin, average rainfall was 497.9 mm and the potential evaporation above 2000 mm [18]. In a first stage of analysis, different infiltration rates were considered for both the mountainous areas and the lowlands. To include the effect of rainfall with the topography, various infiltration rates proportional to the elevation of the terrain were established using the range of precipitation.
Previous analyses of the regional groundwater flow in the Basin of Mexico (P = 600 mm–1200 mm) and the Amacuzac Basin (P = 800 mm–1500 mm), both southeast of the IB, found that a recharge of 30–50% of the average precipitation was representative for the hydrogeological study [19,20]. In the semi-arid environment of the IB, however, lower recharge rates are expected.
Total streamflow in the La Laja River, between 1970 and 2000, showed a general decline from 475 × 106 m3/a in 1971 (three years after construction of the Allende dam at the exit of the basin) to about 100 × 106 m3/a in 2000; this can be explained by the effects of groundwater extraction. Minimum baseflow represented 20 × 106 m3/a (5%) to 34 × 106 m3/a (13%) of total streamflow in the 1970s [18]. These baseflow values may be underestimated because they were considered as the minimum streamflow rates and were not calculated by separation of the unitary hydrographs.
Groundwater extraction in the basin began in the 1950s. Evidence of a significant decline in the water table appeared in the late 1970s as groundwater extraction increased from about 300 × 106 m3/a to 412 × 106 m3/a in 1980, with significant regional declines in the water table, which signal that the safe yield was exceeded and that over extraction from the aquifer had begun (Figure 3).
These three ways of approaching the water budget in the IB give an idea of the limits of the modeling analysis in terms of recharge and the hydrogeological conditions of the domain.

2.6. Previous Modeling

Several models have been applied in the IB on a regional scale to evaluate groundwater extraction under isothermal conditions, but comprehensive numerical simulations including coupled fluid flow and heat transport for the hydrogeological settings have not yet been carried out in the region.

3. Materials and Methods

A three-dimensional, finite-element model was used to study the regional flow characteristics of the saturated zone under steady-state conditions in the IB, for both isothermal conditions and temperature-dependent parameters. For the numerical analysis, the natural conditions were considered before the lakes were drained and prior to deforestation due to mining activities and pumping.

3.1. Conceptual Model of Flow

The conceptual model of flow is based on the groundwater conditions in the IB described in the previous section and the following considerations: (1) the flow system is gravity driven; (2) on the basin scale, there is a dynamic equilibrium between inputs and outputs, so the flow system can approximate a steady-state flow field; (3) K is homogeneous in each hydrogeological unit with main directions aligned with the coordinate axis, though anisotropic; (4) on a regional scale, fractured media can be estimated by equivalent porous media; (5) the water table in the mountains cannot be consistently higher than the topography; (6) its elevation cannot be too low either because this would be inconsistent with the existence of some springs or due to the position of the historical water table; (7) the flow at the boundary cannot be greater than the existing precipitation ranges [20,21,22,23,24,25,26,27,28,29,30,31,32,33]; and (8) in the scenarios in which the numerical analysis of coupled flow-heat transport processes is carried out, the role of topography in heat transport is considered in addition to the above assumptions [34,35,36,37].
Hydraulic conductivity and recharge rate values were adjusted to meet natural constraints, achieve a reasonable position of the water table in the mountains, and reproduce the general features of the flow and thermal patterns in the discharge zones. In addition, field visits and the collection and review of available field data on regional geological information, published hydrogeological studies in the basin with information on wells, piezometric data, results of pumping tests, and static data on river levels were all carried out. Information on precipitation rates, records of direct runoff at the outlet of the La Laja River and infiltration, along with digital topographic, hydrological, soil, and vegetation maps on different scales were used, and reference was made to geochemical and isotopic field data for some parts of the producing aquifers [1,2].

3.2. Modeling of the Flow System and Heat Transport

The physical system is represented by the three-dimensional scheme shown in Figure 2, where the groundwater flow system is assumed to be steady-state and the aquifer material is stratified and homogeneous but anisotropic. Three scenarios are analyzed (Table 1): (1) topography-driven groundwater flow where the fluid is considered isothermal, diluted, and incompressible, with the two types of thermal convection (forced and free); (2) interaction of topography-driven groundwater flow and forced convection with constant fluid viscosity and linear dependence of density on temperature (Convective 1); and (3) interaction of topography-driven groundwater flow and buoyancy-driven free thermal convection (Convective 2) with variable both density and viscosity. Based on the results of these simulations, two-dimensional cross-sections were constructed, parallel to the flow direction in the basin from the main mountain ranges to the La Laja River, passing through points where more detailed, reliable hydrogeological information is available. The following sections present information on the distribution of the hydraulic head, Darcy flux, and temperature for the scenarios analyzed.

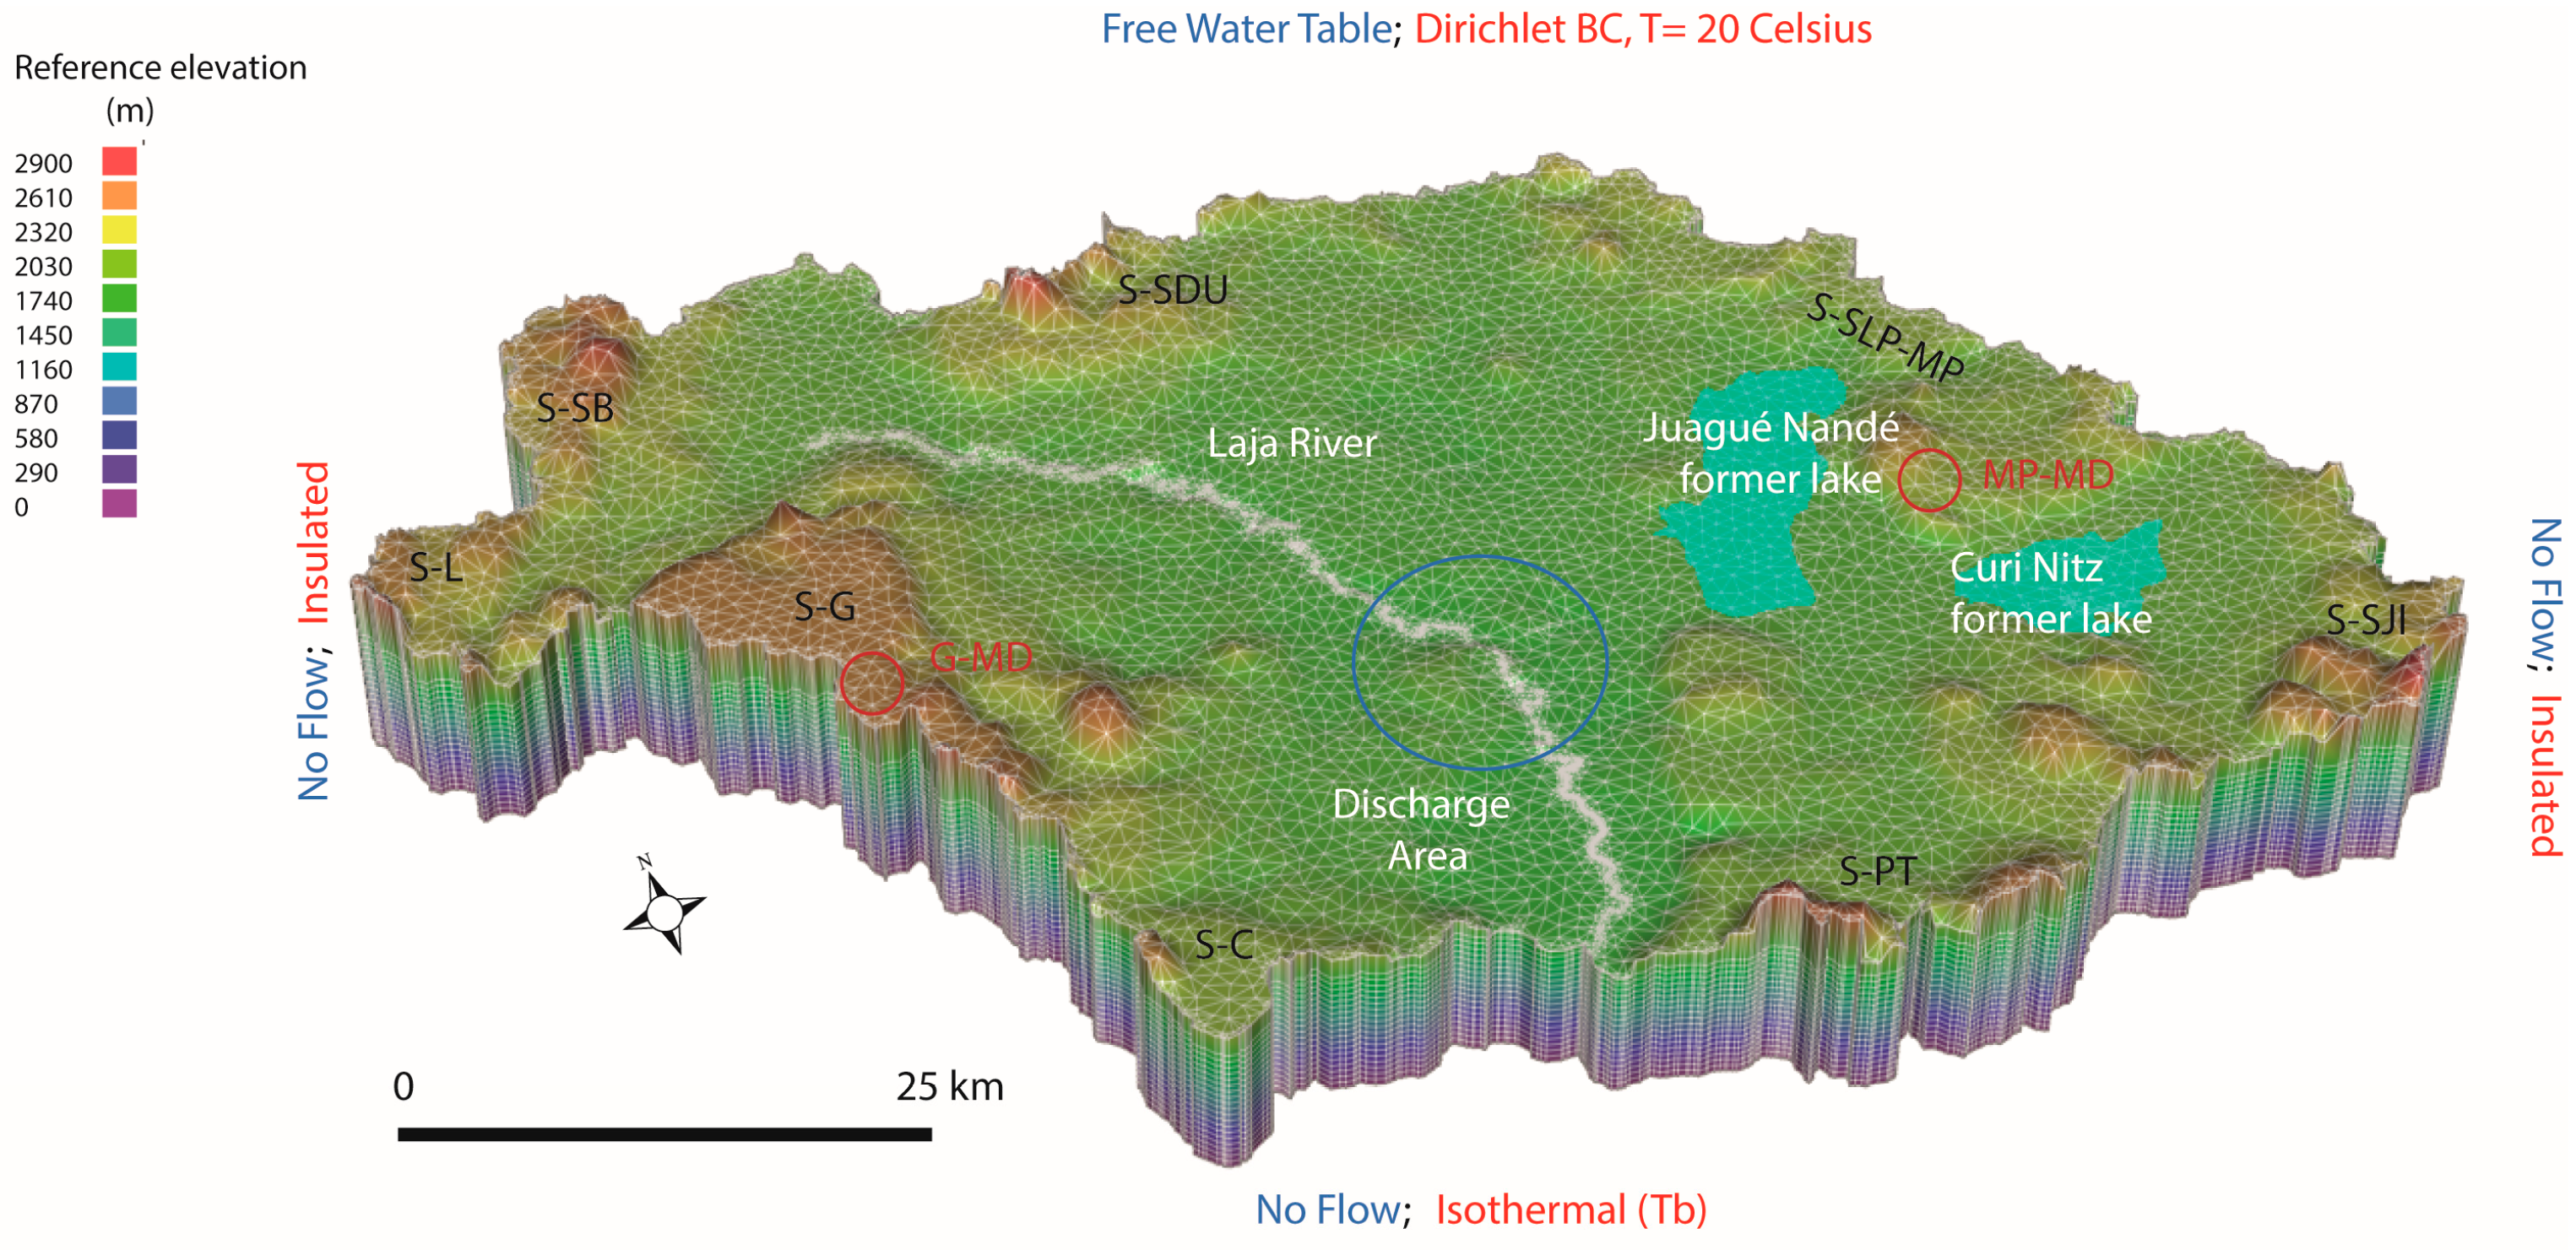
3.2.1. Description of the Numerical Model

The model used is FEFLOW® 6.2, which solves the equations governing flow, mass, and heat transport in porous and fractured media using a multidimensional, finite-element method for complex geometric and parametric situations, including variable fluid density, variable saturation, free surface(s), multispecies reaction kinetics, and non-isothermal flow effects. This model satisfied the assumptions described above and directly solved potentials and heat transport, with details of the theory by [38].
A temperature-based equation describing three-dimensional conductive and advective heat transfer in a porous medium [39] is:
t ( ϕ w ρ w c w T + ϕ s ρ s c s T ) = · [ ρ w c w T µ w k ( P + ρ w g z ) ] + · ( K T m | · T ) + S h
where ϕ is the volume fraction of water (w), solid (s) and mixed water–solid properties (m); T(x,y,z,t) is the temperature field in three spatial dimensions over time; ρ is material density; c is specific heat; ρc is the volumetric heat capacity; Sh is for heat sinks or sources; ρwcw is the heat energy transfer by the movement of the fluid mass through the porous medium; k is the solid’s permeability; KT is thermal conductivity.
For nonlinear temperature-dependent density [38]:
ρ ( T ) = a + b T + c T 2 + d T 3 + e T 4 + f T 5 + g T 6
where, a = 9.99838 × 10²; b = 6.764771 × 10⁻²; c = −8.993699 × 10⁻³; d = 9.143518 × 10⁻⁵; e = −8.90073913 × 10⁻⁷; f = 5.291959 × 10⁻⁹; g = −1.359813 × 10⁻¹¹.
For temperature-dependent viscosity [38]:
ζ = T 150 100 ;   ζ o = T o 150 100
μ μ o = 1 + 0.7063 · ζ o 0.04832   ( ζ 0 ) 3 1 + 0.7063 · ζ 0.04832   ( ζ ) 3
where, μ is the fluid viscosity and μo is the dynamic water viscosity.

3.2.2. Boundary Conditions

Figure 2 shows the boundary conditions for potentials and temperature. The lateral boundaries of the basin and its lower boundary constitute no-flow boundaries. The boundary condition along the water table (upper boundary) is a flow or second-type (Neumann) boundary. The position of the water table adjusts to inflow because the position is unknown a priori. The solution is therefore iterative until the water table converges to its final position for the specified parameters and conditions. The reference for hydraulic potentials is sea level, where volcanic and sedimentary rocks of marine origin at that depth are considered impermeable.
As part of the analysis, upper limits of 1990 m and 2050 m — representing the approximate former surface elevation of the Juagué Nandé and Curi Nitz lakes — were specified for the upper limit. The elevation of the La Laja River was specified as a Dirichlet-type boundary. The length of this boundary, as a discharge zone, was modified throughout the flow and heat transport simulations for comparisons to the hydrogeological evidence gathered in the field.
For temperature, the lateral borders are isolated or non-conductive. The upper and lower boundaries are of the Dirichlet type with constant temperatures of 20 °C and 100 °C, respectively. Along the discharge zone represented by the La Laja River, a strip between 1 and 5 km wide was left open on each side to determine the temperature distribution.
The flow domain was discretized in an unstructured three-dimensional mesh of 6000 linear pentahedra and 20 layers, each one separated by 100 m. The map scale used for this work was based on the INEGI digital elevation model (2019). Contour lines spaced every 10 m were derived for terrain elevation using QGIS®.

3.2.3. Modeling Strategy
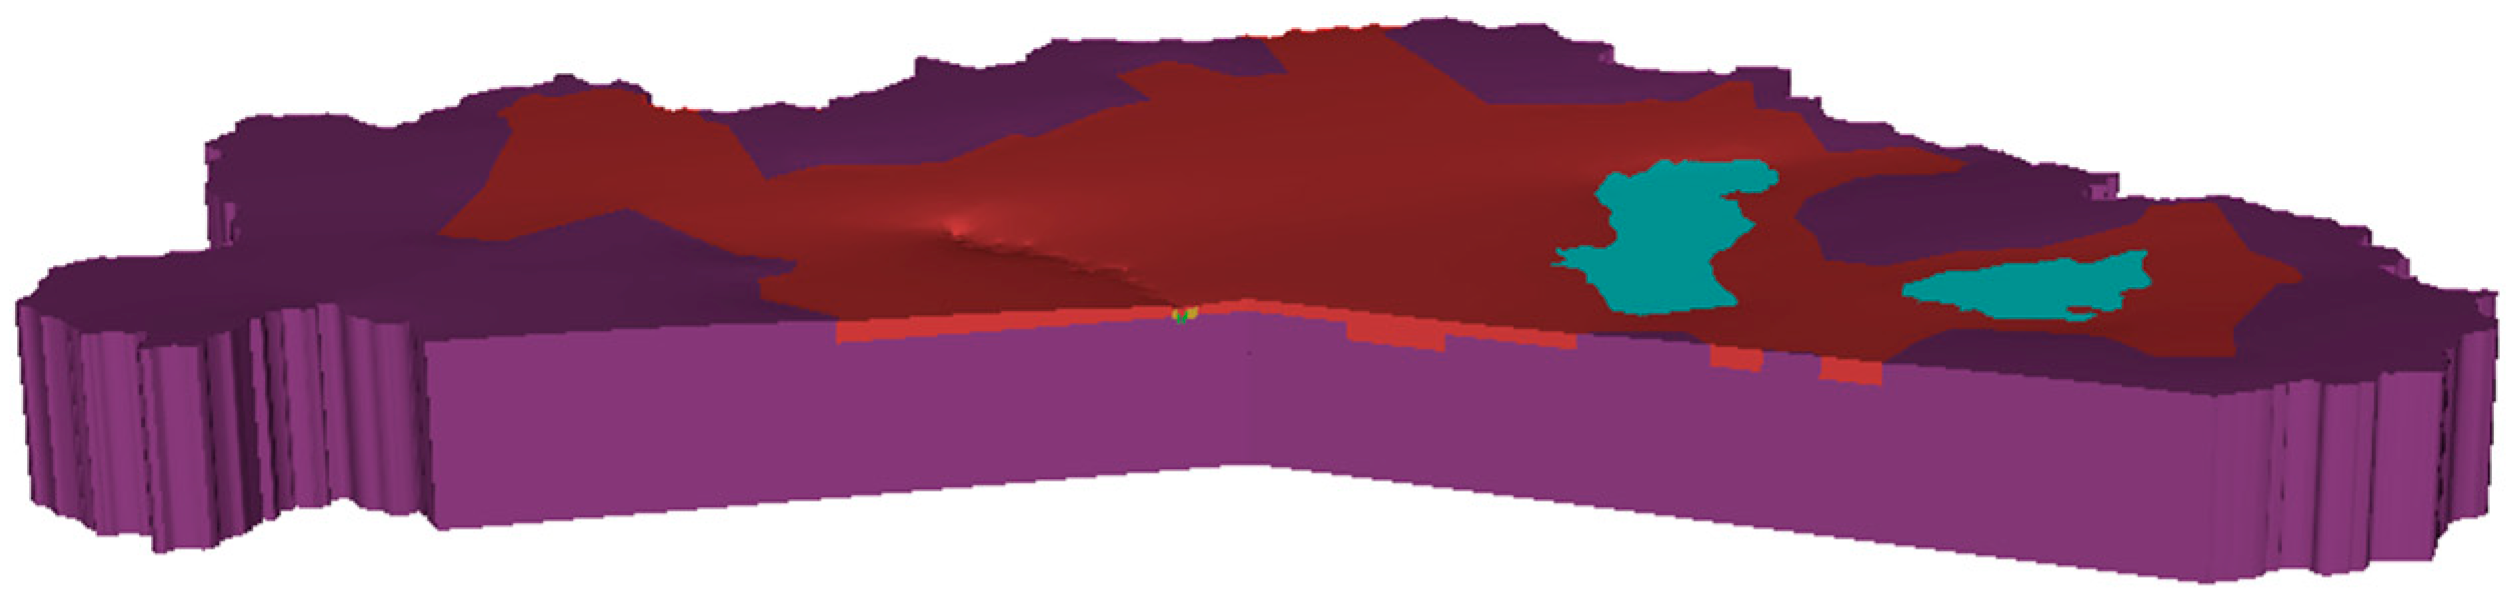
The domain of Figure 2 was modeled in two aquifers—one granular, the other fractured—considering a simplification of the hydrostratigraphy. The former had an average thickness of 200–400 m; the fractured aquifer was at the limits of the basin with continuity towards its interior below the granular one. Based on this geometry, the effects of different infiltration rates of the average annual precipitation with altitude in the flow domain were studied, varying the hydraulic conductivities of the hydrogeological units and using alternative boundary conditions within the range of established values. Of interest for this analysis are the configuration of the water table and the distribution of temperature due to convection in the system.
After several simulations, the regional flow conditions for the potentials and temperature distributions in the IB were reproduced reasonably with respect to the hydraulic field data. The distribution of potentials, flow lines, and groundwater temperature were used to explain the manifestations observed in flow and the possible effects on the system after artificial drainage of lake water, deforestation, and pumping.

4. Results

Table 2 presents the parameters used to analyze flow and heat transport. Hydraulic conductivity values show good agreement with those measured in other hydrogeological studies and reports in the literature. Figure 4 shows the distribution of the granular (Kxx = 1 m/d) and fractured (Kxx = 0.1 m/d) aquifers. Anisotropy is 0.1 for Kyy and 0.01 for Kzz.
The modeling results for the three scenarios described in Table 1 are grouped below as: (1) hydraulic head distribution in the 3D domain with cut planes to show its behavior in the subsoil (Figure 5a–c); (2) Darcy flow in plan view with the location of two sections parallel to the flow direction in 2D, one from the western mountains to the La Laja river (W-Laja), the other from the river to the eastern mountains (Laja-E) (Figure 6a–c); (3) hydraulic head distribution and Darcy Flow in the W-Laja section (Figure 7a–c); (4) distribution of hydraulic load and Darcy Flow in the Laja-E section (Figure 8a–c); (5) distribution of hydraulic load and temperature in the W-Laja section (Figure 9a,b); (6) distribution of hydraulic load and temperature in the Laja-E section (Figure 10a,b); and (7) distribution of hydraulic loads and temperature in the 3D domain (Figure 11a,b). The second and third scenarios underscore the role of forced thermal convection transport mechanisms in the IB.
After conducting numerous simulations to establish the infiltration rate for the hydraulic conductivity distribution that best reproduces the hydrogeological conditions observed, a rate was obtained based on the elevation of the terrain that ranged from 0.5 × 10⁻⁵ m/d at 1800 masl to 1.35 × 10⁻⁵ m/d at 3000 masl, an increase of 6.67 × 10⁻⁷ m/d for every 100 m of elevation. In this procedure, we considered equal elevation curves every 10 m. These infiltration rates generated annual balances that were similar in all three scenarios, in the range of 219 × 106 m3/a ± 8 × 10⁶.
The distribution of the equipotential lines of the domain in 3D for scenarios I and II are presented in Figure 5a,b. Distributions are quite similar. Maximum values were close to 2700 m in the mountain ranges to the northwest and north of the basin (SG, S-SDU), while values for the other ranges approach 2300 m. The results of scenario III contrast with I and II because the equipotential lines are reduced by up to 200 m in mountainous areas due to the dependence of water viscosity and density on temperature (Figure 5c). In all three cases, the progressive decrease of the equipotential lines with depth is evident, clearly defining the recharge zones represented by the mountain ranges that delimit the basin, while the value of the equipotential lines in the vicinity of the La Laja River decreased progressively towards the surface, indicating the discharge zone. In the river, an equipotential line at 1950 m determined by the boundary conditions is observed. Figure 7 and Figure 8a,b display the relation of the equipotential lines in greater detail with the direction of flow and the Darcy flow.
The horizontal component of the Darcy flux (m/d) for the three scenarios is shown in Figure 6a–c. This flow is similar in scenarios I and II, where the maximum flow is on the order of 0.7 m/d (Figure 6a,b), which contrasts with scenario III, where the flux is almost double, at 1.32 m/d (Figure 6c). The flow in the recharge zones is lower, in a range of 6 × 10−05 m/d to 6 × 10−04 m/d, while around the discharge zones this increases to 5 × 10−03 m/d, and near the La Laja River it reaches 1.5 × 10⁻¹ m/d, and occasionally 4.4 × 101 m/d. In scenario III, this relationship is doubled in the recharge and discharge zones (Figure 6c).
The behavior of the equipotential lines and Darcy flow along the W-Laja section is also similar for scenarios I and II, where the equipotential lines range from values of 2600 m in the mountains to 1950 m at the river. The Darcy flow, defined by the magnitude and color of the “bullets” in the recharge zone, is 1 × 10⁻⁴ m/d with a descending vertical component in the first 10 km. This later increases to a horizontal movement for 40–50 km with a Darcy flow of 1 × 10⁻⁴ m/d to 1 × 10⁻³ m/d, before finally discharging in an upwards movement towards the La Laja River with a Darcy flux as high as 4 × 10⁻² m/d (Figure 7a,b). In scenario III, the equipotential lines are reduced by as much as 300 m with respect to the two previous cases, and vary along the section from 2300 m in the S-G to 1950 at the La Laja River. In scenario III, these flow rates are doubled (Figure 7c).
For the Laja-E section, the behavior of the equipotential lines and Darcy flow present small differences for scenarios I and II (Figure 8a,b). In the first case, the 2150 equipotential is well-defined in the easternmost range, but in the second it barely develops, and in scenario III the 2100 m equipotential is deployed in the mountain range, 50 m less than in scenarios I and II (Figure 8c). In the area of the former lakes an upward flow is defined. In the vicinity of the La Laja River the equipotential lines converge at 1900 m. The development of the equipotential lines in scenarios I and II differs with respect to scenario III, where the distribution of the 2000 m equipotential is of special interest.
In scenarios II and III, which analyze the effect of groundwater flow on heat transport, there is a deformation of the initial distribution of isotherms (convective field) due to the three-dimensional flow in the basin conditioned by topography. This phenomenon can be observed in two sections: W-Laja and Laja-E (Figure 9 and Figure 10). In the W-Laja section, the direction of groundwater movement in the recharge zone is downwards and the temperature gradient increases with greater depth, while in the discharge zone the temperature gradient decreases with greater depth and the movement of groundwater is ascending.
However, in terms of the interaction of topography-driven groundwater flow and buoyancy-driven free thermal convection, the flow conditions generate behaviors with important differences. In the first case, there is a difference in the magnitude of the equipotential lines that shows a disparity of up to 300 m in the recharge zone that is higher in scenario II and affects the hydraulic gradient and Darcy flow. The latter is two-fold higher in scenario III. Second, there is a contrast in the shape and distribution of the equipotential lines. In scenario II, the recharge zone is defined in the upper two-thirds with lateral movement in the lower third. The ascending gradient begins in the vicinity of contact with the granular medium and increases around the La Laja River (Figure 9a). In scenario III, in contrast, the movement of groundwater has a downward component over practically the entire length. Only in the last 20 km does a lateral flow develop at a medium depth, and only in the last 10 km does the upward movement develop towards the La Laja River (Figure 9b).
In the second cross-section (Laja-E), the direction of groundwater movement and the temperature gradient are generally similar to those of the previous cross-section (W-Laja), though the sites of the ancient lakes show an upwards flow, and a greater amount of heat flux is defined towards the base of the lakes (Figure 10a,b).
Finally, Figure 11 shows the deformation of the initial distribution of isotherms (convective field) due to the effect of the three-dimensional flow of groundwater in the basin, conditioned by topography. The location and shape of the 2000 m equipotential line is characteristic for each scenario. In scenario II it closes in the vicinity of the La Laja River, clearly marking the discharge of groundwater (Figure 11a), while in scenario III this equipotential continues to condition the movement of water downwards at the almost 2.5 km depth of the domain. The location of the 1950-m equipotential line at the La Laja River and at greater depths concentrates the discharge zone along a length of 5 km (Figure 11b).
Both figures show thermal anomalies on the La Laja River, with a greater amount of heat flow on the surface that, during the simulation process, made it possible to determine the extension of the discharge zone. Temperatures above the river are as high as 50 °C.

5. Discussion

The coupled effects of topography groundwater flow and heat transport in a simplified homogeneous and anisotropic geological medium were studied on the scale of the basin to assess the sustainability of groundwater and support future transient modeling by means of a three-dimensional model under stationary conditions. The results of the coupled flux and heat modeling analyses are consistent with previous studies in other areas of the world. Groundwater flow on the basin scale is controlled by numerous factors: the configuration of the water table [35,36,37,40,41,42], the effects of temperature on fluid density and viscosity in heterogeneous anisotropic media [37,43], the effect of hydraulic conductivity contrasts and temperature boundaries [44], the three-dimensional flow field with the variations and areal distribution of heat affected by relief on the water table and permeability variations [37,45], advective heat transfer [29,30,42,45,46], temperature distributions for paleoflow systems [47,48], the modeling of heat as a groundwater tracer [49] and of large-scale flow [38], and the significance of basin asymmetry and geothermal assessments [36,37,50], among many others.
Present results have important implications for several aspects related to the sustainability of the basin studied. The numerical analyses indicate that groundwater in the IB is controlled by a gravitational flow system with buoyancy-driven free thermal convection heat transport, which satisfactorily reproduces the hydrogeological conditions prior to deforestation, the development of kilometers of mining conduits, drainage from the lake and pumping, such as the position of the water table, and evidence of discharge from the flow system that includes vegetation, soils, and thermal water anomalies.
The natural recharge in the scenarios analyzed is similar and converges at a value of 219 × 106 m3/a ± 8 × 10⁶ (7 ± 0.25 m3/s), which contrasts with the extraction volume estimated in 2020 at 1000 × 106 m3/a (32 m3/s), which is over four times higher. This situation explains (i) many of the negative impacts reported in the basin over the past two decades [2,51,52,53] due to the lowering of the water table by 2–10 m/a caused by the concentration of pumping (Figure 3); (ii) the progressive temperature increase of water in the wells; and (iii) the occurrence and progressive increase of chemical elements that are harmful to health and the environment.
Since 2000, an urgent strategy has been employed to mitigate the negative health and environmental impacts in terms both qualitative and quantitative. The strategy was designed to change the paradigm of groundwater management in this basin, in the state of Guanajuato, and across the country. To date, some progress has been achieved.
A qualitative health impact on children was carried out in 2003. The quantitative impact of fluoride in drinking water has been studied in the basin [51,52]. In fact, an extension of the National University ENES-León opened in 2011 to train professionals in odontology, agronomical administration, and physiotherapy to attend to some aspects of these problems, but the programs offered do not include hydrogeology.
We have held several work meetings with water administrators since 2000, including the National Water Commission (CNA, now CONAGUA), the State Water Commission (CEASG), and Municipal Operating Agencies. In addition, we have met with representatives of agricultural and livestock organizations, civil organizations, and the society in general in the basin.
Courses on the nature of groundwater (120 h each) have been designed for, and offered to, government officials, academics, decision makers, and the general public to present our research results in a comprehensive way (2000, 2002, 2009–2010, 2017). The last two courses were offered free of charge due to the conditions of poverty in which many communities live.
The central theme of the XXXIII International Congress of Hydrogeologists (2004) was “Understanding Regional Groundwater Flow”. There, Dr. J. Tóth was informed of the results of our research in the IB in a meeting with state officials. Dr. Tóth described the IB as a perfect combination of a unitary-composite basin.
We also had contact with the Senate of the Republic, in the 2004–2008 period, to present the groundwater problems at the IB and elsewhere in the country, and to insist on the need to reduce pumping and change the criteria for groundwater administration [53].
Between 2015 and 2017, an academic team presented the Groundwater Law Proposal, which posits the Tothian-Freezean Gravitational Groundwater Flow Systems (GGWFS) as a basis for water administration in Mexico [54].
In 2020, a series of seven virtual seminars on GGWFS were organized for the National Council of Science and Technology (CONACYT) with the participation of numerous professionals in this field and numerous social groups. A special issue on water that stressed the importance of the GGFS approach was published in the first issue of the outreach magazine Science and Humanities in 2021 [55].
In 2020, a comprehensive research project for the understanding and restoration of flow systems was authorized with funding through CONACYT’s National Strategic Programs (PRONACE-CONACYT). Most unfortunately, the COVID-19 pandemic caused its cancelation, primarily because key participants became ill and suffered side effects that prevented them from continuing the work.
Productive and conservation alternatives aimed at reducing extraction and promoting adaptation to climate change in the basin have been also proposed [16].
Future work will focus on strategic water management in the IB to improve population health and foment sustainable environmental exploitation and future economic development. Establishing scenarios for preventing, controlling, and mitigating negative impacts on health and the environment must consider the combined effect of the response of groundwater flow to temperature, since knowledge of gravitational groundwater flow systems from the local to the basin scale has progressed. However, this will require continuous modeling of diverse aspects of solute transport (Fluoride and Arsenic, among others) and analyzing the effect of hydraulically conductive faults and boundary conditions, especially in the transition zone to the Mexican Volcanic Belt (MVB) ([13]. It is also important to strengthen social participation and elaborate legislative frameworks to achieve sustainable development goals.

6. Conclusions

The groundwater flow and convective heat transport system in the Independence Basin was simulated using a three-dimensional finite-element model of the hydrogeological conditions described in the literature, data files, field observations, and historical accounts. The model produced a classic gravity flow system that modifies the conductive temperature distribution and is sensitive to matrix-incorporated factors, recharge, and input function. It proved to be fully consistent with hydrogeological research.
Three scenarios were analyzed to identify the dominant physical mechanisms that explain the topography-driven groundwater flow system and the distribution and magnitude of temperature anomalies in the basin: a) isothermal conditions; b) forced convection; and c) the effect of thermal buoyancy. The combined topography-driven groundwater flow and buoyancy-driven movements, analyzed by applying the model, emerged as the one most compatible with the water table, thermal anomalies, and other hydrogeological evidence.
The hydraulic conductivities of the hydrostratigraphic units used in the model were taken from the best available sources. In the case of the granular medium, the average data from the pumping tests of various studies — official and private — were used. Conductivity values for the fractured medium were estimated from field observations of the nature of the rocks and ranges of values cited in the literature.
The model was also used to calculate the water table in the basin, from the mountainous regions to the main river. Results show the gross unsaturated zone and the locations and elevations of the hot springs known from historical references and current observations that correspond to the saline soils and groundwater-dependent vegetation in the discharge zones.
The three-dimensional flow of groundwater in the basin conditioned by topography distorts the initial distribution of isotherms (convective field) causing the geothermal gradient to increase at greater depths in the recharge area but to decrease with greater depth in the discharge area near the La Laja river and discharge zones represented by the ancient lakes.
In tests using higher values for recharge, the water table was too high, but when lower values were used, the water level was too low to be compatible with the hydraulic conductivity distribution of the hydrogeological units and field observations.
The distribution of rainfall in the basin varies with elevation. The simulated groundwater recharge in the sierras would represent 10% of the current average precipitation and 4% in the lower parts, consistent with the semi-arid conditions of the region, where the groundwater flow balance entering and leaving the system is 219 × 106 ± 8 × 10⁶ m3/a (7 ± 0.25 m3/s).
Although the effects of deforestation, mining conduits, and drainage of the ancient lakes were not assessed, this recharge value in the basin would explain that: (1) around 40% was discharged as base flow into the La Laja River in the 1970s; (2) the piezometric decreases in the basin began in the 1980s when the balance between recharge and discharge was broken; and (3) the increase in temperature in wells with the increase in dissolved ions in the last three decades were due to induced thermal migration of regional flows.
Before pumping began in the lower parts of the IB, groundwater flowed mainly into the La Laja River, but pumping has reversed the gradients such that the flow in the upper part of the granular aquifer converges towards the heavily pumped zones with an ascending thermal flow component and an increase in dissolved ions, many of them harmful to human health and the environment.
The modeling analysis clearly demonstrates the main characteristics of the flow system, heat transport, and boundary conditions that must be taken into account in any realistic modeling of the long-term response of the aquifer to pumping.

Funding

No Financial support was provided for this study. This document is dedicated to the people of the Independence Basin, especially to children.

Institutional Review Board Statement

No applicable.

Informed Consent Statement

No applicable.

Data Availability Statement

No applicable.

Acknowledgments

I thank Roberto A. Ortega for professional advice on geophysics, Francisco Cevallos Urueta (+), Jaime Ocampo (+) and Francisco Rivera (+) for advice and encouragement.

Conflicts of Interest

The authors declare no conflict of interest. The funders had no role in the design of the study, in the collection, analysis, or interpretation of data, in the writing of the manuscript, or in the decision to publish the results.

References

  1. Ortega-Guerrero, M.A.; Castellanos, J.Z.; Aguilar, G.R.; Vázquez-Alarcón, A.; Alanis, R.E.; Vargas, C.C.; Urrutia, E.F. A Conceptual Model for Increases of Sodium, Sar, Alkalinity and ph at the Independence Aquifer in Guanajuato, Mexico; TERRA Latinoamericana: Mexico City, Mexico, 2002; Volume 20, pp. 199–207. Available online: https://www.redalyc.org/articulo.oa?id=57320213 (accessed on 10 September 2021).
  2. Ortega-Guerrero, M.A. Occurrence, distribution, hydrochemistry and origin of arsenic, fluoride and other trace elements dissolved in groundwater at basin scale in central Mexico. Rev. Mex. Ciencias Geol. 2009, 26, 143–161. [Google Scholar] [CrossRef]
  3. González, P. Geografía Local del Estado de Guanajuato, 1st ed.; Ediciones La Rana: Guanajuato, Mexico, 1904; p. 691. [Google Scholar]
  4. Tarquín, A.G. Leyendas y Tradiciones de la Tribu Chichimeca; Ediciones del Gobierno de Guanajuato: Guanajuato, Mexico, 1963; p. 135. [Google Scholar]
  5. Nieto-Samaniego, A.F.; Macias-Romo, C.; Alaníz-Álvarez, S.A. Nuevas Edades Isotópicas de la Cubierta Volcánica Cenozoica de la Parte Meridional de la Mesa Central; Revista Mexicana de Ciencias Geológicas: Guanajuato, Mexico, 1996; Volume Voume 13, pp. 117–122. [Google Scholar]
  6. Pérez-Venzor, J.A.; Aranda-Gómez, J.J.; McDowell, F.W.; Solorio-Munguia, J.G. Bosquejo de la Evolución Geológica del Volcán Palo Huérfano; Revista Mexicana de Ciencias Geológicas: Guanajuato, Mexico, 1996; Volume 13, pp. 174–183. [Google Scholar]
  7. Chiodi, M.; Monod, O.; Busnardo, R.; Gaspard, D.; Sánchez, A.; Yta, M. Une discordance ante albienne datée par une faune d’ammonites at brachiopodes de type Tèthysien au Mexique Central. Geobios 1988, 21, 125–135. [Google Scholar] [CrossRef]
  8. Elías–Herera, M.; Ortega-Gutierrez, F. The Early Cretaceous Arperos oceanic basin (western Mexico). Geochemical evidence for an aseismic ridge formed near a spreading center. Tectonophysics 1998, 292, 321–326. [Google Scholar] [CrossRef]
  9. Nieto-Samaniego, A.F.; García-Dobargones Bueno, J.E.; Aguirre-Maese, A.L. Interpretación Estructural de Los Rasgos Geomorfológicos Principales de la Sierra de Guanajuato: Universidad Nacional Autónoma de México. Rev. Inst. de Geol. 1992, 10, 1–5. [Google Scholar]
  10. Aranda-Gómez, J.J.; Aranda-Gómez, J.M.; Nieto-Samaniego, A.F. Consideraciones acerca de la evolución tectónica durante el Cenozoico de la Sierra de Guanajuato y la parte meridional de la Mesa Central. Rev. Inst. Geol. 1989, 8, 33–56. [Google Scholar]
  11. Aranda-Gómez, J.J.; McDowell, F.W. Paleogene extension in the southern Basin and Range Province of Mexico: Syn-depositional tilting of the Eocene red beds and Oligocene volcanic rocks in the Guanajuato mining district. Int. Geol. Rev. 1998, 40, 116–134. [Google Scholar] [CrossRef]
  12. Labarthe-Hernández, G.; Tristán-González, M.; Aranda-Gómez, J.J. Revisión Estratigráfica del Cenozoico en la Parte Central del Estado de San Luis Potosí; Universidad Autónoma de San Luis Potosí, Instituto Geológico y Metalúrgico: Folleto Técnico, Mexico, 1982; Volume 85, p. 208. [Google Scholar]
  13. Prol-Ledesma, R.M.; Morán-Centeno, D. Heat flow and geothermal provinces in Mexico. Geothermics 2019, 78, 183–200. [Google Scholar] [CrossRef]
  14. Martínez-Roldán, N.; Goytia-Goyenechea, L. Mining trace in the city of Guanajuato (México) between the XVI-XIX centuries: Urban morphology and planimetry in the archive of Indias in Sevilla (Spain). Rev. Contexto. Sept. 2020, XIV, 35–49. [Google Scholar]
  15. Consejo de Recursos Minerales. Ficha de Inventario de Yacimientos Minerales, Estado de Guanajuato. 2002. Available online: https://mapserver.sgm.gob.mx/InformesTecnicos/InventariosMinerosWeb/A1103PAPJ0003_01.pdf (accessed on 12 November 2021).
  16. Aguilar-García, R.; Ortega-Guerrero, M.A. Analysis of the dynamics of water in the unsaturated zone in a soil subject to conservation practices: Implications for aquifer management and adaptation to climate change. Rev. Mex. De Cienc. Geológicas 2017, 34, 91–104. [Google Scholar] [CrossRef] [Green Version]
  17. Martínez-Arredondo, J.C.; Jofre Meléndez, R.; Ortega Chávez, V.M.; Ramos Arroyo, Y.R. Descripción de la variabilidad climática normal (1951–2010) en la cuenca del río Guanajuato, centro de México. Acta Univ. 2015, 25, 31–47. [Google Scholar] [CrossRef] [Green Version]
  18. Palacios-Vélez, E.; López-López, C. La Sobreexplotación de Las Cuencas Hidrológicas: El Caso De La Cuenca Del Río de La Laja, Guanajuato; En Cotler, H., Ed.; El Manejo Integral de Cuencas en México; México, Secretaría del Medio Ambiente y Recursos Naturales, Instituto Nacional de Ecología: Mexico City, Mexico, 2004; pp. 117–131. [Google Scholar]
  19. Ortega, A.; Farvolden, R.N. Computer analysis of regional groundwater flow and boundary conditions in the Basin of Mexico. J. Hydrol. 1989, 110, 271–294. [Google Scholar]
  20. Morales-Casique, E.; Guinzberg-Belmont, J.; Ortega-Guerrero, A. Regional groundwater flow and geochemical evolution in the Amacuzac River Basin, Mexico. Hydrogeol. J. 2016, 24, 1873–1890. [Google Scholar] [CrossRef]
  21. Toth, J. A theory of groundwater motion in small drainage basins in central Alberta, Canada. J. Geophys. Res. 1962, 67, 4375–4387. [Google Scholar] [CrossRef]
  22. Toth, J. A theoretical analysis of groundwater flow in small basins. J. Geophys. Res. 1963, 68, 4795–4812. [Google Scholar] [CrossRef]
  23. Freeze, R.A.; Witherspoon, P.A. Theoretical analysis of regional analysis flow: 1. Analytical and numerical solutions to the mathematical model. Water Resour. Res. 1966, 2, 641–656. [Google Scholar] [CrossRef] [Green Version]
  24. Freeze, R.A.; Witherspoon, P.A. Theoretical analysis of regional analysis flow: 2. Effect of water table configuration and subsurface permeability variations. Water Resour. Res. 1967, 3, 623–634. [Google Scholar] [CrossRef]
  25. Freeze, R.A.; Witherspoon, P.A. Theoretical analysis of regional analysis flow: 3. Quantitative interpretations. Water Resour. Res. 1968, 4, 581–590. [Google Scholar] [CrossRef]
  26. Freeze, R.A. Quantitative interpretation of regional groundwater patterns as an aid to wáter balancee studies. Int. Assoc. Sci. Hydrol. Gen. Assem. Berne Publ. 1967, 78, 154–173. [Google Scholar]
  27. Freeze, R.A. Three dimensional, transient, saturated-unsaturated flow in a groundwater basin. Water Resour. Res. 1971, 7, 929–941. [Google Scholar] [CrossRef]
  28. Jamieson, G.R.; Freeze, R.A. Determining hydraulic conductivity distributions in a mountainous area using mathematical modeling. Groundwater 1983, 21, 168–177. [Google Scholar] [CrossRef]
  29. Forster, C.B.; Smith, L. Groundwater flow systems in mountainous terrain: 1. Numerical modeling technique. Water Resour. Res. 1988, 24, 999–1010. [Google Scholar] [CrossRef] [Green Version]
  30. Forster, C.B.; Smith, L. Groundwater flow systems in mountainous terrain: 2. Controlling factors. Water Resour. Res. 1988, 24, 1011–1023. [Google Scholar] [CrossRef]
  31. Long, A.J.; Valder, J.F. Multivariate analyses with end-member mixing to characterize groundwater flow: Wind cave and associated aquifers. J. Hydrol. 2011, 409, 315–327. [Google Scholar] [CrossRef]
  32. Scanlon, B.R.; Mace, R.E.; Barrett, M.E.; Smith, B.B. Can we simulate regional groundwater flow in a karst system using equivalent porous media models? Case study, Barton Springs Edwards aquifer, USA. J. Hydrol. 2003, 276, 137–158. [Google Scholar] [CrossRef]
  33. Ghasemizadeh, R.; Yu, X.; Butscher, C.; Hellweger, F.; Padilla, I.; Alshawabkeh, A. Equivalent porous media (EPM) simulation of groundwater hydraulics and contaminant transport in karst aquifers. PLoS ONE 2015, 10, e0138954. [Google Scholar] [CrossRef] [PubMed] [Green Version]
  34. Domenico, P.A.; Palciauskas, V.V. Theoretical analysis of forced convective heat transfer in regional ground-water flow. GSA Bull. 1973, 84, 3803–3814. [Google Scholar] [CrossRef]
  35. An, R.; Jiang, X.-W.; Wang, J.-Z.; Wan, L.; Wang, X.-S.; Li, H. A theoretical analysis of basin-scale groundwater temperature distribution. Hydrogeol. J. 2015, 23, 397–404. [Google Scholar] [CrossRef]
  36. Szijártó, M.; Galsa, A.; Tóth, A.; Mádl-Szónyi, J. Numerical analysis of the potential for mixed thermal convection in the Buda Thermal Karst, Hungary. J. Hydrol. Reg. Stud. 2021, 34, 100783. [Google Scholar] [CrossRef]
  37. Szijártó, M.; Galsa, A.; Tóth, A.; Mádl-Szónyi, J. Numerical investigation of the combined effect of forced and free termal convection in synthetic groundwater basins. J. Hydrol. 2019, 572, 364–379. [Google Scholar] [CrossRef]
  38. Diersch, H.J. FEFLOW Finete Element Modeling of Flow, Mass and Heat Transport in Porous and Fractured Media; Springer: New York, NY, USA, 2014; p. 996. ISBN 978-3-642-38739-5. [Google Scholar] [CrossRef]
  39. Saar, M.O. Review: Geothermal heat as a tracer of large-scale groundwater flow and as a means to determine permeability fields. Hydrogeol. J. 2011, 19, 31–52. [Google Scholar] [CrossRef]
  40. Tóth, J. Gravitational Systems of Groundwater Flow: Theory, Evaluation, Utilization; Cambridge University Press: Cambridge, UK, 2009; p. 297. ISBN 978-0-521-88638-3. [Google Scholar]
  41. Jiang, X.W.; Wan, L.; Wang, X.S.; Wang, D.; Wang, H.; Wang, J.Z.; Zhang, H.; Zhang, Z.Y.; Zhao, K.Y. A multi-method study of regional groundwater circulation in the Ordos Plateau, NW China. Hydrogeol. J. 2018, 26, 1657–1668. [Google Scholar] [CrossRef]
  42. López, T.; Antoine, R.; Kerr, Y.; Darrozes, J.; Rabinowicz, M.; Ramillien, G.; Cazenave, A.; Genthon, P. Subsurface hydrology of the Lake Chad Basin from convection modelling and observations. Surv. Geophys. 2016, 37, 471–502. [Google Scholar] [CrossRef]
  43. Smith, L.; Chapman, D.S. On the thermal effects of groundwater flow: I. Regional scale systems. J. Geophys. Rcs. 1983, 88, 593–608. [Google Scholar] [CrossRef]
  44. Parsons, M.L. Groundwater thermal regime in a glacial complex. Water Resour. Res. 1970, 6, 1701–1720. [Google Scholar] [CrossRef]
  45. Woodbury, A.D.; Smith, L. On the thermal effects of three dimensional groundwater flow. J. Geophy. Res. 1985, 90, 759–767. [Google Scholar] [CrossRef]
  46. Manning, C.E.; Ingebritsen, S.E. Permeability of the continental crust: Implications of geothermal data and metamorphic systems. Rev. Geophys. 1999, 37, 127–150. [Google Scholar] [CrossRef]
  47. Garven, G.; Freeze, R.A. Theoretical analysis of the role of groundwater flow in the genesis of stratabound ore deposits. I. Mathematical and numerical model. Am. J. Sci. 1984, 284, 1085–1124. [Google Scholar] [CrossRef]
  48. Garven, G.; Freeze, R.A. Theoretical analysis of the role of groundwater flow in the genesis of stratabound ore deposits. 11. Quantitative results. Am. J. Sci. 1984, 284, 1125–1174. [Google Scholar] [CrossRef]
  49. Anderson, M.P. Heat as a ground water tracer. Ground Water 2005, 43, 951–968. [Google Scholar] [CrossRef]
  50. Tóth, A.; Galsa, A.; Mádl-Szónyi, J. Significance of basin asymmetry and regional groundwater flow conditions in preliminary geothermal potential assessment—Implications on extensional geothermal plays. Glob. Planet. Change 2020, 195, 103344. [Google Scholar] [CrossRef]
  51. de la Fuente-Hernández, J.; Aguilar-Díaz, F.C.; Cintra-Viveiro, C.A. Fluorosis Dental y Factores Asociados en Estudiantes Residentes de Comunidades del Estado de Guanajuato; Universidad Nacional Autónoma de México, Entreciencias, diálogos en la Sociedad del Conocimiento: Mexico City, Mexico, 2016; Volume 4, Available online: http://www.redalyc.org/articulo.oa?id=457647810005 (accessed on 3 February 2022).
  52. Farías, P.; Estevez-García, J.A.; Onofre-Pardo, E.N.; Pérez-Humara, M.L.; Rojas-Lima, E.; Álamo-Hernández, U.; Rocha-Amador, D.O. Fluoride Exposure through Different Drinking Water Sources in a Contaminated Basin in Guanajuato, Mexico: A Deterministic Human Health Risk Assessment. Int. J. Environ. Res. Public Health 2021, 18, 11490. [Google Scholar] [CrossRef] [PubMed]
  53. Ortega-Guerrero, M.A. Situación del Agua Subterránea en México: Una Experiencia Científico-Legislativa y Sus Implicaciones; Revista Punto de Acuerdo, Fundación Humanismo Político, diciembre-febrero: Mexico City, Mexico, 2011; pp. 30–40. [Google Scholar]
  54. Carmona-Lara, C.; Carrillo-Rivera, J.J.; Hatch-Kuru, G.; Huizar-Alvarez, R.; Ortega-Guerrero, M.A. Ley del Agua Subterránea: Una Propuesta; Universidad Nacional Autónoma de México: Mexico City, Mexico, 2017; p. 87. ISBN 978-607-02-8997-2. [Google Scholar] [CrossRef]
  55. Consejo Nacional de Ciencia y Tecnología; Ciencias y Humanidades: México City, Mexico, 2021; p. 60. Available online: https://conacyt.mx/evento/presentacion-de-la-revista-ciencias-y-humanidades/ (accessed on 3 February 2022).
Figure 1. Location of the Independence Basin and its divide in the state of Guanajuato, central Mexico. The municipalities that comprise the IB are San Felipe, San Diego de la Unión, San Luis de la Paz, Dolores Hidalgo, San Miguel Allende, Dr. Mora, and San José Iturbide. Small fractions of the municipalities of Guanajuato (G), León (L) and Ocampo (O) also belong to the IB.
Water 14 01377 g001
Figure 2. Domain of the Independence Basin showing the elevation of mountain massifs and the course of the La Laja River that runs northwest-to-south. Several features of the flow system are shown, including the main discharge area in the central part of the basin (blue circle) associated with saline soils, phreatophytes, and thermal springs. Boundary conditions for flow (blue) and heat (red) are indicated. The sites of two ancient lakes, Juagué Nandé and Curi Nitz, appear in cyan. The main sierras that delimit the IB are Guanajuato (S-G), Santa Bárbara (S-SB), San Diego de la Unión (S-SDU), San Luis de la Paz-Mineral de Pozos (S-SLP-MP), Dr. Mora (S-DMR), San José Iturbide (S-SJI), Picachos-Támbula (S-PT), and Codornices (S-C). Two important mining districts are circled in red: Guanajuato (MD-G) and Mineral de Pozos (MD-MP). Vertical exaggeration of the scale is 5:1.
Water 14 01377 g002
Figure 3. Evolution of groundwater extraction and annual decline of the water table at different places in the IB. Data are based on several hydrogeological studies conducted since the 1970s [2]. Blue circles represent the evolution, of groundwater extraction over time with an approximately exponential trend; the squares, triangles, and rhombuses show the decline of the water table at several locations in the aquifer. The zones with historically shallow water tables are visible near the ancient lakes and discharge areas (red squares).
Water 14 01377 g003
Figure 4. Geometry of the granular (red) and fractured media (dark magenta), the hydraulic conductivity distribution and anisotropy used for the modeling analysis is presented Table 2. The IB is about 100 km long by 70 km wide. Vertical exaggeration of the scale is 5:1.
Water 14 01377 g004
Figure 5. Hydraulic head distribution in the 3D domain: (a) topography-driven groundwater flow isothermic, scenario I; (b) Convective 1, scenario II; and (c) Convective 2, scenario III, see Table 1. Vertical exaggeration of the scale is 5:1.
Water 14 01377 g005
Figure 6. Nodal Darcy flux (m/d) in plan view, represented by bullets (relative length 8:1): (a) isothermal, scenario I; (b) convective 1, scenario II; and (c) convective 2, scenario III, see Table 1. Vertical exaggeration of the scale is 5:1.
Water 14 01377 g006
Figure 7. Cross-sections of W-Laja. Distribution of Darcy flow equipotential lines for: (a) isothermal, scenario I; (b) convective 1, scenario II; and (c) convective 2, scenario III, see Table 1. Vertical exaggeration of the scale is 5:1 and 8:1 for the bullets in Darcy flux.
Water 14 01377 g007
Figure 8. Cross-sections of Laja-E. Distribution of Darcy flux and equipotential lines for: (a) scenario for isothermal conditions, scenario I; (b) Convective 1, scenario II; and (c) Convective 2, scenario III (Table 1). Vertical exaggeration of the scale is 5:1 and 8:1 for the bullets in Darcy flux.
Water 14 01377 g008aWater 14 01377 g008b
Figure 9. Cross-sections of W-Laja. Distribution of temperature and equipotential lines for: (a) scenario II (convective 1); and (b) scenario III (convective 2) (Table 1).
Water 14 01377 g009aWater 14 01377 g009b
Figure 10. Cross-sections of Laja-E. Distribution of temperature and equipotential lines for: (a) scenario II (convective 1); and (b) scenario III (convective 2) (Table 1).
Water 14 01377 g010
Figure 11. Hydraulic head and temperature distribution for (a) interaction of topography-driven groundwater flow and Convective 1, scenario II; and (b) interaction of topography-driven groundwater flow and Convective 2, scenario III. Vertical exaggeration of the scale is 5:1.
Water 14 01377 g011aWater 14 01377 g011b
Table 1. Scenarios considered in the modeling analysis of flow and heat transport.
ScenarioDensityViscosity
I. IsothermalConstantConstant
II. Convective 1Linear dependency on T 1Constant
III. Convective 2Nonlinear dependency on TVariable-dependent on T
1 T: temperature.
Table 2. Parameters for the flow and heat transport in granular and fractured media.
DefinitionSymbolValueUnit
Hydraulic conductivity
Granular
Porosity
Kxx1m/d
Kyy0.1m/d
Kzz0.01m/d
ε0.3Vol/vol
Hydraulic conductivity
Fractured
Porosity
Kxx0.1m/d
Kyy0.01m/d
Kzz0.001m/d
ε0.1Vol/vol
Hydraulic-head BC
Fluid-flux BC
Elevation Laja Riverm
Infiltration rate with elevationm/d
Surface temperature BC
Bottom temperature BC
Porosity
Volumetric head capacity of fluid
Volumetric head capacity of solid
Thermal conductivity of fluid
Thermal conductivity of solid
Anisotropy of solid thermal conductivity
Longitudinal dispersivity
Transverse dispersivity
T
Tb
ε
ρs cs
ρc
Λ
Λs

βd
βd
20
100
0.1
4.2
2.56
0.65
3
1
5
0.5
Celsius
Celsius
Vol/vol
MJ/m3/K
MJ/m3/K
J/m/s/K
J/m/s/K

m
m
Publisher’s Note: MDPI stays neutral with regard to jurisdictional claims in published maps and institutional affiliations.

