Article

Groundwater Quality and Associated Human Health Risk in a Typical Basin of the Eastern Chinese Loess Plateau

School of Geographical Science, Shanxi Normal University, 339 Taiyu Street, Taiyuan 030031, China
*
Author to whom correspondence should be addressed.
Water 2022, 14(9), 1371; https://doi.org/10.3390/w14091371
Submission received: 25 March 2022 / Revised: 12 April 2022 / Accepted: 16 April 2022 / Published: 22 April 2022
(This article belongs to the Special Issue Groundwater Quality and Public Health)

Abstract

:
Groundwater is an important source for drinking, agricultural, and industrial purposes in the Linfen basin of the Eastern Chinese Loess Plateau (ECLP). To ensure the safety of drinking water, this study was carried out to assess the quality using the water quality index (WQI) and potential health risks of groundwater using the human health risk assessment model (HHRA). The WQI approach showed that 90% of the samples were suitable for drinking, and Pb, TH, F, SO42−, and TDS were the most significant parameters affecting groundwater quality. The non-carcinogenic health risk results indicated that 20% and 80% of the samples surpassed the permissible limit for adult females and children. Additionally, all groundwater samples could present a carcinogenic health risk to males, females, and children. The pollution from F, Pb, and Cr6+ was the most serious for non-carcinogenic health risk. Cd contributed more than Cr6+ and As to carcinogenic health risks. Residents living in the central of the study area faced higher health risks than humans in other areas. The research results can provide a decision-making basis for the scientific management of the regional groundwater environment and the protection of drinking water safety and public health.

1. Introduction

Groundwater is an indispensable part of human living space and the hydrological cycle, providing high-quality freshwater resources for human beings. It is important for domestic, industrial, and agricultural use globally [1,2,3,4]. For drinking purposes, approximately one-third of the world’s population rely on groundwater as a water source [5,6,7]. Especially in arid and semi-arid areas where the precipitation is scarce and the surface water sources are limited, groundwater has become the main water source, or even the only one [2,8]. As the most important water source for human survival, groundwater quality is vital to human health. However, with the continuous population growth and rapid economic development, groundwater pollution has become an urgent problem endangering public health and has put pressure on groundwater resources worldwide [9,10]. For example, studies have shown that 2 types of birth defects and 15 types of cancer may be related to long-term exposure to NO3 contaminated groundwater [11,12,13]. Even at the same groundwater NO3 concentration, children and infants have greater health risks than adults, especially infants prone to a disease known as “blue baby syndrome”, i.e., methemoglobinemia [14,15]. Fluoride is a major pollutant in groundwater on a global scale as about 260 million people suffer from endemic fluorosis and other diseases due to the intake of high fluoride in groundwater [16,17]. Potentially toxic elements (PTEs) in groundwater can cumulate in the human body throughout almost the human lifespan and cause many diseases, a matter of great concern for the past several years [18,19,20,21]. Anthropogenic sources of groundwater pollutants include fertilization, livestock waste, domestic sewage, landfill, metal industry, mining, and other industrial activities. Processes controlling concentrations of physicochemical parameters in groundwater are mainly the mineral dissolution, sorption and desorption processes, ion exchange, reduction and oxidation processes, and chemical weathering [22,23,24,25,26].
Groundwater environment assessment is the basis of sustainable utilization of regional groundwater resources and is of great significance to ecological environment protection. Various scientific approaches have been introduced to assess groundwater quality. Some of these methods include set pair analysis [27], hierarchical analysis [28], matter-element extension analysis [29], fuzzy comprehensive assessment method [2], and water quality index (WQI) [6,8]. The WQI is an efficient tool to access water quality and its suitability for drinking purposes. It was first developed by Horton [30] and since has been widely used in numerous water quality assessment works [31,32,33,34,35]. Varol and Davraz [6] used WQI and multivariate analysis to evaluate groundwater quality and its suitability for drinking and agricultural uses in the Tefenni plain, Turkey. Using an improved water quality index, Zhang et al. [36] considered that groundwater will be affected by the geological environment and human factors during the flow process in Guanzhong Basin, China. In recent years, groundwater quality assessment and spatial analysis based on combining Geographic Information System (GIS) with WQI methods have proven to be a powerful tool for spatial information management of groundwater resources [37,38,39].
Many scholars have also carried out human health risk assessments (HHRA) to directly and quantitatively reflect the negative health impacts of polluted water on human beings. This method has been widely used in the evaluation of different water bodies, such as rivers [40,41], lakes [42], and wetlands [43], which provide useful insight to ensure human health. For groundwater, Guo et al. [44] found that groundwater arsenic pollution caused by landfill leachate leakage poses unacceptable carcinogenic risks to people of all ages. Farmers continually applying fertilizers during the period between the rainy and dry season leads to the mobilization of NO3 and PTEs from cultivated soils to groundwater under favoring geochemical conditions in the dry season. Therefore, the non-carcinogenic risk in the dry season is higher than in the rainy season [1,45,46,47,48]. Kaur et al. [12] suggested that the hazard quotient values determined by deterministic and probabilistic approaches were nearly identical, and groundwater in most of the Panipat district in India is not suitable for direct drinking purposes.
The Chinese Loess Plateau (CLP) is a cradle of human civilization, where the groundwater plays an important role in the residents’ lives and industrial and agricultural production. Due to the arid climate and increasing human activities, there is a serious shortage of water resources and a significant decline in water quality in the CLP [40]. Recently, health risks due to different water pollutants have been assessed on the CLP, such as fluoride [16], nitrogen [49], and arsenic [50]. However, these studies were mainly concentrated in the middle of the CLP. As for the Eastern Chinese Loess Plateau (Shanxi Province), the status of the groundwater environment and the threat of pollutants to human health are still unclear.
Therefore, this study was carried out to evaluate the quality and human health risks concerning groundwater in the Linfen Basin, a typical basin on the Eastern Chinese Loess Plateau. The objects of this study are (1) to analyze the hydrochemical characteristics of groundwater, (2) to evaluate groundwater quality using WQI, and (3) to assess the health risks of F, nitrogen, and PTEs (Fe, Mn, Hg, As, Cd, Cr6+ and Pb) to adults and children through drinking water intake and dermal contact. A spatial distribution map of groundwater quality and health risks in the study area was produced using Inverse distance weight (IDW) interpolation in GIS. This study can provide meaningful support for local governments in groundwater quality protection and groundwater resource management.

2. Materials and Methods

2.1. Study Area

Linfen Basin (35°23′–36°57′ N, 110°22′–112°34′ E) is situated in the southwest of Shanxi Province and includes Huozhou City, Hongtong County, Yaodu District, Quwo County, Xiangfen County, Yicheng County, and Houma City (Figure 1). It covers an area of ~4686 km2. It is surrounded by the Hanhou Mountains to the north, the Emei platform to the south, the Taiyue and Zhongtiao Mountains to the east, and the Luoyun Mountains to the west. The area has been subjected to semi-arid and semi-humid monsoon climatic conditions, with mean annual precipitation of 420 to 550 mm, and mean annual temperatures of 10 °C [51]. The study area is not only an important irrigated agricultural area in the Loess Plateau but also the main supply center of energy sources in China. The area is rich in mineral resources, of which coal is the largest mineral resource. The main rivers in the study area are the Fenhe River, Xinshuihe River, Qinhe River, Huihe River, Ehe River, and Qingshuihe River. The total amount of regional water resources is 1.52 billion m3, of which the river runoff is 1.32 billion m3 (including 0.48 billion m3 of spring water), and the groundwater resource is 1.026 billion m3. The water resource in this area is scarce, with the per capita water resource occupancy being only 350 m3 [52].
The interior of the basin is dominated by Quaternary strata. The Lower Pleistocene is mainly yellowish-brown and grayish-yellow silty sand and sandy clay. This layer is widespread in the basin and is about 200 m thick in the middle of the basin. The Middle Pleistocene is a set of sand, sandy soil, and loam interbedded sediment, which has a thickness of ~150 m. The Upper Pleistocene in the piedmont inclined plain area is sand gravel mixed with sandy soil. Near the river valley, it is mostly sandy soil and loam deposited in river and lake facies, and the thickness of this layer is 30–50 m. The stratum lithology of Holocene is sandy soil, loam, sand, and gravel, which is mainly distributed in the Fenhe terrace. The exposed strata in the mountain area include gneiss, limestone, shale, sandstone, mudstone, sandy conglomerate, and loess [53]. The fault structure in the study area is complex, mostly being hidden faults, and the intersection of large faults is a favorable part of modern hot springs and mineralization [54].
According to the burial depth and hydraulic characteristics of the aquifers in the study area, the pore water of loose rocks in the study area can be divided into phreatic water, middle-layer confined water, and deep-layer confined water. Phreatic aquifers are mostly distributed in the middle of the basin, loess tableland, and piedmont inclined plain in a belt shape, and the aquifers are mainly medium and fine sand. Compared with the eastern piedmont and the central part of the basin, the middle-layer confined water aquifer in the western piedmont has a large thickness and coarse particles and has good water storage conditions. The distribution characteristics of deep-layer confined water are consistent with that of middle-layer water, and the aquifer is mainly sand and sand gravel. Groundwater recharge mainly includes lateral runoff, surface water seepage, and precipitation infiltration. The discharge of groundwater mainly depends on evaporation and artificial mining [54,55]. In the slow flow season, groundwater mainly belongs to the (SO42−-Ca2+) type, the (HCO3-Ca2+-Na+) type, and the (HCO3-Mg2+-Na+) type. In the quick flow season, groundwater is dominated by the (HCO3-Ca2+-Na+) type and the (HCO3-SO42−-Ca2+-Na+) type [4]. In general, the groundwater depth in the study area shows a trend of high in the east and low in the west. The buried depth of groundwater in Yaodu and Xiangfen is generally deeper than that in other areas at 35–45 m (Figure 1).

2.2. Sampling and Analysis

Groundwater quality assessment and human health risk assessment based on 10 groundwater hydrological long-term monitoring wells set up by Shanxi Provincial Department of Water Resources in the study area. Groundwater samples were collected in 2017 and were used for the analysis of water quality parameters, including pH, total hardness (TH), total dissolved solids (TDS), sulfate (SO42−), chloride (Cl), fluoride(F), cyanide, volatile phenols, chemical oxygen demand (CODMn), nitrate (NO3-N), nitrite (NO2-N), ammonia nitrogen (NH4-N), and PTEs (Fe, Mn, Hg, As, Cd, Cr6+, Pb) for each sample. Sample collection, preservation, transportation, and testing were carried out in strict accordance with the Technical Specifications for Environmental Monitoring of Groundwater [56]. Before sampling, wells were pumped for 10 min to remove stagnant water. All sampling containers were thoroughly cleaned with the groundwater to be sampled. To ensure the stability of the elements, the samples analyzed for TH, Fe, Mn, Cd, and Pb were mixed with HNO3 solution, the samples for the analysis of NH4-N were mixed with H2SO4 solution, and the samples for cyanide and Cr6+ analysis and for Hg and As analysis were mixed with NaOH and HCl, respectively. All samples were then sealed tightly and immediately sent to the laboratory of Linfen Hydrology and Water Resources Survey Branch for analysis (within 24 h). pH was measured directly in the field using a portable pH meter. TH was analyzed using the EDTA titration method. TDS was determined by the drying and weighing approach. SO42−, Cl, F, NH4+, NO3, and NO2 were tested using an ion chromatograph (ICS-600). Fe, Mn, Hg, As, Cd, Cr6+, and Pb were measured using inductively coupled plasma-mass spectrometry (ICP-MS). Groundwater was filtered using a 0.45 μm filter before their analysis. During the analysis, distilled water and replicates were introduced to ensure the reliability of the results. The replicates had a relative error within ±5%, indicating acceptable analytical accuracy. IDW interpolation method has been widely used to study the spatial distribution of groundwater quality parameters. IDW uses the deterministic model method to calculate the unknown value according to the nearby points rather than the far-off ones. This interpolation method fits well for real-world parameters [37,38,39]. IDW interpolation results were verified by overlapping field survey data and laboratory analysis results. The pixel values of the IDW interpolation map match well with those of field verification data.

2.3. Water Quality Index

The WQI approach can not only comprehensively express the water quality information of groundwater but also quantitatively evaluate and compare the pollution degree of different water quality parameters [57]. This index is a mathematical instrument used to transform large quantities of water characterization data into a single number, representing the water quality level [32]. Firstly, each chemical parameter was assigned a weight (wi) according to its impact on human health and groundwater quality. In this study, the highest weight of 5 was assigned to the parameters like TH, TDS, SO42−, F, Fe, Mn, Cd, Cr6+, and Pb due to their major importance in water quality assessment. These parameters are characterized by serious health effects and, when above critical concentration limits, may limit the usability of groundwater for domestic and drinking purposes [37,58]. Other parameters were assigned different weights ranging from 2 to 4. The relative weight is computed using the following formula:
W i = w i i = 1 n w i
where Wi is the relative weight, wi is the weight of each parameter, and n is the number of parameters.
Then, the quality rating for each parameter is assigned by dividing its concentration in each water sample by its limit defined by the Chinese national standards [59] and multiplying the result by 100:
q i = C i S i   ×   100
where qi is the quality rating, and Ci is the concentration of each parameter in each water sample. Si is the drinking water standard for each parameter set by the Chinese national standard [59].
To calculate the WQI, the SIi has to be determined firstly:
SI i = W i   ×   q i
WQI = i = 1 n SI i
where SIi is the subindex of the ith parameter. The WQI values are classified into five categories: excellent water (<50), good water (50–100), poor water (100–200), very poor water (200–300), and unsuitable water (>300) [57].

2.4. Human Health Risk Assessment

The human health risk assessment is the basis for controlling groundwater pollution and ensuring a safe drinking water supply [49,60,61,62]. Groundwater can affect human health through various exposure pathways, the most common of which are drinking water intake and dermal contact [63]. The model recommended by the Ministry of Ecology and Environment of the P.R. China [64] based on the United States Environmental Protection Agency models [65] was adopted in this study. There are many agricultural and industrial production activities in the study area. Therefore, representative pollutants F, nitrogen (NO3-N, NO2-N, NH4-N), and PTEs (Fe, Mn, Hg, As, Cd, Cr6+, and Pb) are selected as the parameters of risk assessment. Due to differences in the physiology of males, females, and children, this study separately evaluated the health risks of oral intake and dermal intake.
The non-carcinogenic risk through drinking water intake is calculated as follows [60,63]:
Intake oral = C   ×   IR   ×   EF   ×   ED BW   ×   AT
HQ oral = Intake oral RfD oral
The non-carcinogenic risk through dermal contact is expressed as follows [42]:
Intake dermal   = DA   ×   EV   ×   SA   ×   EF   ×   ED BW   ×   AT
DA = K   ×   C   ×   t   ×   CF
SA = 239   ×   H 0 . 417   ×   BW 0 . 517
HQ dermal = Intake dermal RfD dermal
RfD dermal   = RfD oral   ×   ABS gi
where Intakeoral, Intakedermal, HQoral, HQdermal, RfDoral, and RfDdermal represent the chronic daily dose via ingestion and dermal contact (mg/(kg day)), the hazard quotient through oral and dermal exposure pathways, reference dose for oral and dermal contact pathways (mg/(kg day)), respectively. C, DA, SA, and ABSgi are the pollutant concentration of groundwater (mg/L), exposure dose (mg/cm2), skin surface area (cm2), and gastrointestinal absorption factor, respectively. The definitions and values of other parameters are shown in Table 1 and Table 2.
The total non-carcinogenic risks are calculated as follows [1,29,45]:
HQ i = HQ oral + HQ dermal
HI total = i = 1 n HQ i
where HQ is the non-carcinogenic hazard quotient and HI is the hazard index. i represents the risk assessment parameters. When the value of HQ and HI is less than 1, it is safe for human health. HI > 1 indicates unacceptable risk, and residents are exposed to non-carcinogenic risks [60,64].
In addition to non-carcinogenic risk, As, Cd, and Cr6+ can also create carcinogenic risks for humans [7,41]. The carcinogenic risk through drinking water intake and dermal contact is calculated as follows:
CR oral = Intake oral   ×   SF oral
CR dermal   = Intake dermal   ×   SF dermal
SF dermal   = SF oral ABS gi
CR total   = CR oral   + CR dermal
where CR denotes the carcinogenic risk. SF is the slope factor for the carcinogenic contaminants (mg/(kg day))−1. The SForal values for As, Cd, and Cr6+ are shown in Table 2. The average time (AT) for carcinogenic risk is set at 27,740 days for both adults and children, as the harm to human health caused by cadmium, chromium, and arsenic will last a lifetime [64]. The acceptable limit for CR is 1 × 10⁻⁶.

3. Results and Discussion

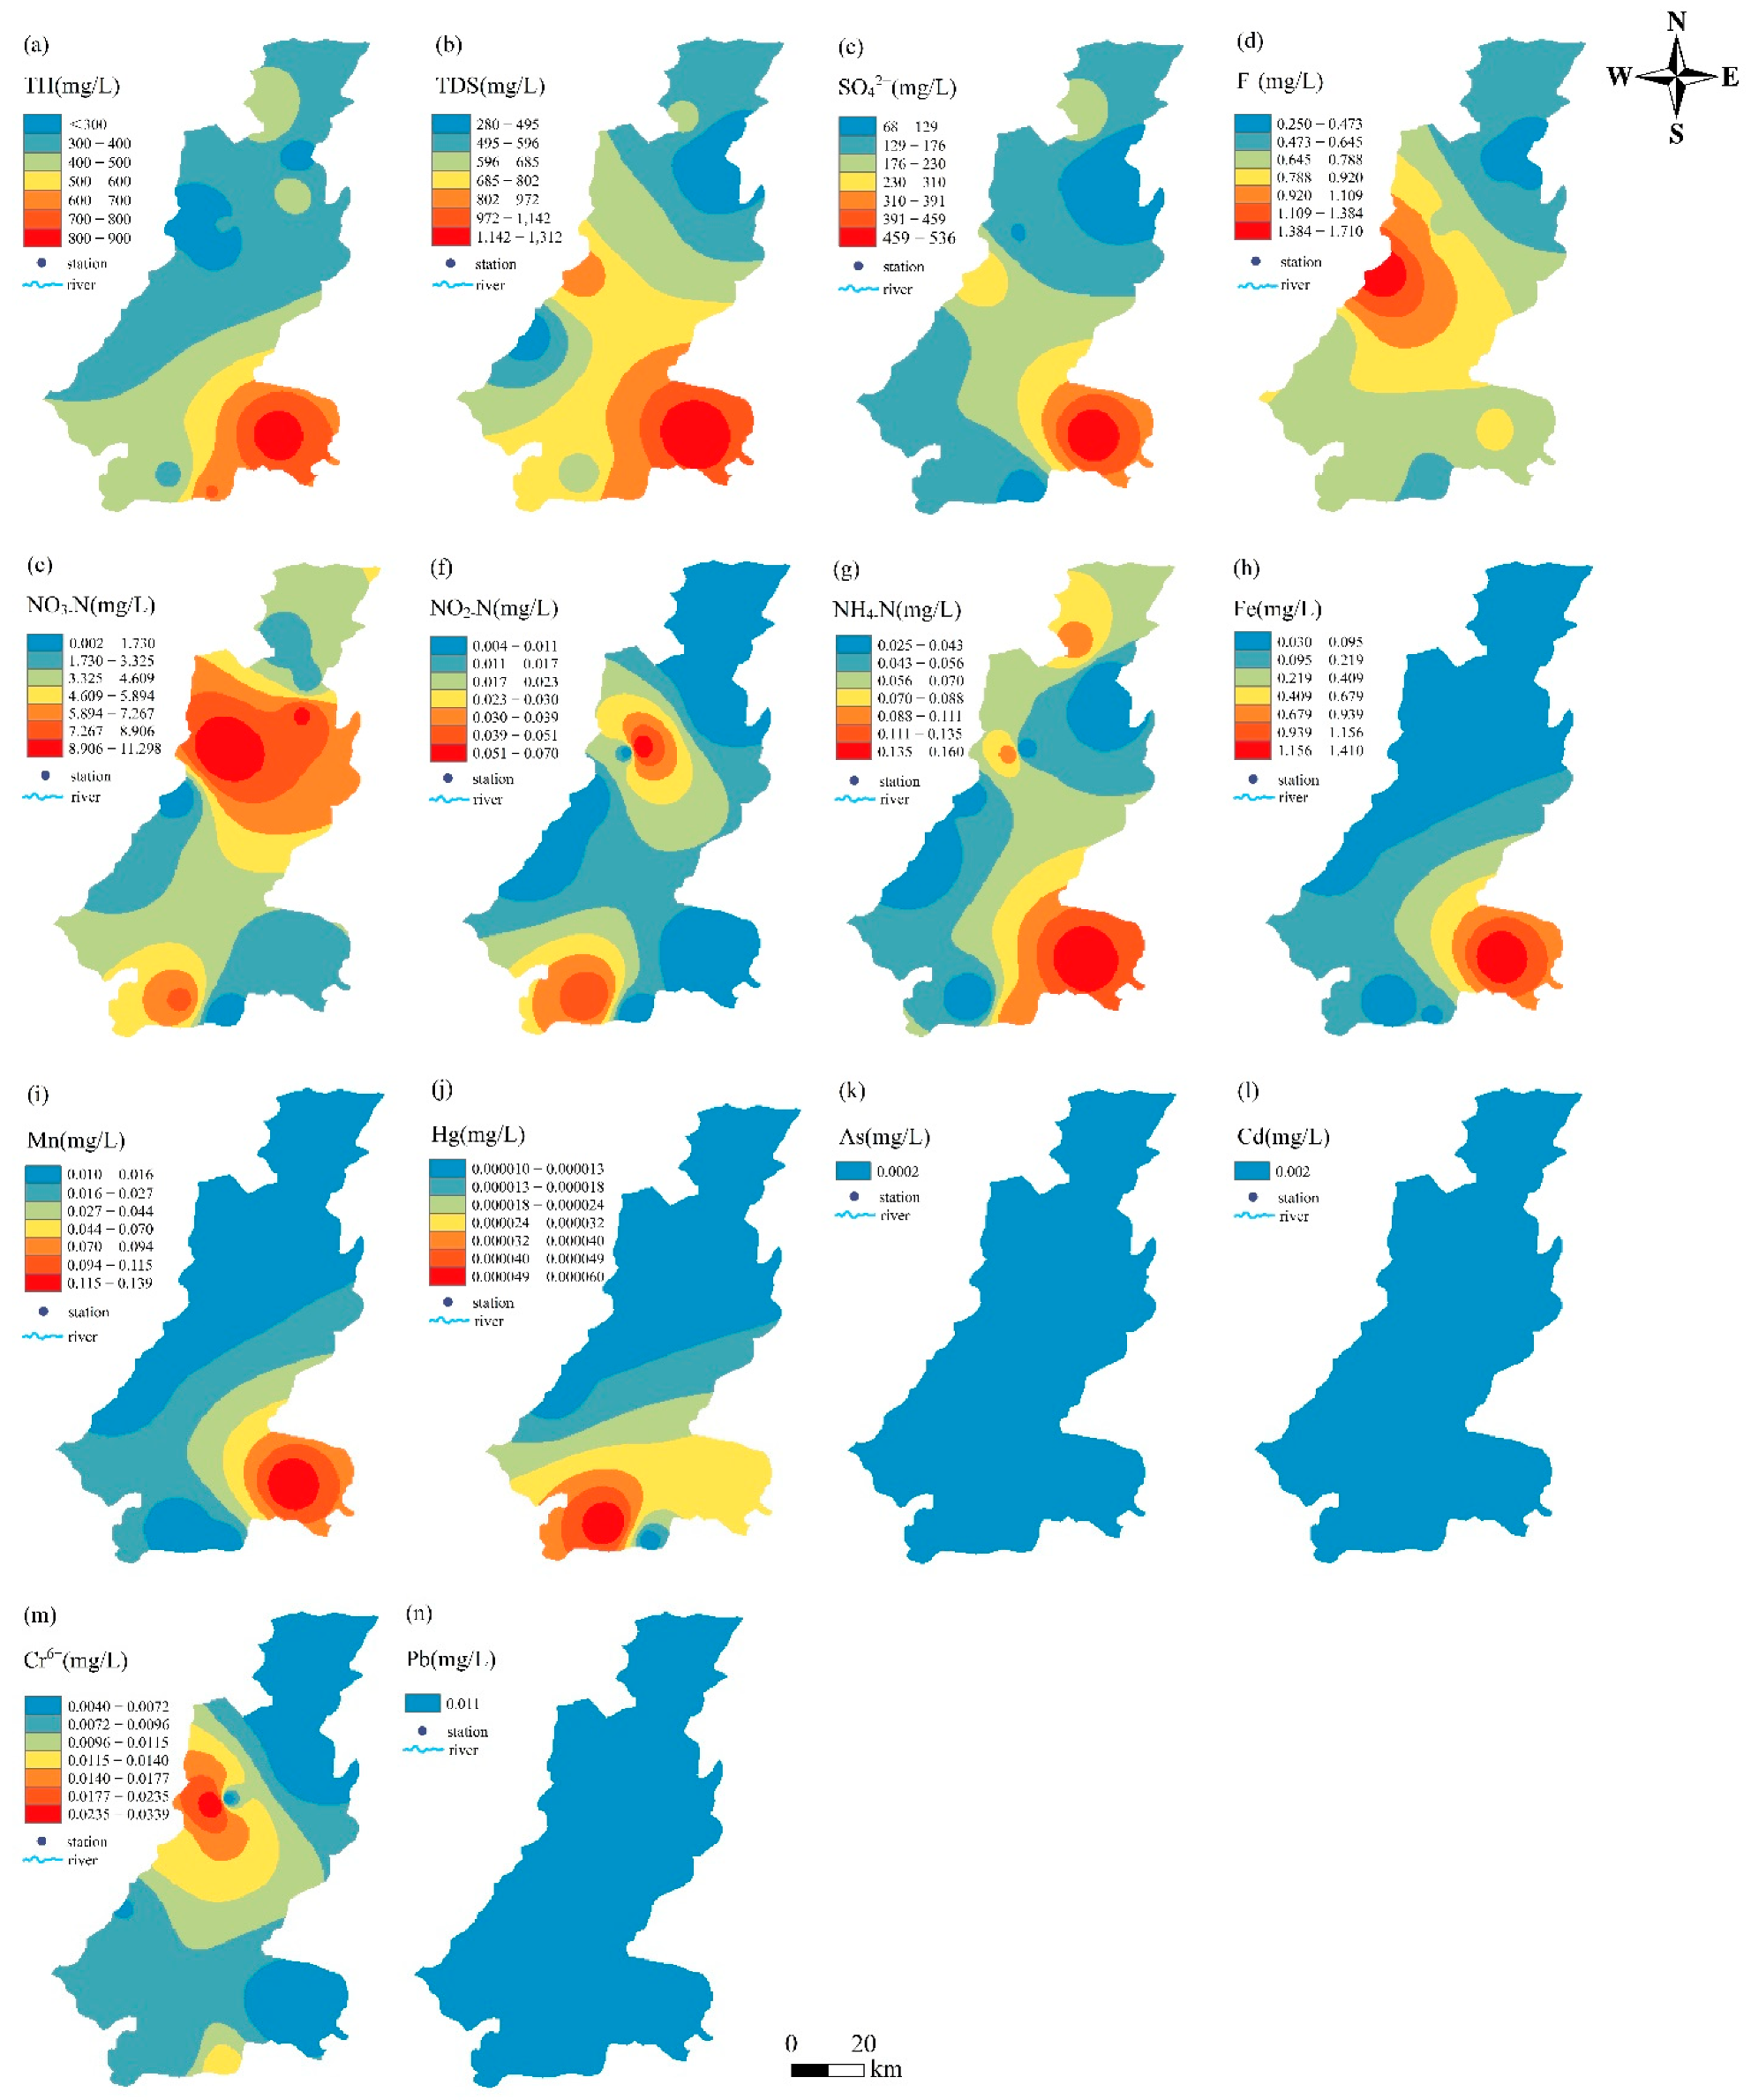
3.1. Hydrochemical characteristics of Groundwater

The statistical results of water quality for groundwater samples are given in Table 3. pH is one of the most important parameters for evaluating the suitability of drinking water [60]. The Chinese national standard proposes that the pH value of groundwater suitable for drinking is 6.5–8.5 [59]. As Table 3 shows, pH values of the groundwater range from 7.27 to 7.85, with a mean value of 7.59. Therefore, the groundwater in the study area is weakly alkaline water that can be used for drinking.
TH represents dissolved Ca2+ and Mg2+ in groundwater. High TH in groundwater may affect the taste of drinking water and reduce the efficacy of detergents [34]. In addition, regarding human health, the long-term drinking of extremely hard water may increase the incidence of urolithiasis, anencephaly, prenatal mortality, and some cancer-related cardiovascular diseases [68]. In this study, TH varies between 167 and 869 mg/L with a mean of 426 mg/L. According to the national Chinese drinking water standards, samples S1, S9, and S10 are extremely hard water, with TH exceeding the acceptable limit of 450 mg/L for drinking. These samples are predominantly distributed in the southern part of the study area (Figure 2a). TH enrichment in groundwater may be due to the dissolution of soluble salts and minerals, as well as to human intervention [2].
TDS is one of the major water quality parameters, mainly representing the various minerals present in the water [6]. TDS varies in a wide range of 280–1312 mg/L, with a mean value of 689 mg/L (Table 3). Based on TDS content, Liu et al. [69] categorized waters as freshwater (TDS < 1000 mg/L) and brackish water (TDS > 1000 mg/L). Only sample S10 in Yicheng is brackish water (Figure 2b). Generally speaking, higher TDS usually indicates stronger water-rock interaction and may also be affected by domestic wastewater, irrigation return flow, and fertilization [1,70]. High TDS in groundwater is generally harmless in healthy people and may cause constipation or have a laxative effect, but it may have a greater impact on people with kidney and heart disease [6,33,71].
Cl and SO42− in groundwater are mainly related to the regional lithological conditions and are also affected by anthropogenic sources [68]. The concentration of Cl is between 7.93 and 88.1 mg/L and is lower than the Chinese national standard of 250 mg/L. The concentration of SO42− in the study area ranged from 68 to 536 mg/L, with a mean of 182.16 mg/L. Samples S5 and S10 exceeded the acceptable limit of SO42− for drinking. High SO42− concentration is observed in the Yaodu and Yicheng parts of the central and south of the study area (Figure 2c). The Ordovician karst aquifers widely distributed in the study area are affected by gypsum dissolution, and the hydrochemical type of groundwater is SO42−·HCO3-Ca·Mg. In addition, the oxidation of sulfur in coal-bearing strata (S + O2 + 2H2O→SO42− + 4H+) will also cause increased sulfate concentration in groundwater [72]. Therefore, the high mean value of SO42− in this study is probably due to the high natural background value rather than pollution.
F in drinking water is essential for human health at low concentrations, such as protecting teeth from caries [2]. However, excessive fluoride intake can cause dental fluorosis, skeletal fluorosis, and thyroid disease in adults [17,73]. The Chinese national standard stipulates that F concentration in drinking water should be less than 1.0 mg/L. In this study, F is in the range of 0.25–1.71 mg/L, with an average value of 0.75 mg/L. Two groundwater samples in Yaodu did not meet the requirement of the national standard (Figure 2d). The high concentration of fluoride in groundwater may be mainly related to the lithology of the region, especially the dissolution of fluoride-bearing minerals [16,74].
Both cyanide and volatile phenol are toxic organics. The concentration of cyanide in all groundwater samples is less than 0.0004 mg/L. For volatile phenols, except for sample S10 in Yicheng, whose value is 0.002 mg/L, the other samples are 0.0003 mg/L. CODMn is an indicator that can indirectly reflect the organic pollution of groundwater [44,74]. The CODMn values for the samples are observed to be from 0.1 to 0.9 mg/L, with an average of 0.25 mg/L. Sample S10 in Yicheng has the highest volatile phenol and CODMn values. As shown in Table 3, the concentrations of cyanide, volatile phenol, and CODMn are all within the drinking water standard limit stipulated by the national standard, indicating that the groundwater is less affected by organic pollution.
In recent years, nitrogen pollution (NO3-N, NO2-N, and NH4-N) has become a hot issue for many researchers due to its adverse effects on groundwater quality and human health [2,12,14,49,74,75,76]. The extensive use of nitrogenous fertilizers in agricultural activities is one of the most common sources of nitrogen pollution in groundwater [1,63]. Measured values of NO3-N, NO2-N, and NH4-N are in the range of 0.002–11.3, 0.004–0.7 and 0.025–0.16 mg/L, respectively. Higher NO3-N and NO2-N concentrations are observed in the central and southwest parts of the area, while a high value of NH4-N is mainly distributed around Yicheng (Figure 2e–g). According to the Chinese standards, groundwater is unacceptable for drinking when the NO3-N, NO2-N, and NH4-N concentration in groundwater is higher than 20, 1, and 0.5 mg/L, respectively. Therefore, the groundwater in the study area is less contaminated with nitrogen and is suitable for drinking.
PTEs content in groundwater is usually low. However, even in very low concentrations, -they can create biological toxicity and pose serious threats to aquatic ecosystems and human health [20,21,41]. As shown in Table 3, the Fe, Mn, Hg, and Cr6+ concentrations range from 0.03 to1.41, 0.01–0.139, 0.00001–0.00006, and 0.004–0.034 mg/L, respectively. The concentrations of As, Cd, and Pb are 0.0002, 0.002, and 0.011 mg/L, respectively. The mean concentration of metals is in the following order: Fe > Mn > Pb > Cr6+ > Cd > As >Hg. All metals, except for Fe, Mn and Pb, are within the permissible levels for drinking water. Samples with high concentrations of Fe and Mn are mainly found in the southeastern parts of the basin (Figure 2h,i). Fe and Mn have similar geochemical behavior. Their dissolution and migration to groundwater are affected by reduction conditions, residence time, well depth, and salinity [77]. The similarity in the spatial distribution of Cr6+ and NO3-N concentrations may be related to the synergistic role of nitrogen (N)-bearing fertilizers to elevated Cr6+ concentration in groundwater. This may be due to the production of H+ and soil acidification during the nitrification process of NH4+ oxidation to NO3, favoring the increased dissolution of Cr3+ which is subsequently oxidized into Cr6+ by natural and/or anthropogenic factors [46,47].

3.2. Groundwater Quality Assessment

In this study, pH, TDS, TH, SO42−, Cl, F, volatile phenols, NO3-N, NO2-N, NH4-N, Fe, Mn, Hg, Cd, Cr6+ and Pb are selected as the parameters to evaluate the overall groundwater quality, using the WQI introduced previously. The values of cyanide, arsenic, and chemical oxygen demand in groundwater are very low, so they have little impact on water quality and can be ignored in water quality assessment. The weights and relative weights assigned to each parameter are shown in Table 4.
The calculated WQI values and water types are presented in Table 5. The results of WQI range from 23.63 to 105.96. Out of 10 groundwater samples, sample S5 is categorized as good water. Sample S10 is classified as poor water. The other 8 samples are excellent water. For the study area, the most significant parameters affecting groundwater quality are Pb, TH, F, SO42−, and TDS.
From the spatial distribution of groundwater quality index results, it can be seen that poor quality water area is mainly located near Yicheng in the southeastern area of the study (Figure 3). The main pollutants in the groundwater in this area are TH, TDS, SO42−, Fe, Mn, and Pb, all of which exceed the upper limit for drinking purposes. The poor groundwater quality in Yicheng may be related to the buried depth of groundwater. Generally, when the groundwater is buried deeper, it takes longer for the surface pollutants to reach the aquifer. Thus, the possibility of the pollutants being adsorbed and diluted during the infiltration process becomes greater, and the degree of pollution in the groundwater system will decrease. The buried groundwater depth in the Yicheng area is shallow at 2–15 m. In addition, the lithology of the buried deep aquifer is mainly coarse sand and medium-coarse sand. The better permeability of the aquifer makes it easier for surface pollutants to seep into the groundwater, resulting in groundwater pollution. Fe and Mn in groundwater come from coal and metal deposits, especially iron ore. High TDS leads to increased ionic strength and decreased activity coefficient, which will dissolve more Fe and Mn in groundwater. In addition, the organic matter released from surface pollutants into groundwater can quickly deplete the dissolved oxygen in groundwater, resulting in a reductive hydrochemical environment more conducive to the dissolution of Fe and Mn [77].
The assessment results indicate that the groundwater in the study area is dominated by excellent water that can be used for drinking purposes. For the Yicheng area with poor quality groundwater unsuitable for drinking, groundwater pollution remediation and safe water supply measures should be implemented as soon as possible.

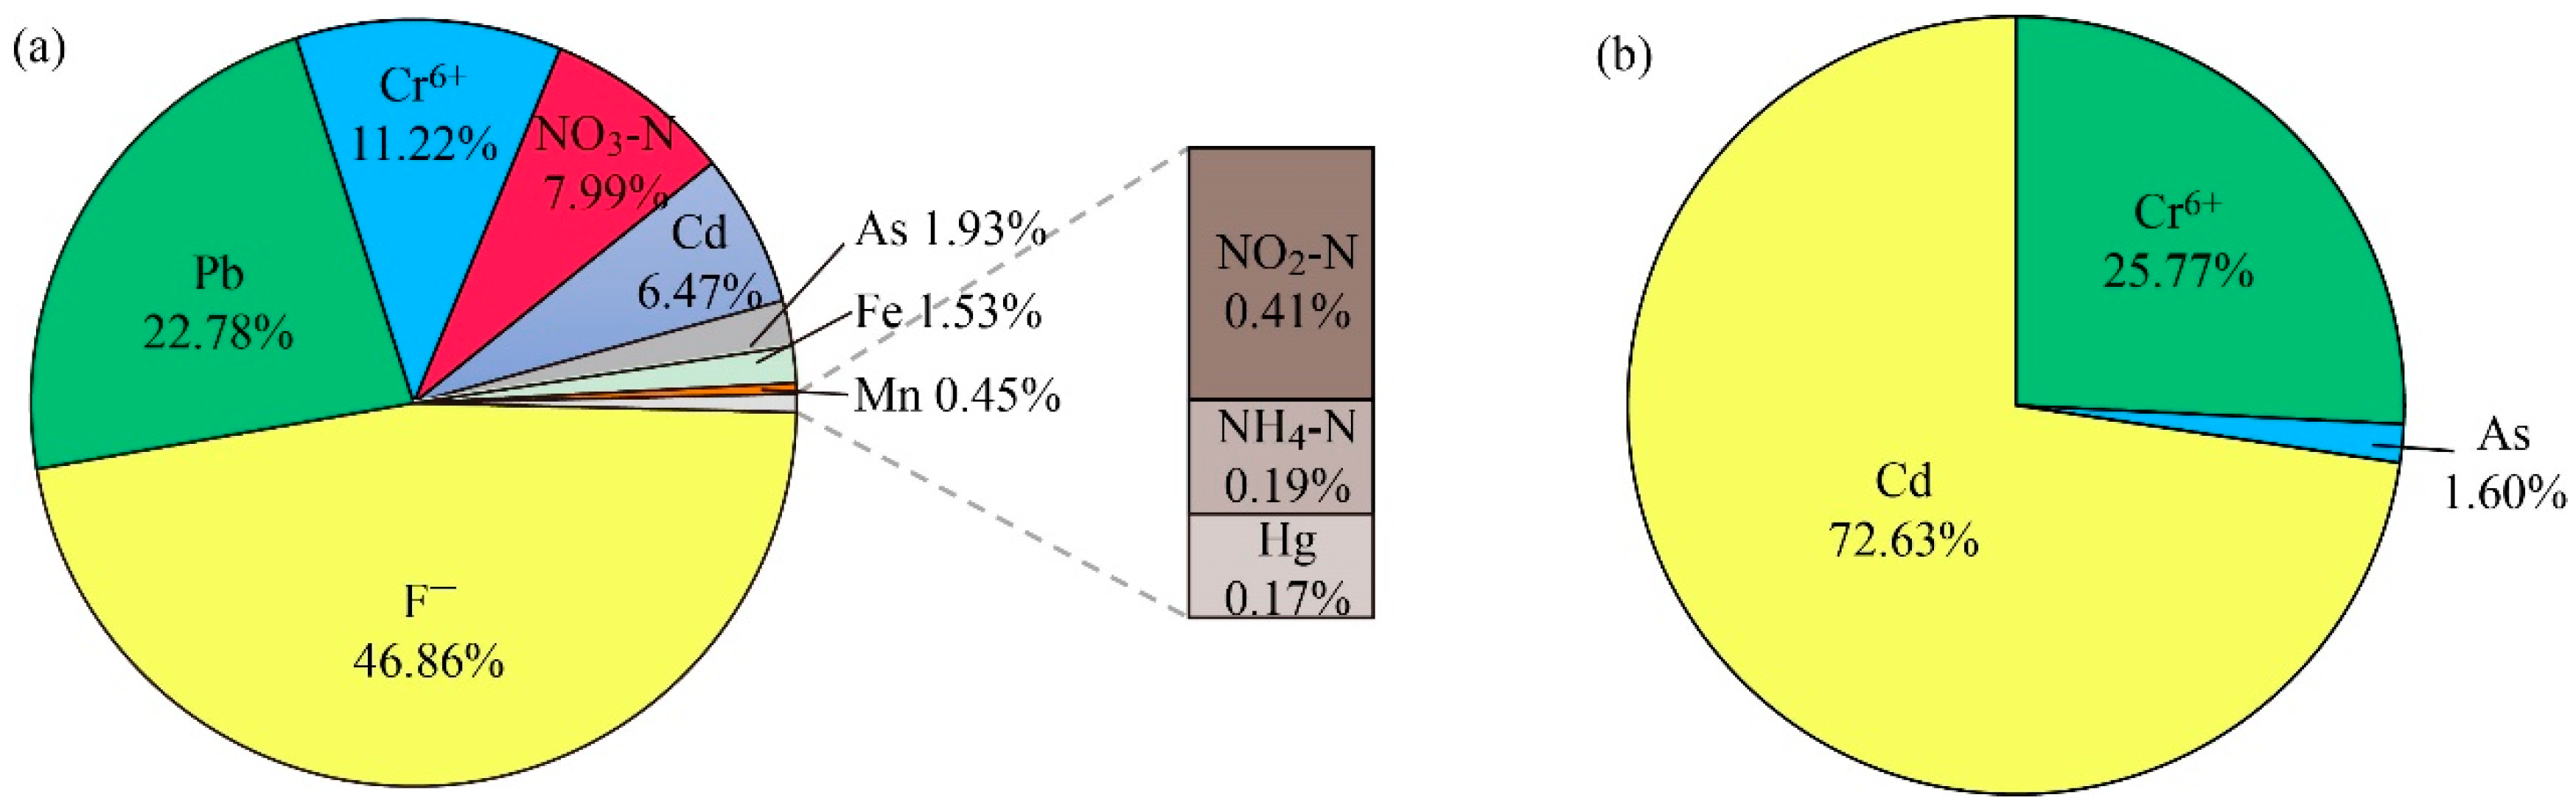
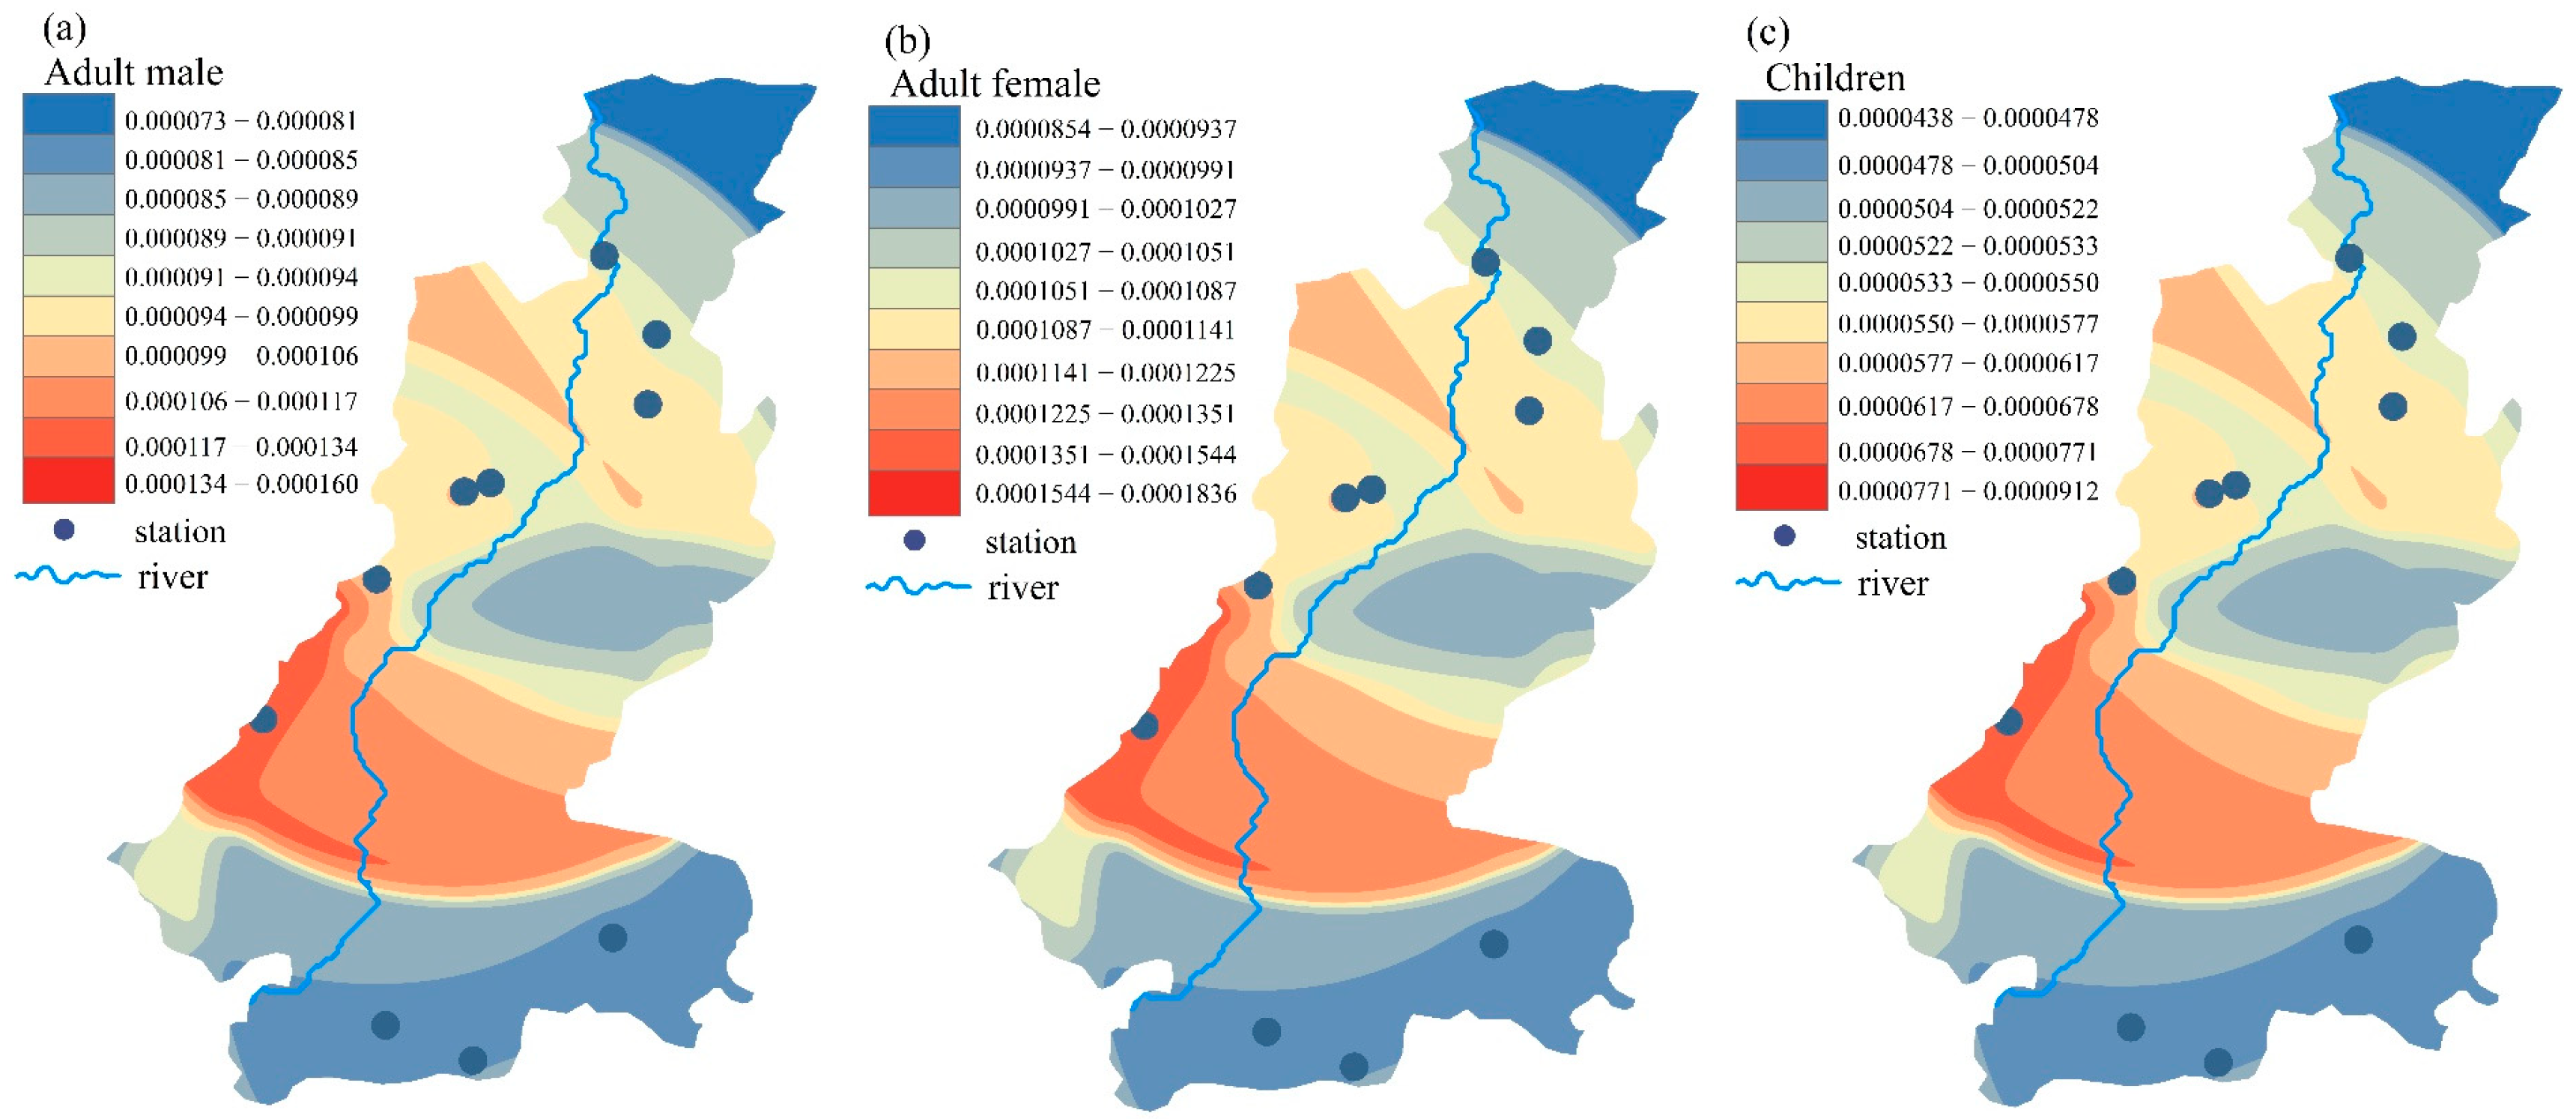
3.3. Human Health Risk Assessment

The health risks of groundwater in the study area were assessed based on the model introduced previously. The calculated health risks for adults and children through drinking water and dermal contact are shown in Table 6. For adult males, the HQoral values range from 0.285 to 0.827, with a mean of 0.521. The HQoral values for adult females and children range from 0.336 to 0.976 and 0.693–2.012, with an average of 0.615 and 1.269, respectively. The HQdermal values are smaller than the HQoral, ranging from 0.017 to 0.104 for males, 0.018 to 0.109 for females, and 0.026 to 0.156 for children, with means of 0.034, 0.036, and 0.051, respectively. This suggests that non-carcinogenic risk is mainly caused by oral exposure. The HItotal values for males and females range from 0.302 to 0.902 and 0.354–1.051, with means of 0.555 and 0.651, respectively. For children, the HItotal values are 0.719–2.100, with an average value of 1.320. For males, females, and children, HItotal values of 0%, 20%, and 80% of the samples exceed 1, indicating that males in the study area do not have associated non-carcinogenic health risks. In contrast, females and children face higher non-carcinogenic risks. Females and children have smaller body weights and therefore have higher average daily exposure dose of contaminants than males [50,60].
Contaminants in groundwater contribute differently to health risks. Concerning each water quality parameter, the non-carcinogenic HQ values of F, NO3-N, NO2-N, NH4-N, Fe, Mn, Hg, Pb, Cr6+, As, and Cd are in the ranges of 0.090–1.501, 1.809 × 10⁻⁵–0.248, 5.789 × 10⁻⁴–0.025, 3.730 × 10⁻⁴–5.793 × 10⁻³, 1.447 × 10⁻³–0.165, 1.034 × 10⁻³–3.487 × 10⁻², 5.288 × 10⁻⁴–7.444 × 10⁻³, 0.114–0.276, 0.030–0.540, 9.648 × 10⁻³–0.023 and 0.033–0.076, respectively. This result suggests that besides F, the non-carcinogenic risks of other contaminants are acceptable to both adults and children. As shown in Figure 4, the contribution of pollutants in groundwater to the HItotal value is observed in the following order: F > Pb > Cr6+ > NO3-N > Cd > As > Fe > Mn > NO2-N > NH4-N > Hg. F contributes the most to non-carcinogenic risk (46.86%), followed by Pb (22.78%) and Cr6+ (11.22%). Contribution of other pollutants to the non-carcinogenic risk is less than 10%, indicating that F, Pb, and Cr6+ may be drivers of adverse effects on human health.
The spatial distribution of HItotal values for males, females, and children is consistent with fluoride concentration (Figure 5). Higher HItotal and F concentration mainly appear in the Yaodu, midwest of the study area. Groundwater with high F is found in semi-arid and arid areas of northern China, such as the middle Loess Plateau [16], Ningxia plain [61], Guanzhong Plain [1,36], Hetao Plain [78], and Tianjin [17]. The respective HQ mean values of F for males, females, and children are 0.503, 0.593, and 1.220 in the Yaodu, indicating that children are exposed to health risks from fluoride. Fluoride-bearing minerals are enriched in magmatic rocks and aluminosilicates exposed to the surface of the area, such as fluorite (CaF2), villiaumite (NaF), and biotite [79,80]. There are also many active fault zones in and around Yaodu, and fluorine-containing volatile gas or hydrothermal fluid migrates upward along the faults and penetrates groundwater, increasing the fluorine content [79]. In addition, areas with high F in groundwater have a higher population density, and industries such as coal mining, metallurgy, and coking are concentrated. Discharge of domestic sewage and industrial wastewater is the other reason for the increase in F concentration in groundwater. Although the Cr6+ concentration of all groundwater samples is within the desirable limit for drinking, it contributes more than 10% to the health risk, similar to Pb.
The carcinogenic risks due to exposure to As, Cd, and Cr6+ through drinking water and dermal contact are shown in Table 6. The ranges of the CRoral for males, females, and children are 6.169 × 10⁻⁵–1.165 × 10⁻⁴, 7.278 × 10⁻⁵–1.370 × 10⁻⁴, and 3.914 × 10⁻⁵–7.391 × 10⁻⁵, with means of 7.156 × 10⁻⁵, 8.442 × 10⁻⁵, and 4.540 × 10⁻⁵, respectively. The results of the CRdermal are slightly smaller than CRoral, ranging from 1.201 × 10⁻⁵–4.400 × 10⁻⁵ for males, 1.263 × 10⁻⁵–4.625 × 10⁻⁵ for females, and 4.725 × 10⁻⁶–1.730 × 10⁻⁵ for children, with means of 1.777 × 10⁻⁵, 1.868 × 10⁻⁵, and 6.989 × 10⁻⁶, respectively. As a result, the CRtotal values for males and females are 7.371 × 10⁻⁵–1.605 × 10⁻⁴ and 8.541 × 10⁻⁵–1.837 × 10⁻⁴, with means of 8.933 × 10⁻⁵ and 1.031 × 10⁻⁴. Concerning children, the CRtotal values range from 4.386 × 10⁻⁵–9.121 × 10⁻⁵ with an average value of 5.239 × 10⁻⁵. The carcinogenic risk values of all samples exceed the acceptable limit (1 × 10⁻⁶) recommended by the Ministry of Ecology and Environment of the P. R. China [64] for both adults and children. Additionally, the carcinogenic risk for adults is higher than for children, especially females. Similar results have also been found by Li et al. [60] and Zhang et al. [50] in Weining Plain and Guanzhong Plain, respectively.
For each contaminant, only the carcinogenic risk of As to children is below the acceptable limit, with an average of 8.317 × 10⁻⁷. As per the average values of the CRtotal, Cd contributes 72.63% to the total CR, Cr6+ and As account for 25.77% and 1.60% of the CRtotal, respectively. From the spatial distribution map of carcinogenic risk, it can be seen that the south-central part of the study area has a higher CRtotal value for both adults and children, especially in Xiangfen and the west Yaodu areas. The coal-bearing formations are distributed all over the Linfen Basin, except Huoshan Mountain in the east of Yaodu and Ta’ershan-Erfengshan Mountain in the south of the study area. The areas with lower CRtotal values in Figure 6 correspond to regions lacking coal-bearing formations. This result suggests that the carcinogenic risk is closely related to the regional geological environment. The natural leaching process and human mining activities will cause many hazardous substances to enter the groundwater. In agricultural activities, the application of N-bearing fertilizers and phosphorous (P)-bearing fertilizers will increase PTEs concentrations such as Cd, Cr, As, and Pb in groundwater under the appropriate favoring geochemical conditions [46,47]. Long-term drinking of such groundwater by residents will increase the risk of visceral cancers such as lung, liver, skin, and kidney [18].
Residents living in the central part of the study area face high health risks (HItotal > 1 and CRtotal > 1 × 10⁻⁶) due to the groundwater being affected by the geological environment and human activities. Therefore, government officials should pay more attention to PTEs pollution in groundwater caused by mining and the production of mineral resources. Furthermore, supplying residents with high-quality drinking water with safe concentrations of F should be the goal of sustainable groundwater management in the Yaodu area. It is urgent to take various measures to treat the polluted groundwater before direct consumption by residents to ensure water safety and people’s health.
Additionally, compared with the results of groundwater quality assessment, we found that although most of the water quality of the study area is in good condition, both adults and children face great health risks, especially carcinogenic. Therefore, the overall groundwater assessment should be accompanied by a health risk assessment to better evaluate the suitability of groundwater for drinking.

4. Conclusions

In this study, groundwater samples from Linfen Basin were collected and analyzed for physicochemical parameters. The water quality index was used to evaluate the groundwater quality, while the health risk was assessed for adults and children concerning different exposure pathways. The main conclusions of the study are as follows:
1. The groundwater in the study area is weakly alkaline, with TH and TDS ranging between 167–869 and 280–1312 mg/L. Compared with the Chinese national standards, 30%, 10%, 20%, 20%, 10%, 10%, and 100% of the total samples exceeded the standard limits of drinking water in terms of TH, TDS, SO42−, F, Fe, Mn, and Pb. Higher TH, TDS, SO42−, Fe, and Mn are mainly distributed in the southeastern part of the study area, while a high concentration of F was observed in the central area of the study.
2. Most groundwater has good water quality and can be used as drinking water. Pb, TH, F, SO42−, and TDS are the most significant parameters affecting groundwater quality. The poor quality of groundwater near Yicheng might be due to the shallow buried depth of groundwater and the good permeability of the aquifer.
3. Contaminated groundwater in the study area can pose human health risks to residents through multiple exposure pathways, including drinking water intake and dermal contact. The total non-carcinogenic health risks for males, females, and children range from 0.302 to 0.902, 0.354–1.051, and 0.719–2.100, respectively. Males do not have associated non-carcinogenic health risks, while females and children face higher non-carcinogenic risks than males. The ranges of the total carcinogenic health risks for males, females, and children are 7.371 × 10⁻⁵–1.605 × 10⁻⁴, 8.541 × 10⁻⁵–1.837 × 10⁻⁴, and 4.386 × 10⁻⁵–9.121 × 10⁻⁵, respectively. The carcinogenic risk exceeds the acceptable limit recommended by the Ministry of Ecology and Environment of the P. R. China for both adults and children. The great risks (HItotal > 1 and CRtotal > 1 × 10⁻⁶) for adults and children all occur in the central study area.

Author Contributions

Conceptualization, J.L. and C.S.; investigation, W.C. and Q.Z.; data curation, J.L. and R.L.; writing—original draft preparation, J.L.; writing—review and editing, J.L., C.S., W.C., and Q.Z.; visualization, S.Z. and Y.W.; supervision, C.S. All authors have read and agreed to the published version of the manuscript.

Funding

This research was funded by the Basic Research Program of Shanxi Province (Free Exploration), grant number 20210302123265 and 20210302123261, and the National Natural Science Foundation of China (41807445).

Institutional Review Board Statement

Not applicable.

Informed Consent Statement

Not applicable.

Data Availability Statement

All processed data used in the study have been shown in the article. Raw data may be available on request from the corresponding author.

Acknowledgments

We thank the editors and reviewers for their valuable comments and suggestions to improve the quality of the paper.

Conflicts of Interest

The authors declare no conflict of interest.

References

  1. Wang, Y.; Li, P. Appraisal of shallow groundwater quality with human health risk assessment in different seasons in rural areas of the Guanzhong Plain (China). Environ. Res. 2022, 207, 112210. [Google Scholar] [CrossRef]
  2. Wegahita, N.K.; Ma, L.; Liu, J.; Huang, T.; Luo, Q.; Qian, J. Spatial Assessment of Groundwater Quality and Health Risk of Nitrogen Pollution for Shallow Groundwater Aquifer around Fuyang City, China. Water 2020, 12, 3341. [Google Scholar] [CrossRef]
  3. Karunanidhi, D.; Aravinthasamy, P.; Deepali, M.; Subramani, T.; Bellows, B.C.; Li, P. Groundwater quality evolution based on geochemical modeling and aptness testing for ingestion using entropy water quality and total hazard indexes in an urban-industrial area (Tiruppur) of Southern India. Environ. Sci. Pollut. Res. 2021, 28, 18523–18538. [Google Scholar] [CrossRef] [PubMed]
  4. Sun, C.; Chen, W.; Shen, Y. The seasonal and spatial distribution of hydrochemical characteristics of groundwater and its controlling factors in the eastern Loess Plateau. Earth Sci. Inform. 2021, 14, 2293–2308. [Google Scholar] [CrossRef]
  5. Xing, L.; Guo, H.; Zhan, Y. Groundwater hydrochemical characteristics and processes along flow paths in the North China Plain. J. Asian Earth Sci. 2013, 70–71, 250–264. [Google Scholar] [CrossRef]
  6. Varol, S.; Davraz, A. Evaluation of the groundwater quality with WQI (Water Quality Index) and multivariate analysis: A case study of the Tefenni plain (Burdur/Turkey). Environ. Earth Sci. 2015, 73, 1725–1744. [Google Scholar] [CrossRef]
  7. Qiao, J.; Zhu, Y.; Jia, X.; Shao, M.; Niu, X.; Liu, J. Distributions of arsenic and other heavy metals, and health risk assessments for groundwater in the Guanzhong Plain region of China. Environ. Res. 2020, 181, 108957. [Google Scholar] [CrossRef] [PubMed]
  8. Nsabimana, A.; Li, P.; He, S.; He, X.; Alam, S.M.K.; Fida, M. Health Risk of the Shallow Groundwater and Its Suitability for Drinking Purpose in Tongchuan, China. Water 2021, 13, 3256. [Google Scholar] [CrossRef]
  9. Shukla, S.; Saxena, A. Appraisal of Groundwater Quality with Human Health Risk Assessment in Parts of Indo-Gangetic Alluvial Plain, North India. Arch. Environ. Contam. Toxicol. 2021, 80, 55–73. [Google Scholar] [CrossRef]
  10. Su, F.; Wu, J.; He, S. Set pair analysis-Markov chain model for groundwater quality assessment and prediction: A case study of Xi’an city, China. Hum. Ecol. Risk Assess. 2019, 25, 158–175. [Google Scholar] [CrossRef]
  11. Knobeloch, L.; Salna, B.; Hogan, A.; Postle, J.; Anderson, H. Blue babies and nitrate-contaminated well water. Environ. Health Perspect. 2000, 108, 675–678. [Google Scholar] [CrossRef]
  12. Kaur, L.; Rishi, M.S.; Siddiqui, A.U. Deterministic and probabilistic health risk assessment techniques to evaluate non-carcinogenic human health risk (NHHR) due to fluoride and nitrate in groundwater of Panipat, Haryana, India. Environ. Pollut. 2020, 259, 113711. [Google Scholar] [CrossRef] [PubMed]
  13. Gulis, G.; Czompolyova, M.; Cerhan, J.R. An ecologic study of nitrate in municipal drinking water and cancer incidence in Trnava District, Slovakia. Environ. Res. 2002, 88, 182–187. [Google Scholar] [CrossRef]
  14. Gao, S.; Li, C.; Jia, C.; Zhang, H.; Guan, Q.; Wu, X.; Wang, J.; Lv, M. Health risk assessment of groundwater nitrate contamination: A case study of a typical karst hydrogeological unit in East China. Environ. Sci. Pollut. Res. 2020, 27, 9274–9287. [Google Scholar] [CrossRef] [PubMed]
  15. Skold, A.; Cosco, D.L.; Klein, R. Methemoglobinemia: Pathogenesis, diagnosis, and management. South. Med. J. 2011, 104, 757–761. [Google Scholar] [CrossRef] [PubMed]
  16. Xiao, J.; Jin, Z.; Zhang, F. Geochemical controls on fluoride concentrations in natural waters from the middle Loess Plateau, China. J. Geochem. Explor. 2015, 159, 252–261. [Google Scholar] [CrossRef]
  17. Zhang, L.; Zhao, L.; Zeng, Q.; Fu, G.; Feng, B.; Lin, X.; Liu, Z.; Wang, Y.; Hou, C. Spatial distribution of fluoride in drinking water and health risk assessment of children in typical fluorosis areas in north China. Chemosphere 2020, 239, 124811. [Google Scholar] [CrossRef]
  18. Qasemi, M.; Shams, M.; Sajjadi, S.A.; Farhang, M.; Erfanpoor, S.; Yousefi, M.; Zarei, A.; Afsharnia, M. Cadmium in Groundwater Consumed in the Rural Areas of Gonabad and Bajestan, Iran: Occurrence and Health Risk Assessment. Biol. Trace Elem. Res. 2019, 192, 106–115. [Google Scholar] [CrossRef]
  19. Li, R.; Kuo, Y.M.; Liu, W.W.; Jang, C.S.; Zhao, E.; Yao, L. Potential health risk assessment through ingestion and dermal contact arsenic-contaminated groundwater in Jianghan Plain, China. Environ. Geochem. Health 2018, 40, 1585–1599. [Google Scholar] [CrossRef]
  20. Pourret, O.; Hursthouse, A. It’s time to replace the term “heavy metals” with “potentially toxic elements” when reporting environmental research. Int. J. Environ. Res. Public Health 2019, 16, 4446. [Google Scholar] [CrossRef] [Green Version]
  21. Papazotos, P. Potentially toxic elements in groundwater: A hotspot research topic in environmental science and pollution research. Environ. Sci. Pollut. Res. 2021, 28, 47825–47837. [Google Scholar] [CrossRef] [PubMed]
  22. Appelo, C.A.J.; Postma, D. Geochemistry, Groundwater and Pollution, 2nd ed.; CRC Press: Boca Raton, FL, USA, 2004; pp. 1–540. [Google Scholar]
  23. Langmuir, D. Aqueous Environmental Geochemistry; Prentice Hall: Upper Saddle River, NJ, USA, 1997; pp. 50–429. [Google Scholar]
  24. Apollaro, C.; Marini, L.; De Rosa, R. Use of reaction path modeling to predict the chemistry of stream water and groundwater: A case study from the Fiume Grande valley (Calabria, Italy). Environ. Geol. 2007, 51, 1133–1145. [Google Scholar] [CrossRef]
  25. Fuoco, I.; De Rosa, R.; Barca, D.; Figoli, A.; Gabriele, B.; Apollaro, C. Arsenic polluted waters: Application of geochemical modelling as a tool to understand the release and fate of the pollutant in crystalline aquifers. J. Environ. Manag. 2022, 301, 113796. [Google Scholar] [CrossRef] [PubMed]
  26. Fuoco, I.; Figoli, A.; Criscuoli, A.; Brozzo, G.; De Rosa, R.; Gabriele, B.; Apollaro, C. Geochemical modeling of chromium release in natural waters and treatment by RO/NF membrane processes. Chemosphere 2020, 254, 126696. [Google Scholar] [CrossRef] [PubMed]
  27. Tian, R.; Wu, J. Groundwater quality appraisal by improved set pair analysis with game theory weightage and health risk estimation of contaminants for Xuecha drinking water source in a loess area in Northwest China. Hum. Ecol. Risk Assess. 2019, 25, 132–157. [Google Scholar] [CrossRef]
  28. Egbueri, J.C. Groundwater quality assessment using pollution index of groundwater (PIG), ecological risk index (ERI) and hierarchical cluster analysis (HCA): A case study. Groundw. Sustain. Dev. 2020, 10, 100292. [Google Scholar] [CrossRef]
  29. Zhou, Y.; Li, P.; Chen, M.; Dong, Z.; Lu, C. Groundwater quality for potable and irrigation uses and associated health risk in southern part of Gu’an County, North China Plain. Environ. Geochem. Health 2021, 43, 813–835. [Google Scholar] [CrossRef]
  30. Horton, R.K. An index number system for rating water quality. J. Water Pollut. Control. Fed. 1965, 37, 300–306. [Google Scholar]
  31. Bordalo, A.A.; Teixeira, R.; Wiebe, W.J. A Water Quality Index applied to an international shared river basin: The case of the Douro River. Environ. Manag. 2006, 38, 910–920. [Google Scholar] [CrossRef]
  32. Sánchez, E.; Colmenarejo, M.F.; Vicente, J.; Rubio, A.; García, M.G.; Travieso, L.; Borja, R. Use of the water quality index and dissolved oxygen deficit as simple indicators of watersheds pollution. Ecol. Indic. 2007, 7, 315–328. [Google Scholar] [CrossRef]
  33. Li, P.; Hui, Q.; Wu, J. Groundwater quality assessment based on improved water quality index in Pengyang County, Ningxia, Northwest China. J. Chem. 2010, 7, S209–S216. [Google Scholar] [CrossRef]
  34. Wu, J.; Zhang, Y.; Zhou, H. Groundwater chemistry and groundwater quality index incorporating health risk weighting in Dingbian County, Ordos basin of northwest China. Geochemistry 2020, 80, 125607. [Google Scholar] [CrossRef]
  35. Asadi, E.; Isazadeh, M.; Samadianfard, S.; Ramli, M.F.; Mosavi, A.; Nabipour, N.; Shamshirband, S.; Hajnal, E.; Chau, K.W. Groundwater Quality Assessment for Sustainable Drinking and Irrigation. Sustainability 2019, 12, 177. [Google Scholar] [CrossRef] [Green Version]
  36. Zhang, Q.; Xu, P.; Qian, H. Groundwater Quality Assessment Using Improved Water Quality Index (WQI) and Human Health Risk (HHR) Evaluation in a Semi-arid Region of Northwest China. Expo. Health 2020, 12, 487–500. [Google Scholar] [CrossRef]
  37. Sener, S.; Sener, E.; Davraz, A. Evaluation of water quality using water quality index (WQI) method and GIS in Aksu River (SW-Turkey). Sci. Total Environ. 2017, 584–585, 131–144. [Google Scholar] [CrossRef]
  38. Kawo, N.S.; Karuppannan, S. Groundwater quality assessment using water quality index and GIS technique in Modjo River Basin, central Ethiopia. J. Afr. Earth Sci. 2018, 147, 300–311. [Google Scholar] [CrossRef]
  39. Ram, A.; Tiwari, S.K.; Pandey, H.K.; Chaurasia, A.K.; Singh, S.; Singh, Y.V. Groundwater quality assessment using water quality index (WQI) under GIS framework. Appl. Water Sci. 2021, 11, 46. [Google Scholar] [CrossRef]
  40. Xiao, J.; Wang, L.; Deng, L.; Jin, Z. Characteristics, sources, water quality and health risk assessment of trace elements in river water and well water in the Chinese Loess Plateau. Sci. Total Environ. 2019, 650, 2004–2012. [Google Scholar] [CrossRef]
  41. Yang, X.; Duan, J.; Wang, L.; Li, W.; Guan, J.; Beecham, S.; Mulcahy, D. Heavy metal pollution and health risk assessment in the Wei River in China. Environ. Monit. Assess. 2015, 187, 111. [Google Scholar] [CrossRef]
  42. Li, P.; Feng, W.; Xue, C.; Tian, R.; Wang, S. Spatiotemporal Variability of Contaminants in Lake Water and Their Risks to Human Health: A Case Study of the Shahu Lake Tourist Area, Northwest China. Expo. Health 2017, 9, 213–225. [Google Scholar] [CrossRef]
  43. Qin, L.T.; Pang, X.R.; Zeng, H.H.; Liang, Y.P.; Mo, L.Y.; Wang, D.Q.; Dai, J.F. Ecological and human health risk of sulfonamides in surface water and groundwater of Huixian karst wetland in Guilin, China. Sci. Total Environ. 2020, 708, 134552. [Google Scholar] [CrossRef] [PubMed]
  44. Guo, Y.; Li, P.; He, X.; Wang, L. Groundwater Quality in and Around a Landfill in Northwest China: Characteristic Pollutant Identification, Health Risk Assessment, and Controlling Factor Analysis. Expo. Health 2022. [Google Scholar] [CrossRef]
  45. Ji, Y.; Wu, J.; Wang, Y.; Elumalai, V.; Subramani, T. Seasonal Variation of Drinking Water Quality and Human Health Risk Assessment in Hancheng City of Guanzhong Plain, China. Expo. Health 2020, 12, 469–485. [Google Scholar] [CrossRef]
  46. Papazotos, P.; Vasileiou, E.; Perraki, M. The synergistic role of agricultural activities in groundwater quality in ultramafic environments: The case of the Psachna basin, central Euboea, Greece. Environ. Monit. Assess. 2019, 191, 1–32. [Google Scholar] [CrossRef] [PubMed]
  47. Papazotos, P.; Vasileiou, E.; Perraki, M. Elevated groundwater concentrations of arsenic and chromium in ultramafic environments controlled by seawater intrusion, the nitrogen cycle, and anthropogenic activities: The case of the Gerania Mountains, NE Peloponnese, Greece. Appl. Geochem. 2020, 121, 104697. [Google Scholar] [CrossRef]
  48. Kubier, A.; Hamer, K.; Pichler, T. Cadmium background levels in groundwater in an area dominated by agriculture. Integr. Environ. Assess. Manag. 2020, 16, 103–113. [Google Scholar] [CrossRef] [Green Version]
  49. Zhang, Y.; Wu, J.; Xu, B. Human health risk assessment of groundwater nitrogen pollution in Jinghui canal irrigation area of the loess region, northwest China. Environ. Earth Sci. 2018, 77, 273. [Google Scholar] [CrossRef]
  50. Zhang, Y.; Xu, B.; Guo, Z.; Han, J.; Li, H.; Jin, L.; Chen, F.; Xiong, Y. Human health risk assessment of groundwater arsenic contamination in Jinghui irrigation district, China. J. Environ. Manag. 2019, 237, 163–169. [Google Scholar] [CrossRef]
  51. Tian, Q.; Yin, J.; Hao, X. MIS3 climate change assessed according to loess deposition in the Linfen Basin, China. Arid. Zone Res. 2022, 39, 10–20. (In Chinese) [Google Scholar]
  52. Lin, R.; Sun, C.; Chen, W.; Qiao, P.; Wang, Y. Groundwater quality characteristics in downstream valley of Fenhe river. J. Arid. Land Resour. Environ. 2021, 35, 135–142. (In Chinese) [Google Scholar]
  53. Zhang, J.J. Structural characteristics of Linfen Basin. Huabei Land Resour. 2017, 3, 27–31. (In Chinese) [Google Scholar]
  54. Bai, L.P.; Wang, Y.Y.; Wang, J.S. The numerical model-based groundwater level early-warning system: A case study of Linfen basin. Geol. China 2009, 36, 246–253. (In Chinese) [Google Scholar]
  55. Wang, Y.; Bai, L.; Wang, J. Influences of climatic anomaly on the groundwater system in Linfen Basin. Resour. Sci. 2009, 31, 1168–1174. (In Chinese) [Google Scholar]
  56. Ministry of Ecology and Environment of the People’s Republic of China. Technical Specifications for Environmental Monitoring of Groundwater (HJ/T 164-2004); China Environmental Science Press: Beijing, China, 2004; pp. 1–40. (In Chinese) [Google Scholar]
  57. Sahu, P.; Sikdar, P.K. Hydrochemical framework of the aquifer in and around East Kolkata Wetlands, West Bengal, India. Environ. Geol. 2008, 55, 823–835. [Google Scholar] [CrossRef]
  58. Yidana, S.M.; Yidana, A. Assessing water quality using water quality index and multivariate analysis. Environ. Earth. Sci. 2010, 59, 1461–1473. [Google Scholar] [CrossRef]
  59. Ministry of Health of the P.R. China; Standardization Administration of the P.R. China. Standards for Groundwater Guality (GB14848–2017); China Standard Press: Beijing, China, 2017; pp. 1–14. (In Chinese) [Google Scholar]
  60. Li, P.; Li, X.; Meng, X.; Li, M.; Zhang, Y. Appraising Groundwater Quality and Health Risks from Contamination in a Semiarid Region of Northwest China. Expo. Health 2016, 8, 361–379. [Google Scholar] [CrossRef]
  61. Chen, J.; Wu, H.; Qian, H.; Gao, Y. Assessing Nitrate and Fluoride Contaminants in Drinking Water and Their Health Risk of Rural Residents Living in a Semiarid Region of Northwest China. Expo. Health 2017, 9, 183–195. [Google Scholar] [CrossRef]
  62. Zhu, L.; Yang, M.; Chen, X.; Liu, J. Health Risk Assessment and Risk Control: Drinking Groundwater in Yinchuan Plain, China. Expo. Health 2019, 11, 59–72. [Google Scholar] [CrossRef]
  63. Wu, J.; Sun, Z. Evaluation of Shallow Groundwater Contamination and Associated Human Health Risk in an Alluvial Plain Impacted by Agricultural and Industrial Activities, Mid-west China. Expo. Health 2016, 8, 311–329. [Google Scholar] [CrossRef]
  64. Ministry of Ecology and Environment of the P.R. China. Technical Guidelines for Risk Assessment of Soil Contamination of Land for Construction (HJ 25.3-2019); China Environmental Science Press: Beijing, China, 2019; pp. 1–48. (In Chinese) [Google Scholar]
  65. USEPA. Risk Assessment Guidance for Superfund, Volume I: Human Health Evaluation Manual (Part A); EPA/540/1-89/002; USEPA: Washington, DC, USA, 1989. [Google Scholar]
  66. National Health Commission of the People’s Republic of China. Report on Nutrition and Chronic Disease Status of Chinese Residents; The State Council Information Office of the People’s Republic of China: Beijing, China, 2020. (In Chinese) [Google Scholar]
  67. USEPA. Risk Assessment Guidance for Superfund, Volume I: Human Health Evaluation Manual (Part E, Supplemental Guidance for Dermal Risk Assessment) Final; EPA/540/R-99/005; USEPA: Washington, DC, USA, 2004. [Google Scholar]
  68. Mohamed, A.K.; Dan, L.; Kai, S.; Mohamed, M.A.A.; Aldaw, E.; Elubid, B.A. Hydrochemical Analysis and Fuzzy Logic Method for Evaluation of Groundwater Quality in the North Chengdu Plain, China. Int. J. Environ. Res. Public Health 2019, 16, 302. [Google Scholar] [CrossRef] [Green Version]
  69. Liu, Y.L.; Luo, K.L.; Lin, X.X.; Gao, X.; Ni, R.X.; Wang, S.B.; Tian, X.L. Regional distribution of longevity population and chemical characteristics of natural water in Xinjiang, China. Sci. Total Environ. 2014, 473–474, 54–62. [Google Scholar] [CrossRef]
  70. Karakuş, C.B. Evaluation of groundwater quality in Sivas province (Turkey) using water quality index and GIS-based analytic hierarchy process. Int. J. Environ. Health Res. 2019, 29, 500–519. [Google Scholar] [CrossRef] [PubMed]
  71. Ramakrishnaiah, C.R.; Sadashivaiah, C.; Ranganna, G. Assessment of water quality index for the groundwater in Tumkur Taluk, Karnataka State, India. J. Chem. 2009, 6, 523–530. [Google Scholar] [CrossRef] [Green Version]
  72. Xie, H.; Liang, Y.; Li, J.; Zou, S.; Shen, H.; Zhao, C.; Wang, Z. Distribution Characteristics and Health Risk Assessment of Metal Elements in Groundwater of Longzici Spring Area. Environ. Sci. 2021, 42, 4257–4266. (In Chinese) [Google Scholar]
  73. Korner, P.; Georgis, L.; Wiedemeier, D.B.; Attin, T.; Wegehaupt, F.J. Potential of different fluoride gels to prevent erosive tooth wear caused by gastroesophageal reflux. BMC Oral Health 2021, 21, 183. [Google Scholar] [CrossRef] [PubMed]
  74. Su, H.; Kang, W.; Xu, Y.; Wang, J. Assessing Groundwater Quality and Health Risks of Nitrogen Pollution in the Shenfu Mining Area of Shaanxi Province, Northwest China. Expo. Health 2018, 10, 77–97. [Google Scholar] [CrossRef]
  75. Hou, C.; Chu, M.L.; Botero-Acosta, A.; Guzman, J.A. Modeling field scale nitrogen non-point source pollution (NPS) fate and transport: Influences from land management practices and climate. Sci. Total Environ. 2021, 759, 143502. [Google Scholar] [CrossRef] [PubMed]
  76. Chen, J.; Wu, H.; Qian, H. Groundwater Nitrate Contamination and Associated Health Risk for the Rural Communities in an Agricultural Area of Ningxia, Northwest China. Expo. Health 2016, 8, 349–359. [Google Scholar] [CrossRef]
  77. Zhang, Z.; Xiao, C.; Adeyeye, O.; Yang, W.; Liang, X. Source and Mobilization Mechanism of Iron, Manganese and Arsenic in Groundwater of Shuangliao City, Northeast China. Water 2020, 12, 534. [Google Scholar] [CrossRef] [Green Version]
  78. He, X.; Ma, T.; Wang, Y.; Shan, H.; Deng, Y. Hydrogeochemistry of high fluoride groundwater in shallow aquifers, Hangjinhouqi, Hetao Plain. J. Geochem. Explor. 2013, 135, 63–70. [Google Scholar] [CrossRef]
  79. Shen, L.; Wang, W. Distribution of fluorin ion in Yao du District of Lin fen City and causes of formation. Water Resour. Prot. 2005, 21, 76–78. (In Chinese) [Google Scholar]
  80. Adimalla, N.; Wu, J. Groundwater quality and associated health risks in a semi-arid region of south India: Implication to sustainable groundwater management. Hum. Ecol. Risk Assess. 2019, 25, 191–216. [Google Scholar] [CrossRef]
Figure 1. (a) Spatial distribution of groundwater sampling sites and groundwater depths and (b) Regional hydrogeological map of the study area.
Water 14 01371 g001
Figure 2. Spatial distributions of mass concentrations of groundwater hydrochemical parameters: (a) TH, (b) TDS, (c) SO42−, (d) F, (e) NO3-N, (f) NO2-N, (g) NH4-N, (h) Fe, (i) Mn, (j) Hg, (k) As, (l) Cd, (m) Cr6+, and (n) Pb.
Water 14 01371 g002
Figure 3. Spatial distribution of groundwater quality based on water quality index values.
Water 14 01371 g003
Figure 4. Contributive ratios of contaminants in groundwater to health risks (a) non-carcinogenic risk; and (b) carcinogenic risk.
Water 14 01371 g004
Figure 5. Spatial distribution of non-carcinogenic health risks for males (a), females (b), and children (c).
Water 14 01371 g005
Figure 6. Spatial distribution of carcinogenic health risks for males (a), females (b), and children (c).
Water 14 01371 g006
Table 1. Definition and values of key parameters for human health risk assessment.
ParametersUnitsValues
MalesFemalesChildren
Ingestion rate (IR)L/day1 a1 a0.7 a
Exposure frequency (EF)day/a350 a350 a350 a
Exposure duration (ED)a24 a24 a6 a
Body weight (BW)kg69.6 b59 b19.2 b
Average time (AT)day8400 a8400 a2190 a
Skin permeability coefficient (K)cm/h0.002 for Cr6+ and 0.001 for other parameters c
Contact duration (t)h/day0.4 d
Conversion factor (CF)-0.001 c
Average height (H)cm169.7 b158 b113.15 b
Daily exposure frequency (EV)-1 a
a refer to [64]; b refer to [66]; c refer to [67]; d refer to [63].
Table 2. The values of RfD, ABSgi, and SF for different ions.
ParametersNon-Carcinogenic Carcinogenic ABSgi
RfDoralRfDdermalSForalSFdermal
Cr6+0.0030.0000750.4216.80.025
As0.00030.00031.51.51
Cd0.0010.000056.11220.05
F0.040.04 1
NO3-N1.61.6 1
NO2-N0.10.1 1
NH4-N0.970.97 1
Fe0.30.3 1
Mn0.140.14 1
Hg0.00030.000021 0.07
Pb0.00140.0014 1
Table 3. Statistical analysis results for hydrochemical parameters of groundwater.
ParametersMinMaxMeanMedianSDC.V (%)Chinese StandardsP a (%)
pH7.277.857.597.630.1752.3066.5–8.50
TH167869426359202.76847.55445030
TDS2801312689637282.27140.968100010
SO42−68536182136135.68974.48925020
Cl7.9388.1047.649.326.18855.0552500
F0.251.710.750.690.38251.226120
cyanide0.00040.00040.00040.00040.00000.050
volatile phenols0.00030.0020.000470.00030.001108.5110.0020
CODMn0.10.90.30.20.22991.65230
NO3-N0.00211.3004.7602.2554.26489.567200
NO2-N0.0040.0700.0150.0040.023150.27710
NH4-N0.0250.1600.0650.0340.04873.4570.50
Fe0.031.410.180.030.411232.5330.310
Mn0.0100.1390.0230.0100.039163.9180.110
Hg0.000010.000060.0000170.000010.0000291.3190.0010
As0.00020.00020.00020.00020.0000.0000.010
Cd0.0020.0020.0020.0020.0000.0000.0050
Cr6+0.0040.0340.0090.0060.00993.8580.050
Pb0.0110.0110.0110.0110.0000.0000.01100
a percentage of the sample exceeding the permissible limits. Units for all parameters are in mg/L, except for pH (non-dimensional).
Table 4. Relative weight of hydrochemical parameters.
ParametersChinese StandardsWeight(wi)Relative Weight (Wi)
pH6.5–8.540.0588
TDS100050.0735
TH45050.0735
SO42−25050.0735
Cl25020.0294
F150.0735
Volatile phenols0.00220.0294
NO3-N2040.0588
NO2-N140.0588
NH4-N0.540.0588
Fe0.350.0735
Mn0.150.0735
Hg0.00130.0441
Cd0.00550.0735
Cr6+0.0550.0735
Pb0.0150.0735
∑wi = 68∑Wi = 1
Units for all parameters are in mg/L, except pH (non-dimensional).
Table 5. Water quality index values and water types in the study area.
SampleWQIWater QualitySampleWQIWater Quality
S137.91Excellent waterS640.77Excellent water
S223.63Excellent waterS732.88Excellent water
S332.20Excellent waterS838.36Excellent water
S438.83Excellent waterS942.18Excellent water
S550.17Good waterS10105.96Poor water
Table 6. The non-carcinogenic and carcinogenic risk results from drinking water and dermal contact.
SampleThe Non-Carcinogenic Risk
HQoralHQdermalHItotal
MalesFemalesChildrenMalesFemalesChildrenMalesFemalesChildren
S10.3930.4630.9560.0180.0190.027 0.4110.4820.983
S20.2850.3360.6930.0170.0180.026 0.3020.3540.719
S30.4360.5141.0600.0180.0190.028 0.4540.5331.088
S40.5290.6251.2880.0190.0200.029 0.5480.6441.317
S50.8270.9762.0120.0430.0450.065 0.8701.0212.077
S60.7990.9421.9430.1040.1090.156 0.9021.0512.100
S70.4550.5361.1060.0270.0280.040 0.4810.5641.146
S80.5280.6231.2850.0300.0320.046 0.5580.6551.330
S90.4010.4730.9750.0430.0450.065 0.4430.5181.040
S100.5620.6631.3680.0190.0200.029 0.5820.6841.397
Mean 0.5210.6151.2690.0340.0360.0510.5550.6511.320
SampleThe Carcinogenic Risk
CRoralCRdermalCRtotal
MalesFemalesChildrenMalesFemalesChildrenMalesFemalesChildren
S16.169 × 10−57.278 × 10−53.914 × 10−51.201 × 10−51.263 × 10−54.725 × 10−67.371 × 10−58.541 × 10−54.386 × 10−5
S26.169 × 10−57.278 × 10−53.914 × 10−51.201 × 10−51.263 × 10−54.725 × 10−67.371 × 10−58.541 × 10−54.386 × 10−5
S36.169 × 10−57.278 × 10−53.914 × 10−51.201 × 10−51.263 × 10−54.725 × 10−67.371 × 10−58.541 × 10−54.386 × 10−5
S46.169 × 10−57.278 × 10−53.914 × 10−51.201 × 10−51.263 × 10−54.725 × 10−67.371 × 10−58.541 × 10−54.386 × 10−5
S57.631 × 10−59.000 × 10−54.841 × 10−52.054 × 10−52.160 × 10−58.079 × 10−69.686 × 10−51.116 × 10−45.648 × 10−5
S61.165 × 10−41.370 × 10−47.391 × 10−54.400 × 10−54.625 × 10−51.730 × 10−51.605 × 10−41.837 × 10−49.121 × 10−5
S76.718 × 10−57.924 × 10−54.261 × 10−51.521 × 10−51.599 × 10−55.983 × 10−68.239 × 10−59.524 × 10−54.860 × 10−5
S86.900 × 10−58.140 × 10−54.377 × 10−51.628 × 10−51.711 × 10−56.402 × 10−68.528 × 10−59.851 × 10−55.018 × 10−5
S97.814 × 10−59.218 × 10−54.957 × 10−52.161 × 10−52.272 × 10−58.498 × 10−69.975 × 10−51.149 × 10−45.807 × 10−5
S106.169 × 10−57.278 × 10−53.914 × 10−51.201 × 10−51.263 × 10−54.725 × 10−67.371 × 10−58.541 × 10−54.386 × 10−5
Mean7.156 × 10−58.442 × 10−54.540 × 10−51.777 × 10−51.868 × 10−56.989 × 10−68.933 × 10−51.031 × 10−45.239 × 10−5
Publisher’s Note: MDPI stays neutral with regard to jurisdictional claims in published maps and institutional affiliations.

