Article

Impact of Livestock Farming on Nitrogen Pollution and the Corresponding Energy Demand for Zero Liquid Discharge

1
DVGW-Research Center, Water Chemistry and Water Technology, 76131 Karlsruhe, Germany
2
Engler-Bunte-Institute, Water Chemistry and Water Technology, Karlsruhe Institute of Technology, 76131 Karlsruhe, Germany
*
Author to whom correspondence should be addressed.
Water 2022, 14(8), 1278; https://doi.org/10.3390/w14081278
Submission received: 25 March 2022 / Revised: 12 April 2022 / Accepted: 14 April 2022 / Published: 15 April 2022
(This article belongs to the Section Water Quality and Contamination)

Abstract

:
Intensive livestock farming has negatively impacted the environment by contributing to the release of ammonia and nitrous oxide, groundwater nitrate pollution and eutrophication of rivers and estuaries. The nitrogen footprint calculator has predicted the large impact of meat production on global nitrogen loss, but it could not form the relationship between meat production and the corresponding manure generation. Here we report on the formation of direct relationships between beef, pork and poultry meat production and the corresponding amount of nitrogen loss through manure. Consequently, the energy demand for ammonium nitrogen recovery from manure is also reported. Nitrogen loss to the environment per unit of meat production was found directly proportional to the virtual nitrogen factors. The relationship between total nitrogen intake and the corresponding nitrogen loss per kg of meat production was also found linear. Average nitrogen loss due to manure application was calculated at 110 g kg−1 for poultry. The average nitrogen loss increased to 190 and 370 g-N kg−1 for pork and beef productions, respectively. Additionally, 147 kg ammonium nitrogen was calculated to be recovered from 123 m3 of manure. This corresponded to 1 Mg of beef production. The recovery of ammonium nitrogen was reduced to 126 and 52 kg from 45 and 13 m3 of pork and poultry manure, respectively. The ammonium nitrogen recovery values were calculated with respect to 1 Mg of both pork and poultry meat productions. Consequently, the specific energy demand of ammonium nitrogen recovery from beef manure was noticed at 49 kWh kg−1, which was significantly 57% and 69% higher than that of pork and poultry manure, respectively.

Graphical Abstract

1. Introduction

Worldwide anthropogonic release of reactive nitrogen to aquatic bodies and the atmosphere has ecosystem- and human health-damaging potential, which has left the Haber–Bosch process as the main source of nitrogen [1,2,3,4,5]. Damage related to nitrogen pollution per year in European Union (EU) has been calculated as about EUR 70 to EUR 320 billion [6]. Furthermore, nitrogen pollution by 2050 is predicted to rise significantly, 102 to 156% of 2010’s value, and can only be controlled under strict measurements applied by individual nations [7]. The nitrogen footprint of a country has therefore emerged as the most useful tool to identify the reactive nitrogen emission during the production and handling of an entity, irrespective of its domestic and worldwide use [3,8,9]. Previously nitrogen footprint per capita were calculated for Germany [8,10], US [8], UK [11], Netherlands [8], Austria [12], Australia [13], Japan [14,15] and Tanzania [16].
Godfray et al. [17] has rightly mentioned that the security and sustainability of global food consumption will largely depend on livestock source food consumption. Nearly 80% of the total nitrogen footprint was estimated as food nitrogen footprint. Consequently, 50% of the food nitrogen footprint was predicted as beef nitrogen footprint, followed by pork and poultry nitrogen footprint [13,15]. This accounted for a staggering one-third of total nitrogen emissions from the global economy [18] and was able to reduce 0.3–3% of global gross domestic product (GDP) [19]. While roaming around the livestock farming and agricultural supply chain, 50 to 80% of the meat nitrogen footprint is subsequently released into the atmospheric and aquatic environment via manure [7,8,13]. This causes severe water pollution by releasing nitrate and air pollution by releasing ammonia and greenhouse gas nitrous oxide [7,9,20,21,22,23,24,25,26].
However, the ammonium nitrogen from manure can be recovered in the form of ammonia water [27], which can further be valorized into a new end product (e.g., fertilizers, textiles, plastics). This promotes a circular approach to resource utilization [28].
Several mechanical and chemical processes such as screw press, centrifugation, sedimentation, hydrogel application and ammonia stripping at high temperature [29] were followed previously for manure treatment and nutrient recovery. However, these processes were very complex, least efficient and often required high chemical or energy demand [30]. Later membrane filtration processes turned popular due to their higher efficiency in nutrient recovery [31]. However, the demand from the fertilizer market calls for a concentrated nutrient stream production [32] which currently solely membrane filtration is unable to achieve [33]. Therefore, the zero liquid discharge approach was selected for this study. This enabled the lowering of nitrogen pollution by recovering the maximum amount of ammonium nitrogen and presented the highest energy consumption scenario. The average energy consumption per m3 of manure treatment of various processes is presented in Table 1.
Although many studies have already predicted the amount of nitrogen waste due to beef, pork and poultry meat production [8,11,12,15], little research has been conducted so far on its direct correlation with manure generation and the corresponding nitrogen loss through it. Furthermore, it is the need of the hour to estimate the energy required to recover the potentially lost nitrogen through manure to have an outlook of the real price of meat.
Therefore, the objective of this study was to understand the impact of livestock farming on nitrogen pollution due to the substantial amount of manure generation and the corresponding energy demand for its treatment.

2. Materials and Methods

2.1. Manure Quantification for Nitrogen Recovery per kg Meat Production

The following calculation methods allow quantifying the amount of beef, pork and poultry manure to be treated for complete nitrogen recovery corresponding to 1 kg of beef, pork and poultry meat production, respectively. The manure is considered to be fresh manure to avoid the nitrogen loss estimation during storage and handling [36].

2.1.1. Nitrogen Content (NC) per kg Meat

The variation in protein values among different countries (especially in the EU) in beef, pork and poultry meat varies by 2–3% [10]. Therefore, the average protein values per kg of meat of beef, pork and poultry of 260, 210 and 270 g, respectively, from the USDA nutrient database [37] were considered for simplifying the calculation method. Protein contains 16% of nitrogen [12,38]. Hence, nitrogen content (NC) of beef (NCbeef), pork (NCpork) and poultry (NCpoultry) per kg of the respective produced meat was calculated as follows:
NCbeef = (0.16 × 260) g = 41.6 g∙kg−1
NCpork = (0.16 × 210) g = 33.6 g∙kg−1
NCpoultry = (0.16 × 270) g = 43.2 g∙kg−1

2.1.2. Nitrogen Loss (NL) per kg Meat Production

Virtual nitrogen factor (VNF), calculated from nitrogen footprint calculators, represents the amount of lost nitrogen per unit nitrogen content (NC) in respective meat [8,38] in this calculation method. The lost nitrogen (NL) amount per kg of meat production was calculated as follows:
NL = NC × VNF g kg−1
NL of beef, pork and poultry meats are represented as NLbeef, NLpork and NLpoultry, respectively.

2.1.3. Total Nitrogen Intake (TNI) per kg Meat Production

Total nitrogen intake (TNI) calculation was based on the NC and NL per kg produced meat. TNI was calculated as follows:
TNI = NL + NC g kg−1
TNI of beef, pork and poultry meats are represented as TNIbeef, TNIpork and TNIpoultry, respectively.

2.1.4. Nitrogen Loss in Manure (NM) per kg Meat Production

The average nitrogen loss (NM) in beef manure (NMbeef) is observed at 80% [8,13] of TNIbeef, followed by 54% [13,39] of TNIpork in pork manure (NMpork) and 50% [13,40] TNIpoultry in poultry manure (NMpoultry). The rest of the TNI is lost from the plant and soil system as crop processing waste [8,13]. NMbeef, NMpork and NMpoultry were calculated as follows:
NMbeef = 0.8 × TNIbeef g kg−1
NMpork = 0.54 × TNIpork g kg−1
NMpoultry = 0.5 × TNIpoultry g kg−1

2.1.5. Quantity of Manure (QM) to Be Treated for Nitrogen Recovery per kg Produced Meat

Variation in nitrogen concentration (Cmanure N) in manure depends on multiple reasons, e.g., animal feed quality and growth rate, manure storage and handling processes, seasonal conditions, etc. [41]. Therefore, the average Cmanure N value of 2.4, 3.4 and 6.8 gL−1 in beef [42], pork [43] and poultry [44] manure were used, respectively, for calculating the quantity of manure (QM) to be treated for nitrogen recovery per kg produced meat.
QM = (NM/Cmanure N) L kg−1
QM of beef, pork and poultry meats are represented as QMbeef, QMpork and QMpoultry, respectively.

2.2. Ammonium Nitrogen Recovery (AR) from Manure per kg Produced Meat

The ammonium nitrogen from animal manure can be recovered faster (in the form of ammonia water) and valorized into a new end product than the other fraction of organically bound nitrogen [27,45]. The ammonium nitrogen (Cmanure NH4-N) concentration of 1.2, 2.8 and 4 g L−1 in beef [42], pork [43] and poultry [44] manure were considered for potential 100% Cmanure NH4-N recovery (AR) calculation, respectively. The calculation methods were as follows:
AR = (Cmanure NH4-N × QM) g kg−1
AR of beef, pork and poultry meats are represented as ARbeef, ARpork and ARpoultry, respectively.

2.3. Energy Demand (ED) for Manure Treatment

Among the available manure treatment methods, vacuum evaporation and membrane filtration are proven to be the best available alternative methods. The energy demand of vacuum evaporation and membrane filtration for manure treatment was observed 15 and 30 kWh/m3 manure [34], respectively. Nevertheless, both of these processes are only able to partial AR from manure [27]. As this calculation method was focused on the complete recovery of Cmanure NH4-N from manure, the usage of a different concept was needed. This led to zero discharge treatment (ZLD) of manure, which presented maximum ED. Hence, an ED of 58.6 kWh/m3 [35] was considered for the following calculations:
ED = (QM × 58.6) kWh Mg−1
ED of beef, pork and poultry meats are represented as EDbeef, EDpork and EDpoultry, respectively. Whereas AR depends both on Cmanure NH4-N and QM, the ED is only dependent on QM.

3. Results and Discussion

3.1. NL in Meat Production

VNF of beef, pork and poultry meat production of Germany [8], US [8,11], UK [8,11], China [38], Japan [14], Australia [13], Tanzania [16], The Netherlands [8] and Austria [12] were taken from the previous literature for NL and TNI calculations. The VNF, NL and TNI values of the above-mentioned countries were presented in Table S1. NL and TNI were determined by following Equations (1) and (2), respectively. NL was found to be directly proportional to the VNF values (Figure 1A). NL and TNI were also noticed to be directly proportional to each other (Figure 1B). Beef production was found to have the highest NL and TNI among all the countries, followed by pork and poultry.
Higher VNFbeef values reflected that the beef productions were more prone to nitrogen loss. The average nitrogen loss for poultry was calculated at 150 g per kg of poultry meat production. The loss raised to nearly 180 and 350 g of nitrogen per kg of pork and beef production, respectively (Figure 1A). The substantial gap between NL and NC revealed the degree of nitrogen footprint related to meat production. Consequently, the higher nitrogen intake led to higher nitrogen loss for meat production. Therefore, the average TNIbeef was noticed to be 10 times higher than the NCbeef. Although, the gap reduced to an average of 4 and 5 times for poultry and pork, respectively.
Figure 2 presents a flow chart of the fate of nitrogen in beef, pork and poultry production, where TNI is considered as 100% in each case. NMbeef, NMpork and NMpoultry were calculated using Equations (3)–(5), respectively. As discussed above, considerably increased NL in beef production was noticed as the relative NC value was lower than the pork and poultry. The NMbeef was found in 90% of the NLbeef. The value decreased to nearly 50 to 60% for poultry and pork, respectively. Crop processing waste for poultry and pork was found to be significantly high [13], which contributed to the other large part of the NL.
Beef production was found to be the most endangered for nitrogen footprint in the larger part of the world [8,11,12,13,14,16]. This is attributed to the substantial feed demand and steep basal metabolic rate of beef [8,14,46,47]. Therefore, NMbeef was observed to be significantly higher than NMpork and NMpoultry (Figure 2). The nitrogen loss for pork and poultry meat production was dominated by the poor manure management processes rather than feed and digestibility factors [10,48].

3.2. Comparison among Countries

Figure 3 represents nitrogen loss in manure and the quantity of manure to be treated for nitrogen recovery per 1 kg of beef, pork and poultry meat production, respectively, among the different countries. The NMbeef was found to be the highest, which corresponded to 80% of their TNI. The least VNF for beef was noticed for Austria. It was 2.5 to 3 units lesser than the other European countries. Therefore, the NMbeef in Austria was found to be the least in Europe. NMbeef of the Netherlands was noticed even higher than the Germany, UK and US. Australia’s NMbeef was calculated second highest, only second to Japan. The NMbeef of Japan was found to be nearly five times higher than the other Asian country China and nearly three times higher than the other European countries. Nearly 50% of both pork and poultry TNI ended up in NM. However, NMpork was calculated higher than NMpoultry due to their higher VNF values (Table S1). A similar trend of NM among the stated countries was also noticed for pork and poultry. However, China’s NMpork was found to be nearly double that of the other countries apart from Japan. Tanzania had the least value of NMpork and NMpoultry. The differences between NMpork and NMpoultry were not significant in the US, Australia and the other European countries.
QM to be treated per kg meat production was calculated using Equation (6). High NM value and low Cmanure-N led to very high QM values for beef production in all countries compared to pork and poultry. Double Cmanure-N of poultry than pork led QMpoultry values to be significantly lower than QMpork. The trend was noticed to be pretty similar to the NM trends as discussed above. Japan was found with the highest QM values for all three kinds of meat. Tanzania had the least QMpork and QMpoultry values. Interestingly, China’s QMpork was slightly lower than its QMbeef, although its NMpork was much higher than the NMbeef per kg meat production. This reflects the substantial differences between QMbeef and other QM values of a country. No significant differences in QM values were noticed between the US and the other European countries.
The lower efficiency of nitrogen used for feed crops and animal stubby feed nitrogen conservation [14] ratio led to a very high quantity of NM and QM for Japan. Additionally, the international food and feed trade affected Japan’s overall nitrogen footprint. The country relies largely on imported food (about 61%). Hence, a big portion of nitrogen loss happened during production in the exporting country itself [14]. High VNFbeef due to very high beef consumption [13] resulted in a substantial QMbeef amount for Australia. On the contrary, pork consumption in China is the largest [38]. Poor pork manure management process [49,50] intensified high VNFpork for China. This decreed in China’s relatively higher QMpork. The US and the EU countries, such as Germany, the UK, Netherlands and Austria, have high nitrogen nutrient recovery rates due to their advanced treatment techniques [10,15]. This led to their moderate to low NM and QM values. Especially, Austria’s VNFbeef was found to be noticeably lower than the others [3,8,12,15]. Moderate meat consumption, in general, is considered the main reason behind it [12]. This is also reflected in relatively lower QM in Austria. Tanzania’s protein consumption is even lower than the WHO’s calculated daily need of 75 g per adult [51], supported by its lower VNF values [16]. This resulted in the lowest NM and QM values for Tanzania.

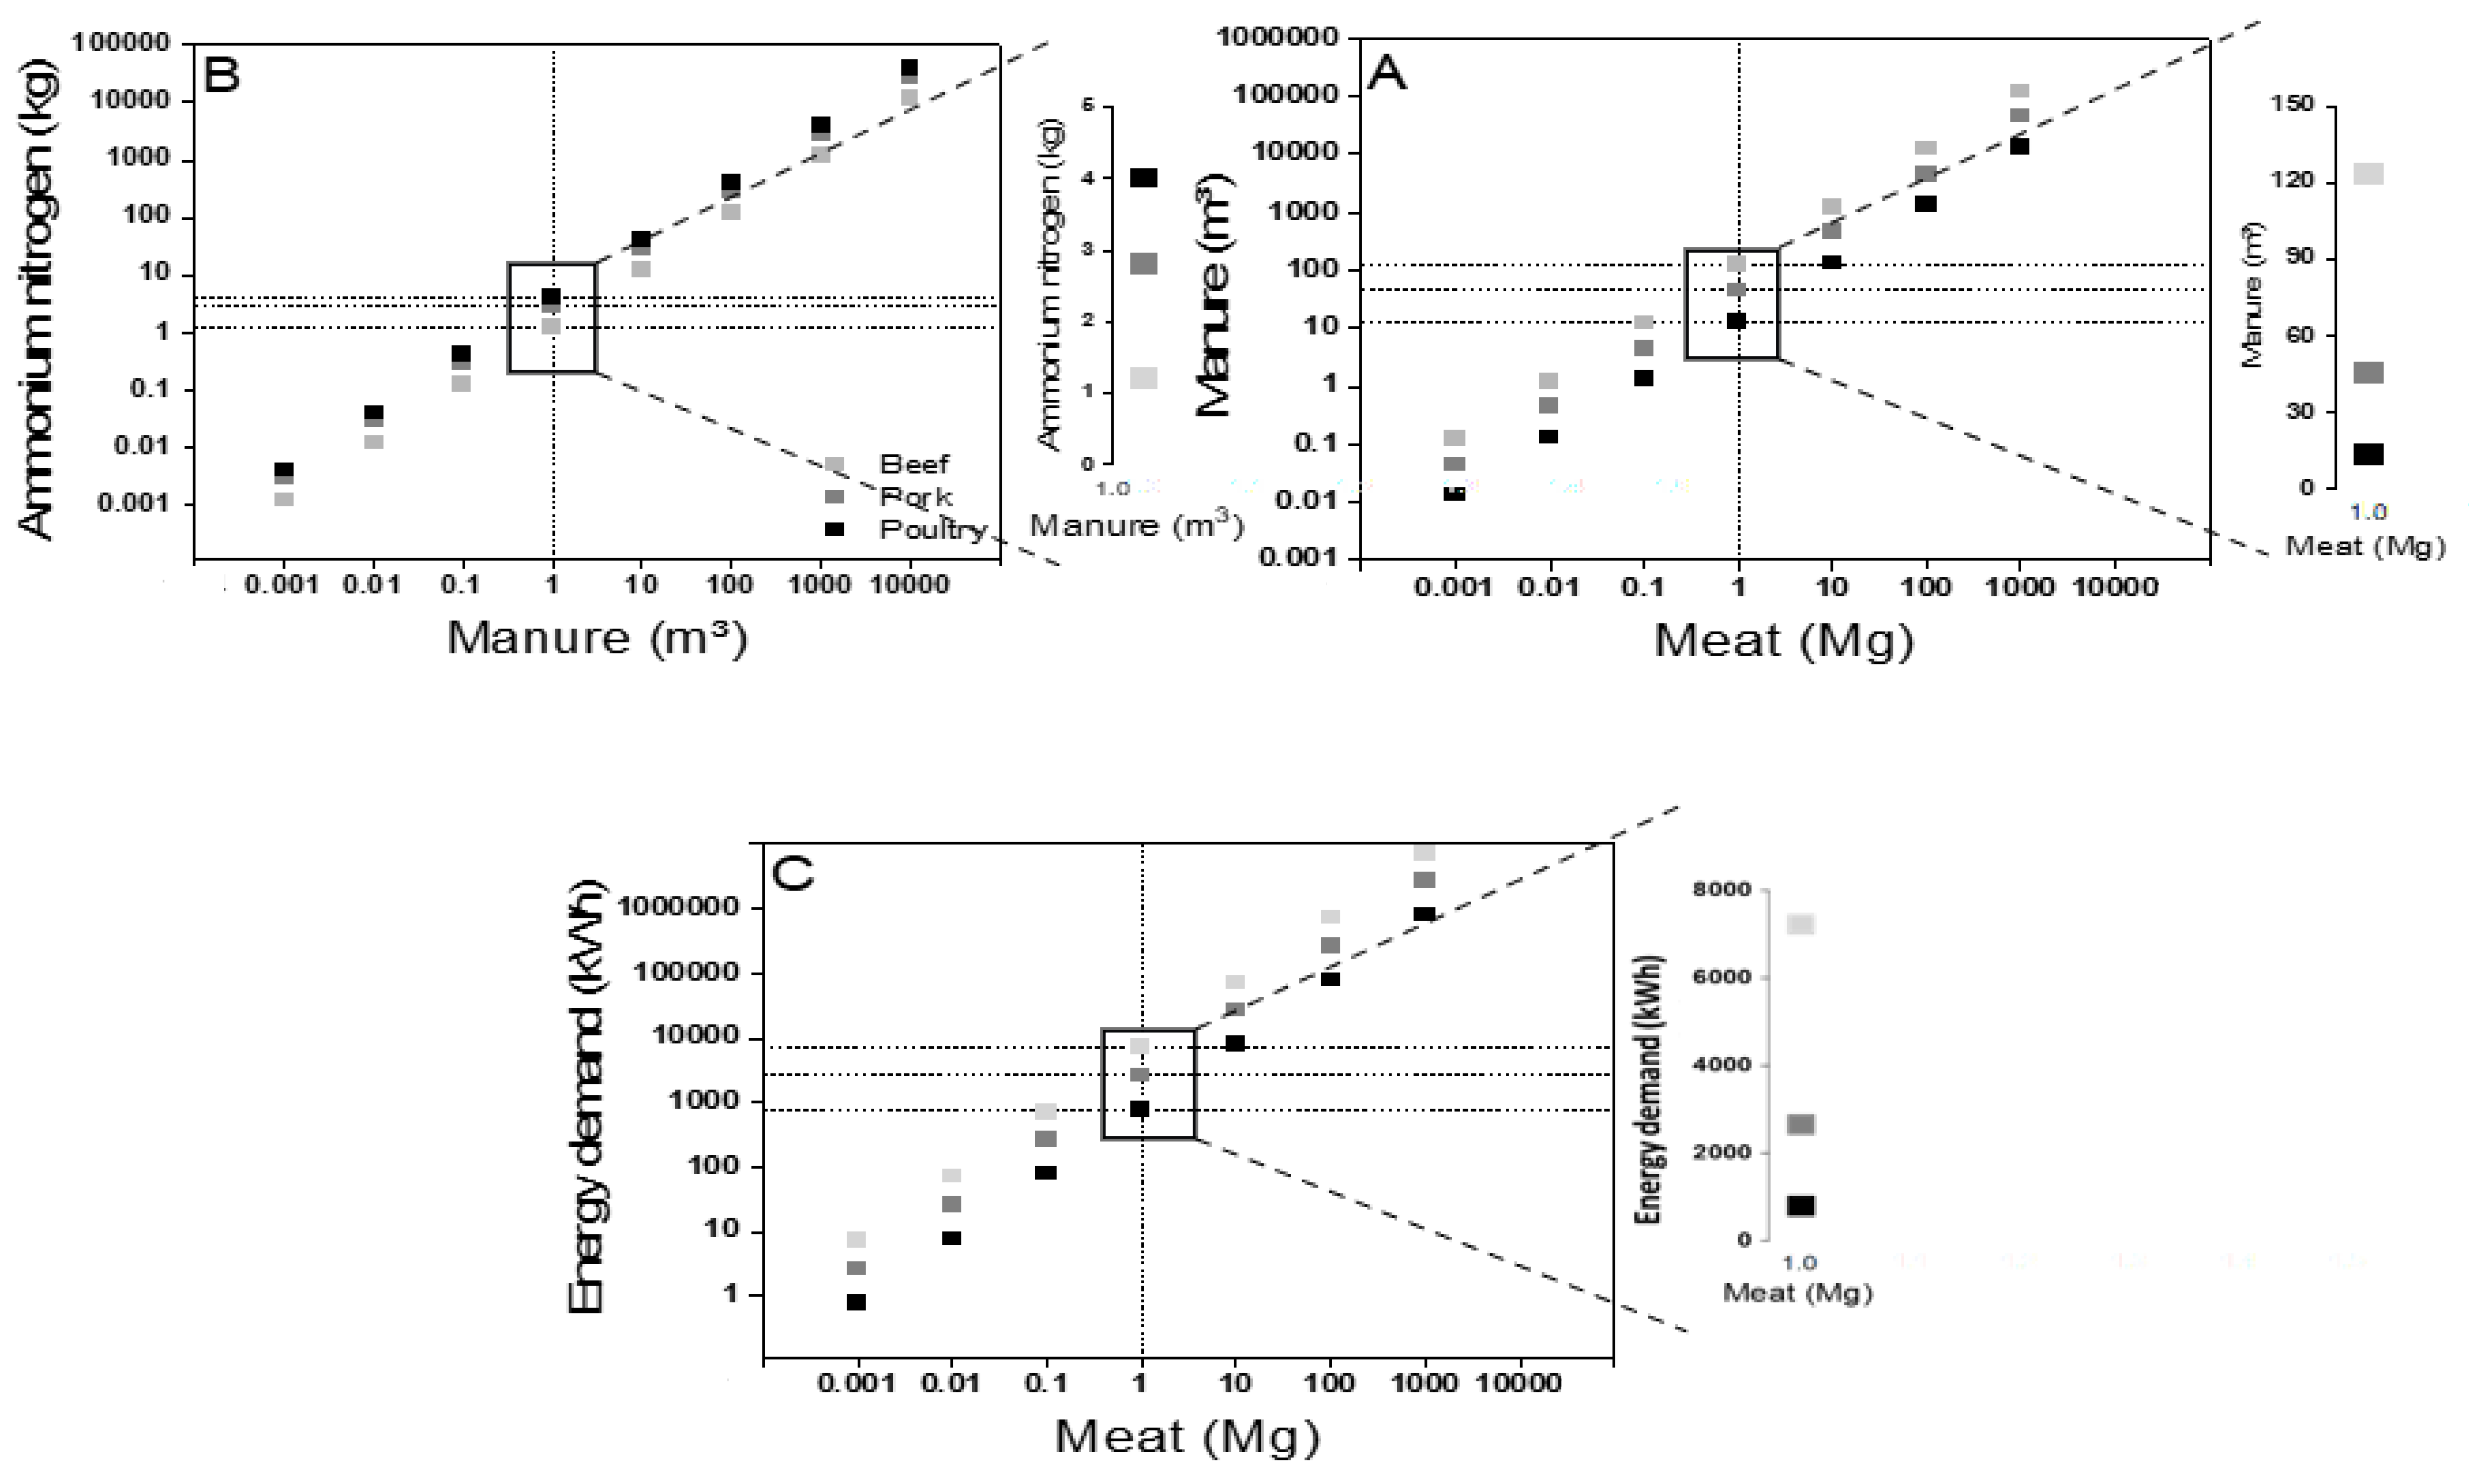
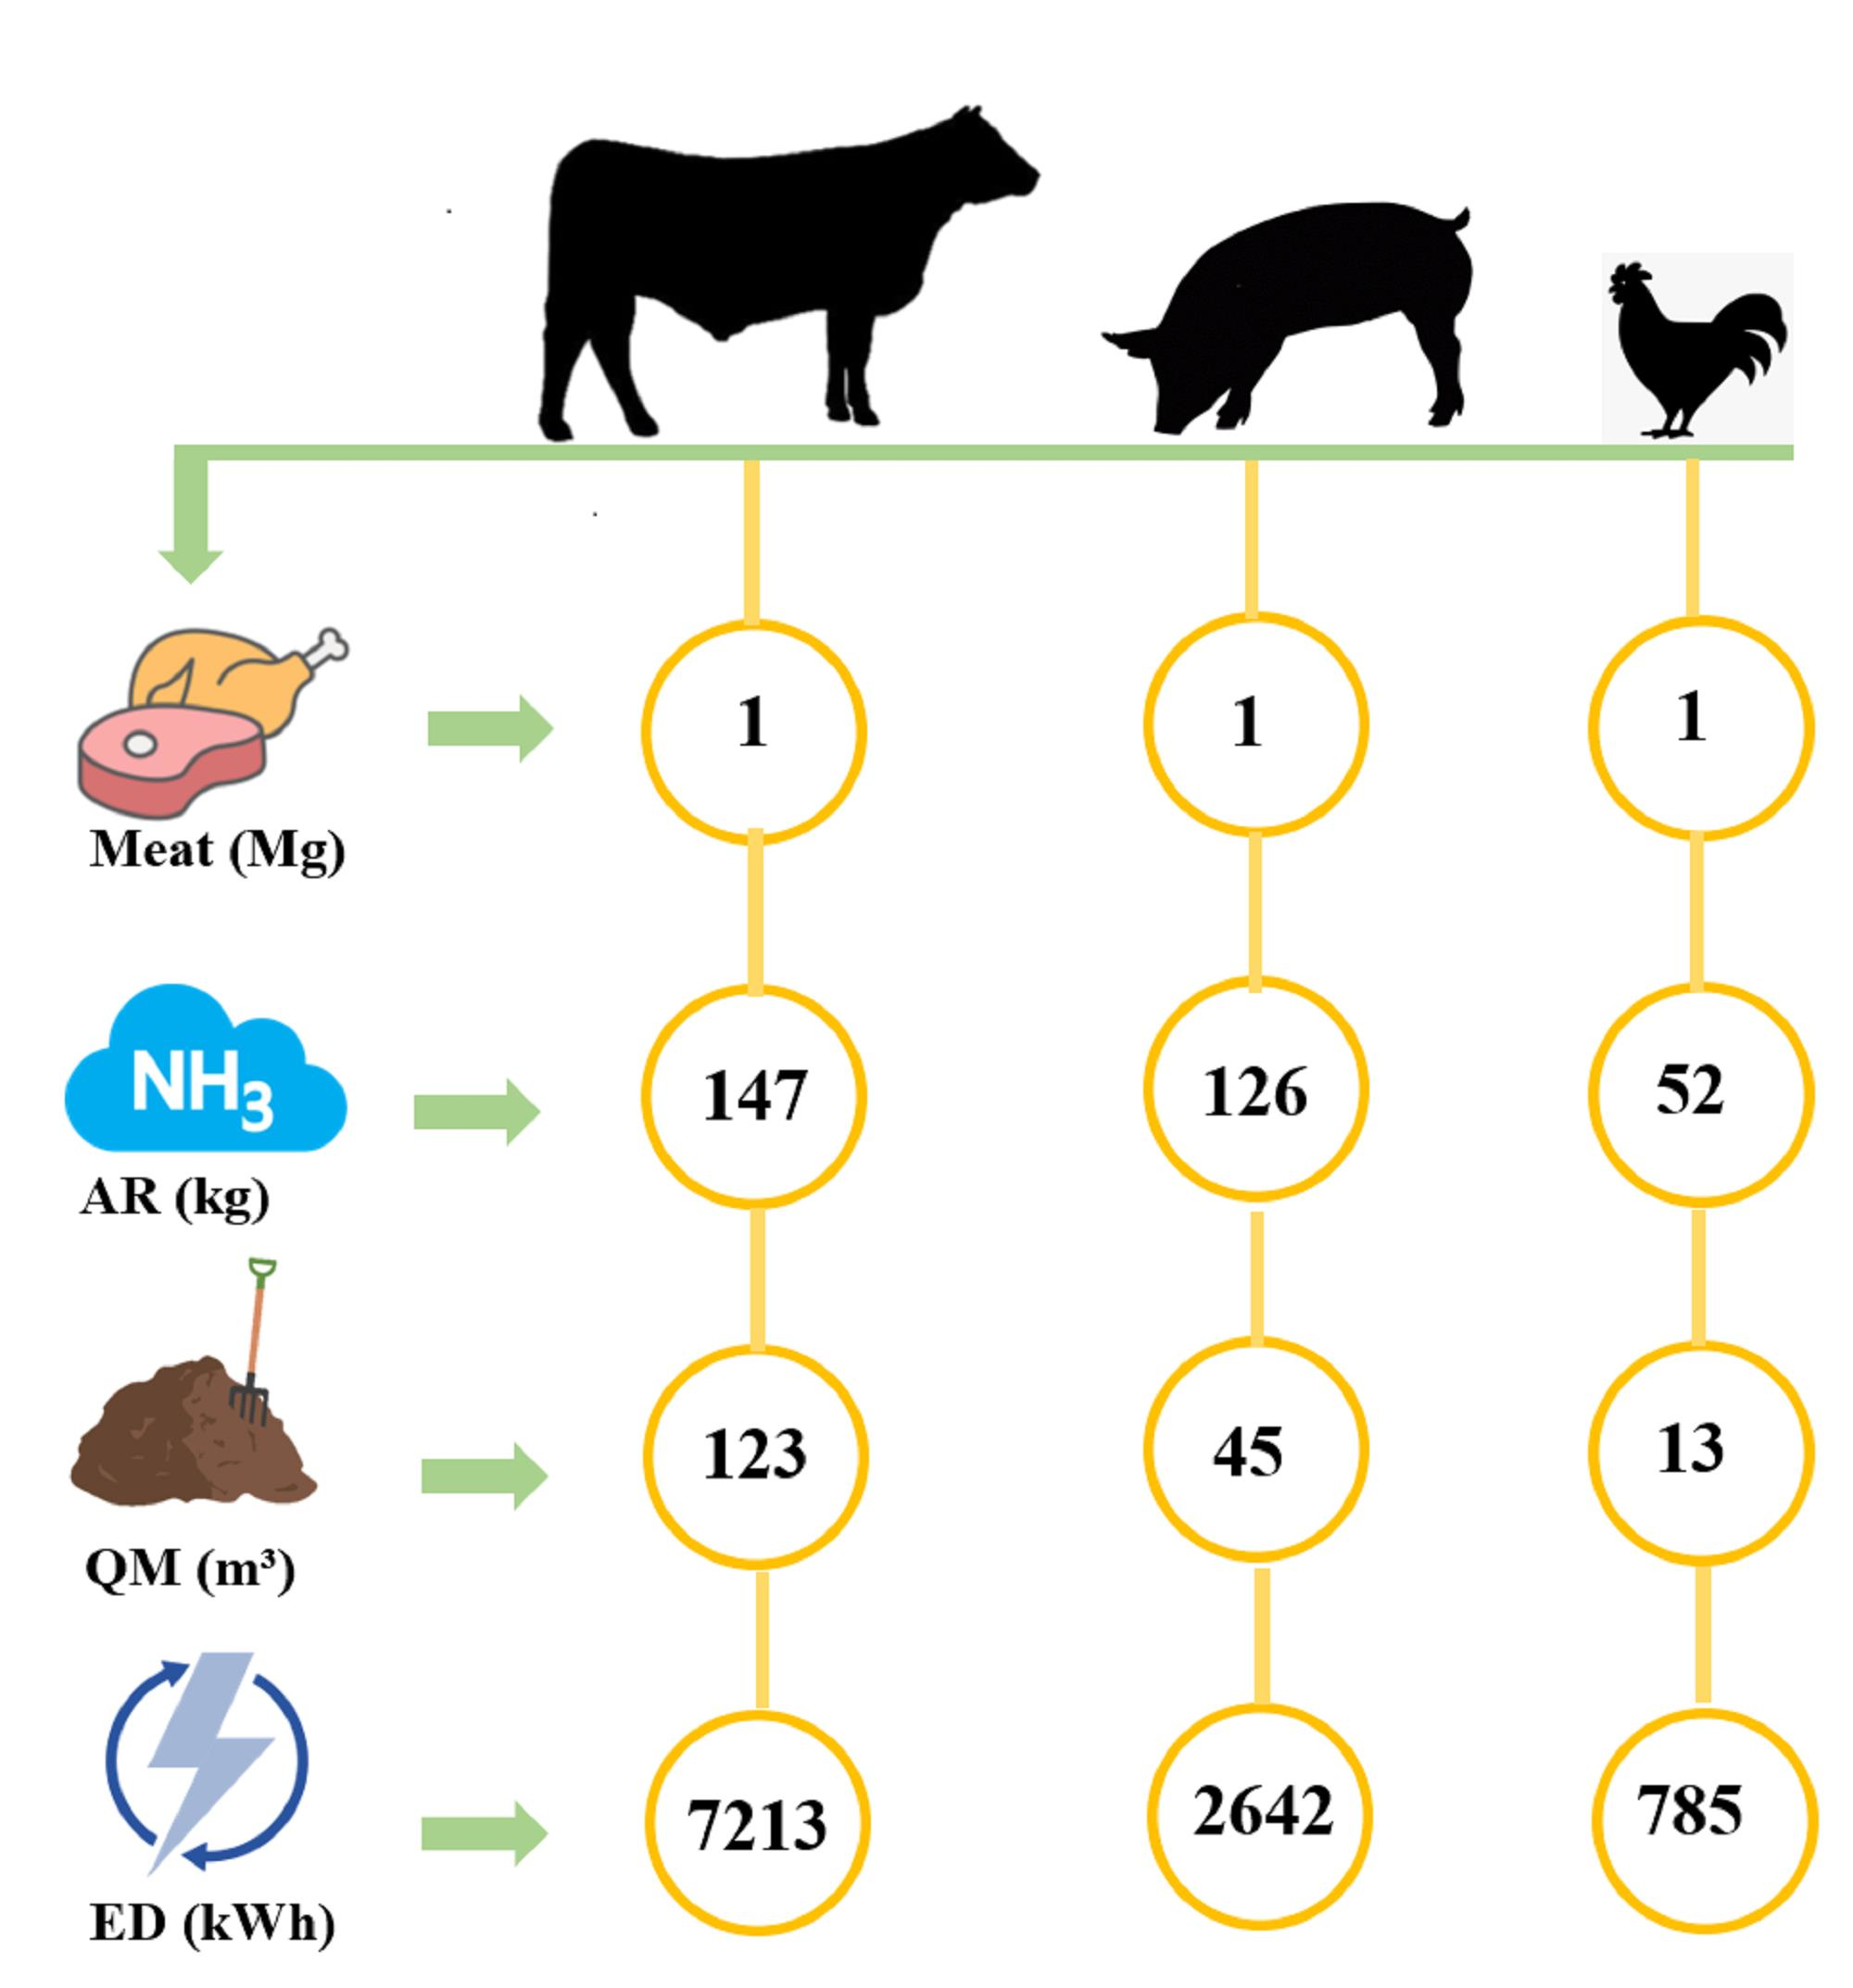
3.3. Energy Demand for Zero Liquid Discharge and Ammonium Nitrogen Recovery

A scaled-up version of the relation between meat production and manure generation of beef, pork and poultry is presented in Figure 4A. One Mg of beef production was calculated to generate above 120 m3 of manure. This was substantially doubled that of pork and nearly 10 times of poultry manure generation per 1 Mg corresponding meat production. The manure generation was calculated by using Equation (6).
The standard ammonium nitrogen concentrations in manure were considered (Section 2.2) to calculate the AR by following Equation (7). High ammonium nitrogen concentration in poultry manure led to the recovery of nearly 4 kg of ammonium nitrogen from 1 m3 manure. The value decreased to 2.8 and 1.2 kg for 1 m3 pork and beef manure, respectively (Figure 4B). Lastly, the ED for beef, pork and poultry manure treatment for AR was calculated by following Equation (8). The assumed ED value corresponded to ZLD. Hence, it represented the maximum AR and the highest energy consumption scenario (Figure 4C).
A total of 147 kg ammonium nitrogen was calculated to be recovered from 123 m3 of beef manure corresponding to 1 Mg beef meat production. The calculated AR from pork manure was 14% lesser compared to beef manure for the same quantity of meat production. Consequently, the QM was found to be 64% lesser for pork manure than for beef manure. The AR and QM of poultry manure were calculated at 64% and 89% lesser than that of beef manure per 1 Mg poultry meat production, respectively. It was reduced to 58% and 4.5%, respectively, when compared with pork manure.
On the other hand, more than 7000 kWh energy was calculated to treat beef manure, corresponding to 1 Mg beef meat production. The ED reduced significantly to below 3000 kWh and to nearly 800 kWh for pork and poultry manure treatment for the same amount of meat production. Therefore, the specific energy demand (SED) calculation (Supporting Information, Equation S1) showed that 49 kWh energy is required to recover 1 kg of ammonium nitrogen from beef manure. The SED was reduced to 21 and 15 kWh for pork and poultry manure, respectively (Table S2).
These results clearly indicate the staggering energy consumption related to manure treatment for lowering the overall nitrogen footprint in livestock farming. Recovery of ammonium nitrogen also contributes to the circular approach of the economy. Although, considering the ED of ZLD in this approach may present the maximum ED for manure treatment. However, its substantial impact of it cannot be ignored when moving towards more sustainable livestock farming approaches.

4. Conclusions

The objective of this study was to understand the impact of livestock farming on nitrogen pollution by forming a direct relationship between meat production and manure generation and the corresponding energy demand for its treatment. The overall outcome of the study is given below:
(i)
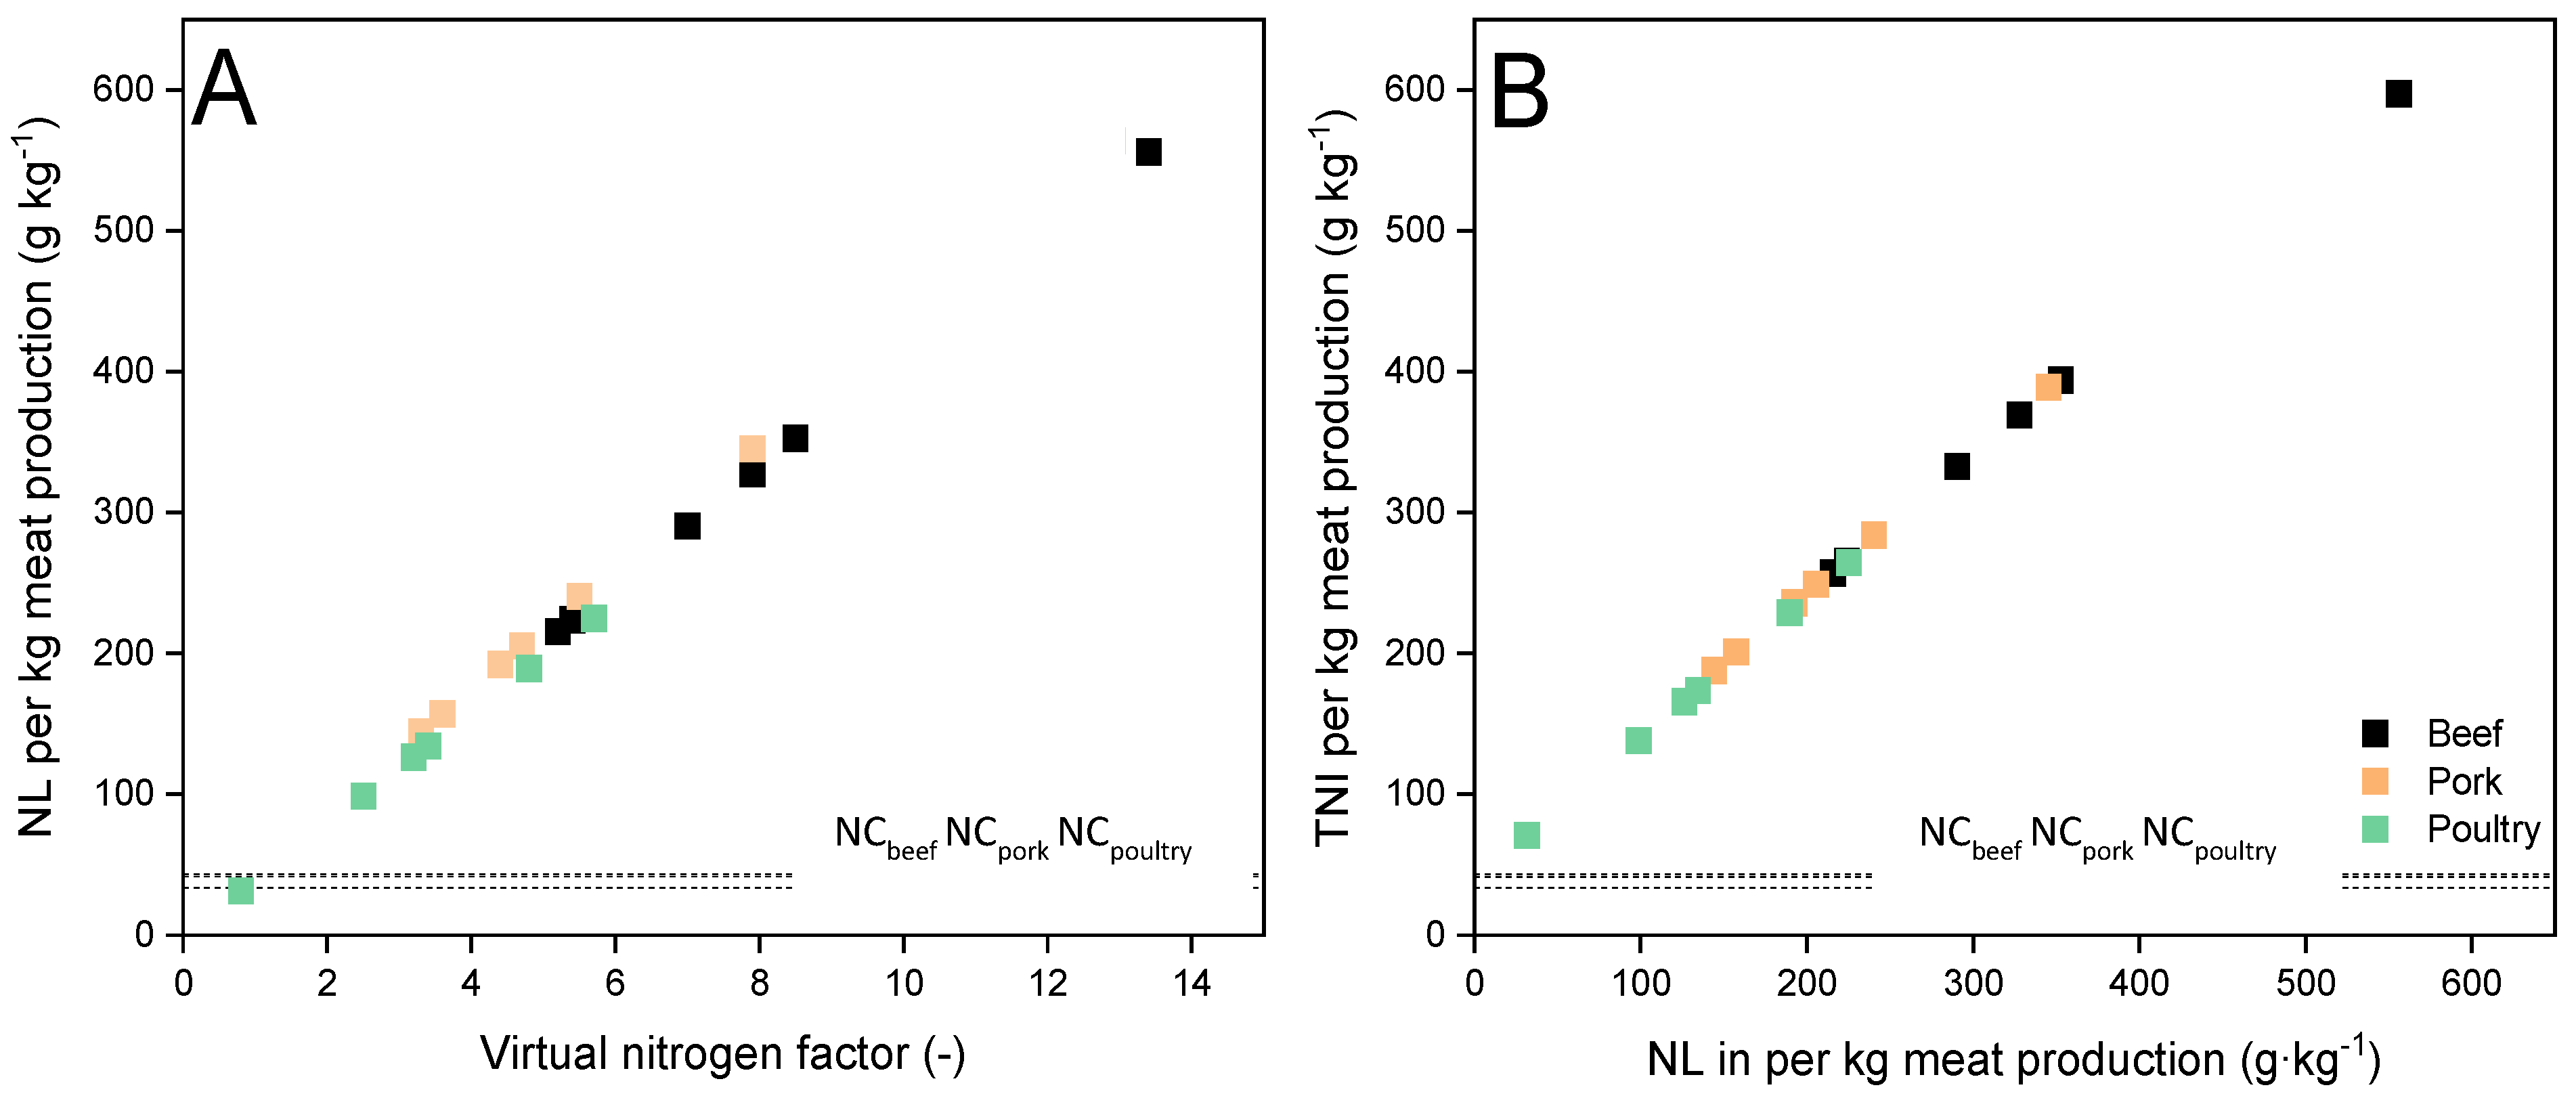
This is the first study that formed a direct relationship between manure generation by beef, pork and poultry per unit of respective meat production. Nitrogen loss per unit of meat production was found to be directly proportional to the virtual nitrogen factors. The relationship between total nitrogen intake and the corresponding nitrogen loss per kg of meat production was also found linear;
(ii)
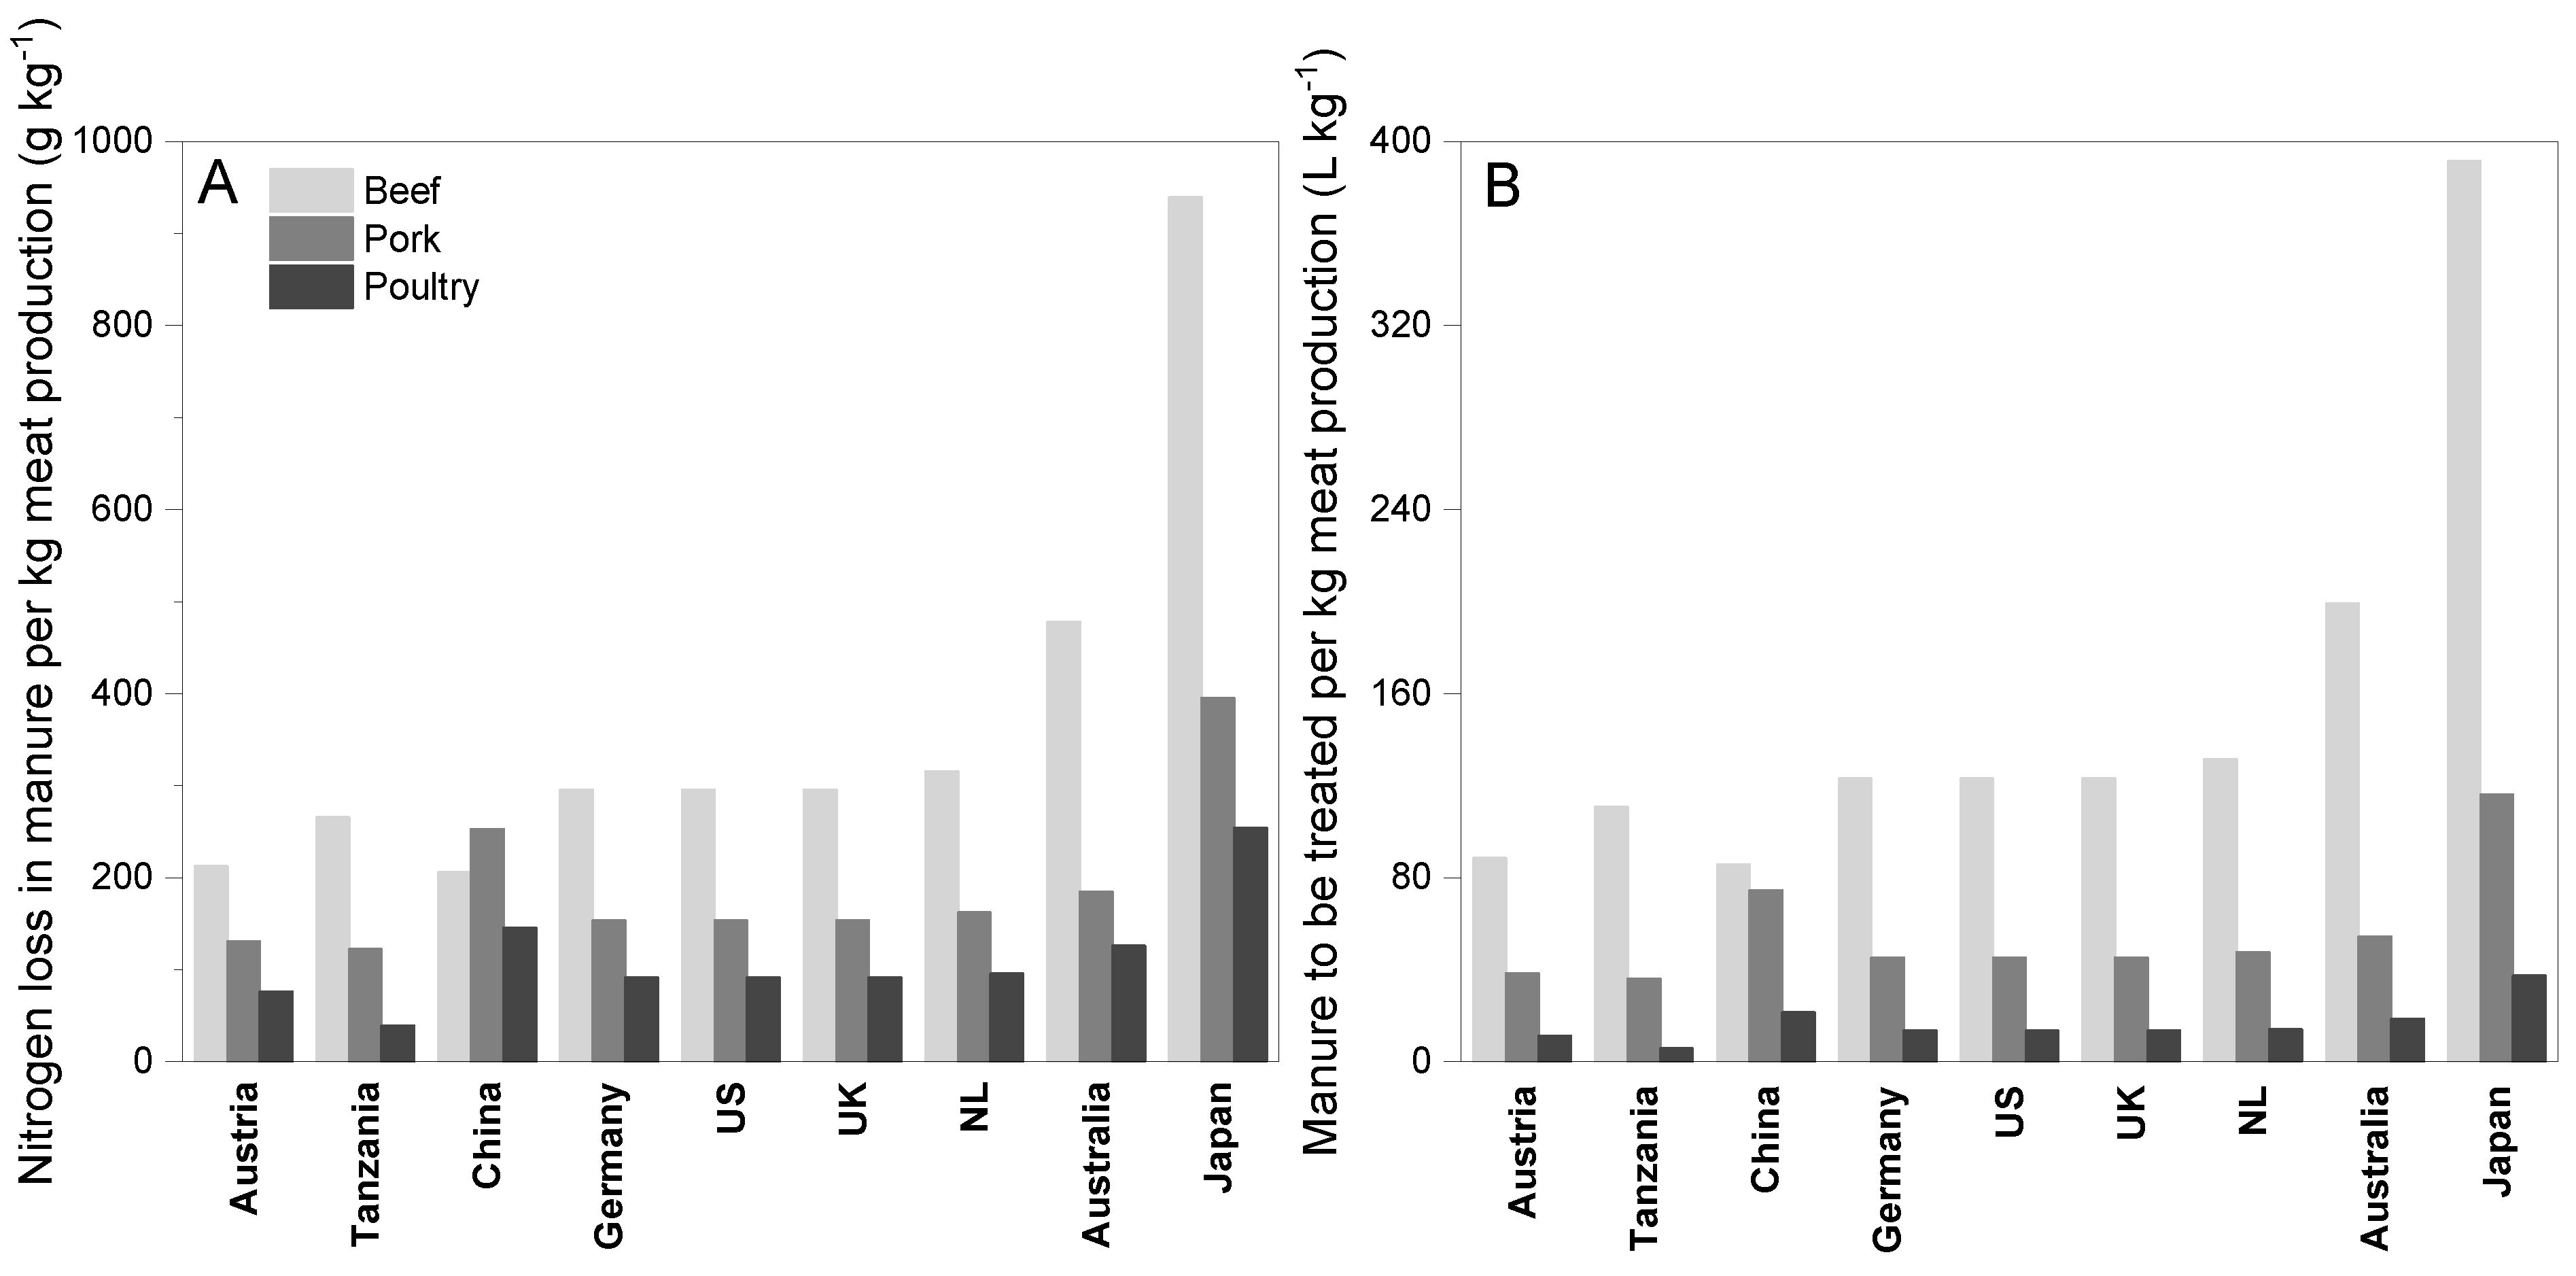
When comparing several countries, Japan was found to lose the highest amount of nitrogen for meat production, followed by Australia. Therefore, the amount of manure to be treated per unit of meat production was highest in Japan. The nitrogen loss due to meat production was found to be relatively lesser among the US and the European countries due to their advanced nitrogen recovery systems from waste streams;
(iii)
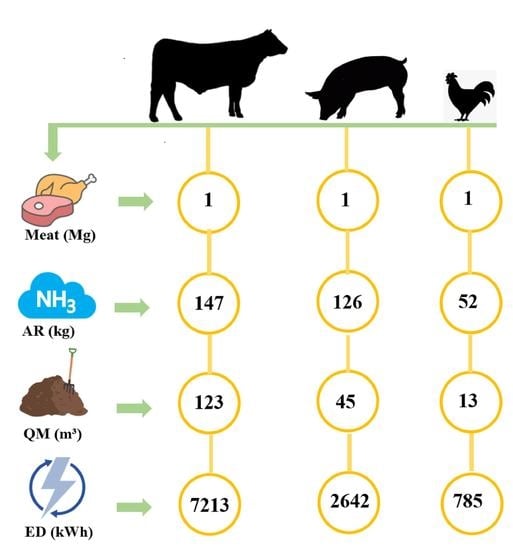
The results showed that more than 7000 kWh energy was required to recover 140 kg of ammonium nitrogen from beef manure per 1 Mg meat production when considering the zero liquid discharge approach. The energy demand reduced significantly to below 3000 kWh and nearly 1000 kWh for pork and poultry manure treatment for the same.
Nevertheless, this study is based on several assumptions. Standard ammonium nitrogen concentration for beef, pork and poultry manure was considered for all the countries. However, it can vary depending on the animal feed, manure storage conditions, etc. In addition, the manure was considered to be fresh. Hence, any ammonium nitrogen loss due to storage was not considered.

Supplementary Materials

The following supporting information can be downloaded at: https://www.mdpi.com/article/10.3390/w14081278/s1, Table S1: Comparison of VNF, TNI and NL of per kg meat production among the different countries; Table S2: Specific energy demand per kg ammonium nitrogen recovery from beef, pork and poultry manure; Equation S1: Specific energy demand per kg ammonium nitrogen recovery from manure.

Author Contributions

Conceptualization, P.S. and H.H.; methodology, P.S.; validation, P.S., F.S. and H.H.; investigation, P.S.; writing—original draft preparation, P.S.; writing—review and editing, F.S. and H.H.; supervision, F.S. and H.H.; funding acquisition, H.H. All authors have read and agreed to the published version of the manuscript.

Funding

This research was funded by the federal ministry of education and research (BMBF, Germany) in the framework of the project “KompaGG_N” (Grant number 02WQ1516D). We acknowledge support from the KIT-Publication Fund of the Karlsruhe Institute of Technology.

Data Availability Statement

The data that support the findings of this study are available on request from the corresponding author.

Conflicts of Interest

The authors declare no conflict of interest.

References

  1. Sutton, M.A.; Oenema, O.; Erisman, J.W.; Leip, A.; van Grinsven, H.; Winiwarter, W. Too much of a good thing. Nature 2011, 472, 159–161. [Google Scholar] [CrossRef] [PubMed] [Green Version]
  2. Gruber, N.; Galloway, J.N. An Earth-system perspective of the global nitrogen cycle. Nature 2008, 451, 293–296. [Google Scholar] [CrossRef] [PubMed]
  3. Galloway, J.N.; Winiwarter, W.; Leip, A.; Leach, A.M.; Bleeker, A.; Erisman, J.W. Nitrogen footprints: Past, present and future. Environ. Res. Lett. 2014, 9, 115003. [Google Scholar] [CrossRef]
  4. Erisman, J.W.; Galloway, J.N.; Seitzinger, S.; Bleeker, A.; Dise, N.B.; Petrescu, A.R.; Leach, A.M.; de Vries, W. Consequences of human modification of the global nitrogen cycle. Philos. Trans. R. Soc. B Biol. Sci. 2013, 368, 20130116. [Google Scholar] [CrossRef] [Green Version]
  5. Conley, D.J.; Paerl, H.W.; Howarth, R.W.; Boesch, D.F.; Seitzinger, S.P.; Karl, K.E.; Lancelot, C.; Gene, G.E. Controlling eutrophication: Nitrogen and phosphorus. Science 2009, 123, 1014–1015. [Google Scholar] [CrossRef]
  6. Sutton, M.A.; Howard, C.M.; Erisman, J.W.; Billen, G.; Bleeker, A.; Grennfelt, P.; van Grinsven, H.; Grizzetti, B. The European Nitrogen Assessment: Sources, Effects and Policy Perspectives; Cambridge University Press: Cambridge, UK, 2011. [Google Scholar]
  7. Bodirsky, B.L.; Popp, A.; Lotze-Campen, H.; Dietrich, J.P.; Rolinski, S.; Weindl, I.; Schmitz, C.; Müller, C.; Bonsch, M.; Humpenöder, F. Reactive nitrogen requirements to feed the world in 2050 and potential to mitigate nitrogen pollution. Nat. Commun. 2014, 5, 3858. [Google Scholar] [CrossRef] [Green Version]
  8. Leach, A.M.; Galloway, J.N.; Bleeker, A.; Erisman, J.W.; Kohn, R.; Kitzes, J. A nitrogen footprint model to help consumers understand their role in nitrogen losses to the environment. Environ. Dev. 2012, 1, 40–66. [Google Scholar] [CrossRef] [Green Version]
  9. Oita, A.; Malik, A.; Kanemoto, K.; Geschke, A.; Nishijima, A.O.S.; Lenzen, M. Substantial nitrogen pollution embedded in international trade. Nat. Geosci. 2016, 9, 111–115. [Google Scholar] [CrossRef]
  10. Groenestein, C.; Hutchings, N.J.; Haenel, H.D.; Amon, B.; Menzi, H.; Mikkelsen, M.H.; Misselbrook, T.H.; van Bruggen, C.; Kupper, T.; Webb, J. Comparison of ammonia emissions related to nitrogen use efficiency of livestock production in Europe. J. Clean. Prod. 2019, 211, 1162–1170. [Google Scholar] [CrossRef]
  11. Stevens, C.J.; Leach, A.M.; Dale, S.; Galloway, J.N. Personal nitrogen footprint tool for the United Kingdom. Environ. Sci. Process. Impacts 2014, 16, 1563–1569. [Google Scholar] [CrossRef] [Green Version]
  12. Pierer, M.; Winiwarter, W.; Leach, A.M.; Galloway, J.N. The nitrogen footprint of food products and general consumption patterns in Austria. Food Policy 2014, 49, 128–136. [Google Scholar] [CrossRef]
  13. Liang, X.; Leach, A.; Galloway, J.N.; Gu, B.; Lam, S.K.; Chen, D. Beef and coal are key drivers of Australia’s high nitrogen footprint. Sci. Rep. 2016, 6, 39644. [Google Scholar] [CrossRef] [PubMed]
  14. Shibata, H.; Cattaneo, L.R.; Leach, A.; Galloway, J.N. First approach to the Japanese nitrogen footprint model to predict the loss of nitrogen to the environment. Environ. Res. Lett. 2014, 9, 115013. [Google Scholar] [CrossRef] [Green Version]
  15. Shibata, H.; Galloway, J.N.; Leach, A.M.; Cattaneo, L.R.; Noll, L.C.; Erisman, J.W.; Gu, B.; Liang, X.; Hayashi, K.; Ma, L.; et al. Nitrogen footprints: Regional realities and options to reduce nitrogen loss to the environment. Ambio 2016, 46, 129–142. [Google Scholar] [CrossRef]
  16. Hutton, M.O.; Leach, A.M.; Leip, A.; Galloway, J.N.; Bekunda, M.; Sullivan, C.; Lesschen, J.P. Toward a nitrogen footprint calculator for Tanzania. Environ. Res. Lett. 2017, 12, 034016. [Google Scholar] [CrossRef]
  17. Godfray, H.C.J.; Beddington, J.R.; Crute, I.R.; Haddad, L.; Lawrence, D.; Muir, J.F.; Pretty, J.; Robinson, S.; Thomas, S.M.; Toulmin, C. Food Security: The Challenge of Feeding 9 Billion People. Science 2010, 327, 812–818. [Google Scholar] [CrossRef] [Green Version]
  18. Mueller, N.D.; Lassaletta, L. Nitrogen challenges in global livestock systems. Nat. Food 2020, 1, 400–401. [Google Scholar] [CrossRef]
  19. Sutton, M.A.; Bleeker, A.; Howard, C.; Erisman, J.; Abrol, Y.; Bekunda, M.; Datta, A.; Davidson, E.; de Vries, W.; Oenema, O. Our Nutrient World: The Challenge to Produce More Food and Energy with Less Pollution; Centre for Ecology & Hydrology: Edinburgh, UK, 2013. [Google Scholar]
  20. Bai, Z.; Ma, W.; Ma, L.; Velthof, G.L.; Wei, Z.; Havlík, P.; Oenema, O.; Lee, M.R.; Zhang, F. China’s livestock transition: Driving forces, impacts, and consequences. Sci. Adv. 2018, 4, eaar8534. [Google Scholar] [CrossRef] [Green Version]
  21. Davidson, E.A. The contribution of manure and fertilizer nitrogen to atmospheric nitrous oxide since 1860. Nat. Geosci. 2009, 2, 659–662. [Google Scholar] [CrossRef]
  22. Yang, S.; Wang, Y.; Liu, R.; Zhang, A.; Yang, Z. Effect of Nitrate Leaching Caused by Swine Manure Application in Fields of the Yellow River Irrigation Zone of Ningxia, China. Sci. Rep. 2017, 7, 13693. [Google Scholar] [CrossRef] [Green Version]
  23. Lee, M.; Shevliakova, E.; Stock, C.A.; Malyshev, S.; Milly, P.C.D. Prominence of the tropics in the recent rise of global nitrogen pollution. Nat. Commun. 2019, 10, 1437. [Google Scholar] [CrossRef] [PubMed] [Green Version]
  24. Wang, K.; Li, W.; Li, X.; Ren, N. Spatial nitrifications of microbial processes during composting of swine, cow and chicken manure. Sci. Rep. 2015, 5, 14932. [Google Scholar] [CrossRef] [PubMed]
  25. Aneja, V.P.; Schlesinger, W.H.; Erisman, J.W. Farming pollution. Nat. Geosci. 2008, 1, 409–411. [Google Scholar] [CrossRef]
  26. Zhang, X.; Davidson, E.A.; Mauzerall, D.L.; Searchinger, T.D.; Dumas, P.; Shen, Y. Managing nitrogen for sustainable development. Nature 2015, 528, 51–59. [Google Scholar] [CrossRef] [Green Version]
  27. Samanta, P.; Schwark, L.v.U.-S.; Horn, H.; Saravia, F. Nutrient recovery and ammonia-water production by MF-vacuum evaporation treatment of pig manure. J. Environ. Chem. Eng. 2021, 10, 106929. [Google Scholar] [CrossRef]
  28. Pikaar, I.; Matassa, S.; Rabaey, K.; Bodirsky, B.L.; Popp, A.; Herrero, M.; Verstraete, W. Microbes and the Next Nitrogen Revolution. Environ. Sci. Technol. 2017, 51, 7297–7303. [Google Scholar] [CrossRef] [Green Version]
  29. Quan, X.; Wang, F.; Zhao, Q.; Zhao, T.; Xiang, J. Air stripping of ammonia in a water-sparged aerocyclone reactor. J. Hazard. Mater. 2009, 170, 983–988. [Google Scholar] [CrossRef]
  30. Hjorth, M.; Christensen, K.; Christensen, M.; Sommer, S.G. Solid–Liquid Separation of Animal Slurry in Theory and Practice. In Sustainable Agriculture Volume 2; Springer: Berlin/Heidelberg, Germany, 2011; pp. 953–986. [Google Scholar] [CrossRef]
  31. Masse, L.; Massé, D.; Pellerin, Y. The use of membranes for the treatment of manure: A critical literature review. Biosyst. Eng. 2007, 98, 371–380. [Google Scholar] [CrossRef]
  32. Vaneeckhaute, C.; Lebuf, V.; Michels, E.; Belia, E.; Vanrolleghem, P.A.; Tack, F.M.G.; Meers, E. Nutrient Recovery from Digestate: Systematic Technology Review and Product Classification. Waste Biomass-Valorization 2016, 8, 21–40. [Google Scholar] [CrossRef] [Green Version]
  33. Shi, L.; Simplicio, W.S.; Wu, G.; Hu, Z.; Hu, H.; Zhan, X. Nutrient Recovery from Digestate of Anaerobic Digestion of Livestock Manure: A Review. Curr. Pollut. Rep. 2018, 4, 74–83. [Google Scholar] [CrossRef]
  34. Biogas, F. Digestate as Fertilizer in Deutsche Gesellschaft für Internationale Zusammenarbeit (GIZ) GmbH. 2020. Available online: https://www.biogas.org/edcom/webfvb.nsf/id/BJHCPA-DE-Digestate-as-Fertilizer/$file/Digestate_as_Fertilizer.pdf (accessed on 31 January 2022).
  35. Liang, L.; Han, D. Energy-saving study of a system for ammonium sulfate recovery from wastewater with mechanical vapor compression (MVC). Res. J. Appl. Sci. Eng. Technol. 2011, 3, 1227–1232. [Google Scholar]
  36. Möller, K.; Schulz, R.; Müller, T. Substrate inputs, nutrient flows and nitrogen loss of two centralized biogas plants in southern Germany. Nutr. Cycl. Agroecosyst. 2010, 87, 307–325. [Google Scholar] [CrossRef]
  37. Gebhardt, S.; Lemar, L.; Haytowitz, D.; Pehrsson, P.; Nickle, M.; Showell, B.; Thomas, R.; Exler, J.; Holden, J. USDA National Nutrient Database for Standard Reference, Release 21; United States Department of AgricultureAgricultural Research Service: Washington, DC, USA, 2008.
  38. Guo, M.; Chen, X.; Bai, Z.; Jiang, R.; Galloway, J.N.; Leach, A.M.; Cattaneo, L.R.; Oenema, O.; Ma, L.; Zhang, F. How China’s nitrogen footprint of food has changed from 1961 to 2010. Environ. Res. Lett. 2017, 12, 104006. [Google Scholar] [CrossRef]
  39. Millet, S.; Aluwé, M.; van den Broeke, A.; Leen, F.; de Boever, J.; de Campeneere, S. Pork production with maximal nitrogen efficiency. Animal 2018, 12, 1060–1067. [Google Scholar] [CrossRef] [Green Version]
  40. Malomo, G.A.; Bolu, S.A.; Madugu, A.S.; Usman, Z.S. Nitrogen Emissions and Mitigation Strategies in Chicken Production. Anim. Husband. Nutr. 2018, 43, 43–62. [Google Scholar] [CrossRef] [Green Version]
  41. Webb, J.; Sørensen, P.; Velthof, G.; Amon, B.; Pinto, M.; Rodhe, L.; Salomon, E.; Hutchings, N.; Burczyk, P.; Reid, J. An Assessment of the Variation of Manure Nitrogen Efficiency throughout Europe and an Appraisal of Means to Increase Manure-N Efficiency. In Advances in Agronomy; Academic Press: Cambridge, MA, USA, 2013; Volume 119, pp. 371–442. [Google Scholar]
  42. Sánchez-Hernández, E.; Weiland, P.; Borja, R. The effect of biogas sparging on cow manure characteristics and its subsequent anaerobic biodegradation. Int. Biodeterior. Biodegrad. 2013, 83, 10–16. [Google Scholar] [CrossRef]
  43. Xie, S.; Lawlor, P.; Frost, J.; Hu, Z.; Zhan, X. Effect of pig manure to grass silage ratio on methane production in batch anaerobic co-digestion of concentrated pig manure and grass silage. Bioresour. Technol. 2011, 102, 5728–5733. [Google Scholar] [CrossRef]
  44. Yangin-Gomec, C.; Ozturk, I. Effect of maize silage addition on biomethane recovery from mesophilic co-digestion of chicken and cattle manure to suppress ammonia inhibition. Energy Convers. Manag. 2013, 71, 92–100. [Google Scholar] [CrossRef]
  45. Matassa, S.; Batstone, D.J.; Hülsen, T.; Schnoor, J.; Verstraete, W. Can Direct Conversion of Used Nitrogen to New Feed and Protein Help Feed the World? Environ. Sci. Technol. 2015, 49, 5247–5254. [Google Scholar] [CrossRef]
  46. Eshel, G.; Shepon, A.; Makov, T.; Milo, R. Land, irrigation water, greenhouse gas, and reactive nitrogen burdens of meat, eggs, and dairy production in the United States. Proc. Natl. Acad. Sci. USA 2014, 111, 11996–12001. [Google Scholar] [CrossRef] [Green Version]
  47. Hulbert, A.; Else, P. Basal metabolic rate: History, composition, regulation, and usefulness. Physiol. Biochem. Zool. 2004, 77, 869–876. [Google Scholar] [CrossRef] [PubMed] [Green Version]
  48. Leip, A.; Weiss, F.; Lesschen, J.P.; Westhoek, H. The nitrogen footprint of food products in the European Union. J. Agric. Sci. 2013, 152, 20–33. [Google Scholar] [CrossRef] [Green Version]
  49. Yan, X.; Ti, C.; Vitousek, P.M.; Chen, D.; Leip, A.; Cai, Z.; Zhu, Z. Fertilizer nitrogen recovery efficiencies in crop production systems of China with and without consideration of the residual effect of nitrogen. Environ. Res. Lett. 2014, 9, 095002. [Google Scholar] [CrossRef] [Green Version]
  50. Ma, L.; Velthof, G.; Wang, F.; Qin, W.; Zhang, W.; Liu, Z.; Zhang, Y.; Wei, J.; Lesschen, J.; Ma, W.; et al. Nitrogen and phosphorus use efficiencies and losses in the food chain in China at regional scales in 1980 and 2005. Sci. Total Environ. 2012, 434, 51–61. [Google Scholar] [CrossRef] [PubMed]
  51. Schönfeldt, H.C.; Hall, N.G. Dietary protein quality and malnutrition in Africa. Br. J. Nutr. 2012, 108, S69–S76. [Google Scholar] [CrossRef] [Green Version]
Figure 1. (A) Relationship between VNF and NL and (B) the corresponding relationship between NL and TNI per kg meat production in different countries. VNF values are given in Table S1.
Water 14 01278 g001
Figure 2. Tree diagram of nitrogen cycle per kg (A) beef, (B) pork and (C) poultry meat production, where TNI represents 100% in each case.
Water 14 01278 g002
Figure 3. (A) Nitrogen loss in manure (NM) and (B) the quantity of manure (QM) to be treated for nitrogen recovery per 1 kg beef, pork and poultry meat production, respectively, among the different countries.
Water 14 01278 g003
Figure 4. (A) The relationship between meat production and manure generation, (B) ammonium nitrogen recovery by treating per unit m3 of manure and (C) the corresponding energy demand to treat manure per Mg of beef, pork and poultry meat production.
Water 14 01278 g004
Table 1. Average energy consumption per m3 of manure treatment [34].
Treatment TechniquesEnergy Consumption (kWh)/m3 of Manure Treatment
Screw press0.2–0.6
Decanter 1.5–5.0
Vacuum evaporation10.0–13.0
Membrane filtration10.0–30.0
Zero liquid discharge58.6 [35]
Publisher’s Note: MDPI stays neutral with regard to jurisdictional claims in published maps and institutional affiliations.

