
Induced Circulation by Plunging and Submerged Jets in Circular Water Storage Tanks Using CFD


Abstract
1. Introduction
2. Background Jet Theory
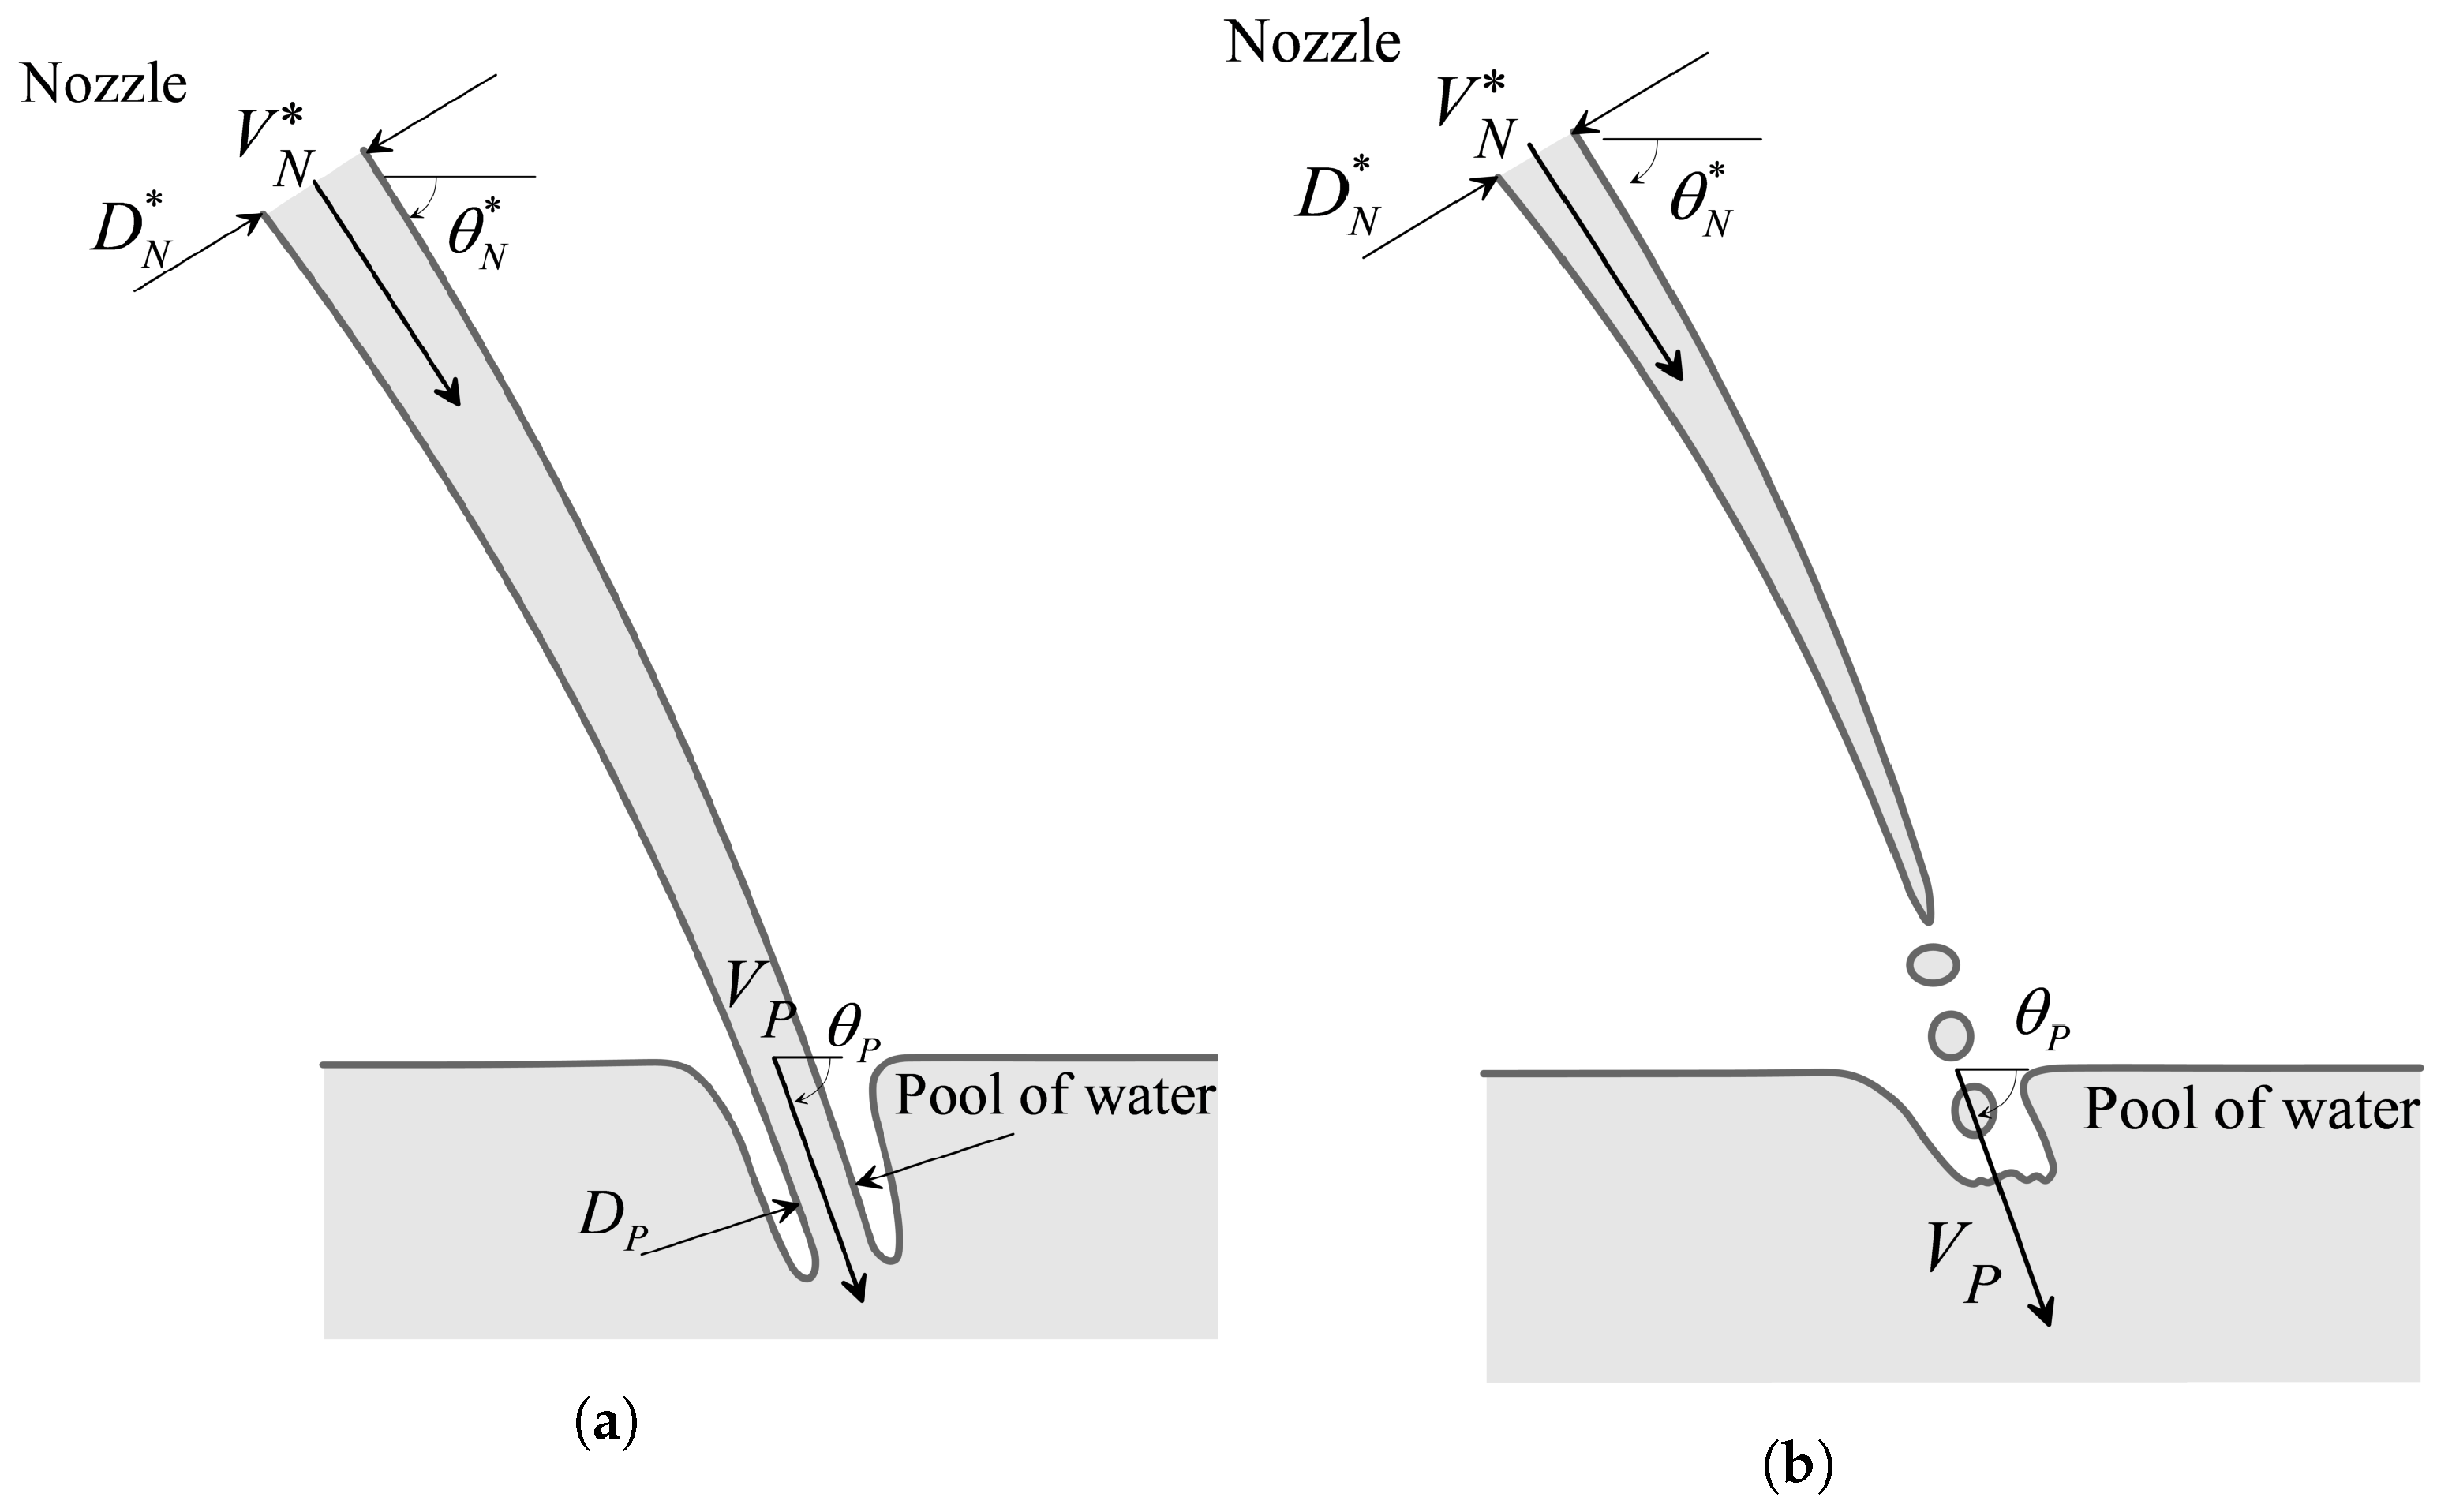
2.1. Plunging Jet
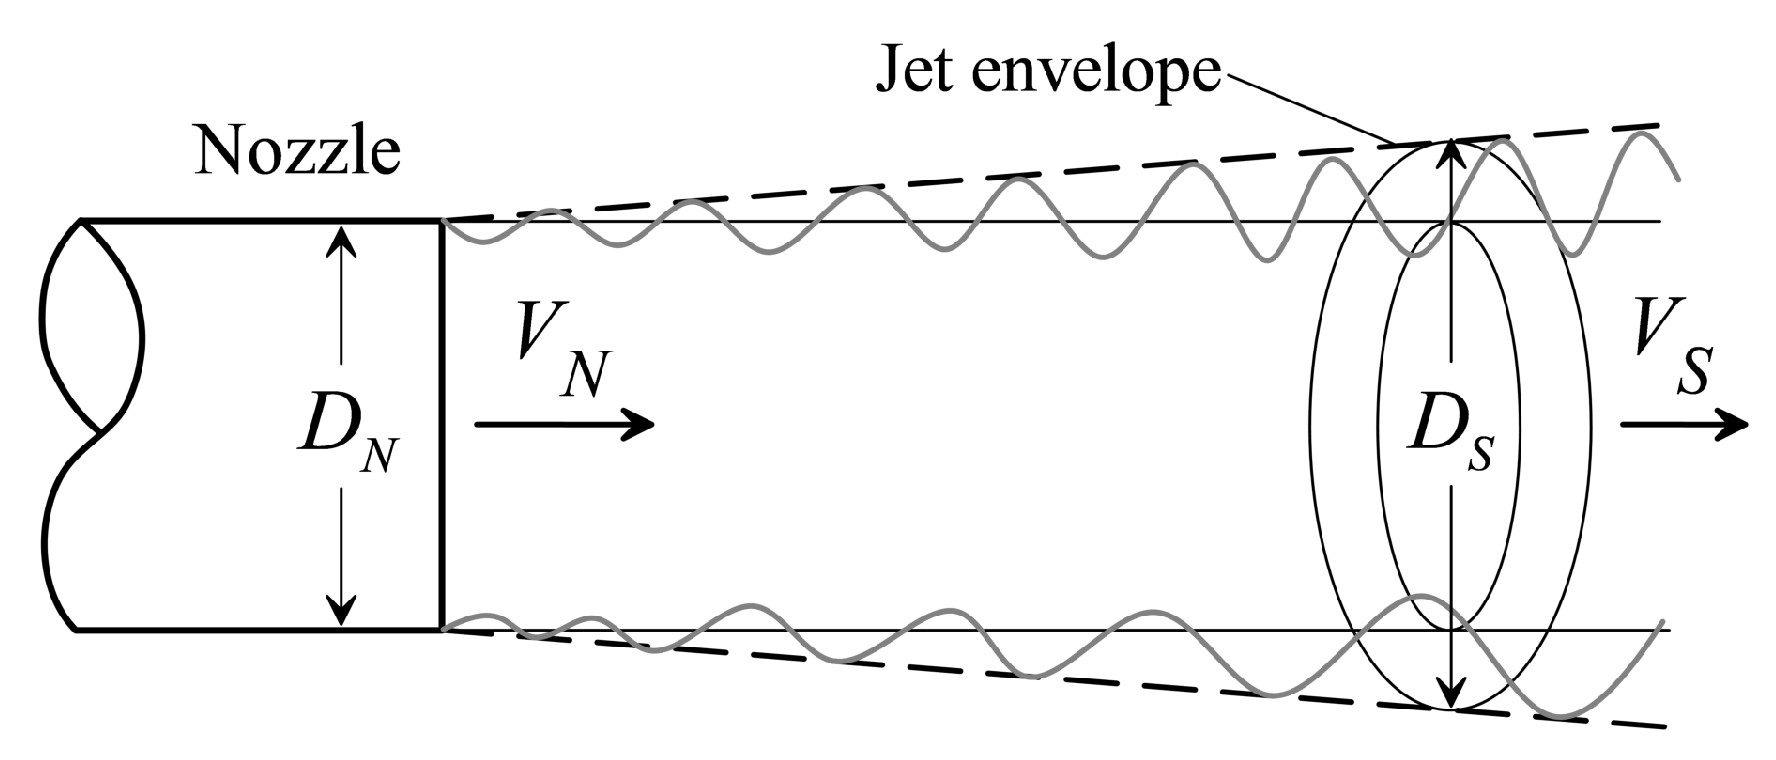
2.2. Submerged Jet
3. Models Description
4. Computational Fluid Dynamics Model
4.1. Introduction
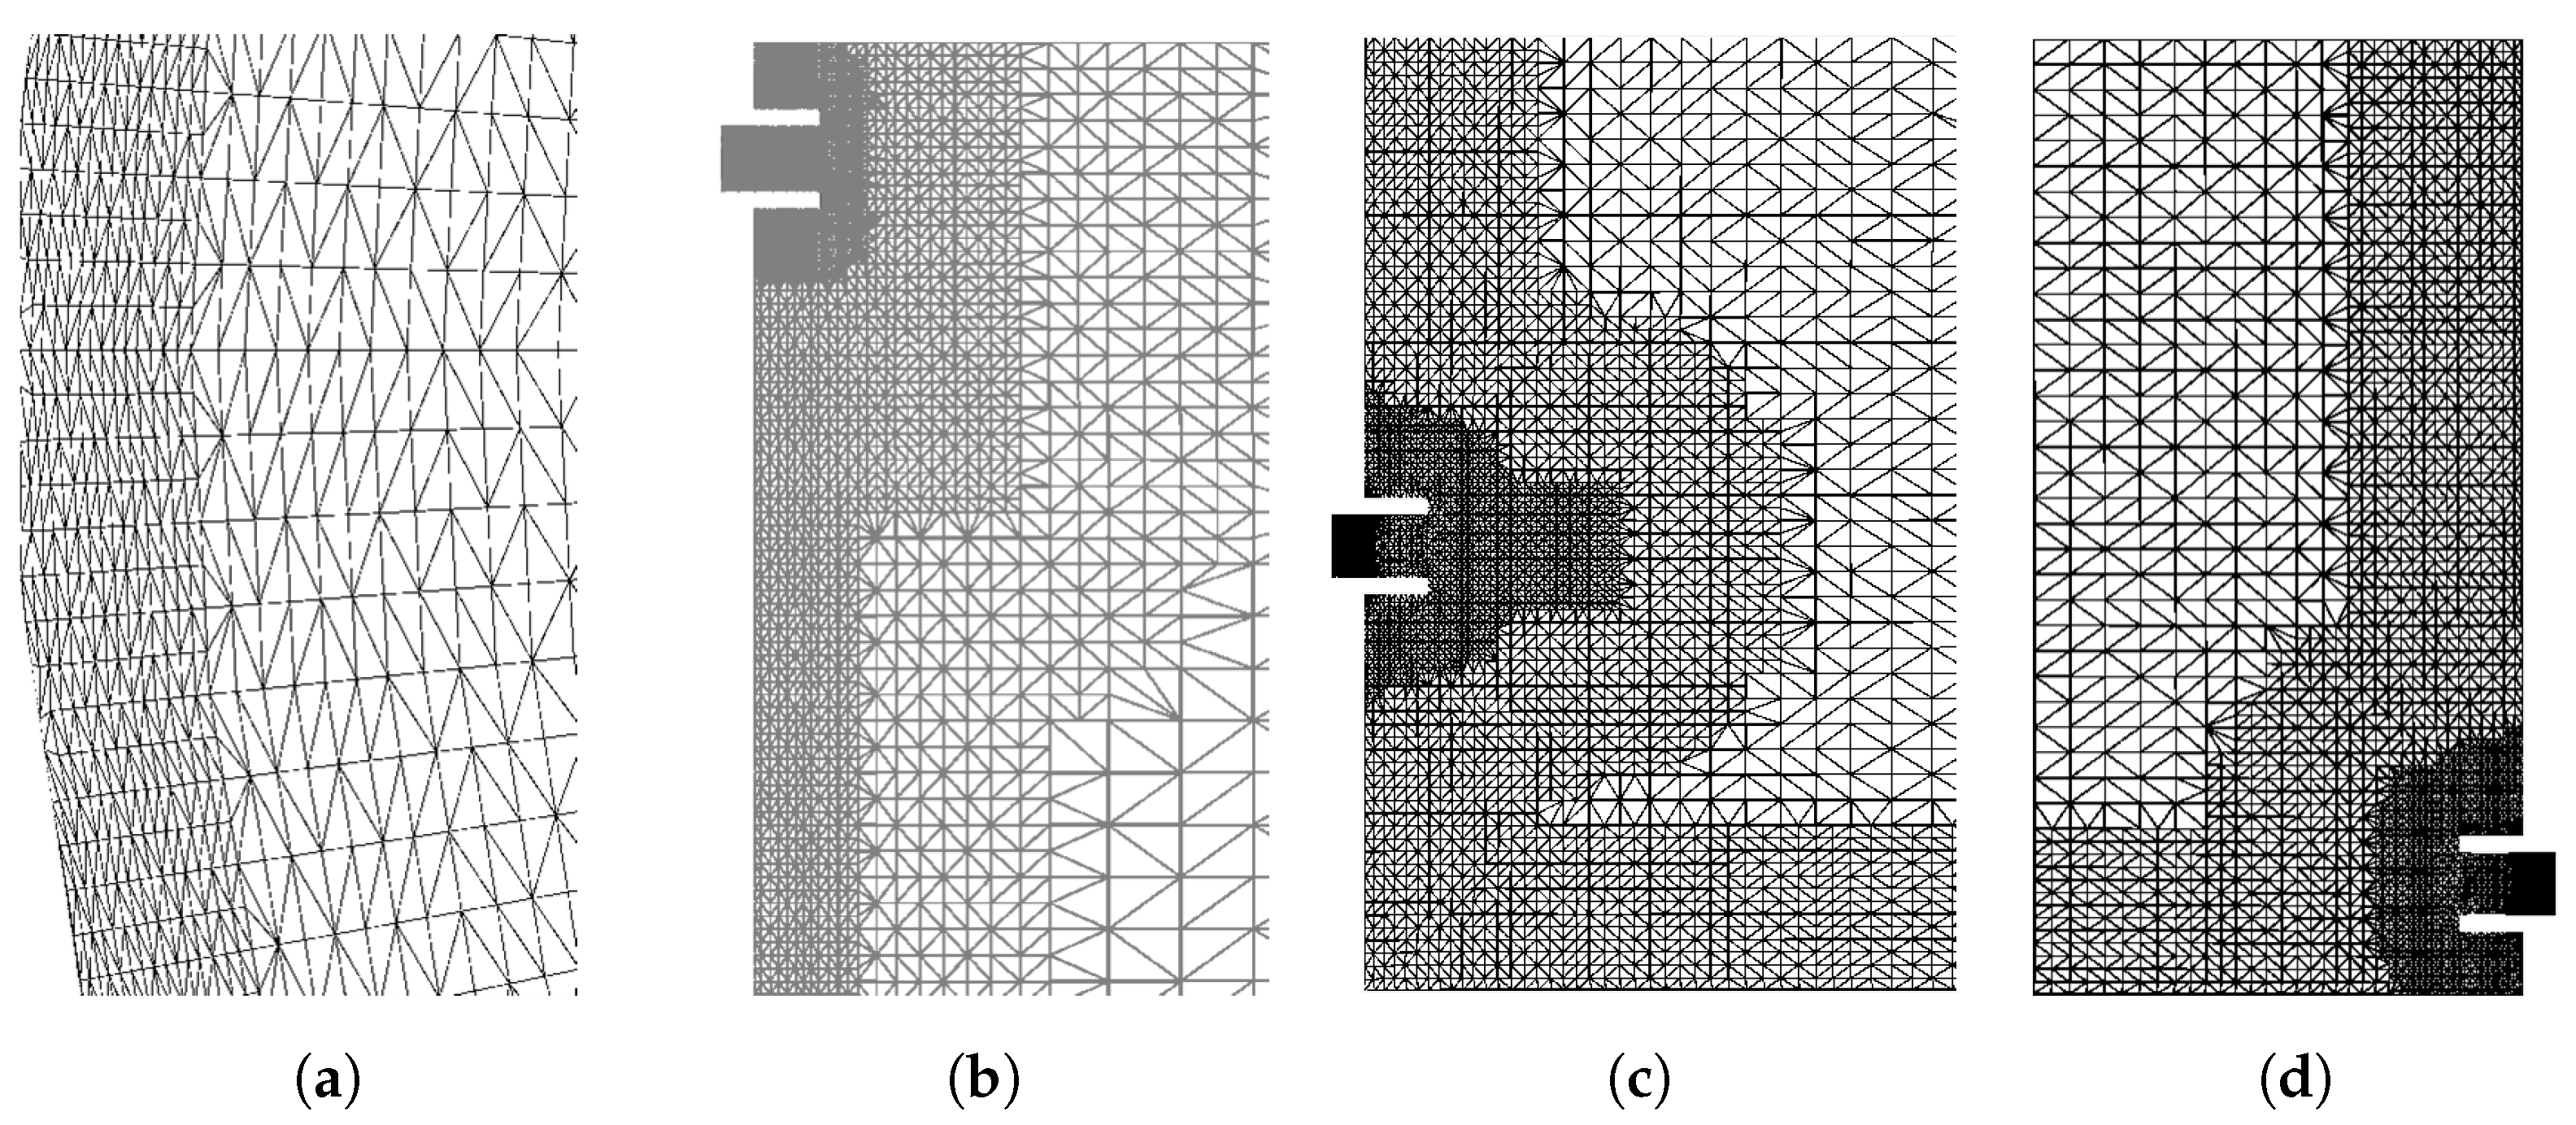
4.2. Mesh
4.3. Multiphase Flow
5. Results and Discussion
5.1. Plunging Jet
5.2. Submerged Jet
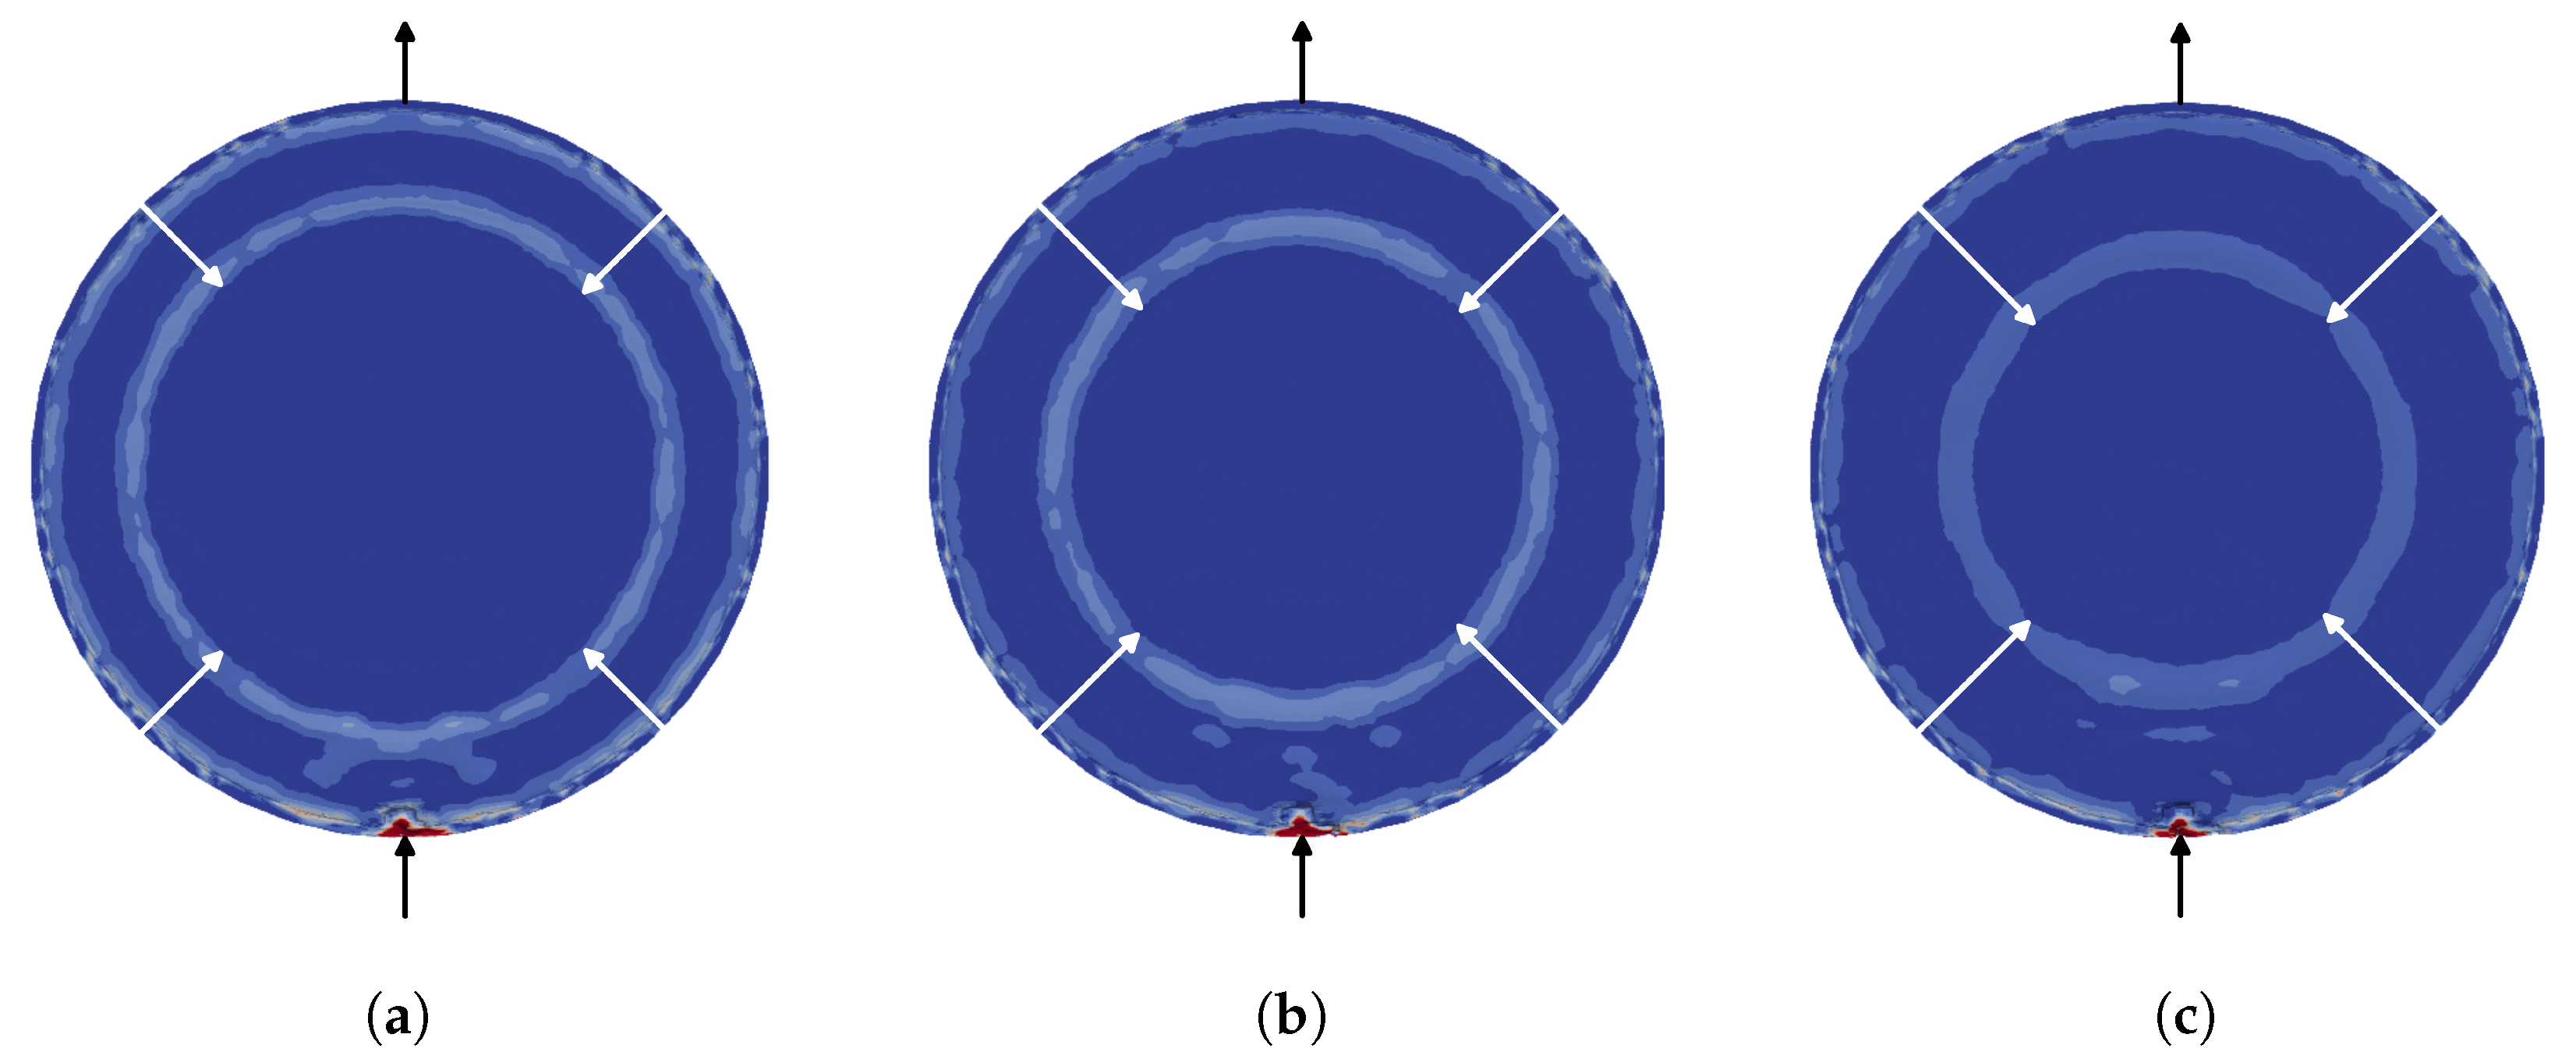
5.3. Velocity Fields Comparison
6. Conclusions
Author Contributions
Funding
Institutional Review Board Statement
Informed Consent Statement
Data Availability Statement
Acknowledgments
Conflicts of Interest
Abbreviations
| 3D | Three-Dimensional |
| CFD | Computational Fluid Dynamics |
| SST | Shear Stress Transport |
References
- Panguluri, S.; Grayman, W.M.; Clark, R.M. Water Distribution System Analysis: Field Studies, Modeling and Management: A Reference Guide for Utilities; Report; U. S. Environmental Protection Agency: Washington, DC, USA, 2005.
- Monteiro, L.S.P.P.; Viegas, R.M.C.; Covas, D.I.C.; Menaia, J.A.G.F. Assessment of Current Models Ability to Describe Chlorine Decay and Appraisal of Water Spectroscopic Data as Model Inputs. J. Environ. Eng. 2017, 143, 04016071. [Google Scholar] [CrossRef]
- Mostafa, N.G.; Matta, M.E.; Halim, H.A. Simulation of Chlorine Decay in Water Distribution Networks Using EPANET—Case Study. Civ. Environ. Res. 2013, 3, 100–116. [Google Scholar]
- Grayman, W.M.; Clark, R.M. Using Computer Models to Determine the Effect of Storage on Water Quality. Am. Water Work. Assoc. 1993, 85, 67–77. [Google Scholar] [CrossRef]
- Kennedy, M.S.; Moegling, S.; Sarikelle, S.; Surava, K. Assessing the Effects of Storage Tank Design on Water Quality. Am. Water Work. Assoc. 1993, 85, 78–88. [Google Scholar] [CrossRef]
- Fisher, I.; Sathasivan, A.; Chuo, P.; Kastl, G. Effects of stratification on chloramine decay in distribution system service reservoirs. Water Res. 2009, 43, 1403–1413. [Google Scholar] [CrossRef]
- Bumrungthaichaichan, E.; Wattananusorn, S. CFD modeling of pump-around jet mixing tanks: A reliable model for overall mixing time prediction. J. Chin. Inst. Eng. 2019, 42, 428–437. [Google Scholar] [CrossRef]
- Clark, R.M.; Abdesaken, F.; Boulos, P.F.; Mau, R.E. Mixing in Distribution System Storage Tanks: Its Effect on Water Quality. J. Environ. Eng.-ASCE 1996, 122, 814–821. [Google Scholar] [CrossRef]
- Rossman, L.A.; Grayman, W.M. Scale-Model Studies of Mixing in Drinking Water Storage Tanks. J. Environ. Eng.-ASCE 1999, 125, 755–761. [Google Scholar] [CrossRef]
- Olson, C.T.; DeBoer, D.E. The Effects of Tank Operation and Design Characteristics on Water Quality in Distribution System Storage Tanks; Report; Regional Water System Research Consortium: Brookings, SD, USA, 2011. [Google Scholar]
- Duan, H.F.; Li, F.; Tao, T. Multi-objective Optimal Design of Detention Tanks in the Urban Stormwater Drainage System: Uncertainty and Sensitivity Analysis. Water Resour. Manag. 2016, 30, 2213–2226. [Google Scholar] [CrossRef]
- Prasad, T.D.; Walters, G.A.; Savic, D.A. Booster Disinfection of Water Supply Networks: Multiobjective Approach. J. Water Resour. Plan. Manag. 2004, 130, 367–376. [Google Scholar] [CrossRef]
- Angeloudis, A.; Stoesser, T.; Falconer, R.A. Predicting the disinfection efficiency range in chlorine contact tanks through a CFD-based approach. Water Res. 2014, 60, 118–129. [Google Scholar] [CrossRef] [PubMed]
- Musz-Pomorska, A.; Widomski, M.K. Modelling Studies of Water Chlorination Efficiency in Municipal Water Supply Network. Ecol. Chem. Eng. A 2020, 27, 1–13. [Google Scholar] [CrossRef]
- Grayman, W.M.; Rossman, L.A.; Deininger, R.A.; Smith, C.D.; Arnold, C.N.; Smith, J.F. Mixing and Aging of Water in Distribution System Storage Failities. AWWA 2004, 96, 70–80. [Google Scholar] [CrossRef]
- Patwardhan, A.W. CFD modeling of jet mixed tanks. Chem. Eng. Sci. 2002, 57, 1307–1318. [Google Scholar] [CrossRef]
- Jaunâtre, J. Numerical Simulation of Threedimensional Flows in Water Storage Tanks—Application to Norra Ugglarps Reservoirs in South Sweden. Ph.D. Thesis, Lund University, Lund, Sweden, 2013. [Google Scholar]
- Angeloudis, A.; Stoesser, T.; Kim, D.; Falconer, R.A. CFD Study of Flow and Transport Characteristics in Baffled Disinfection Tanks. In Proceedings of the 35th IAHR World Congress, Chengdu, China, 8–13 September 2013. [Google Scholar]
- Stamatopoulos, K.; Alberini, F.; Batchelor, H.; Simmons, M.J.H. Use of PLIF to assess the mixing performance of small volume USP 2 apparatus in shear thinning media. Chem. Eng. Sci. 2016, 145, 1–9. [Google Scholar] [CrossRef]
- Tian, X.; Roberts, P.J. Mixing in Water Storage Tanks. I: No Buoyancy Effects. J. Environ. Eng.-ASCE 2008, 134, 974–985. [Google Scholar] [CrossRef]
- Aparicio-Mauricio, G.; Rodriguez, F.A.; Pijpers, J.J.H.; Cruz-Diaz, M.R.; Rivero, E.P. CFD modeling of residence time distribution and experimental validation in a redox flow battery using free and porous flow. J. Energy Storage 2020, 29, 101337. [Google Scholar] [CrossRef]
- Martins, N.M.C.; Covas, D.I.C.; Meniconi, S.; Capponi, C.; Brunone, B. Characterisation of low-Reynolds number flow through an orifice: CFD results vs. laboratory data. J. Hydroinform. 2021, 23, 709–723. [Google Scholar] [CrossRef]
- Martins, N.M.C.; Delgado, J.N.; Ramos, H.M.; Covas, D.I.C. Maximum transient pressures in a rapidly filling pipeline with entrapped air using a CFD model. J. Hydraul. Res. 2017, 55, 506–519. [Google Scholar] [CrossRef]
- Martins, N.M.C.; Soares, A.K.; Ramos, H.M.; Covas, D.I.C. CFD modeling of transient flow in pressurized pipes. Comput. Fluids 2016, 126, 129–140. [Google Scholar] [CrossRef]
- Okita, N.; Oyama, Y. Mixing Characteristics in Jet Mixing. Jpn. Chem. Eng. 1963, 27, 252–260. [Google Scholar] [CrossRef]
- Khan, L.A.; Wicklein, E.A.; Teixeira, E.C. Validation of a Three-Dimensional Computational Fluid Dynamics Model of a Contact Tank. J. Hydraul. Eng.-ASCE 2006, 132, 741–746. [Google Scholar] [CrossRef]
- Marek, M.; Stoesser, T.; Roberts, P.J.W.; Weitbrecht, V.; Jirka, G.H. CFD Modeling of Turbulent Jet Mixing in a Water Storage Tank. In Proceedings of the Congress-International Association for Hydraulic Research, Venice, Italy, 1–6 July 2007. [Google Scholar]
- Zhang, J.P.; Huck, P.M.; Stubley, G.D.; Anderson, W.B. Application of a multiphase CFD modelling approach to improve ozone residual monitoring and tracer testing strategies for full-scale drinking water ozone disinfection processes. J. Water Supply Res. Technol. 2008, 57, 79–92. [Google Scholar] [CrossRef]
- Xavier, M.L.M.; Janzen, J.G. Effects of inlet momentum and orientation on the hydraulic performance of water storage tanks. Appl. Water Sci. 2016, 7, 2545–2557. [Google Scholar] [CrossRef][Green Version]
- Tian, X.; Roberts, P.J. Mixing in Water Storage Tanks. II: With Buoyancy Effects. J. Environ. Eng.-ASCE 2008, 134, 986–995. [Google Scholar] [CrossRef]
- Montoya Pachongo, C.; Laín Beatove, S.; Torres Lozada, P.; Cruz-Vélez, C.H.; Escobar Rivera, J.C. Effects of water inlet configuration in a service reservoir applying CFD modelling. Ing. E Investig. 2016, 36, 31–40. [Google Scholar] [CrossRef]
- Bonetto, F.; Lahey, R.T. An experimental study on air carryunder due to a plunging liquid jet. Int. J. Multiph. Flow 1993, 19, 281–294. [Google Scholar] [CrossRef]
- Lezzi, A.M.; Prosperetti, A. The stability of an air film in a liquid flow. J. Fluid Mech. 1991, 226, 319–347. [Google Scholar] [CrossRef]
- Burgess, J.; Molloy, N.; McCarthy, M. A note on the plunging liquid jet reactor. Chem. Eng. Sci. 1972, 27, 442–445. [Google Scholar] [CrossRef]
- Bonetto, F.; Lahey, R.T.; Drew, D.A. An Experimental Study of Plunging Liquid Jet Induced Air Carryunder and Dispersion; Center for Multyiphase, Rensselaer Polythecnic Institute: Troy, NY, USA, 1993. [Google Scholar]
- Labousse, M.; Bush, J.W.M. The hydraulic bump: The surface signature of a plunging jet. Phys. Fluids 2013, 25, 094104. [Google Scholar] [CrossRef]
- Sophocleous, M. Understanding and explaining surface tension and capillarity: An introduction to fundamental physics for water professionals. Hydrogeol. J. 2010, 18, 811–821. [Google Scholar] [CrossRef]
- Lemanov, V.V.; Terekhov, V.I.; Sharov, K.A.; Shumeiko, A.A. An experimental study of submerged jets at low reynolds numbers. Tech. Phys. Lett. 2013, 39, 421–423. [Google Scholar] [CrossRef]
- Landa, P.S.; McClintock, P.V.E. Development of turbulence in subsonic submerged jets. Phys. Rep. 2004, 397, 1–62. [Google Scholar] [CrossRef]
- Monteiro, L.; Pinheiro, A.; Carneiro, J.; Covas, D.I.C. Characterization of drinking water storage tanks in Portugal. Ing. Del Agua 2021, 25, 49–58. (In Portuguese) [Google Scholar] [CrossRef]
- Pinheiro, A.; Monteiro, L.; Carneiro, J.; do Céu Almeida, M.; Covas, D. Water Mixing and Renewal in Circular Cross-Section Storage Tanks as Influenced by Configuration and Operational Conditions. J. Hydraul. Eng. 2021, 147, 04021050. [Google Scholar] [CrossRef]
- Wüthrich, B. Simulation and Validation of Compressible Flow in Nozzle Geometries and Validation of OpenFOAM for This Application. Master’s Thesis, Swiss Federal Institute of Technology Zurich, Zürich, Switzerland, 2007. [Google Scholar] [CrossRef]
- Holzmann, T. Mathematics Numerics Derivations And OpenFOAM (v7) The Basics for Numerical Simulations; Holzmann CFD: Loeben, Germany, 2019. [Google Scholar] [CrossRef]
- Zalesak, S.T. Fully Multidimensional Flux-Corrected Transport Algorithms for Fluids. J. Comput. Phys. 1979, 31, 335–362. [Google Scholar] [CrossRef]
- Denton, J.D.; Dawes, W.N. Computational fluid dynamics for turbomachinery design. Proc. Inst. Mech. Eng. Part C J. Mech. Eng. Sci. 1998, 213, 107–124. [Google Scholar] [CrossRef]
- Menter, F.R.; Kuntz, M.; Langtry, R. Ten years of industrial experience with the SST turbulence model. Turbul. Heat Mass Transf. 2003, 4, 625–632. [Google Scholar]
- El Halal, Y.; Marques, C.; Rocha, L.; Isoldi, L.; Lemos, R.; Fragassa, C.; dos Santos, E. Numerical Study of Turbulent Air and Water Flows in a Nozzle Based on the Coanda Effect. J. Mar. Sci. Eng. 2019, 7, 21. [Google Scholar] [CrossRef]
- Giles, B.D. Fluidics, the Coanda Effect, and some orographic winds. Arch. Meteorol. Geophys. Bioklimatol. Ser. A 1977, 25, 273–279. [Google Scholar] [CrossRef]
- Hegde, M. Fluid Mechanics and the Plateau-Rayleigh Instability; Report; University of California: Burkley, CA, USA, 2013. [Google Scholar]
- Tran, T.; de Maleprade, H.; Sun, C.; Lohse, D. Air entrainment during impact of droplets on liquid surfaces. J. Fluid Mech. 2013, 726, R3. [Google Scholar] [CrossRef]
- Cervantes-Alvarez, A.M.; Escobar-Ortega, Y.Y.; Sauret, A.; Pacheco-Vazquez, F. Air entrainment and granular bubbles generated by a jet of grains entering water. J. Colloid Interface Sci. 2020, 574, 285–292. [Google Scholar] [CrossRef] [PubMed]
- Qu, X.L.; Khezzar, L.; Danciu, D.; Labois, M.; Lakehal, D. Characterization of plunging liquid jets: A combined experimental and numerical investigation. Int. J. Multiph. Flow 2011, 37, 722–731. [Google Scholar] [CrossRef]
- Martin, C.I.; Matioc, B.V. Existence of Wilton Ripples for Water Waves with Constant Vorticity and Capillary Effects. SIAM J. Appl. Math. 2013, 73, 1582–1595. [Google Scholar] [CrossRef]


Publisher’s Note: MDPI stays neutral with regard to jurisdictional claims in published maps and institutional affiliations. |
© 2022 by the authors. Licensee MDPI, Basel, Switzerland. This article is an open access article distributed under the terms and conditions of the Creative Commons Attribution (CC BY) license (https://creativecommons.org/licenses/by/4.0/).
Share and Cite
Martins, N.M.C.; Covas, D.I.C. Induced Circulation by Plunging and Submerged Jets in Circular Water Storage Tanks Using CFD. Water 2022, 14, 1277. https://doi.org/10.3390/w14081277
Martins NMC, Covas DIC. Induced Circulation by Plunging and Submerged Jets in Circular Water Storage Tanks Using CFD. Water. 2022; 14(8):1277. https://doi.org/10.3390/w14081277
Chicago/Turabian StyleMartins, Nuno M. C., and Dídia I. C. Covas. 2022. "Induced Circulation by Plunging and Submerged Jets in Circular Water Storage Tanks Using CFD" Water 14, no. 8: 1277. https://doi.org/10.3390/w14081277
APA StyleMartins, N. M. C., & Covas, D. I. C. (2022). Induced Circulation by Plunging and Submerged Jets in Circular Water Storage Tanks Using CFD. Water, 14(8), 1277. https://doi.org/10.3390/w14081277