
Household Water Consumption in Spain: Disparities between Region


Abstract
:1. Introduction
2. Data and Methods
2.1. Database
2.2. Convergence and Phillips-Sul Methodology
3. Results and Discussion
3.1. Results
3.2. Forces That May Drive the Convergence Club Creation
3.3. Discussion
4. Conclusions
Author Contributions
Funding
Institutional Review Board Statement
Informed Consent Statement
Acknowledgments
Conflicts of Interest
Appendix A
| Author | Econometric Technique | Data | Result |
| Nauges and Thomas [67] | Panel data | 116 municipalities of Eastern France | Analyzes the effect of the public/private utilities on water demand. |
| Portnov and Meir [35] | β -convergence | 160 urban localities, Israel | Convergence or divergence in urban water consumption in Israel. |
| Schleich and Hillenbrand [44] | Cross-sectional estimation | 600 water supply areas, Germany | Price and income are relevant variables. |
| Fielding, et al. [69] | Cross-sectional estimation | 1008 households in Queensland, Australia | Demographic, psychosocial, behavioral, and infrastructure variables all have a role to play in determining household water use. |
| Wolters [70] | Cross-sectional estimation | Survey of families in Oregon, USA | The interaction of environmental concern and sociodemographics that predict identified water conservation behaviors is observed. |
| Katz [53] | Panel data | 30 OECD countries and 50 USA states. | Some support to the Environmental Kuznetz Curve. |
| Tzeremes and Tzeremes [34] | Phillips-Sul convergence analysis | 30 major U.S. cities | They find divergence, but also evidence in favor of convergence clubs. |
| Zhang, et al. [71] | Input-Ouput Tables | Chinese provinces | Important virtual scarce water differences are found across the Chinese provinces. |
| Acuña, et al. [36] | β -convergence | 348 Chilean localities from 2010 to 2015 | Shows convergence in water consumption. |
| Rondinel-Oviedo and Sarmiento-Pastor [72] | Cross-sectional analysis | Lima metropolitan area, Peru | Water use related to behavior, attitude or education is conditioned by dwelling characteristics and the types of devices employed in bathrooms. |
| Russell and Knoeri [73] | Cross-sectional estimation (hierarchical regression) | 1196 households across the UK | Attitudes, norms and habits play an important role in determining intention to conserve water. |
| Abu-Bakar, et al. [74] | Cluster analysis | 11,528 households, UK | Existence of different patterns of behavior. |
Appendix B. Phillips-Sul Clustering Algorithm
- Order the N regions according to their final values.
- Starting from the highest-order state, add adjacent regions from our ordered list and estimate model (3). Then, select the core group by maximizing the value of the convergence t-statistic, subject to the restriction that it is greater than −1.65.
- Continue adding one state at a time of the remaining regions to the core group, and re-estimate model (3) for each formation. Use the sign criterion (t-statistic > 0) to decide whether a state should join the core group.
- For the remaining regions, repeat steps (ii)–(iii) iteratively and stop when convergence clubs can no longer be formed. If the last group does not have a convergence pattern, conclude that its members diverge.
Appendix C. Definition of Variables
- Household income: Average annual net household income by regions. Source: National Statistical Institute of Spain (INE).
- Birth rate: Ratio between the number of observed births and the average population for each year by region. Source: National Statistical Institute of Spain (INE).
- Spending on environmental protection. (Percentage of total public spending dedicated to environmental protection.) Source: National Statistical Institute of Spain (INE).
- Price of water: Quotient between the amounts paid for water supply plus the amounts paid for sewerage, purification and sanitation or discharge charges, and the volume of water registered and distributed to users. Source: National Statistical Institute of Spain (INE).
- Aging index: Ratio (in percent) between the population over 64 years of age and the population under 16 years of age. Source: National Statistical Institute of Spain (INE).
- Average temperature: Statistical averages obtained between maximum and minimum temperatures. Source: State Meteorological Agency (Aemet).
- Average rainfall: Average rainfall recorded during a year at meteorological stations. Source: State Meteorological Agency (Aemet).
- Length of the supply network: Ratio measured in meters per inhabitant. Source: National Statistical Institute of Spain (INE).
- Percentage of real losses: Physical losses of water that occur in the public supply network up to the user’s metering point. It includes water leaks, breaks, tank overflows and breakdowns in the distribution network and in users’ connections. Source: National Statistical Institute of Spain (INE).
- Second homes: This is used during only part of the year on a seasonal, periodic, or sporadic basis and is not the usual residence of one or more persons. Source: National Statistical Institute of Spain (INE).
- Household size: Percentage of households out of the total for each of the measured sizes (less than 75 square meters, less than 105 square meters and less than 150 square meters). Source: National Statistical Institute of Spain (INE).
References
- Arbués, F.; García-Valiñas, M.Á.; Martínez-Espiñeira, R. Estimation of residential water demand: A state-of-the-art review. J. Socio-Econ. 2003, 32, 81–102. [Google Scholar] [CrossRef]
- Marshall, A. Water as an Element of National Wealth. In Memorials of Alfred Marshall; Kelley & Millman: New York, NY, USA, 1956; pp. 134–141. [Google Scholar]
- Hutton, G.; Varughese, M. The Costs of Meeting the 2030 Sustainable Development Goal Targets on Drinking Water, Sanitation, and Hygiene; Water and Sanitation Program: Technical Paper; World Bank: Washington, DC, USA, 2016. [Google Scholar]
- United Nations World Water Development Report 2021: Valuing Water; Nesco: Paris, France, 2021.
- Ho, L.; Alonso, A.; Forio, M.A.E.; Vanclooster, M.; Goethals, P.L. Water research in support of the Sustainable Development Goal 6: A case study in Belgium. J. Clean. Prod. 2020, 277, 124082. [Google Scholar] [CrossRef]
- Hoekstra, A.Y.; Chapagain, A.K.; Van Oel, P.R. Advancing water footprint assessment research: Challenges in monitoring progress towards sustainable development goal 6. Water 2017, 9, 438. [Google Scholar] [CrossRef] [Green Version]
- Hofste, R.W.; Reig, P.; Schleifer, L. 17 Countries, Home to One-Quarter of the World’s Population, Face Extremely High Water Stress; World Resources Institute: Washington, DC, USA, 2019. [Google Scholar]
- Cazcarro, I.; Duarte, R.; Sánchez-Chóliz, J. Economic growth and the evolution of water consumption in Spain: A structural decomposition analysis. Ecol. Econ. 2013, 96, 51–61. [Google Scholar] [CrossRef]
- Estrela, T.; Pérez-Martin, M.A.; Vargas, E. Impacts of climate change on water resources in Spain. Hydrol. Sci. J. 2012, 57, 1154–1167. [Google Scholar] [CrossRef]
- Gracia-De-Rentería, P.; Barberán, R.; Mur, J. Urban water demand for industrial uses in Spain. Urban Water J. 2019, 16, 114–124. [Google Scholar] [CrossRef]
- Martínez-Espiñeira, R. Residential water demand in the Northwest of Spain. Environ. Resour. Econ. 2002, 21, 161–187. [Google Scholar] [CrossRef]
- Arbués, F.; Villanúa, I. Potential for pricing policies in water resource management: Estimation of urban residential water demand in Zaragoza, Spain. Urban Stud. 2006, 43, 2421–2442. [Google Scholar] [CrossRef]
- Hoyos, D.; Artabe, A. Regional differences in the price elasticity of residential water demand in Spain. Water Resour. Manag. 2017, 31, 847–865. [Google Scholar] [CrossRef]
- Sauri, D. The decline of water consumption in Spanish cities: Structural and contingent factors. Int. J. Water Resour. Dev. 2020, 36, 909–925. [Google Scholar] [CrossRef]
- Fuentes, E.; Arce, L.; Salom, J. A review of domestic hot water consumption profiles for application in systems and buildings energy performance analysis. Renew. Sustain. Energy Rev. 2018, 81, 1530–1547. [Google Scholar] [CrossRef]
- Bich-Ngoc, N.; Teller, J. A review of residential water consumption determinants. In Proceedings of the International Conference on Computational Science and Its Applications, Melbourne, Australia, 2–5 June 2018; Springer International Publishing: Cham, Switzerland, 2018; pp. 685–696. [Google Scholar]
- Abu-Bakar, H.; Williams, L.; Hallett, S.H. A review of household water demand management and consumption measurement. J. Clean. Prod. 2021, 292, 125872. [Google Scholar] [CrossRef]
- Phillips, P.C.; Sul, D. Transition modeling and econometric convergence tests. Econometrica 2007, 75, 1771–1855. [Google Scholar] [CrossRef] [Green Version]
- Phillips, P.C.; Sul, D. Economic transition and growth. J. Appl. Econom. 2009, 24, 1153–1185. [Google Scholar] [CrossRef] [Green Version]
- Tortajada, C.; González-Gómez, F.; Biswas, A.K.; Buurman, J. Water demand management strategies for water-scarce cities: The case of Spain. Sustain. Cities Soc. 2019, 45, 649–656. [Google Scholar] [CrossRef]
- Barro, R.J.; Sala-i-Martin, X. Convergence. J. Political Econ. 1992, 100, 223–251. [Google Scholar] [CrossRef]
- Carlino, G.A.; Mills, L. Are US regional incomes converging? A time series analysis. J. Monet. Econ. 1993, 32, 335–346. [Google Scholar] [CrossRef]
- Bernard, A.B.; Durlauf, S.N. Convergence in international output. J. Appl. Econom. 1995, 10, 97–108. [Google Scholar] [CrossRef] [Green Version]
- González-Álvarez, M.A.; Lázaro-Alquézar, A.; Simón-Fernández, M.B. Global Trends in Child Obesity: Are Figures Converging? Int. J. Environ. Res. Public Health 2020, 17, 9252. [Google Scholar] [CrossRef] [PubMed]
- Clemente, J.; Lázaro-Alquézar, A.; Montañés, A. US State health expenditure convergence: A revisited analysis. Econ. Model. 2019, 83, 210–220. [Google Scholar] [CrossRef] [Green Version]
- Rodríguez-Benavides, D.; López-Herrera, F.; Venegas-Martínez, F. Are there economic convergence clubs in Latin America? J. Econ. Dev. Stud. 2014, 2, 113–123. [Google Scholar] [CrossRef]
- Jangam, B.P.; Sahoo, P.K.; Akram, V. Convergence in electricity consumption across Indian states: A disaggregated analysis. Int. J. Energy Sect. Manag. 2019, 14, 624–637. [Google Scholar] [CrossRef]
- Camarero, M.; Picazo-Tadeo, A.J.; Tamarit, C. Are the determinants of CO2 emissions converging among OECD countries? Econ. Lett. 2013, 118, 159–162. [Google Scholar] [CrossRef] [Green Version]
- Parker, S.; Bhatti, M.I. Dynamics and drivers of per capita CO2 emissions in Asia. Energy Econ. 2020, 89, 104798. [Google Scholar] [CrossRef]
- Apergis, N.; Payne, J.E. NAFTA and the convergence of CO2 emissions intensity and its determinants. Int. Econ. 2020, 161, 1–9. [Google Scholar] [CrossRef]
- Payne, J.E.; Apergis, N. Convergence of per capita carbon dioxide emissions among developing countries: Evidence from stochastic and club convergence tests. Environ. Sci. Pollut. Res. 2020, 28, 1–13. [Google Scholar] [CrossRef] [PubMed]
- Camarero, M.; Castillo, J.; Picazo-Tadeo, A.J.; Tamarit, C. Eco-efficiency and convergence in OECD countries. Environ. Resour. Econ. 2013, 55, 87–106. [Google Scholar] [CrossRef] [Green Version]
- Alcay, A.; Montañés, A.; Simón-Fernández, M.B. Waste generation in Spain. Do Spanish regions exhibit a similar behavior? Waste Manag. 2020, 112, 66–73. [Google Scholar] [CrossRef] [PubMed]
- Tzeremes, P.; Tzeremes, N.G. A convergence assessment of water price rates: Evidence from major US cities. Lett. Spat. Resour. Sci. 2018, 11, 361–368. [Google Scholar] [CrossRef]
- Portnov, B.A.; Meir, I. Urban water consumption in Israel: Convergence or divergence? Environ. Sci. Policy 2008, 11, 347–358. [Google Scholar] [CrossRef]
- Acuña, G.I.; Echeverría, C.; Godoy, A.; Vásquez, F. The role of climate variability in convergence of residential water consumption across Chilean localities. Environ. Econ. Policy Stud. 2020, 22, 89–108. [Google Scholar] [CrossRef]
- Quah, D. Galton’s fallacy and tests of the convergence hypothesis. Scand. J. Econ. 1993, 11, 427–443. [Google Scholar] [CrossRef]
- Hodrick, R.J.; Prescott, E.C. Postwar US business cycles: An empirical investigation. J. Money Credit. Bank. 1997, 29, 1–16. [Google Scholar] [CrossRef]
- Dalhuisen, J.M.; Florax, R.J.; De Groot, H.L.; Nijkamp, P. Price and income elasticities of residential water demand: A meta-analysis. Land Econ. 2003, 79, 292–308. [Google Scholar] [CrossRef]
- Sebri, M. A meta-analysis of residential water demand studies. Environ. Dev. Sustain. 2014, 16, 499–520. [Google Scholar] [CrossRef]
- Taylor, R.G.; McKean, J.R.; Young, R.A. Alternate price specifications for estimating residential water demand with fixed fees. Land Econ. 2004, 80, 463–475. [Google Scholar] [CrossRef]
- Martínez-Espiñeira, R.; Nauges, C. Is really all domestic water consumption sensitive to price control? Appl. Econ. 2004, 36, 1697–1703. [Google Scholar] [CrossRef]
- Domene, E.; Sauri, D. Urbanisation and water consumption: Influencing factors in the metropolitan region of Barcelona. Urban Stud. 2006, 43, 1605–1623. [Google Scholar] [CrossRef]
- Schleich, J.; Hillenbrand, T. Determinants of residential water demand in Germany. Ecol. Econ. 2009, 68, 1756–1769. [Google Scholar] [CrossRef] [Green Version]
- March, H.; Perarnau, J.; Sauri, D. Exploring the links between immigration, ageing and domestic water consumption: The case of the Metropolitan Area of Barcelona. Reg. Stud. 2012, 46, 229–244. [Google Scholar] [CrossRef]
- Marzano, R.; Rouge, C.; Garrone, P.; Grilli, L.; Harou, J.J.; Pulido-Velazquez, M. Determinants of the price response to residential water tariffs: Meta-analysis and beyond. Environ. Model. Softw. 2018, 101, 236–248. [Google Scholar] [CrossRef]
- Garrone, P.; Grilli, L.; Marzano, R. Price elasticity of water demand considering scarcity and attitudes. Util. Policy 2019, 59, 100927. [Google Scholar] [CrossRef]
- Worthington, A.C.; Hoffman, M. An empirical survey of residential water demand modelling. J. Econ. Surv. 2008, 22, 842–871. [Google Scholar] [CrossRef] [Green Version]
- Reynaud, A.; Romano, G. Advances in the economic analysis of residential water use: An introduction. Water 2018, 10, 1162. [Google Scholar] [CrossRef] [Green Version]
- Kuznets, S. Economic growth and income inequality. Am. Econ. Rev. 1995, 45, 1–28. [Google Scholar]
- Duarte, R.; Pinilla, V.; Serrano, A. Is there an environmental Kuznets curve for water use? A panel smooth transition regression approach. Econ. Model. 2013, 31, 518–527. [Google Scholar] [CrossRef] [Green Version]
- Zhao, X.; Fan, X.; Liang, J. Kuznets type relationship between water use and economic growth in China. J. Clean. Prod. 2017, 168, 1091–1100. [Google Scholar] [CrossRef]
- Katz, D. Water use and economic growth: Reconsidering the environmental Kuznets curve relationship. J. Clean. Prod. 2015, 88, 205–213. [Google Scholar] [CrossRef]
- Expósito, A.; Pablo-Romero, M.; Sánchez-Braza, A. Testing EKC for urban water use: Empirical evidence at River Basin scale from the Guadalquivir River, Spain. J. Water Resour. Plan. Manag. 2019, 145, 04019005. [Google Scholar] [CrossRef]
- Expósito, A.; Pablo-Romero, M.D.P.; Sánchez-Braza, A. Exploring EKCs in Urban Water and Energy Use Patterns and Its Interconnections: A Case Study in Southern Spain. In Sustaining Resources for Tomorrow; Springer International Publishing: Cham, Switzerland, 2020; pp. 47–65. [Google Scholar]
- Pastor, D.J.; Fullerton, T.M. Municipal Water Consumption and Urban Economic Growth in El Paso. Water 2020, 12, 2656. [Google Scholar] [CrossRef]
- Galarraga, I.; Abadie, L.M.; Kallbekken, S. Designing incentive schemes for promoting energy-efficient appliances: A new methodology and a case study for Spain. Energy Policy 2016, 90, 24–36. [Google Scholar] [CrossRef]
- Waris, I.; Hameed, I. Promoting environmentally sustainable consumption behavior: An empirical evaluation of purchase intention of energy-efficient appliances. Energy Effic. 2020, 13, 1653–1664. [Google Scholar] [CrossRef]
- Dieu-Hang, T.; Grafton, R.Q.; Martínez-Espiñeira, R.; Garcia-Valiñas, M. Household adoption of energy and water-efficient appliances: An analysis of attitudes, labelling and complementary green behaviours in selected OECD countries. J. Environ. Manag. 2017, 197, 140–150. [Google Scholar] [CrossRef] [PubMed]
- Olmstead, S.M.; Stavins, R.N. Comparing price and nonprice approaches to urban water conservation. Water Resour. Res. 2009, 45. [Google Scholar] [CrossRef] [Green Version]
- Lee, M.; Tansel, B. Life cycle based analysis of demands and emissions for residential water-using appliances. J. Environ. Manag. 2012, 101, 75–81. [Google Scholar] [CrossRef] [PubMed]
- Stavenhagen, M.; Buurman, J.; Tortajada, C. Saving water in cities: Assessing policies for residential water demand management in four cities in Europe. Cities 2018, 79, 187–195. [Google Scholar] [CrossRef]
- Suárez-Varela, M. Modeling residential water demand: An approach based on household demand systems. J. Environ. Manag. 2020, 261, 109921. [Google Scholar] [CrossRef] [PubMed]
- Gilg, A.; Barr, S. Behavioural attitudes towards water saving? Evidence from a study of environmental actions. Ecol. Econ. 2006, 57, 400–414. [Google Scholar] [CrossRef]
- Quentin Grafton, R.; Jiang, Q. Economic effects of water recovery on irrigated agriculture in the Murray-Darling Basin. Aust. J. Agric. Resour. Econ. 2011, 55, 487–499. [Google Scholar] [CrossRef] [Green Version]
- Höglund, L. Household demand for water in Sweden with implications of a potential tax on water use. Water Resour. Res. 1999, 35, 3853–3863. [Google Scholar] [CrossRef]
- Nauges, C.; Thomas, A. Privately operated water utilities, municipal price negotiation, and estimation of residential water demand: The case of France. Land Econ. 2000, 76, 68–85. [Google Scholar] [CrossRef]
- Makki, A.A.; Stewart, R.A.; Beal, C.D.; Panuwatwanich, K. Novel bottom-up urban water demand forecasting model: Revealing the determinants, drivers and predictors of residential indoor end-use consumption. Resour. Conserv. Recycl. 2015, 95, 15–37. [Google Scholar] [CrossRef] [Green Version]
- Fielding, K.S.; Russell, S.; Spinks, A.; Mankad, A. Determinants of household water conservation: The role of demographic, infrastructure, behavior, and psychosocial variables. Water Resour. Res. 2012, 48. [Google Scholar] [CrossRef] [Green Version]
- Wolters, E.A. Attitude–behavior consistency in household water consumption. Soc. Sci. J. 2014, 51, 455–463. [Google Scholar] [CrossRef]
- Zhang, Y.; Chen, Y.; Huang, M. Water footprint and virtual water accounting for China using a multi-regional input-output model. Water 2018, 11, 34. [Google Scholar] [CrossRef] [Green Version]
- Rondinel-Oviedo, D.R.; Sarmiento-Pastor, J.M. Water: Consumption, usage patterns, and residential infrastructure. A comparative analysis of three regions in the Lima metropolitan area. Water Int. 2020, 45, 824–846. [Google Scholar] [CrossRef]
- Russell, S.V.; Knoeri, C. Exploring the psychosocial and behavioural determinants of household water conservation and intention. Int. J. Water Resour. Dev. 2020, 36, 940–955. [Google Scholar] [CrossRef] [Green Version]
- Abu-Bakar, H.; Williams, L.; Hallett, S.H. Quantifying the impact of the COVID-19 lockdown on household water consumption patterns in England. NPJ Clean Water 2021, 4, 1–9. [Google Scholar] [CrossRef]


| Region | Acronym | 2000 | 2018 | Min | Max | g0018 | g0008 | g0813 | g1318 |
|---|---|---|---|---|---|---|---|---|---|
| Andalucía | AND | 184 | 128 | 120 | 196 | −2.0% | −2.2% | −4.9% | 1.3% |
| Aragón | ARA | 174 | 129 | 129 | 174 | −1.6% | −2.2% | −2.4% | 0.0% |
| Asturias | AST | 152 | 140 | 122 | 187 | −0.5% | 1.8% | −7.0% | 2.8% |
| Islas Baleares | BAL | 132 | 121 | 120 | 152 | −0.5% | 0.5% | 0.6% | −3.0% |
| Islas Canarias | CAN | 143 | 135 | 135 | 159 | −0.3% | 1.3% | −2.1% | −1.1% |
| Cantabria | CAB | 187 | 172 | 144 | 202 | −0.5% | −0.2% | −4.8% | 3.6% |
| Castilla y León | CYL | 154 | 148 | 146 | 173 | −0.2% | −0.3% | 0.9% | −1.2% |
| Castilla-La Mancha | CLM | 186 | 135 | 125 | 200 | −1.8% | −2.7% | −1.2% | −0.7% |
| Cataluña | CAT | 185 | 123 | 117 | 185 | −2.2% | −3.8% | −3.0% | 1.0% |
| C. Valenciana | CVA | 166 | 175 | 152 | 188 | 0.3% | 1.4% | −3.2% | 2.1% |
| Extremadura | EXT | 158 | 126 | 125 | 185 | −1.2% | −0.2% | −2.1% | −2.1% |
| Galicia | GAL | 130 | 125 | 119 | 161 | −0.2% | 1.4% | −3.9% | 1.0% |
| Madrid | MAD | 171 | 125 | 125 | 171 | −1.7% | −2.4% | −1.5% | −0.9% |
| Murcia | MUR | 142 | 149 | 124 | 166 | 0.3% | 1.3% | −4.6% | 3.7% |
| Navarra | NAV | 157 | 114 | 111 | 157 | −1.8% | −2.6% | −2.5% | 0.4% |
| País Vasco | PAV | 155 | 104 | 104 | 155 | −2.2% | −1.5% | −2.1% | −3.3% |
| La Rioja | LAR | 179 | 116 | 106 | 179 | −2.4% | −2.3% | −5.4% | 0.7% |
| España | SPA | 168 | 133 | 130 | 173 | −1.3% | −1.3% | −3.0% | 0.5% |
| Panel I. Testing for Convergence | ||||||
|---|---|---|---|---|---|---|
| −1.68 | ||||||
| Log t-ratio | −27.54 | |||||
| Panel II. Estimated Convergence Clubs | ||||||
| Initial convergence clubs | Merging convergence club analysis | Final convergence clubs | ||||
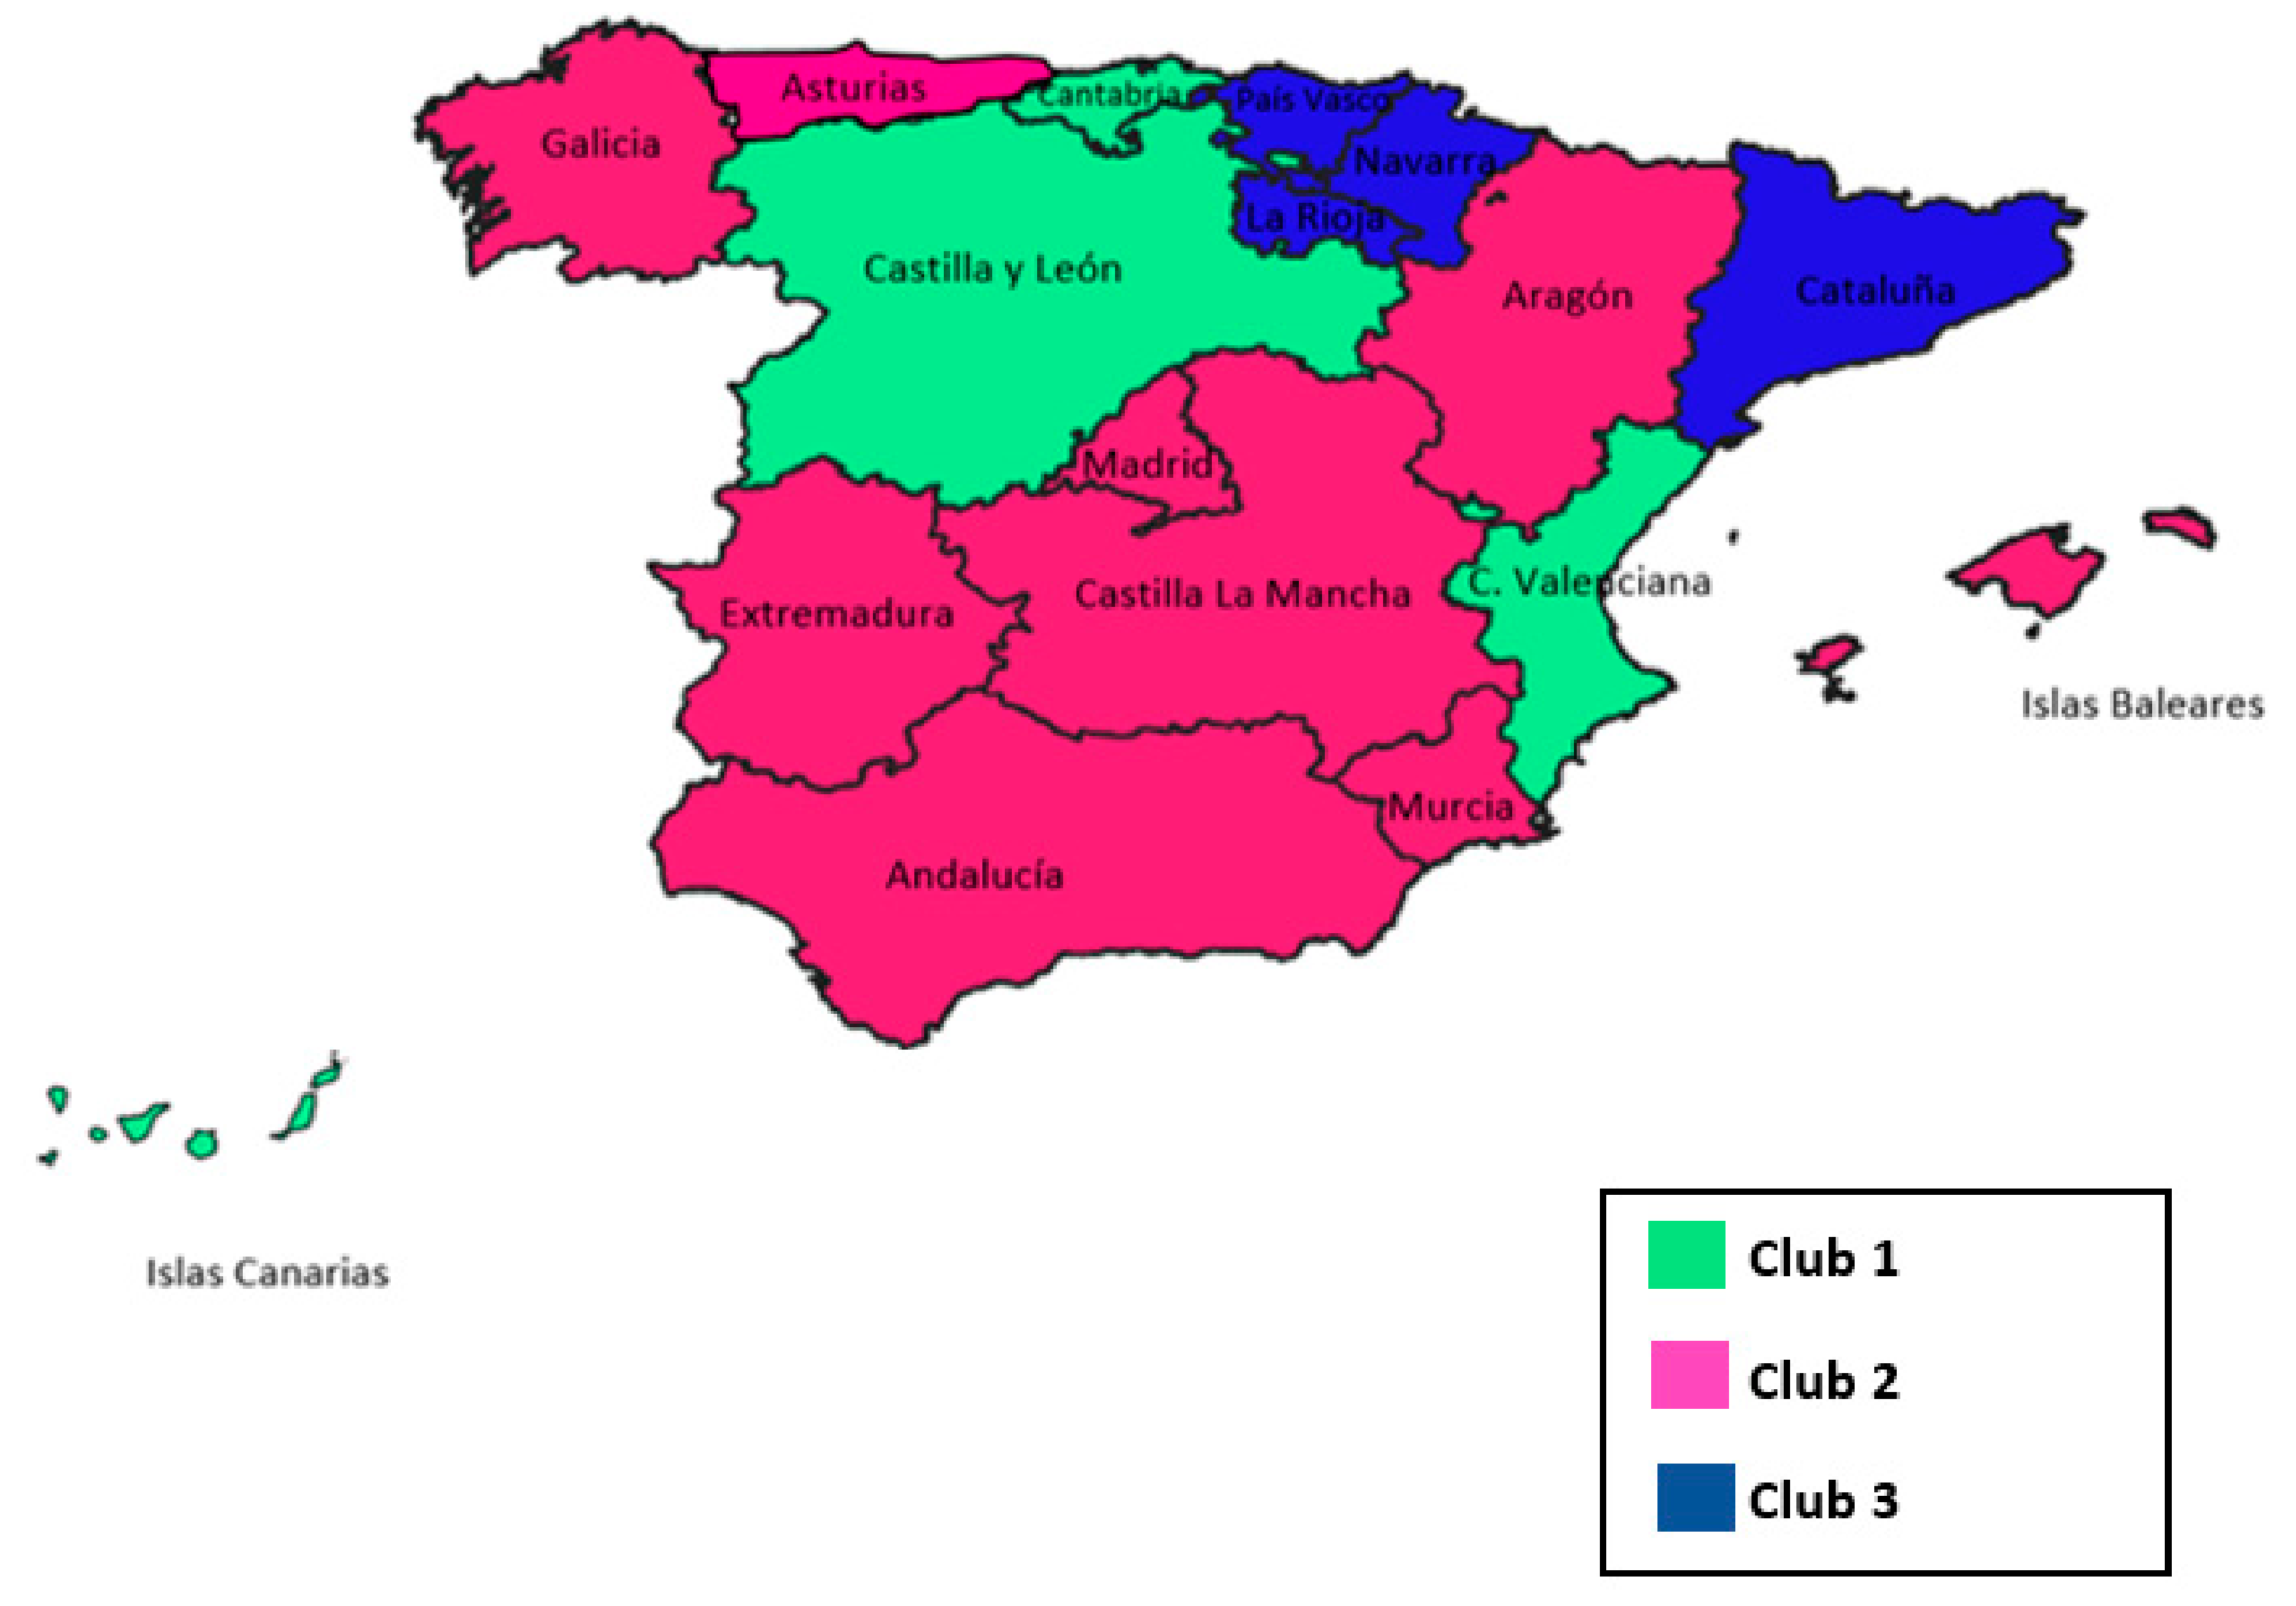
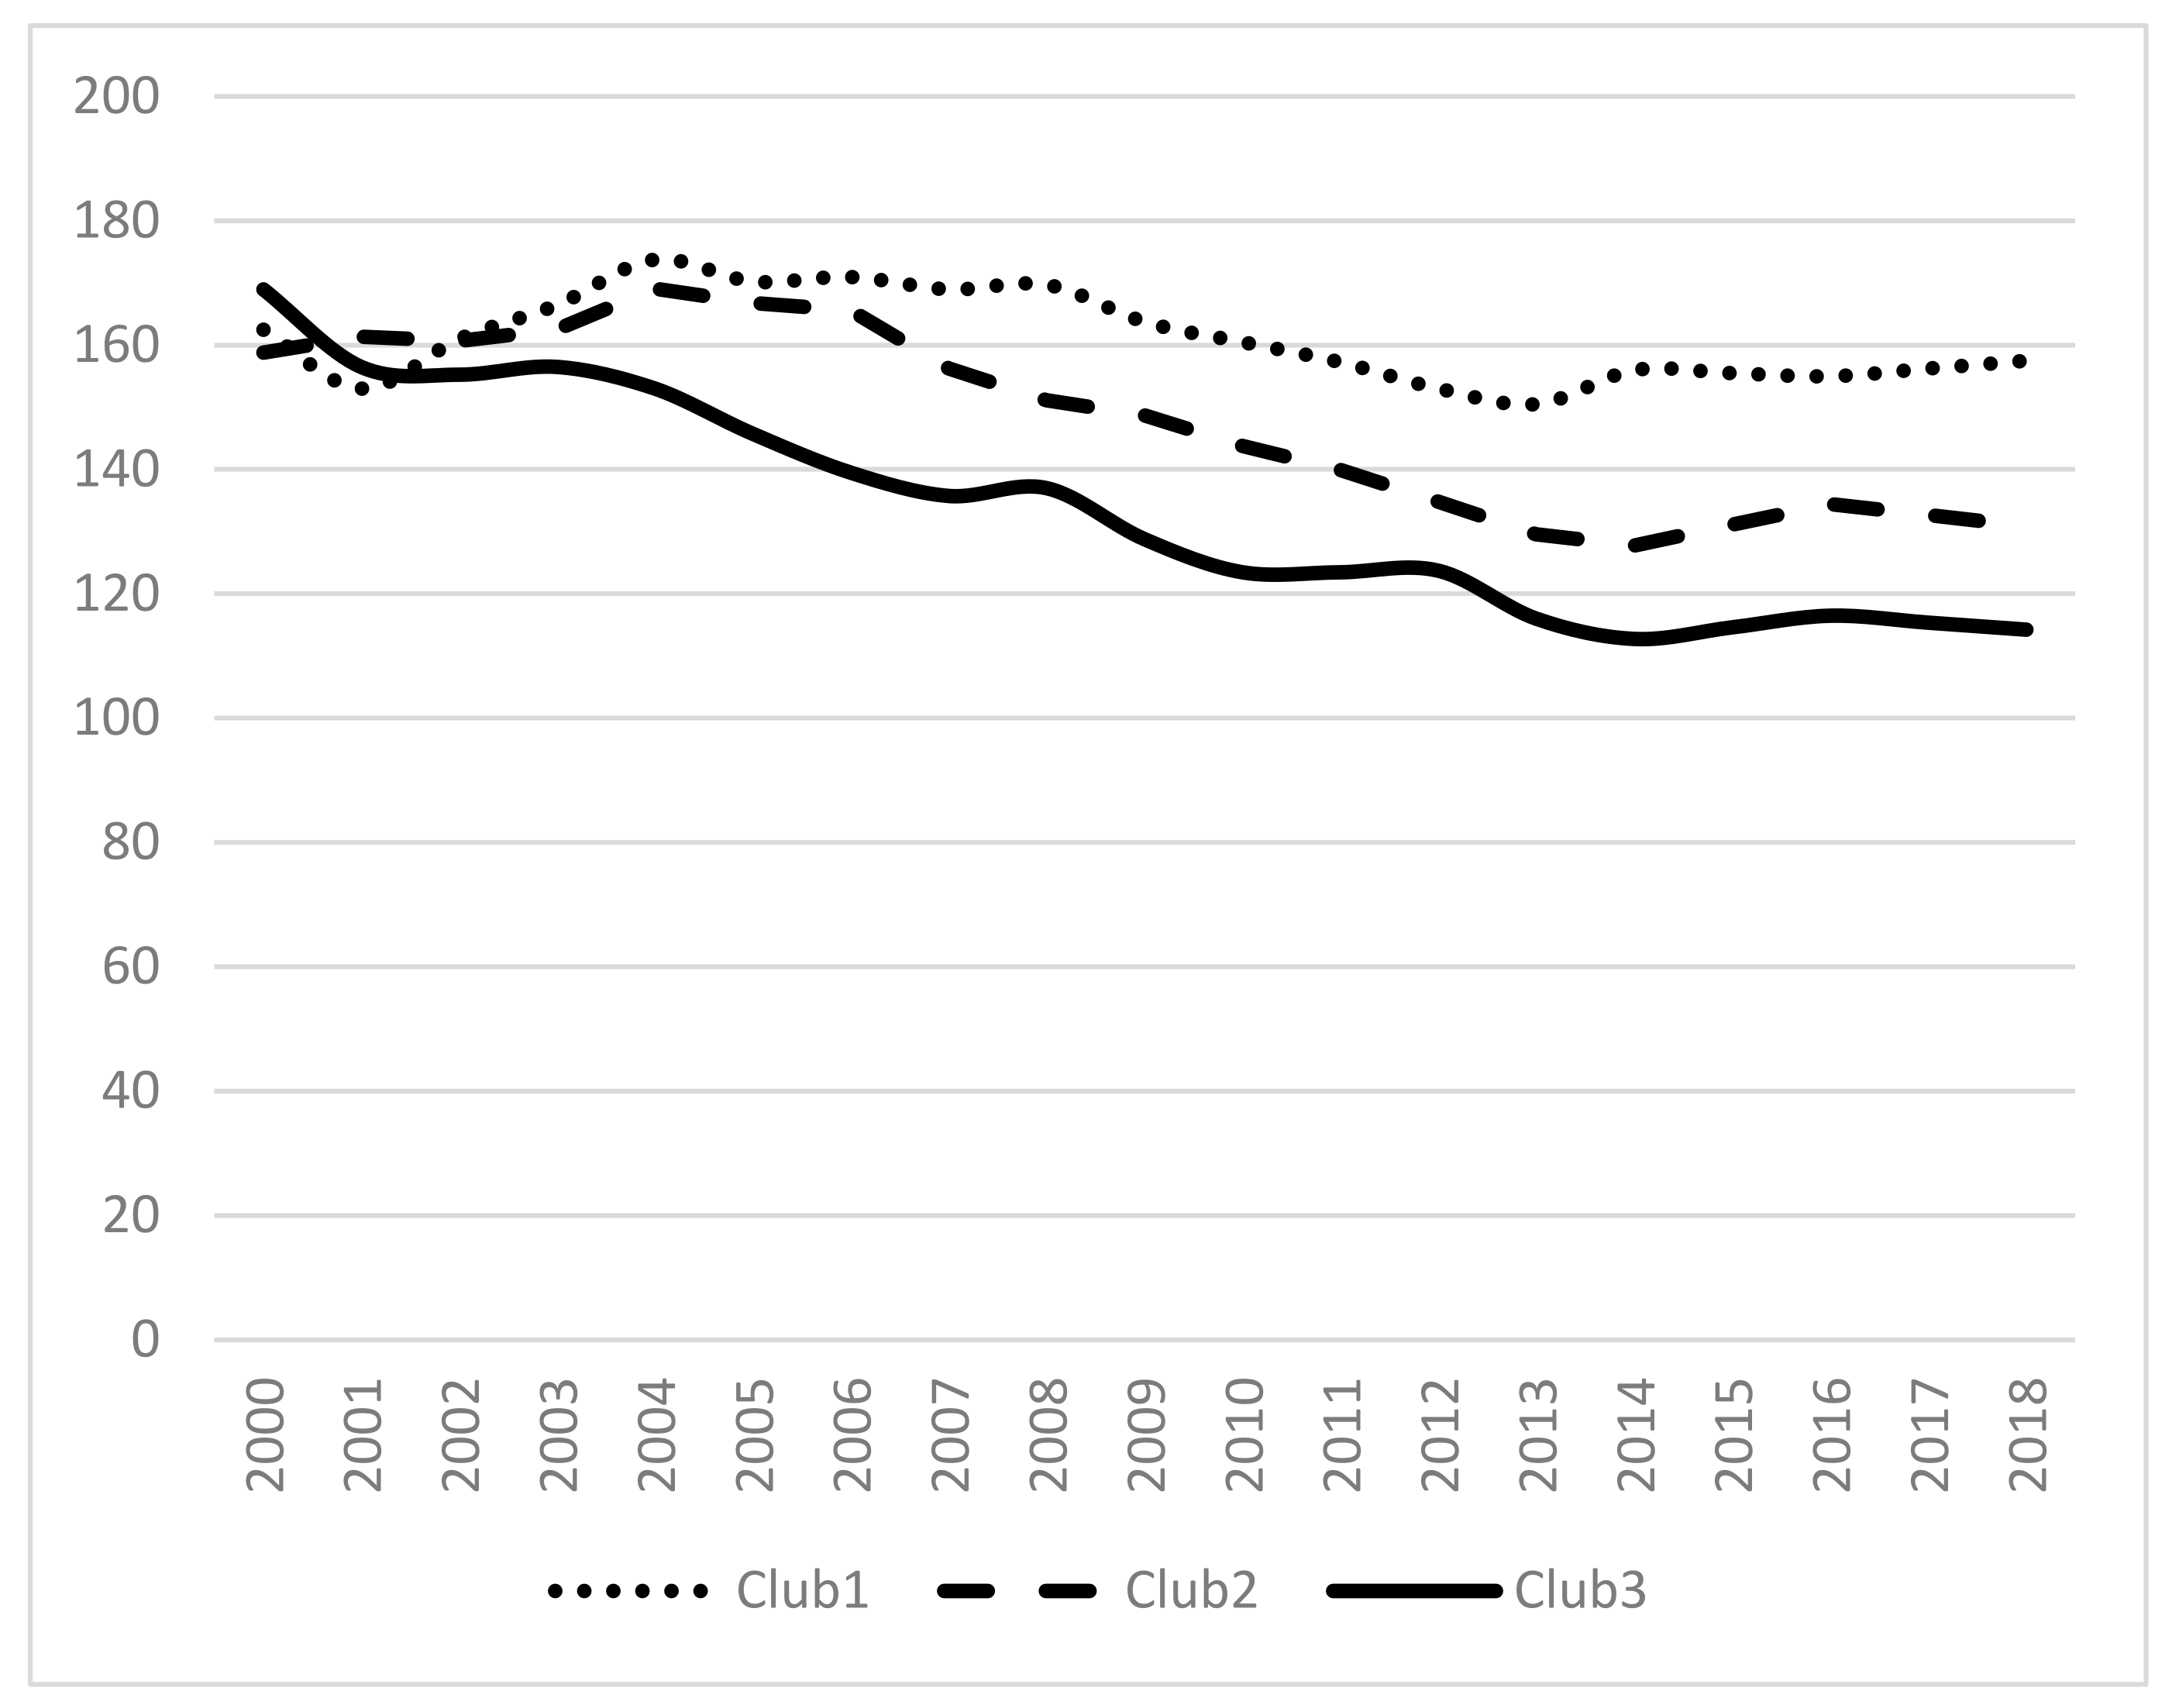
| Club 1 | CAN, CAB, CYL, CVAL | 0.017 (0.180) | Club 1 | CAN, CAB, CYL, CVAL | ||
| Club 2 | AND, ARA, AST, BAL, CLM, EXT, GAL, MAD, MUR | 0.523 (3.300) | Club 1 + 2 | −1.458 (−11.861) | Club 2 | AND, ARA, AST, BAL, CLM, EXT, GAL, MAD, MUR |
| Club 3 | CAT, NAV, PAV, LAR | 0.194 (1.880) | Club 2 +3 | −0.877 (−18.120) | Club 3 | CAT, NAV, PAV, LAR |
| Variable | Club 1 | Club 2 | Club 3 |
|---|---|---|---|
| Household income | 28,100 | 29,754 | 35,838 |
| Birth rate | 7.54 | 8.59 | 8.87 |
| Spending on environmental protection | 0.012 | 0.014 | 0.018 |
| Price of water | 1.85 | 1.72 | 1.78 |
| Aging rate | 136.93 | 128.11 | 124.36 |
| Average temperature | 17.12 | 16.89 | 14.67 |
| Average rainfall | 498.88 | 455.24 | 683.10 |
| Length of the supply network | 7.40 | 5.78 | 5.00 |
| Percentage of real losses | 20.90 | 15.86 | 15.30 |
| Secondary housing | 0.28 | 0.36 | 0.37 |
| Households <75 m2 | 25.88 | 24.71 | 28.95 |
| Households <105 m2 | 42.42 | 41.65 | 44.71 |
| Households <150 m2 | 18.03 | 20.19 | 14.93 |
| Variable | Estimation |
|---|---|
| Household income | 4.277 × (10−4) (2.58) |
| Birth rate | 1.42 (2.76) |
| Spending on environmental protection | 192.62 (1.85) |
| Pseudo R2 | 0.4402 |
| % Cases correctly classified | 76% |
Publisher’s Note: MDPI stays neutral with regard to jurisdictional claims in published maps and institutional affiliations. |
© 2022 by the authors. Licensee MDPI, Basel, Switzerland. This article is an open access article distributed under the terms and conditions of the Creative Commons Attribution (CC BY) license (https://creativecommons.org/licenses/by/4.0/).
Share and Cite
Baigorri, B.; Montañés, A.; Simón-Fernández, M.B. Household Water Consumption in Spain: Disparities between Region. Water 2022, 14, 1121. https://doi.org/10.3390/w14071121
Baigorri B, Montañés A, Simón-Fernández MB. Household Water Consumption in Spain: Disparities between Region. Water. 2022; 14(7):1121. https://doi.org/10.3390/w14071121
Chicago/Turabian StyleBaigorri, Bárbara, Antonio Montañés, and María Blanca Simón-Fernández. 2022. "Household Water Consumption in Spain: Disparities between Region" Water 14, no. 7: 1121. https://doi.org/10.3390/w14071121
APA StyleBaigorri, B., Montañés, A., & Simón-Fernández, M. B. (2022). Household Water Consumption in Spain: Disparities between Region. Water, 14(7), 1121. https://doi.org/10.3390/w14071121