Article

Assessment of Phosphorus Input from Urban Areas in the Passaúna River and Reservoir

1
Department of Aquatic Environmental Engineering, Institute for Water and River Basin Management, Karlsruhe Institute of Technology, 76131 Karlsruhe, Germany
2
Department of Hydraulics and Sanitation, Federal University of Paraná, Curitiba 80050-540, Brazil
3
Department of Research and Innovation, Water and Sanitation Company of Paraná SANEPAR, Curitiba 80215-900, Brazil
*
Author to whom correspondence should be addressed.
Water 2022, 14(5), 809; https://doi.org/10.3390/w14050809
Submission received: 3 February 2022 / Revised: 24 February 2022 / Accepted: 2 March 2022 / Published: 4 March 2022
(This article belongs to the Special Issue Monitoring, Modelling and Management of Water Quality II)

Abstract

:
Elevated phosphorus loads play an important role in the deterioration of water quality and can subsequently pose a threat to the aquatic organisms in a river or a standing water body. The accurate assessment of total phosphorus (TP) fluxes from a catchment is of high importance to the well-being of the entire river ecosystem. In this study, we assessed the yearly input of TP from the urban areas of the Passaúna catchment in southern Brazil. The catchment drains into the eponymous reservoir, which provides drinking water for more than 800,000 inhabitants of the Curitiba Metropolitan region. The protection of the water quality in the river as well as in the reservoir is of paramount importance, yet high phosphorous inputs have been detected. For adequate protection, the catchment emissions need to be accurately assessed. Initially, the TP concentration in the river sediment was determined in order to assess the relationship between the TP export of the urban areas and the TP stock of the river. It was found that in areas with a higher share of urban land cover and especially in areas with a lack of sewage treatment, the TP concentration in the sediment reached up to 6700 mg/kg. The assessment of the overall TP input from urban areas was based on a regionalized emission-modeling approach, combined with data from long-term water quality monitoring of the river. The monitoring station established upstream of the Passaúna Reservoir inflow provided an initial assessment and the necessary output for the validation and calibration of the model. From the drainage basin of the monitoring station, an overall TP input of 2501 kg/a (0.31 kg/(ha a)) was measured between 1 May 2018 and 1 May 2019 (3508 kg TP/a or 0.23 kg/(ha a) when extrapolating the overall catchment of the Passaúna Reservoir). The monitoring data indicated that the TP input increases during the wet months of the year. The sediment stock of the river also plays an important role in the interannual budget of TP. During the timespan of one year, many deposition–resuspension events happen. The resuspended material is included in the baseflow and hinders the differentiation between urban and nonurban input. After calibration, the model was able to predict the yearly input of TP from the urban areas of the Passaúna catchment. In addition, the share of inhabitants who are not connected to the sewer system was assessed. Overall, the combination of monitoring and modeling in this study offers a valuable overview of the TP dynamics of the system, while the model ensures reproducibility with high accuracy at the same time.

1. Introduction

In most cases, the amount of phosphorus reaching the surface of water bodies represents a key factor for eutrophication and the consequent increase in primary production. The major sources of phosphorus discharge into rivers are dissolved or particle-bound phosphorus from sewage/industrial effluents (point sources) and agricultural areas (diffuse sources) [1,2,3].
Not all phosphorus reaching the water bodies is available for phytoplankton, algae, or macrophytes. The biologically available fraction constitutes only a small share of the total phosphorus content found in river sediments [4,5]. The biologically available phosphorus (BAP) originates mainly from either point sources or diffuse urban sources while the input of particle-bound phosphorus originates mainly from agricultural areas. The latter, even though usually present in larger amounts, is often firmly bound to carbonates or iron-hydroxides, and is present in dissolved form only in smaller amounts. Despite the smaller level of overall emissions, compared to agricultural areas, several studies suggest that point and diffuse effluents from urban areas are responsible for an elevated eutrophication risk due to the higher share of BAP [6,7].
Due to the importance of BAP, the focus of this study was set on the investigation of the P-sources in an exemplary subtropical catchment in a developing country with an “incomplete” sewage infrastructure. Initially, a version of the Modeling of Regionalized Emissions tool (MoRE) [8] was used to quantify the TP input for the entire catchment. Afterwards, given the scale of the urban expansion in the area, the focus of this study was placed on emissions from urban areas. In addition, as also shown in [9], the phosphorus input from direct sewage discharge accounts for more than 50% of the overall input. The objective of the study was to create a low-complexity model that can be used as a decision support system for specific interventions on a local scale but also for the overall improvement of the sewer system and wastewater treatment in the Passaúna catchment. The model was calibrated with data from an automatic monitoring station, which achieved continuous data collection over one year. The monitoring results produced a validation basis for the model output but most importantly, they provided a more holistic understanding of the system and its processes. The active presence of the station for a period of a year revealed the temporal phosphorus dynamics of the catchment and the real magnitude of the P-input.
The findings of the study are of great regional importance as the Passaúna catchment includes the Passaúna Reservoir, which provides drinking water for more than 800,000 inhabitants of the metropolitan area of Curitiba. Hence, the results can help to explain, and subsequently also to predict, the long-term trends of P concentrations in the river-reservoir system and finally, help to protect the reservoir from eutrophication.

2. Materials and Methods

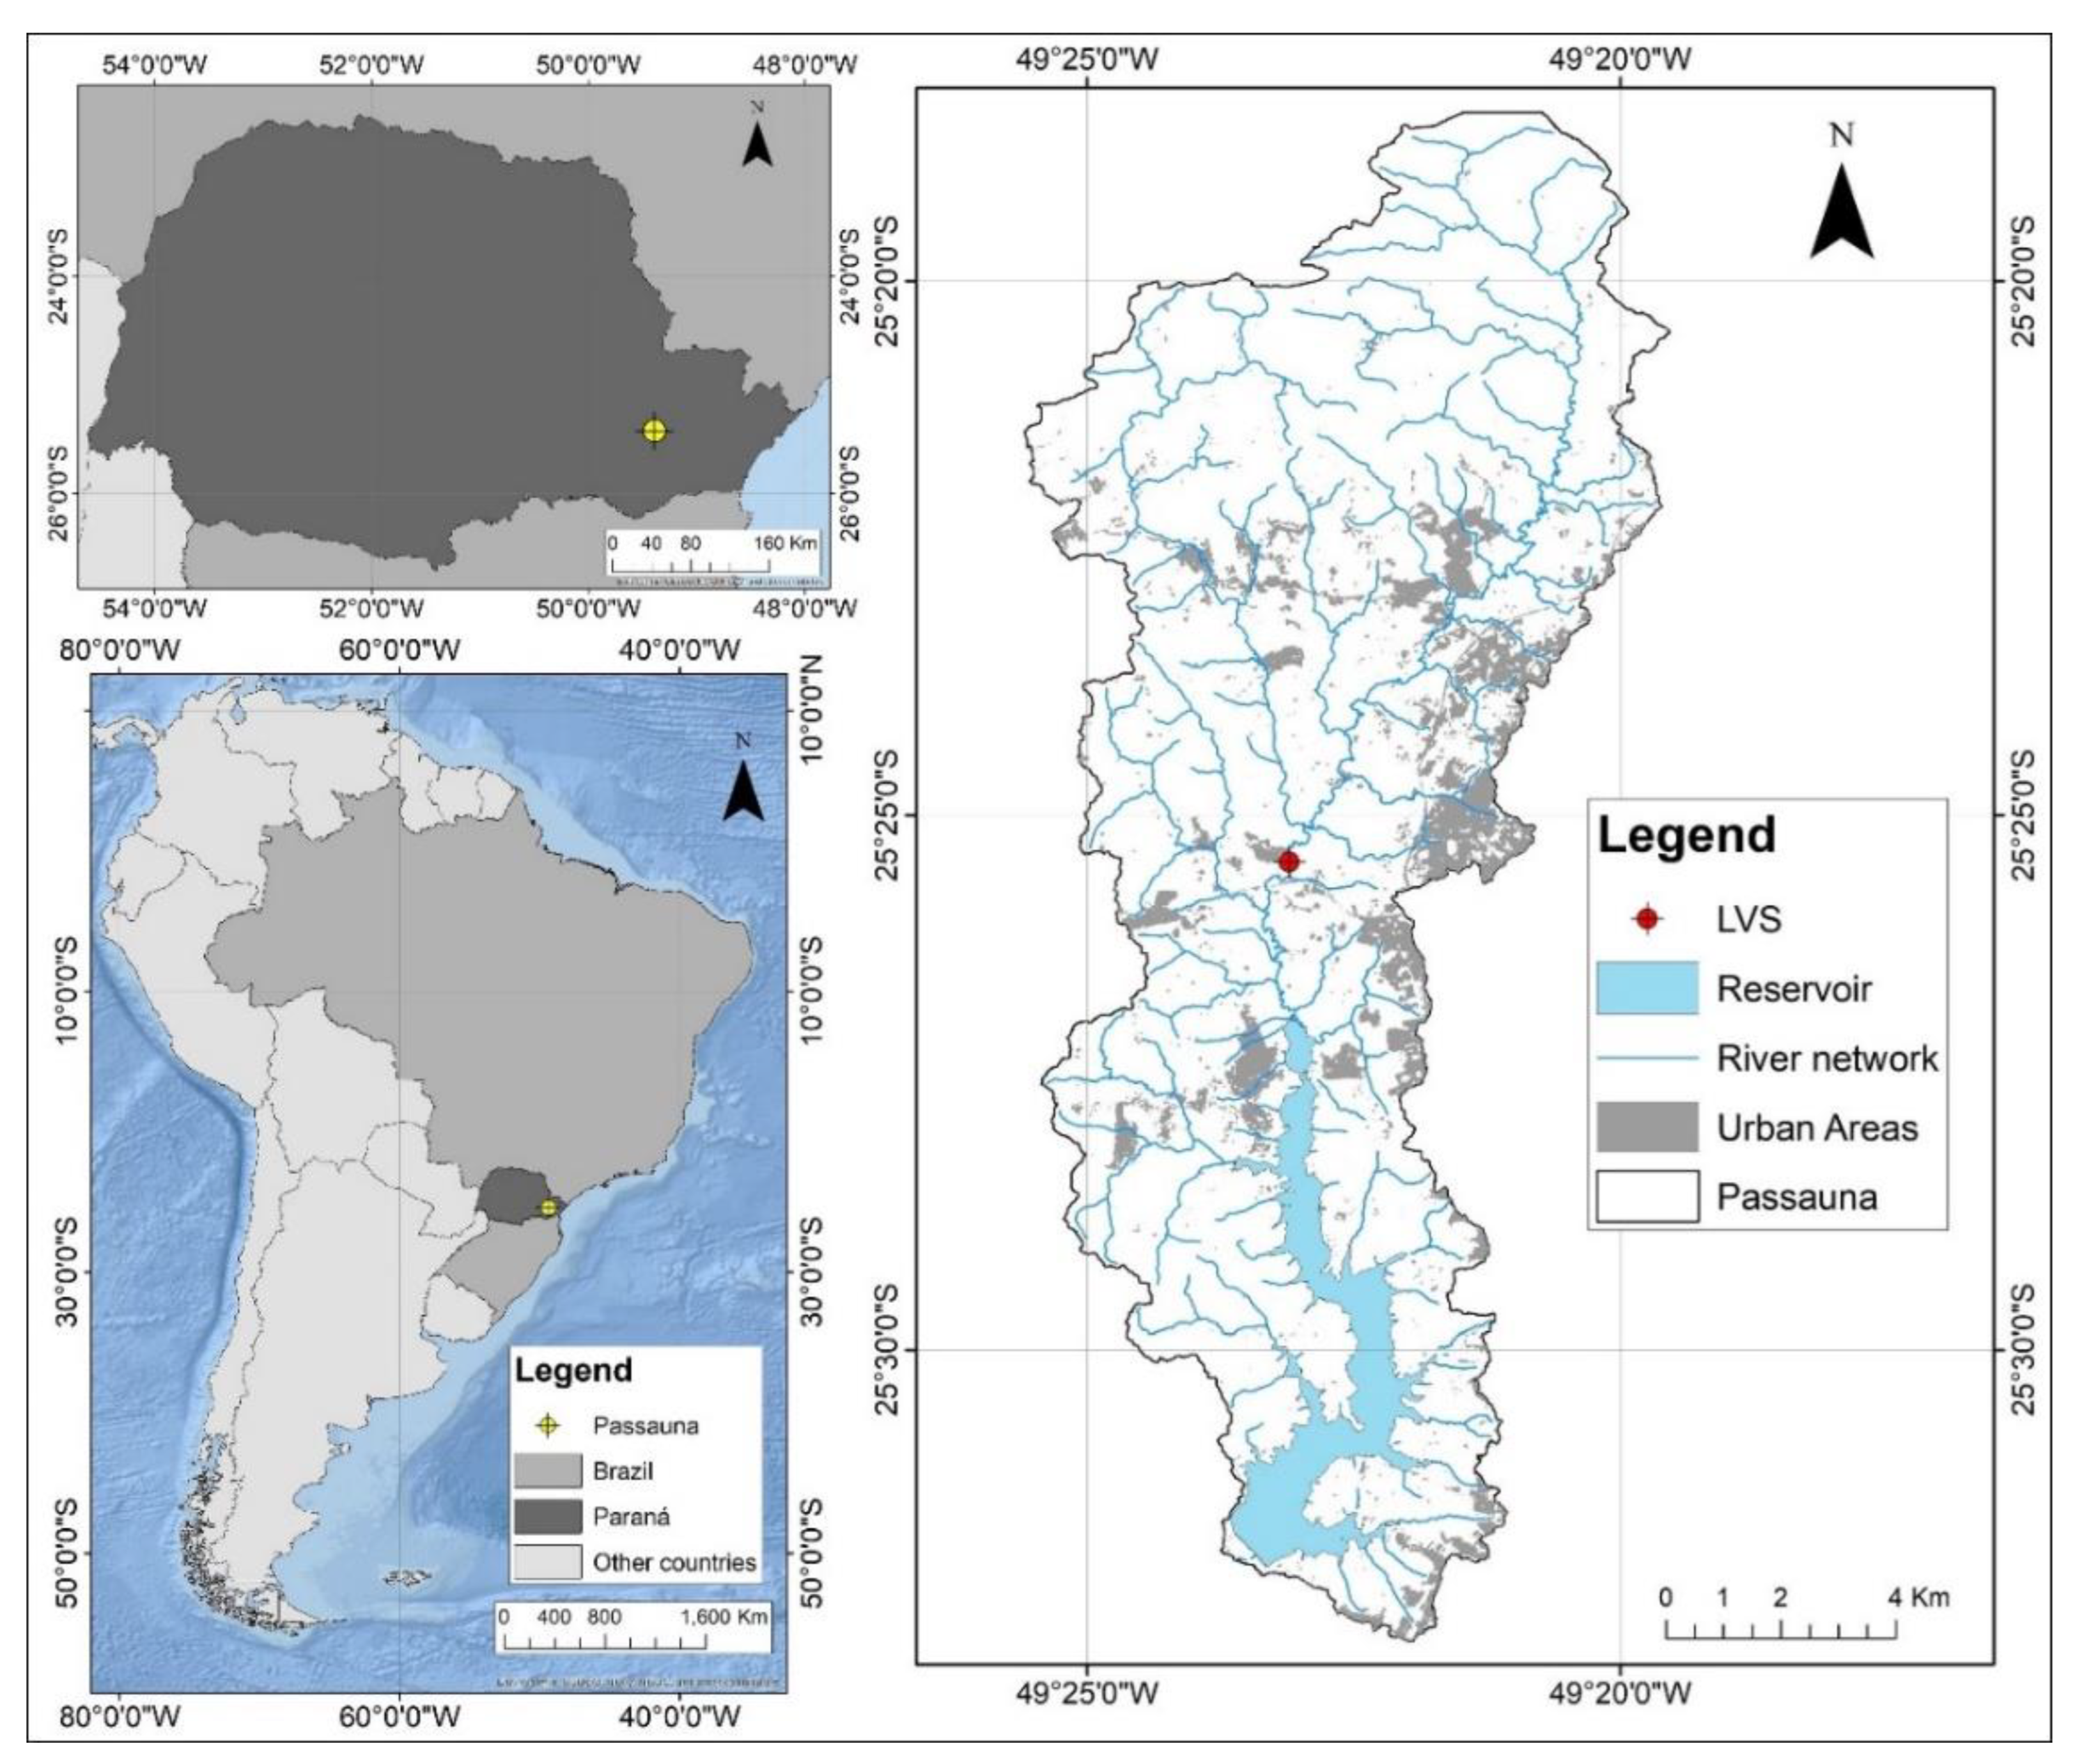
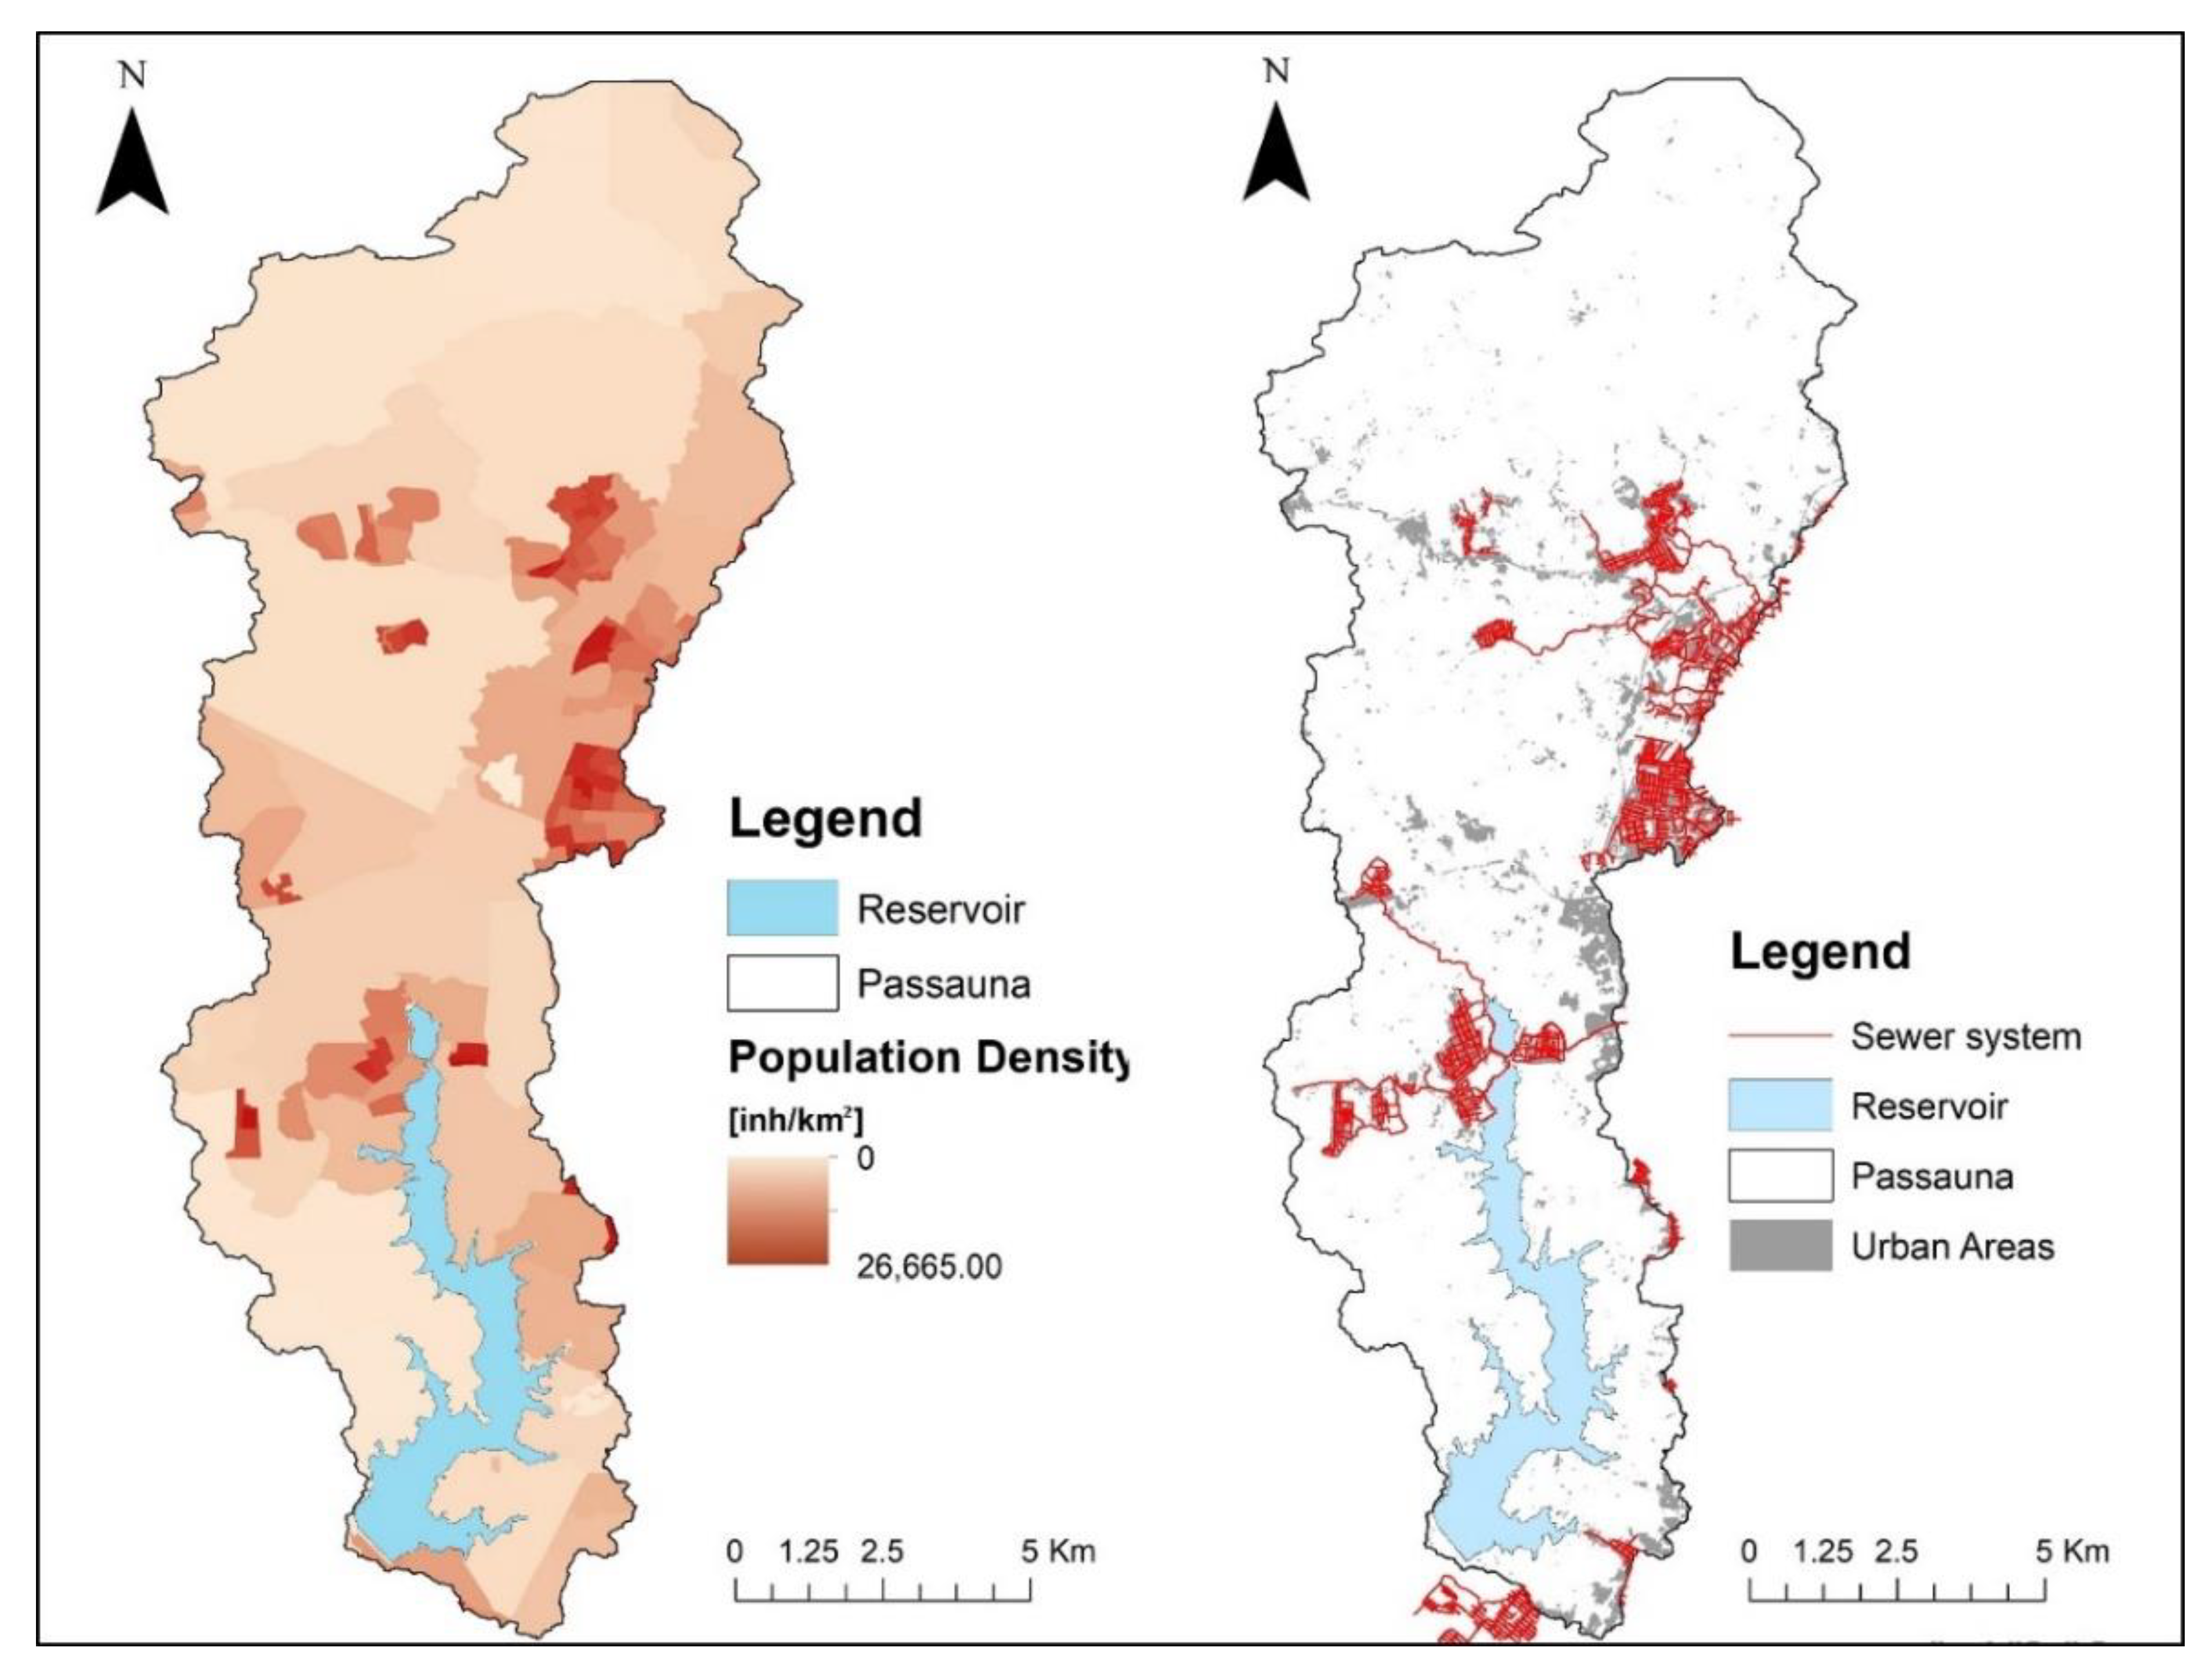
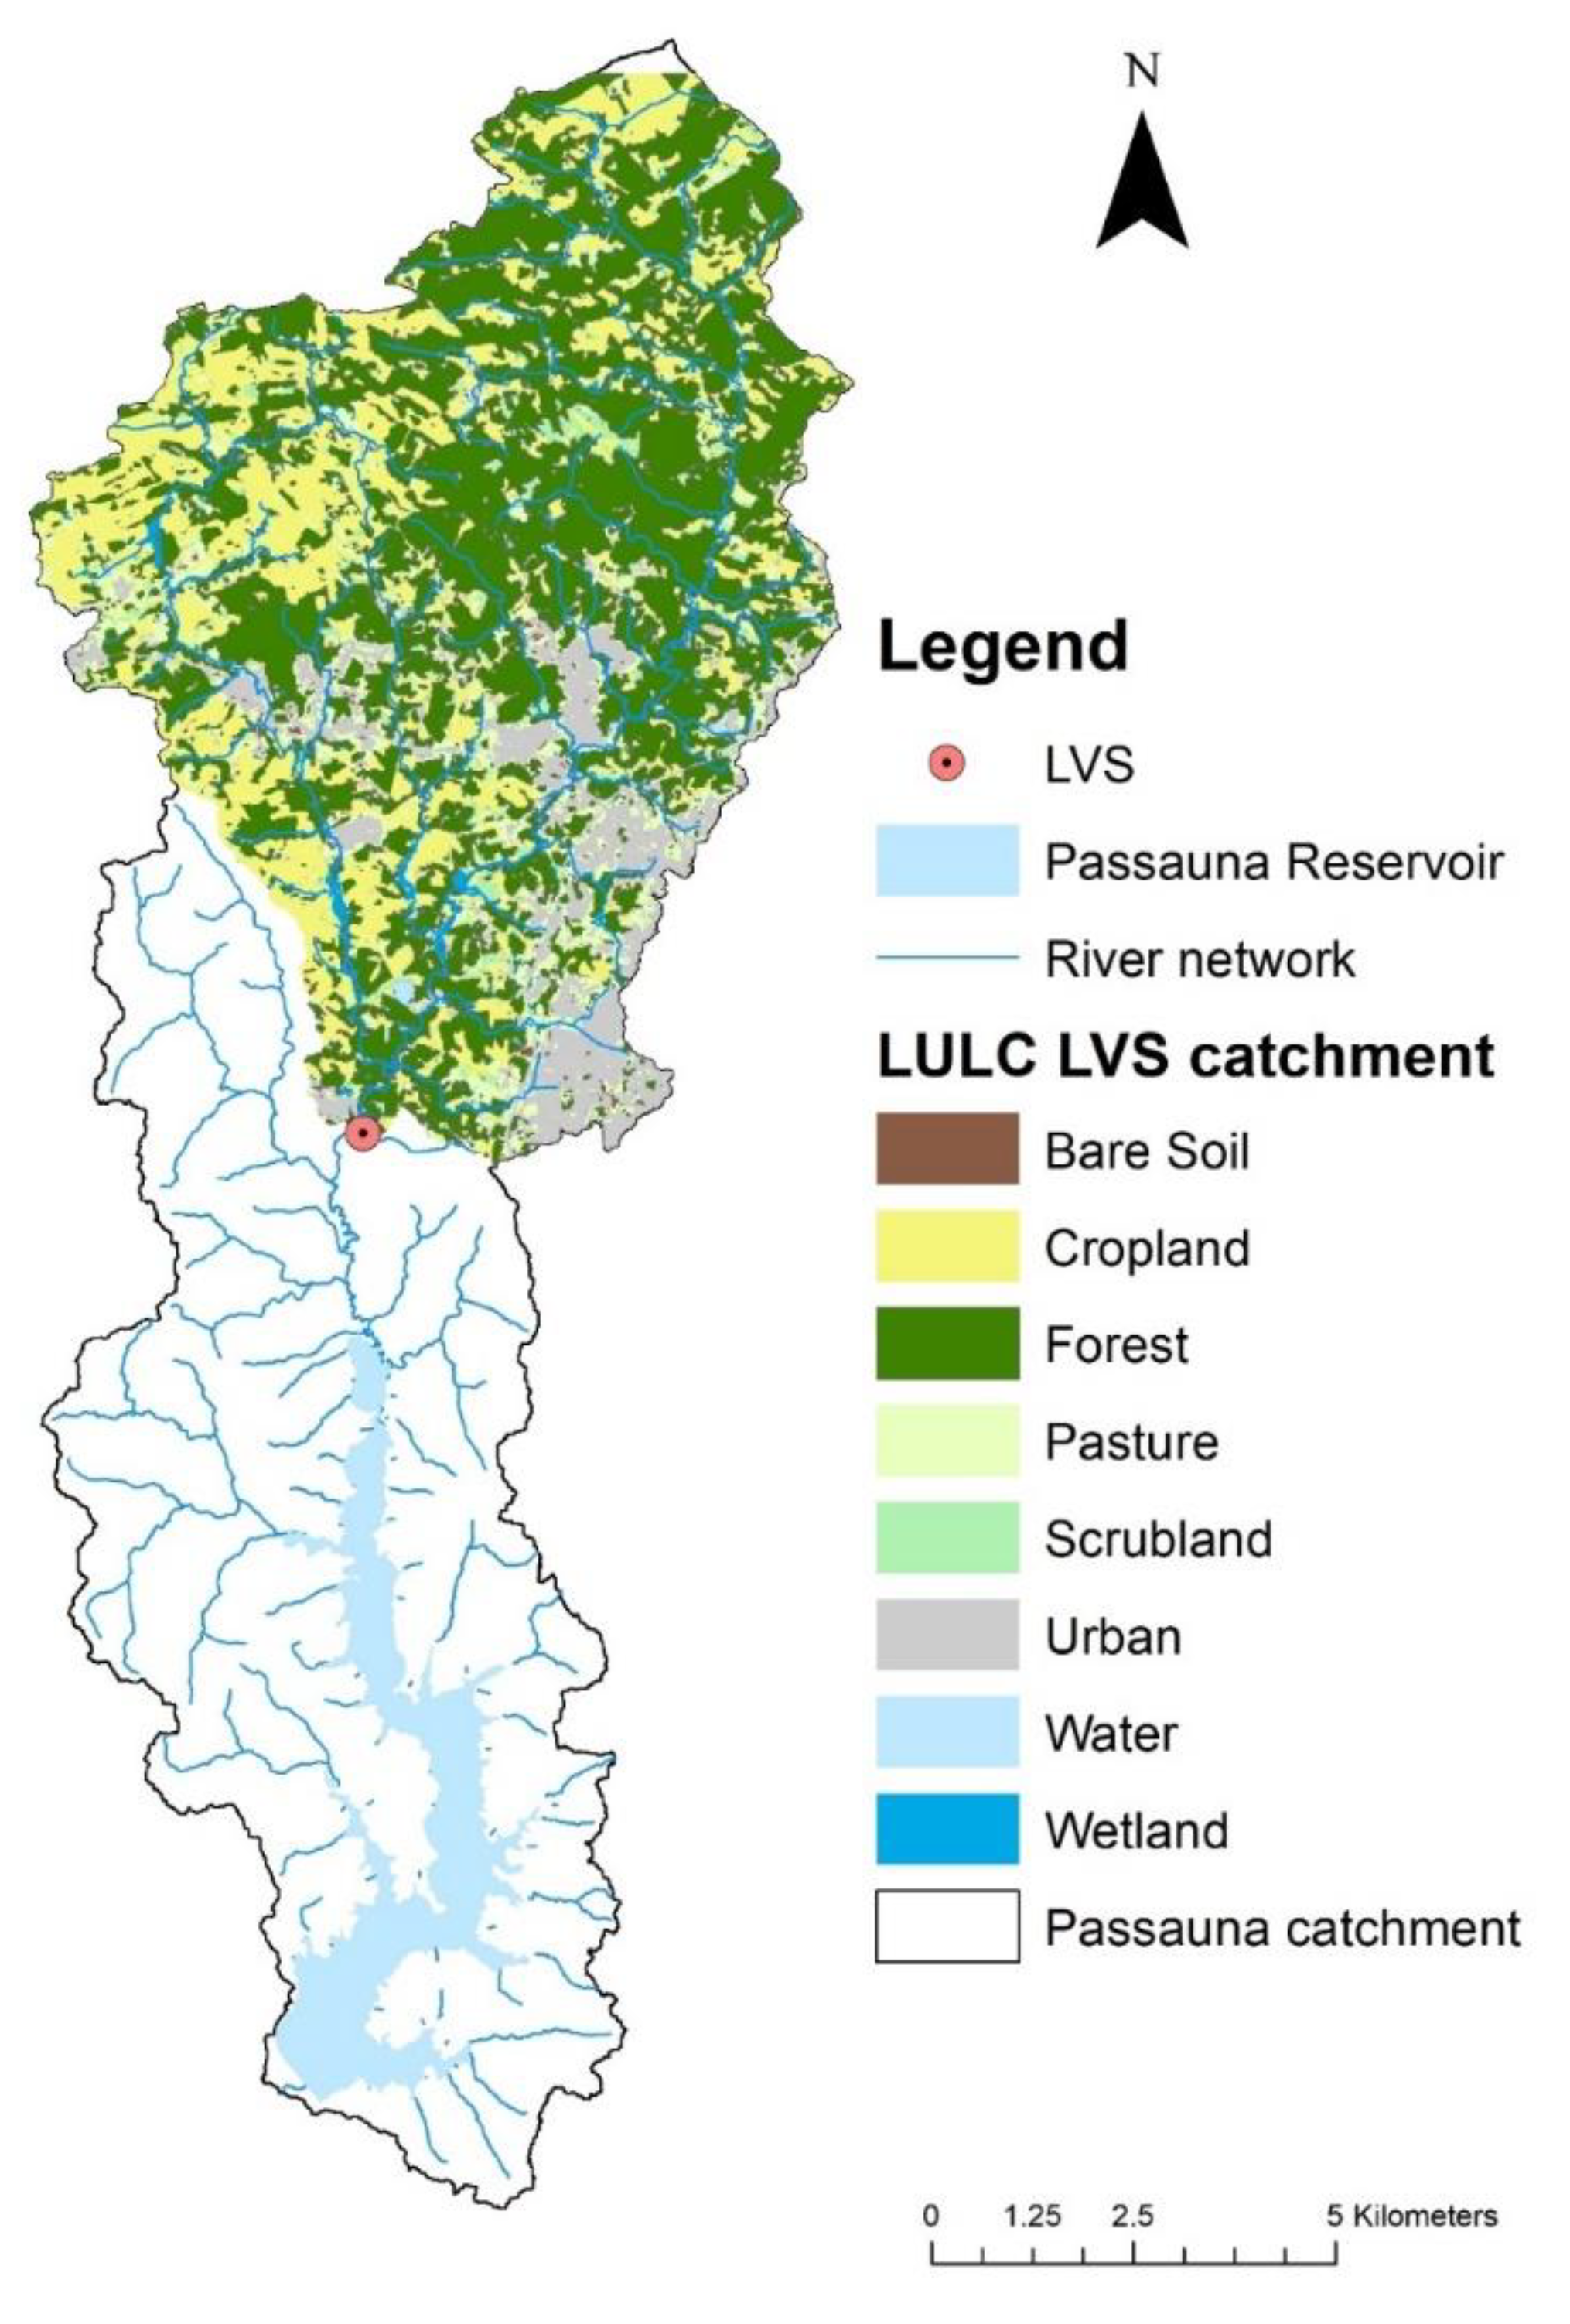
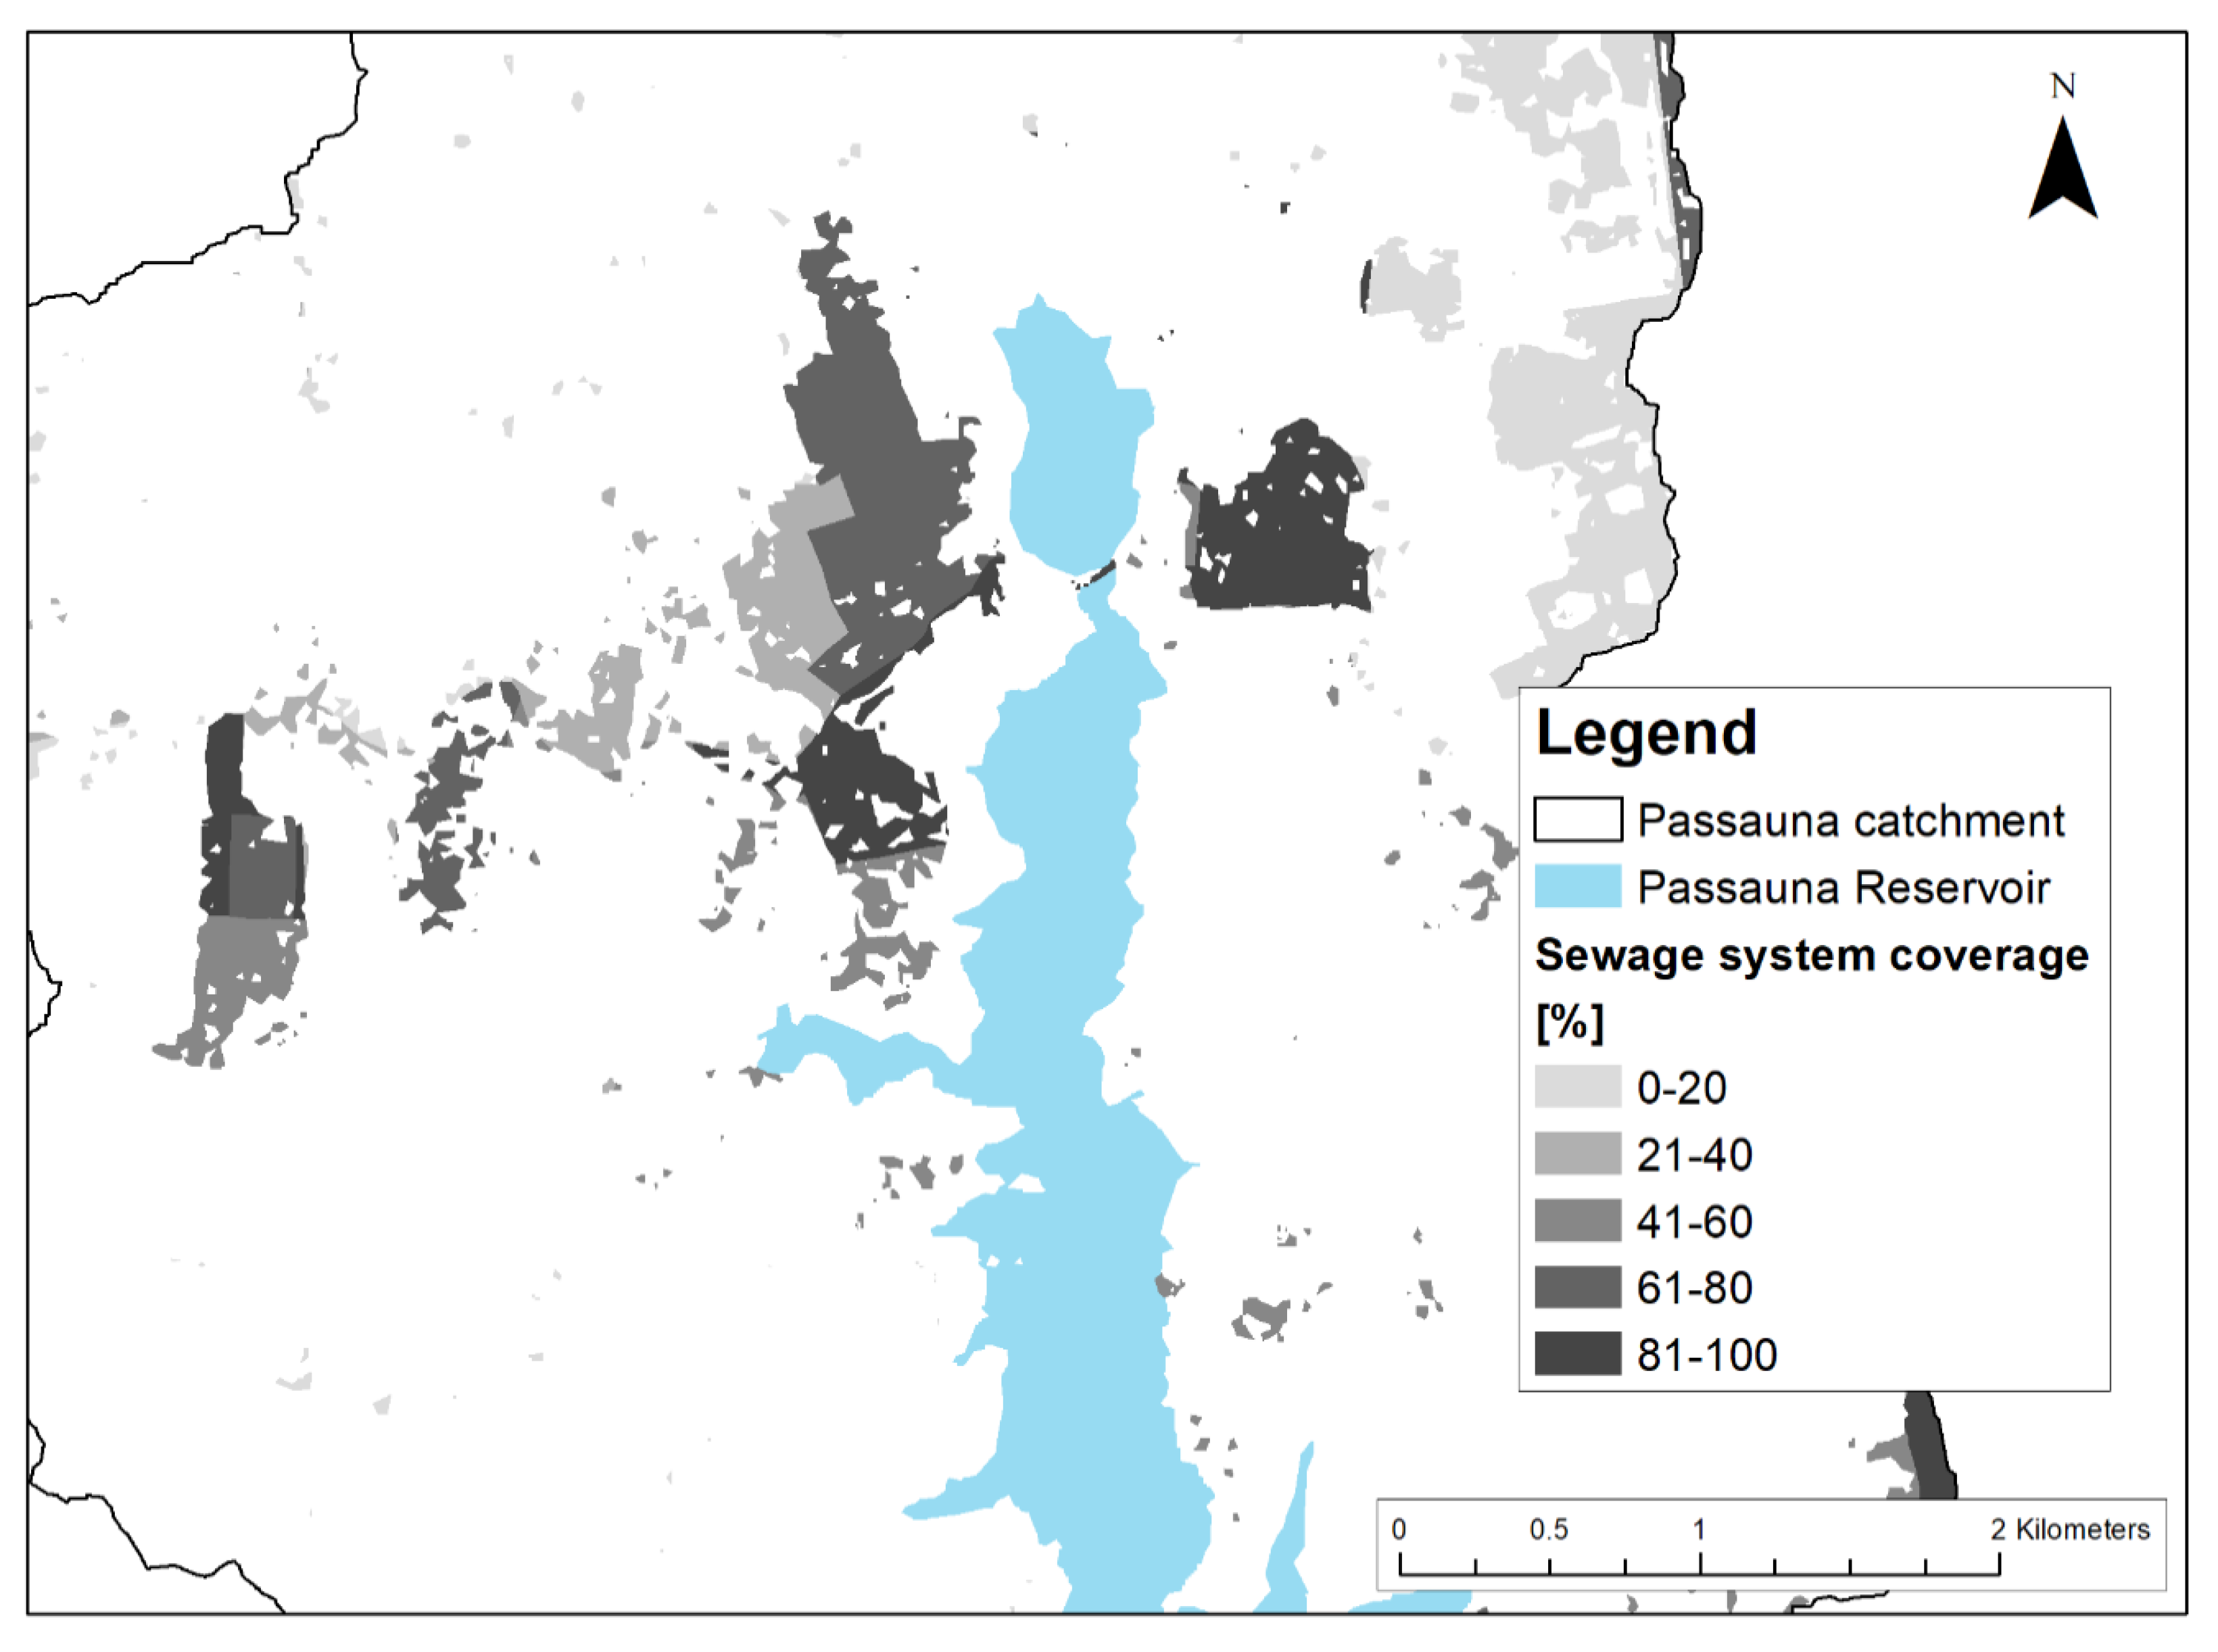
2.1. Passaúna Catchment

The Passaúna Reservoir catchment is located in the Paraná State, in southern Brazil (Figure 1). It comprises a drainage area of approximately 150 km², which creates an average yearly inflow of 2 (m/s) for the Passaúna Reservoir. The study area was divided into two sub-basins: the area up to where the long-term monitoring point was positioned, and the direct area around the reservoir. The Passaúna River composes 65.6% of the of the overall inflow into the reservoir, followed by the Ferraria river (6.9%), the Eneas river (3.6%), the own reservoir area (5.9%) and the runoff created from the small sub-basins surrounding the reservoir (18.0%) [10]. The Passaúna reservoir initiated operation in 1989 [11,12]. The total water-surface area is 895 ha and the reservoir has an actual volume of 69.3 hm3, considering the spillway level at 887.2 masl. The intake is located approximately 3 km upstream of the dam. The impoundment structure is a 1200 m long and 17 m high rock-fill dam with a clayey core [13]. According to a report of the Environmental Institute of Parana State (IAP), the reservoir is ranked as Class III or may be considered moderately degraded in terms of water quality [14].
In the last 35 years, the agricultural area, which initially occupied 50% of the basin, has undergone a decrease of approximately 10%. The forest area has also suffered a slight decrease from 44% in 1985 to 41% in 2019. The urban area, on the contrary, has been expanding continuously through the years, from 4.3% in 1985 to 11.7% in 2019. Other changes in land cover were recorded in pasture land and scrubland. The urban growth is mainly observable in the upstream areas of the catchment while the urban expansion pressures were lower in the areas surrounding the reservoir [15]. Regarding the sewage network in the expanding urban areas, most of the water collected is transferred to the Barigui river basin east of Passaúna catchment, where all of the wastewater treatment facilities are located (Figure 2 right) [16]. Despite a dense sewage network, a portion of the raw sewage still ends directly in the river [12].

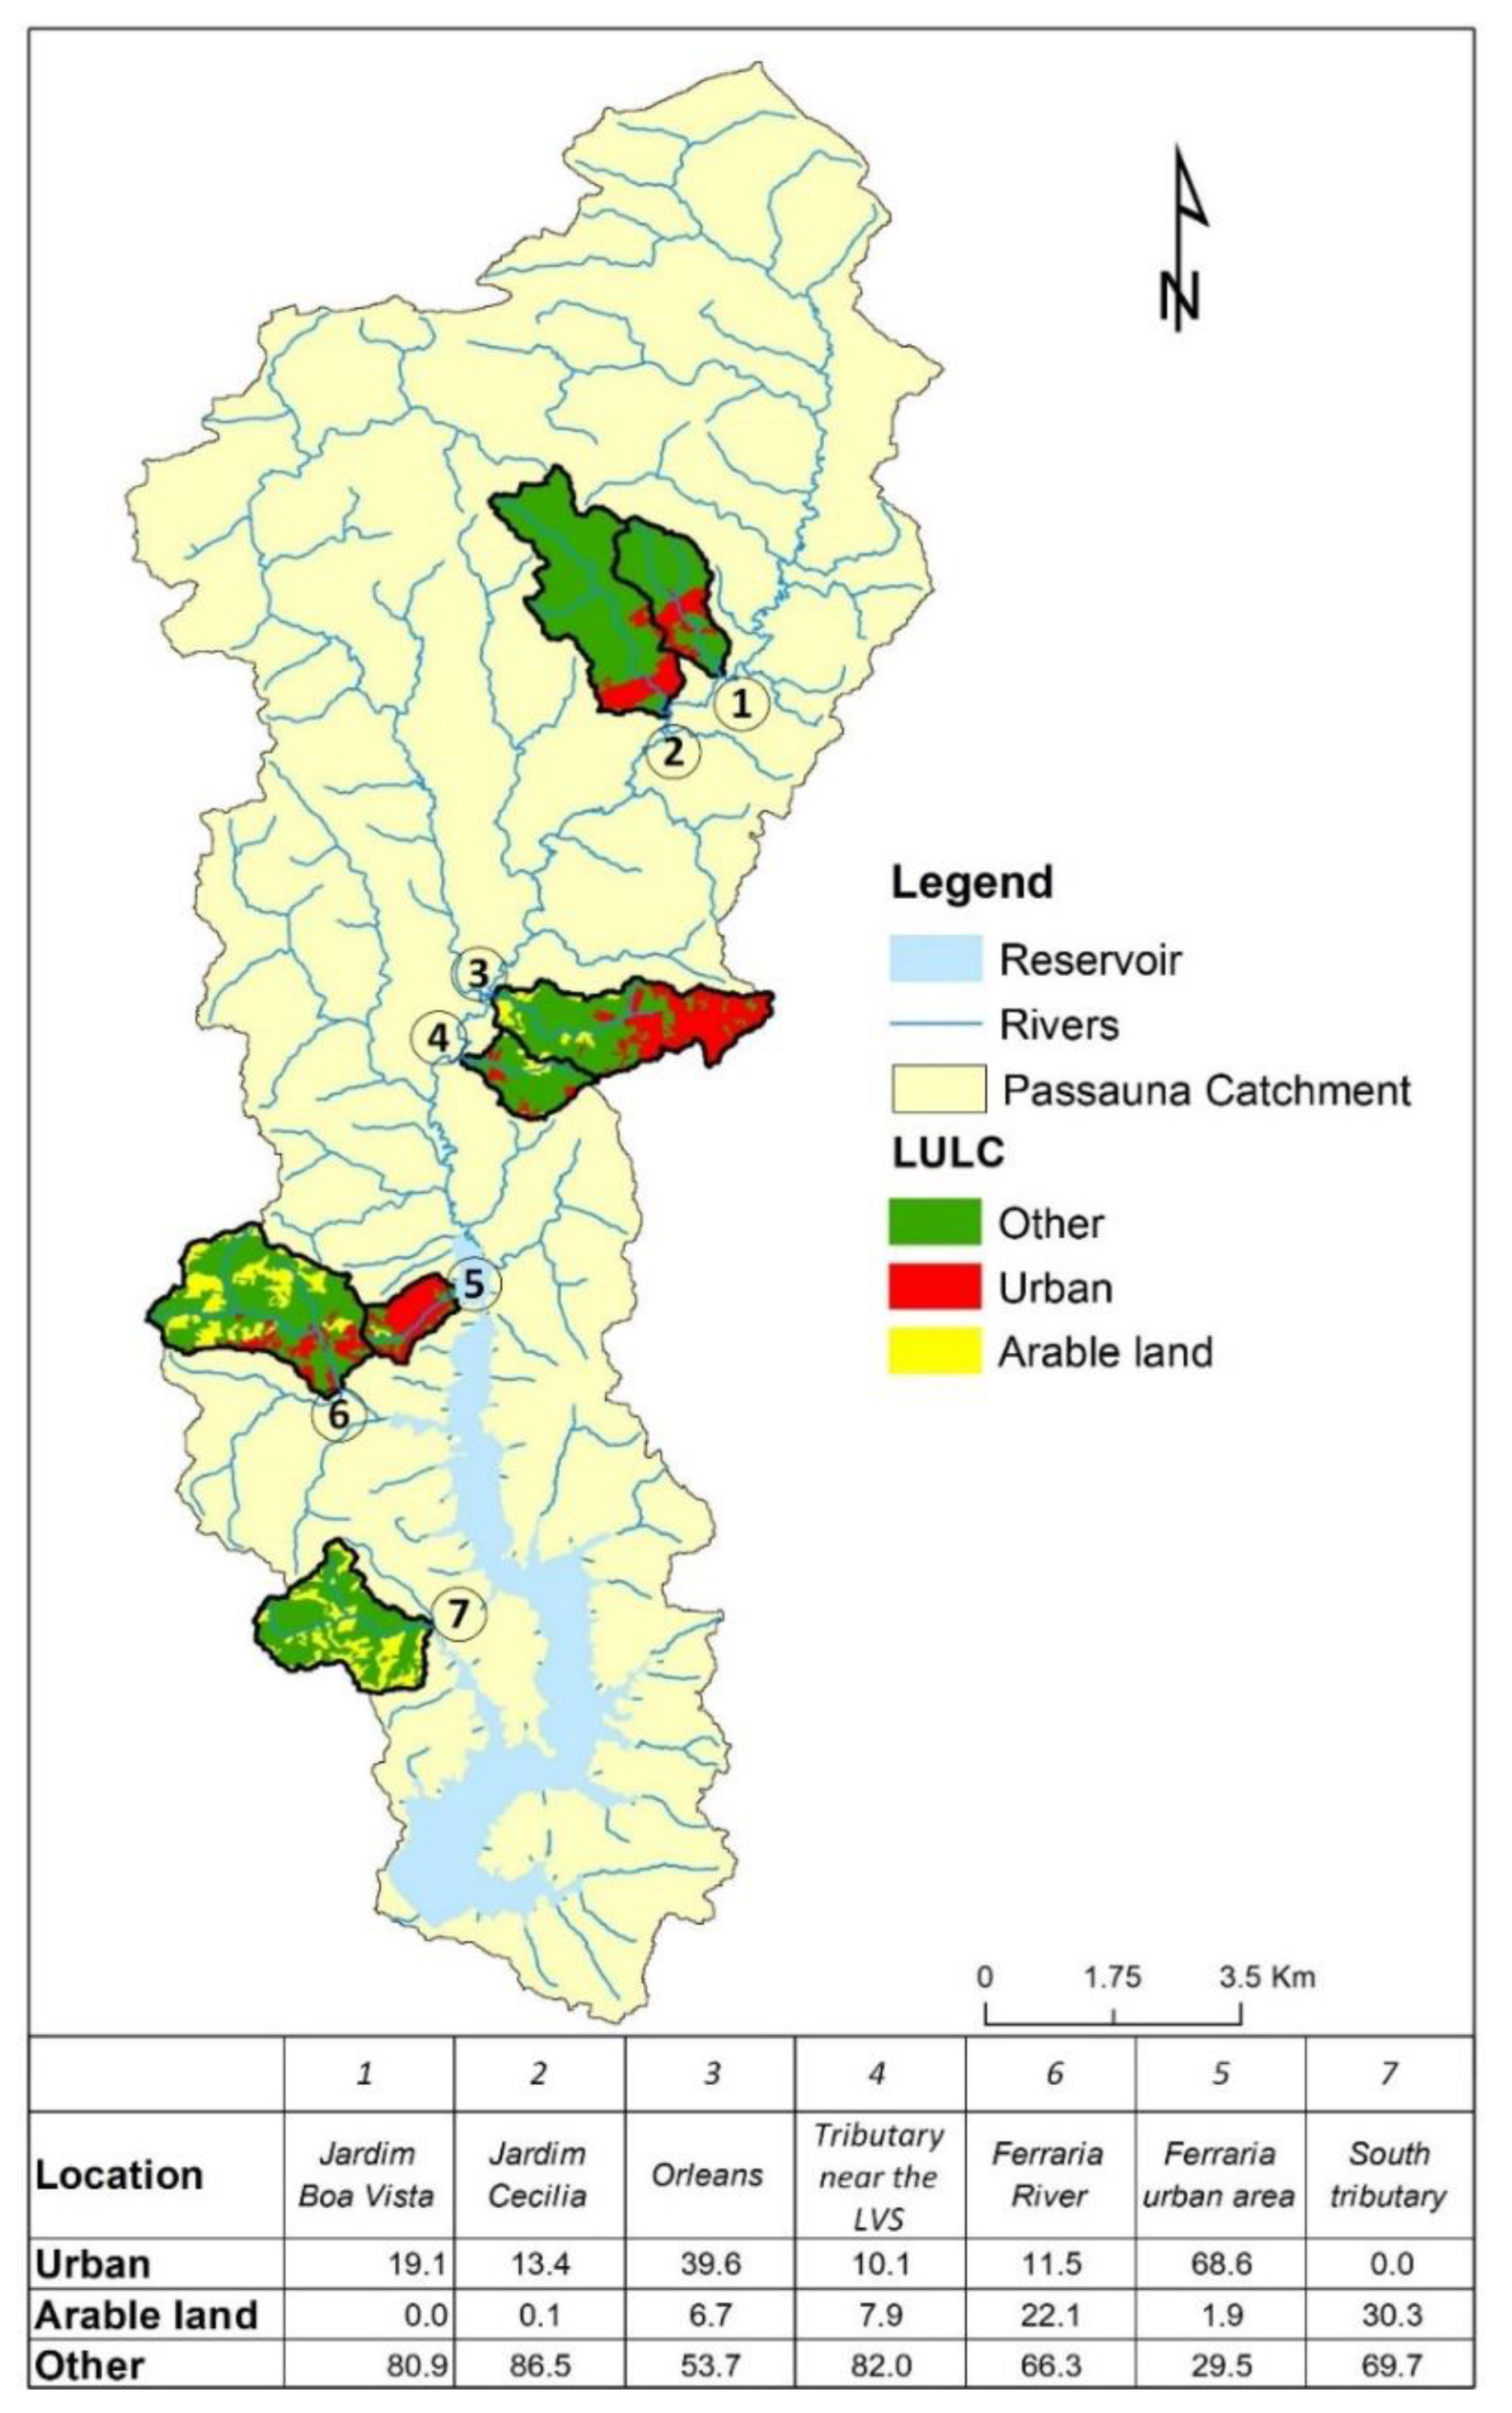
2.2. Sediment Sampling Campaign in the Passaúna Tributaries

It was assumed that high amounts of P input into the upstream reaches of a river system would be reflected in a higher contents in the sediment. In order to understand whether there is a considerable effect of the TP input from urban areas, two sediment-sampling campaigns were conducted in the river stretches in 2018 and 2019. In total, seven locations were sampled. The sampled tributaries were chosen based on the land use of the corresponding catchment. The northern and the middle part of the catchment included areas with significant urban cover while in the southern part of the catchment, more arable land is present (Figure 3). There was a large variety in the share of urban cover of the investigated sub-catchments, from areas with no urban land use to areas with a coverage of almost 70% from urban settlements.
The sediment in the rivers was sampled via a Petersen grab sampler, and representative locations for the river were chosen. Initially, the upper sediment layer, representing the short-term depositions, was sampled. The upper layer corresponds to 0–3 cm below the sediment-water interface. Secondly, a sediment sample from the deeper layers of the sediment (3–15 cm) was collected, with the aim of sampling the older depositions of the sediment in the examined spot. The material was transported to the laboratory where, initially, the particle size distribution and afterwards, the TP concentration were determined for the smallest fraction of the material (<63 µm) after the DIN 38405-D11 method/norm.

2.3. Monitoring and Modeling Approach

The estimation approach followed in this study is based on the per capita TP emission rate of the inhabitants in the Passaúna catchment (Figure 4). According to Figure 2, three groups of inhabitants are present in catchment:
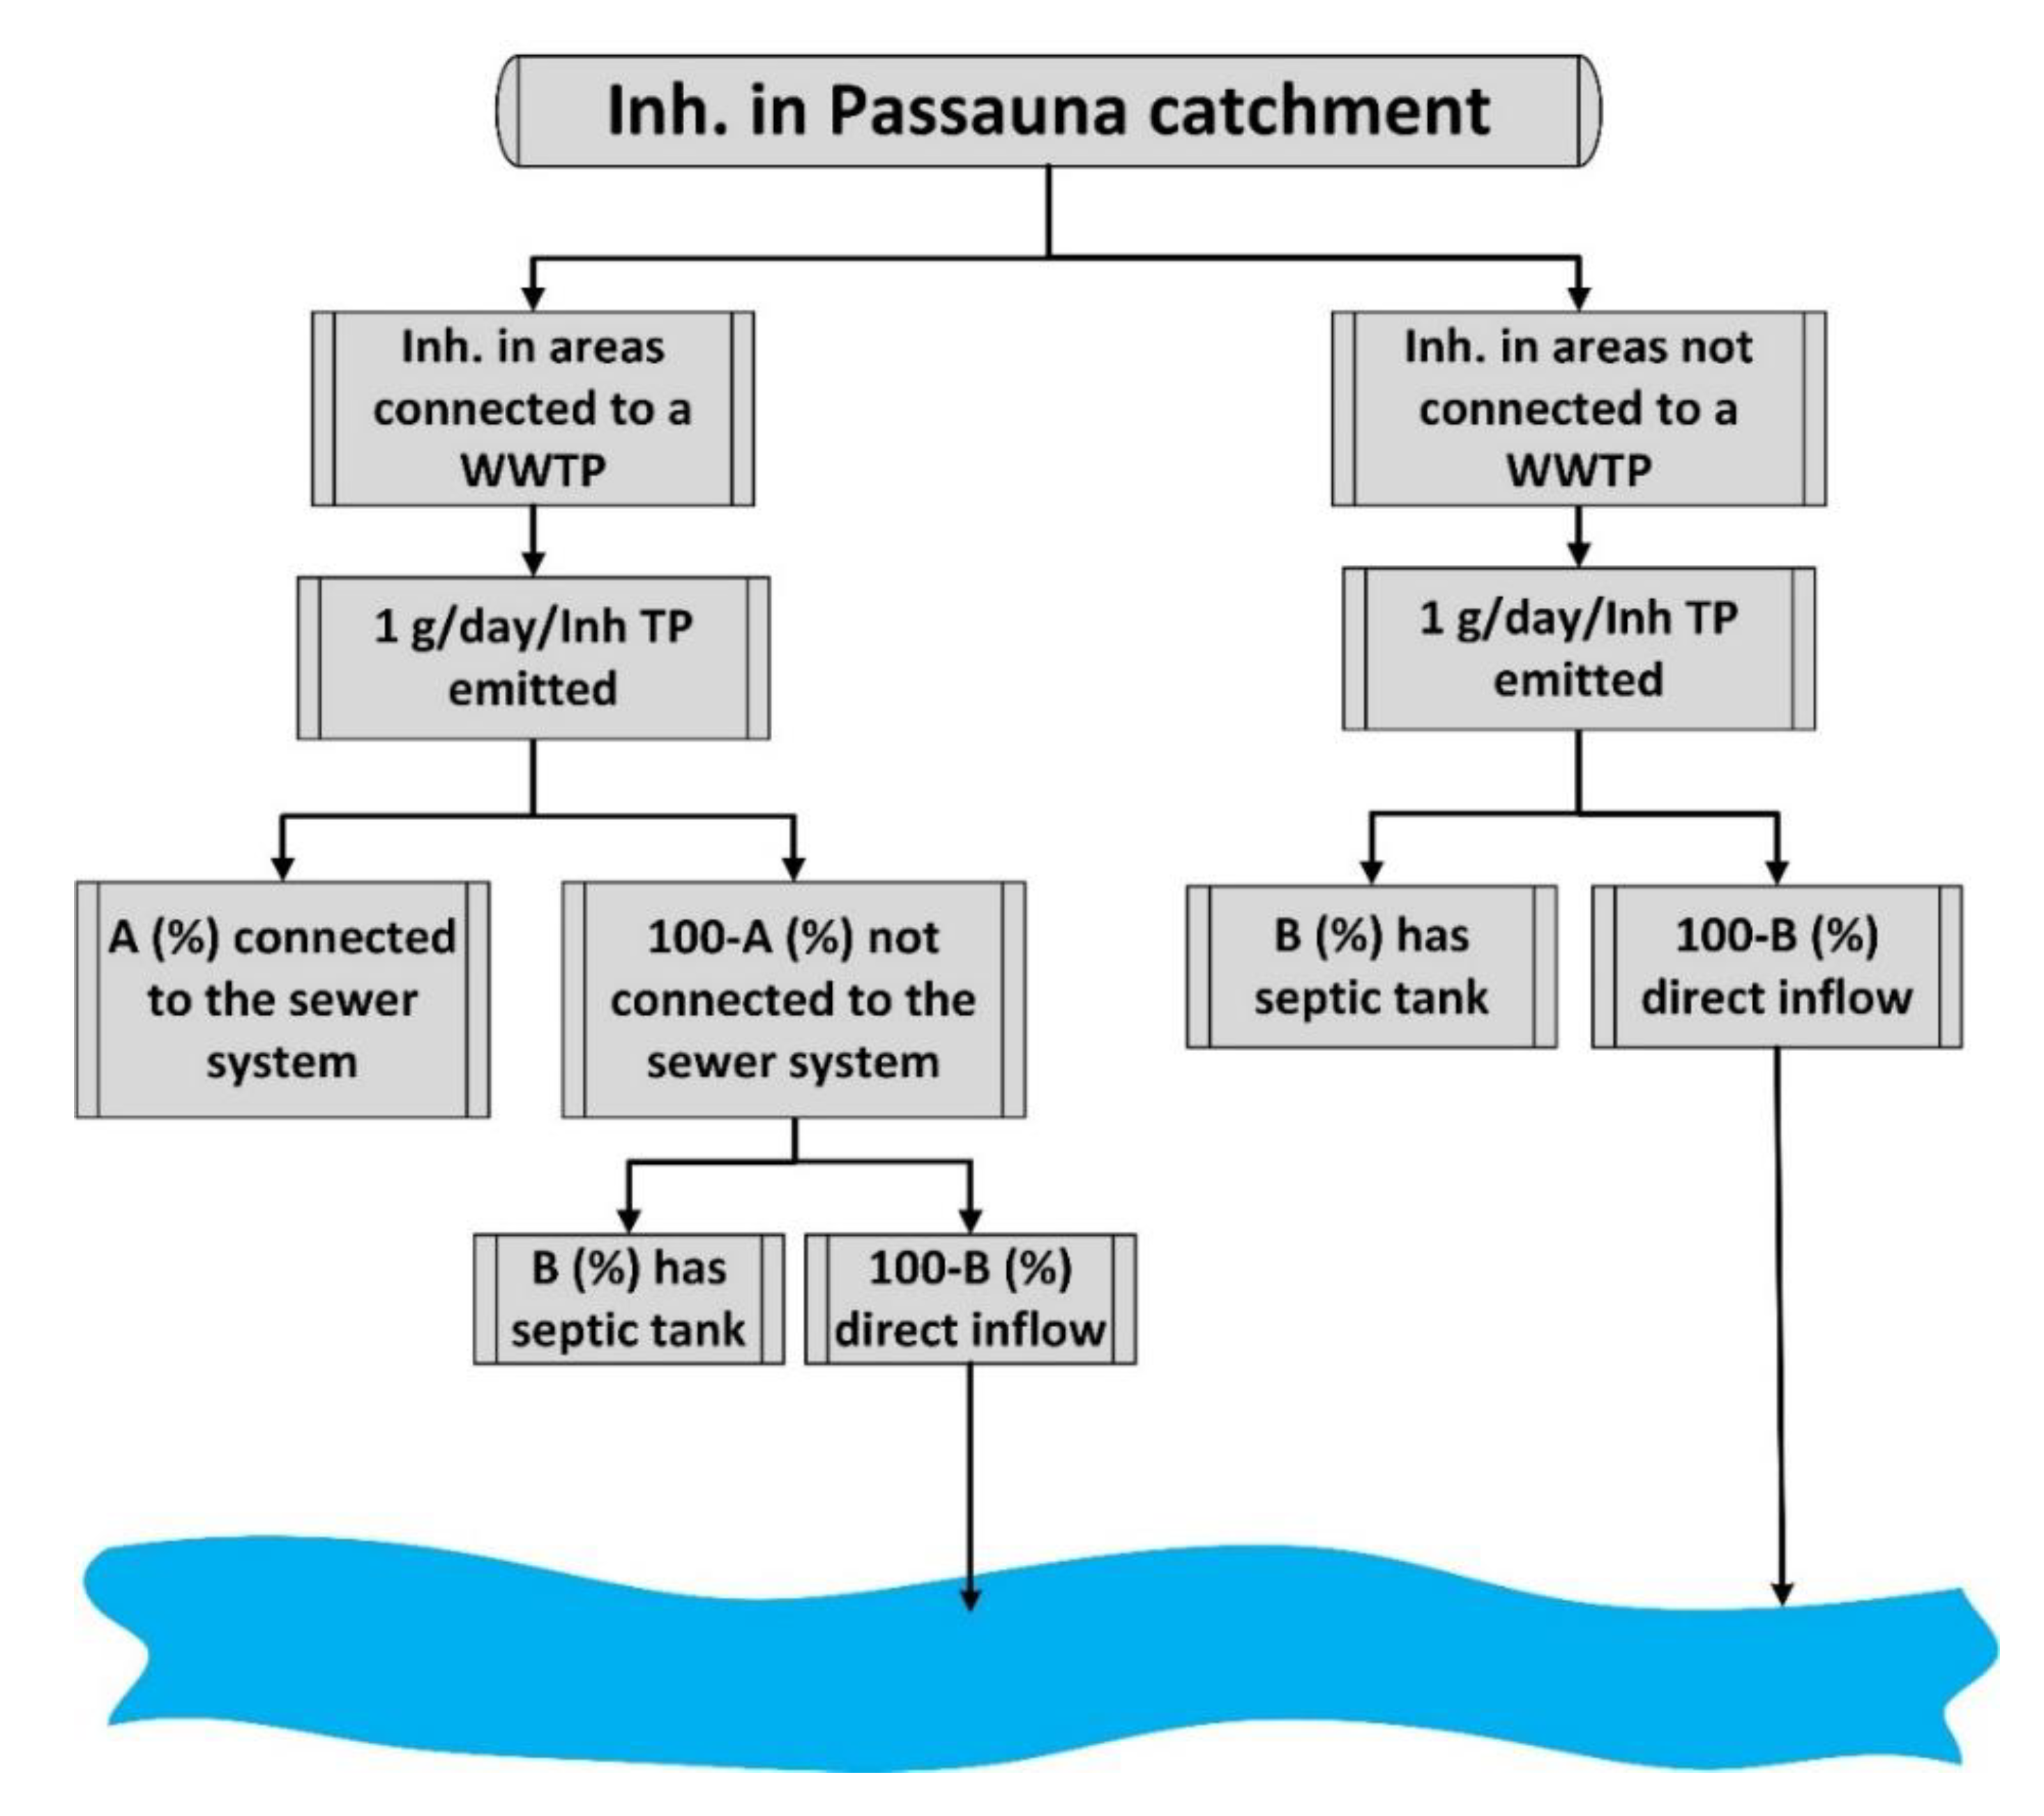
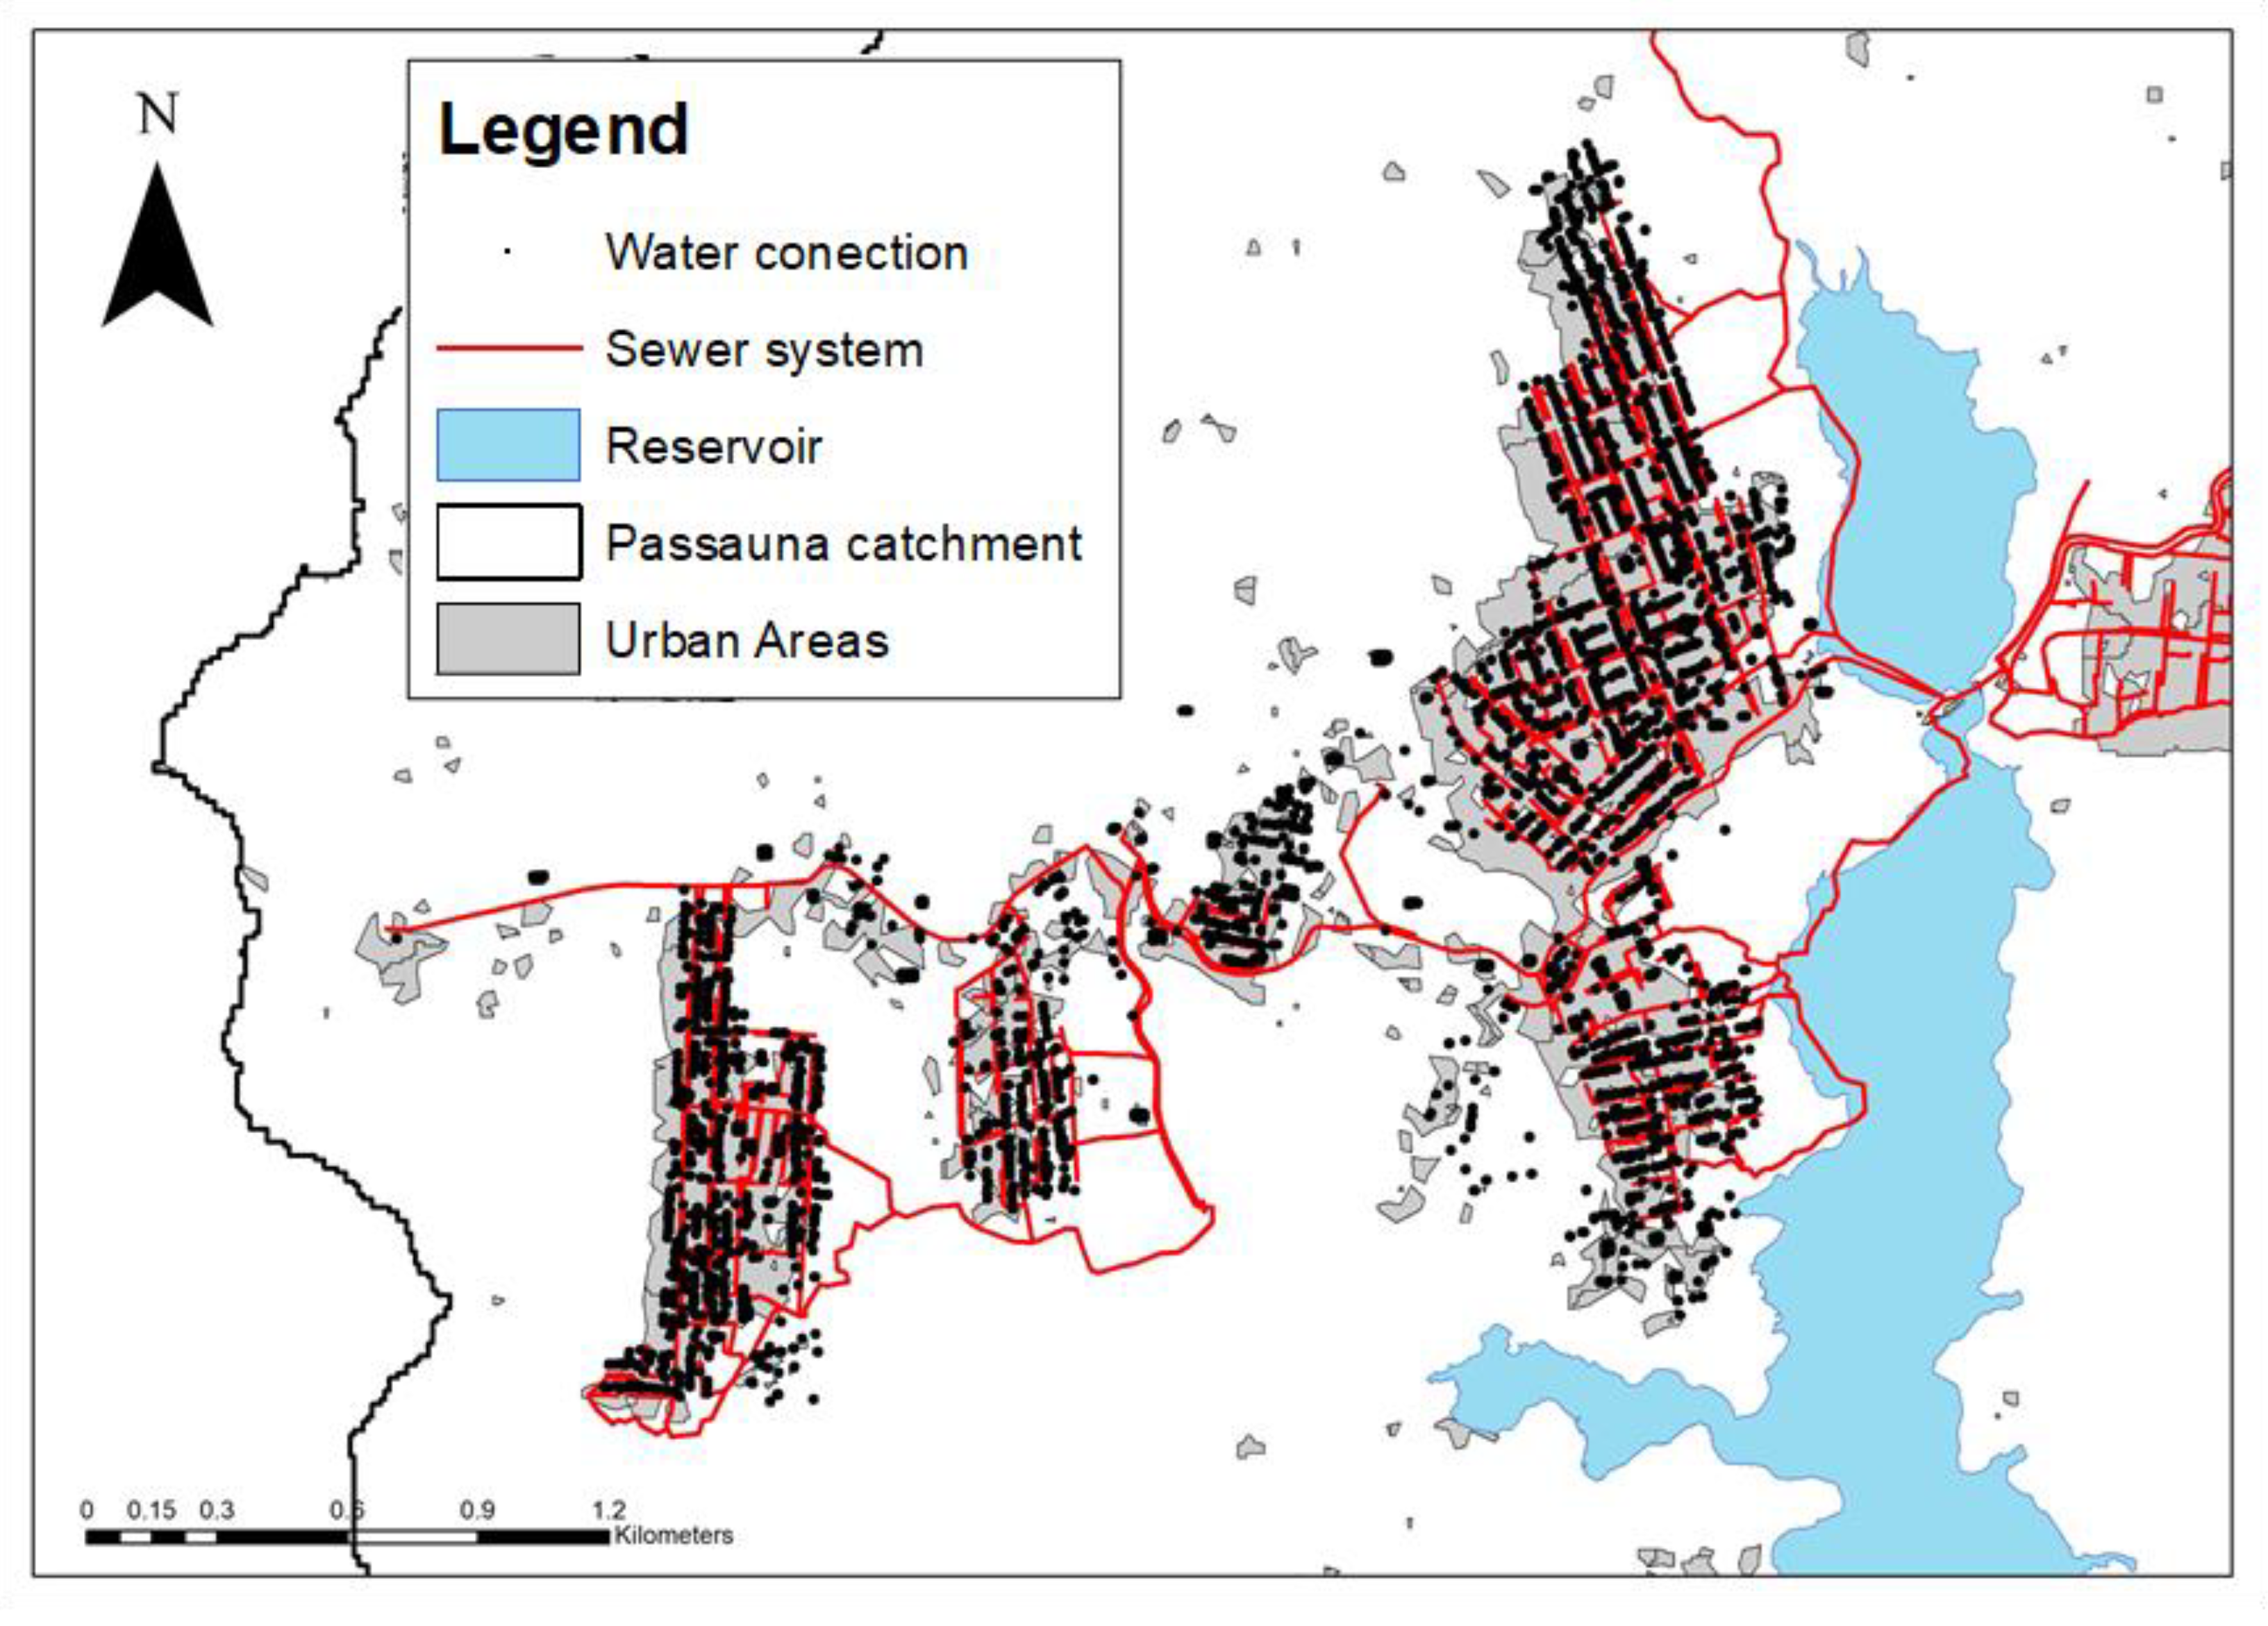
  • Inhabitants living in an area with an existing sewer system that is connected to a wastewater treatment plant (WWTP);
  • Inhabitants living in areas with an existing sewer system but not connected to a wastewater treatment plant (inhabitants discharging directly into the tributaries or a decentralized sewage system);
  • Inhabitants living in areas with no sewer system (inhabitants directly discharging in the tributaries or a decentralized sewage treatment plant).
The second and the third group of inhabitants are merged into one group as, in both cases, the overall untreated domestic water from all inhabitants ends either in the reservoir tributaries or in a decentralized sewage treatment system. Based on the maps in Figure 2 and with the use of ArcMap 10.6, the population density in each of the urban areas was calculated and was divided into the two previously mentioned groups (connected or not connected to a WWTP). The values presented in [18] were used for the daily TP load per inhabitant. The study in [18] indicates that the per-capita load in developing countries fluctuates between 0.7–2.5 g/(inh. day), with a typical value of 1 g/(inh. day). For this study, we used the typical value of 1 g/(inh. day), as suggested by [18].
The number of inhabitants from each of the subgroups needs to be multiplied with the per capita daily TP load in order to assess the amount of TP that ends in the river, septic tanks, or wastewater treatment plant. The initial challenge of this method was to identify the areas with a functioning sewer system and wastewater treatment plant the share of population (Coefficient A in Figure 4) not connected to the sewer system. This specific subcategory includes either households using decentralized wastewater treatment (mainly septic tanks), or informal settlements that discharge their untreated water directly into the river. The second challenge of this method was to differentiate between these two subgroups (decentralized system or direct river discharge) and to quantify the share of each of them (Coefficient B in Figure 4) in areas connected to a wastewater treatment plant and areas not connected to a wastewater treatment plant.

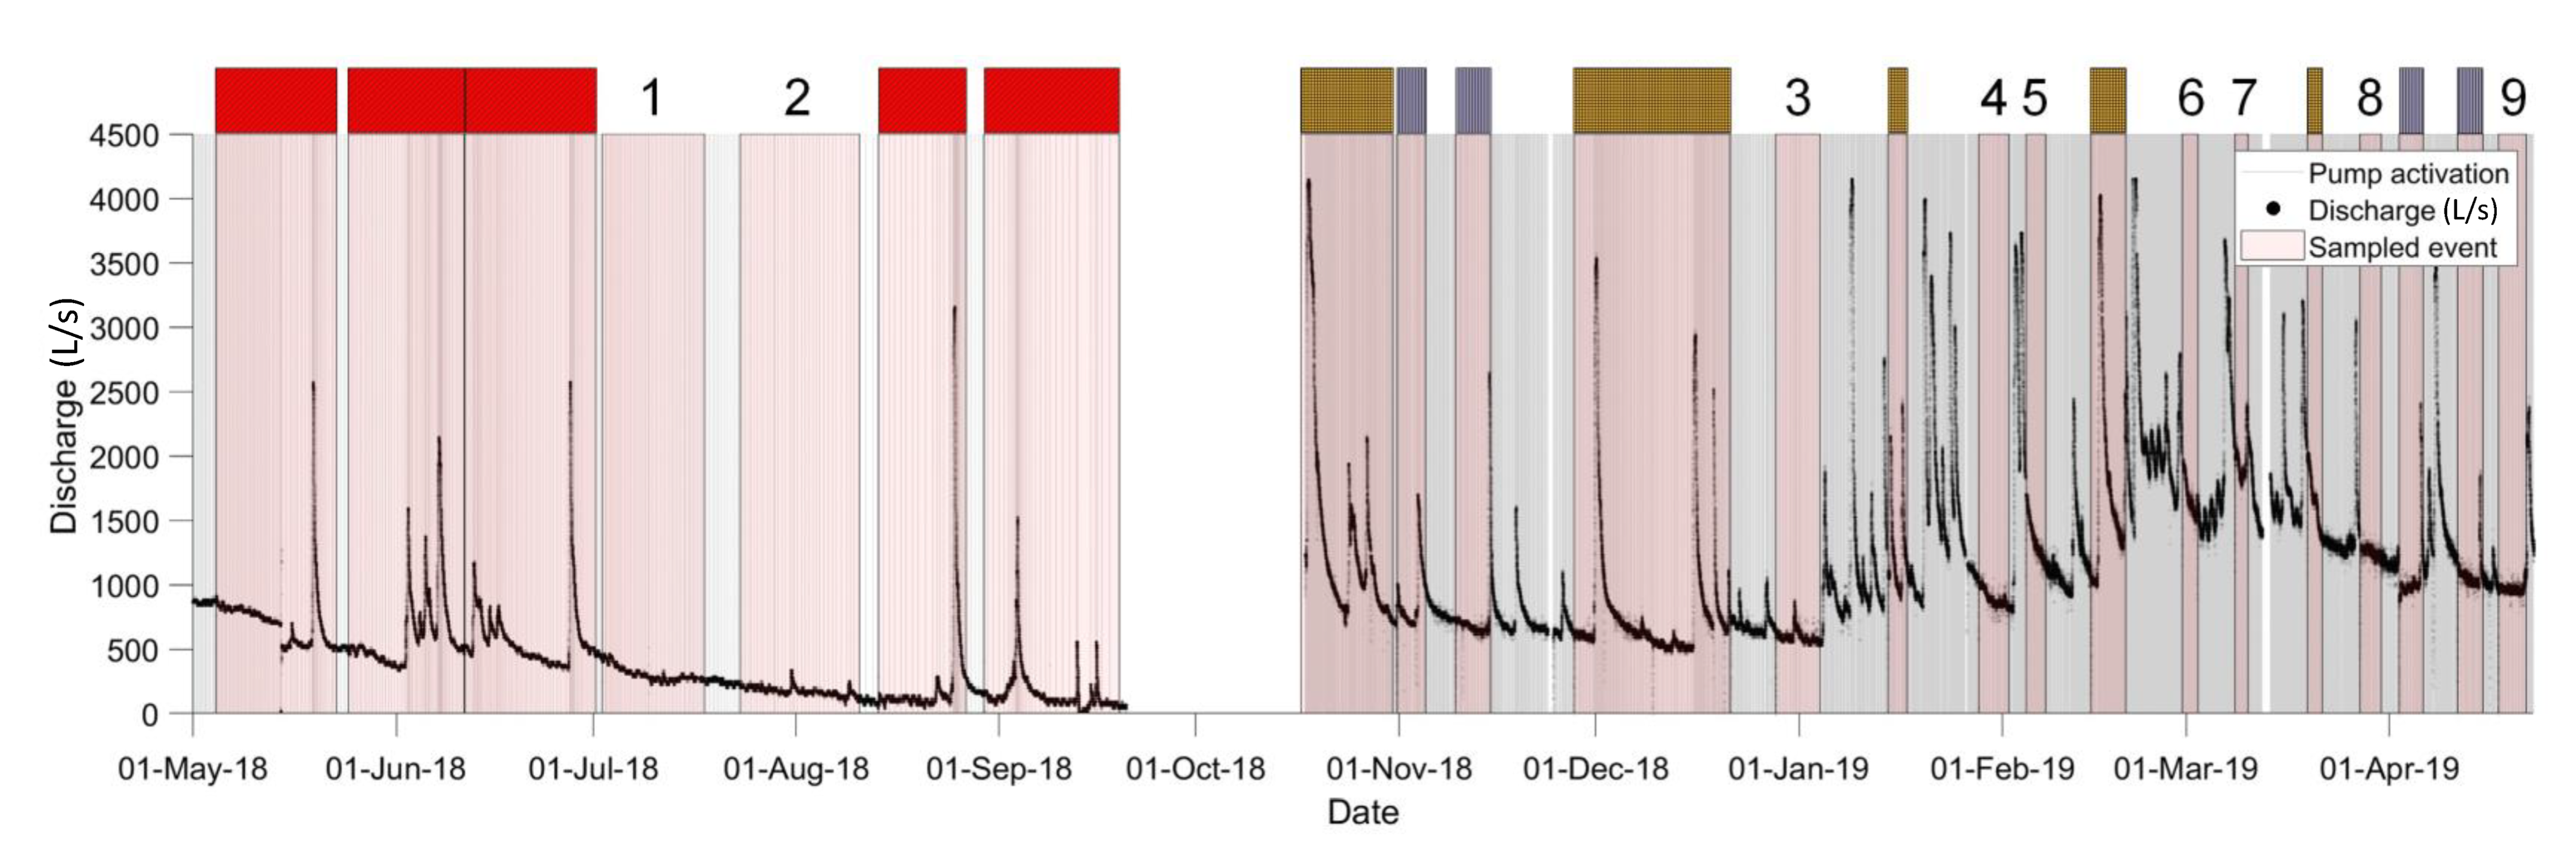
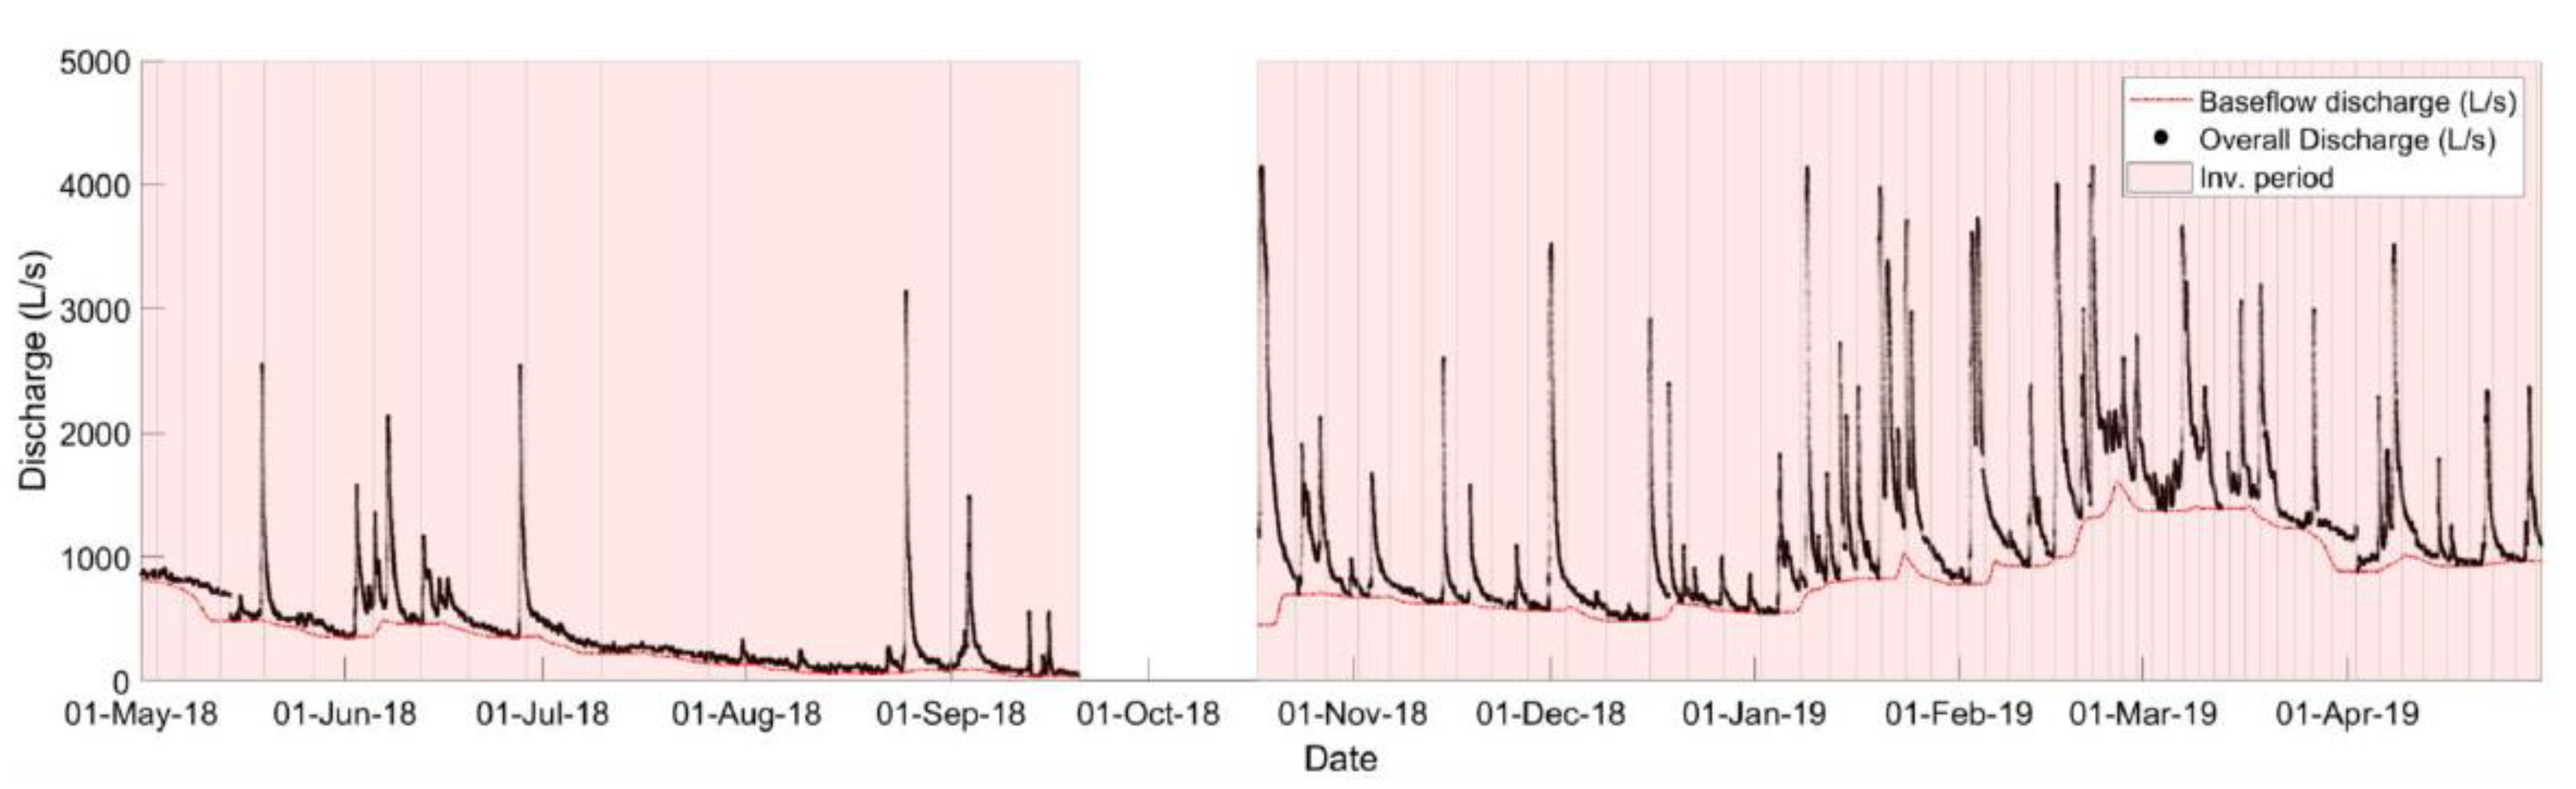
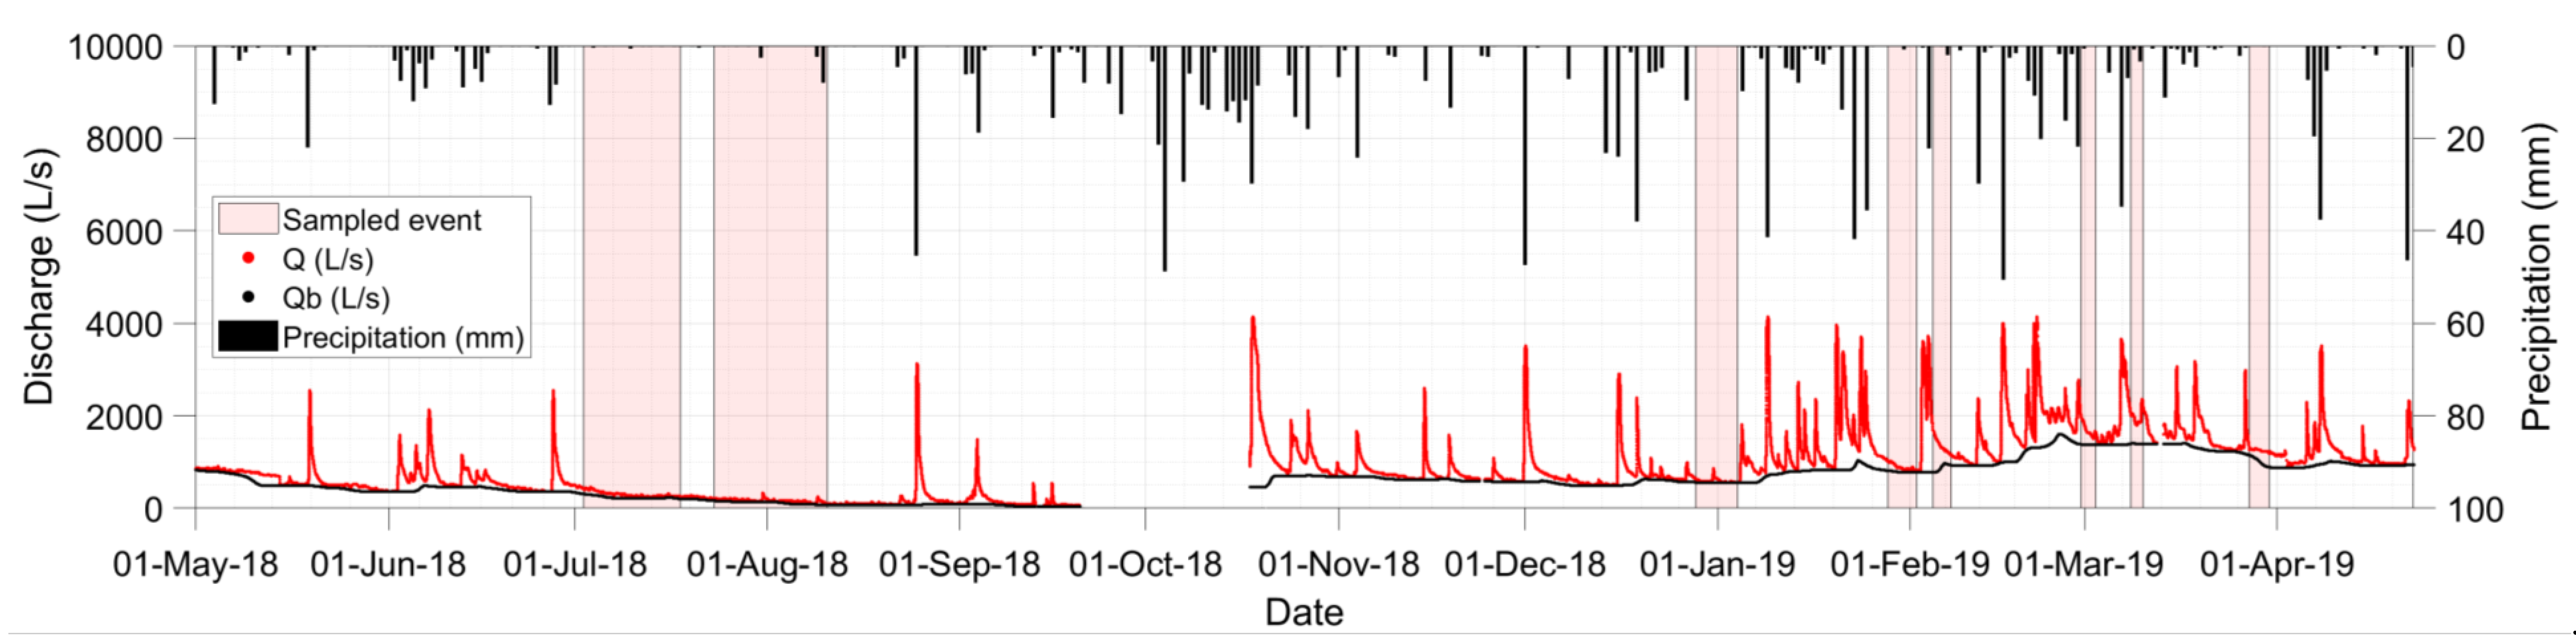
2.3.1. Estimation of Riverine TP Load

In order to assess the overall TP from the catchment, a Large Volume Sampler (LVS) was installed upstream of the reservoir (location shown in Figure 5). The drainage basin of the point where the LVS was installed is dominated by forest and arable land, and includes a significant share of urban areas. The main advantage of an LVS is the measurement continuity. The system can deliver the substance concentration for the entire duration of its operation. It can operate for a long time period due to its sampling volume, which minimizes the sampling efforts.
The LVS is a flow-proportional automatic sampler that collects mixed samples of approximately 1000 L from the river. It consists of a stainless steel tank of 1000 L, a gauging station, a pump, a fill-height sensor, a three-way valve, and a control unit, which operates the automatic sampler [19,20]. Initially, the system calculates the discharge of the river. The discharge is calculated by applying a polynomial formula derived beforehand to the gauging station data. Based on the discharge, the system calculates a cumulative volume that passes through the river cross-section at the gauging station. After a predefined constant cumulative volume, which is set in the control unit, the control unit activates the pump for a certain period of time (in the range of seconds). Before taking the sample, the pumped water is used to flush the pipe and remove any water that might have been stored in the pipe from the previous sampling. Afterwards, with the assistance of a three-way valve, the river water is directed into the tank. The duration of the pump activation and the cumulative volume used to activate the pump also determine the duration of the large-volume sampling event. In this study, the two values were changed in order to ‘catch’ not only the baseflow but also single events of the stormflow. After reaching a full tank, the fill-height sensor signals the control unit to stop activating the pump [21,22,23].
The mixed samples are left to settle for 2–5 days and afterwards, the sample is collected. Initially, water samples are collected from the supernatant water and then the overall settled material is collected. Samples of both the supernatant water and settled material were used for assessing the TP concentrations in the sample and subsequently the TP input in the river.
The system was operative for 15 months. However, only the data from 1 May 2018 to 20 April 2019 were used. During this period, 23 mixed samples were collected, ranging from two to 24 days of sampling per sampling event (Figure 6). Despite the large number of events, only a few samples could be used for the calculation of the annual TP input from the urban areas. Due to problems with the pump, five samples had to be excluded (samples in orange color and quadratic hatch in Figure 6). Moreover, as the study is focused on the TP input from urban areas, the samples which had significant storm-flow discharges were excluded from the calculation. The TP in the base flow mainly originates from point sources and diffuse urban sources (untreated sewage). In the case of stormflow, the TP from the baseflow is mixed with the TP from diffuse sources in the catchment (mostly agriculture), making it impossible to distinguish between urban and nonurban input and thus, to quantify the input from the urban areas. For this reason, the samples characterized by a significant stormflow were excluded. The discharge data were initially separated into baseflow and stormflow and the ratio between mean stormflow and mean discharge was calculated for each sampling event. The sampling events with a high ratio (greater than 0.08) were excluded automatically (samples in red color and diagonal hatch in Figure 6). Finally, four other samples were removed visually, as the ratio-rule set initially could not detect the significant discharge peaks during sampling (samples in purple color and vertical hatch in Figure 6).
At the end, only nine samples could be used for assessing the TP input. A regression analysis curve was derived between the mean baseflow of the sampling period and the particle concentration in the tank. The resulting regression represented the sediment rating curve for baseflow conditions. A second regression curve was derived between the mean baseflow discharge and the particle-bound P concentration. A final rating curve between the mean baseflow discharge and dissolved P concentration in the supernatant water was created in order to calculate the dissolved flux. Here, it must be mentioned that the term particle-bound phosphorus refers to the TP concentration in the settled material, while the dissolved phosphorus concentration refers to the TP concentration in the supernatant water. The term dissolved phosphorus is usually used for orthophosphate, but as the particle concentration in the supernatant water was low, it was assumed that the entire TP concentration represents the dissolved fraction.
To assess the annual TP input in kg, the discharge was first divided into baseflow and stormflow using the HydRun Matlab algorithm (baseflow is considered the dry-weather discharge while stormflow is considered the wet-weather discharge) [24]. HydRun uses a digital filter to separate the hydrological components of a time series. Afterwards, the time period of a year for which the sampling station was active, was divided into 64 smaller sub-periods (Figure 7). Each sub-period was defined as the time in which a cumulative volume of 280,000 m3 of baseflow passed through the river cross-section, where the sampling station was located. The value of 280,000 m3 was chosen, as it represents the mean cumulative flow value of the nine existing samples used in the regression. For each of the sub-periods derived from the cumulative volume criteria (Inv. Periods in Figure 7), a mean baseflow value was calculated. For each of the sub-periods, the TP input in dissolved and particle bound form was calculated as will be explained in the sections below.

2.3.2. Assessment of Coefficient A

In order to quantify the share of inhabitants connected to the sewer system (Coefficient A), data for the Ferraria region was delivered by the sanitation company SANEPAR. The used data included the water consumption for each water connection in the Ferraria settlement (Figure 8), and information as to whether or not a sewer connection was coupled to the water connection. Coefficient A was calculated by dividing the number of sewer connections by the number of drinking-water connections for the entire region. The urban settlements in the Passaúna catchment can be considered similar; therefore, it was assumed that the findings derived in the Ferraria region were representative and could be extrapolated to the other urban settlements in the Passaúna catchment.

2.3.3. Assessment of Coefficient B

Ideally, the share of households or inhabitants that use a decentralized sewer system would have been defined by field surveys where questionnaires about the sanitation facilities and sewage treatment are prepared and distributed to the population in the regions of interests. Due to a lack of resources, such action was not possible. Therefore, in this case, a bottom-up approach was followed. The annual TP load derived by the LVS data was used to calibrate the model and to quantify Coefficient B. Several model runs (with different Coefficient B values) were performed for the area of the LVS catchment until the modeled value matched the measured value. The calculated Coefficient B was used to quantify the TP input from the overall Passaúna catchment.

3. Results and Discussion

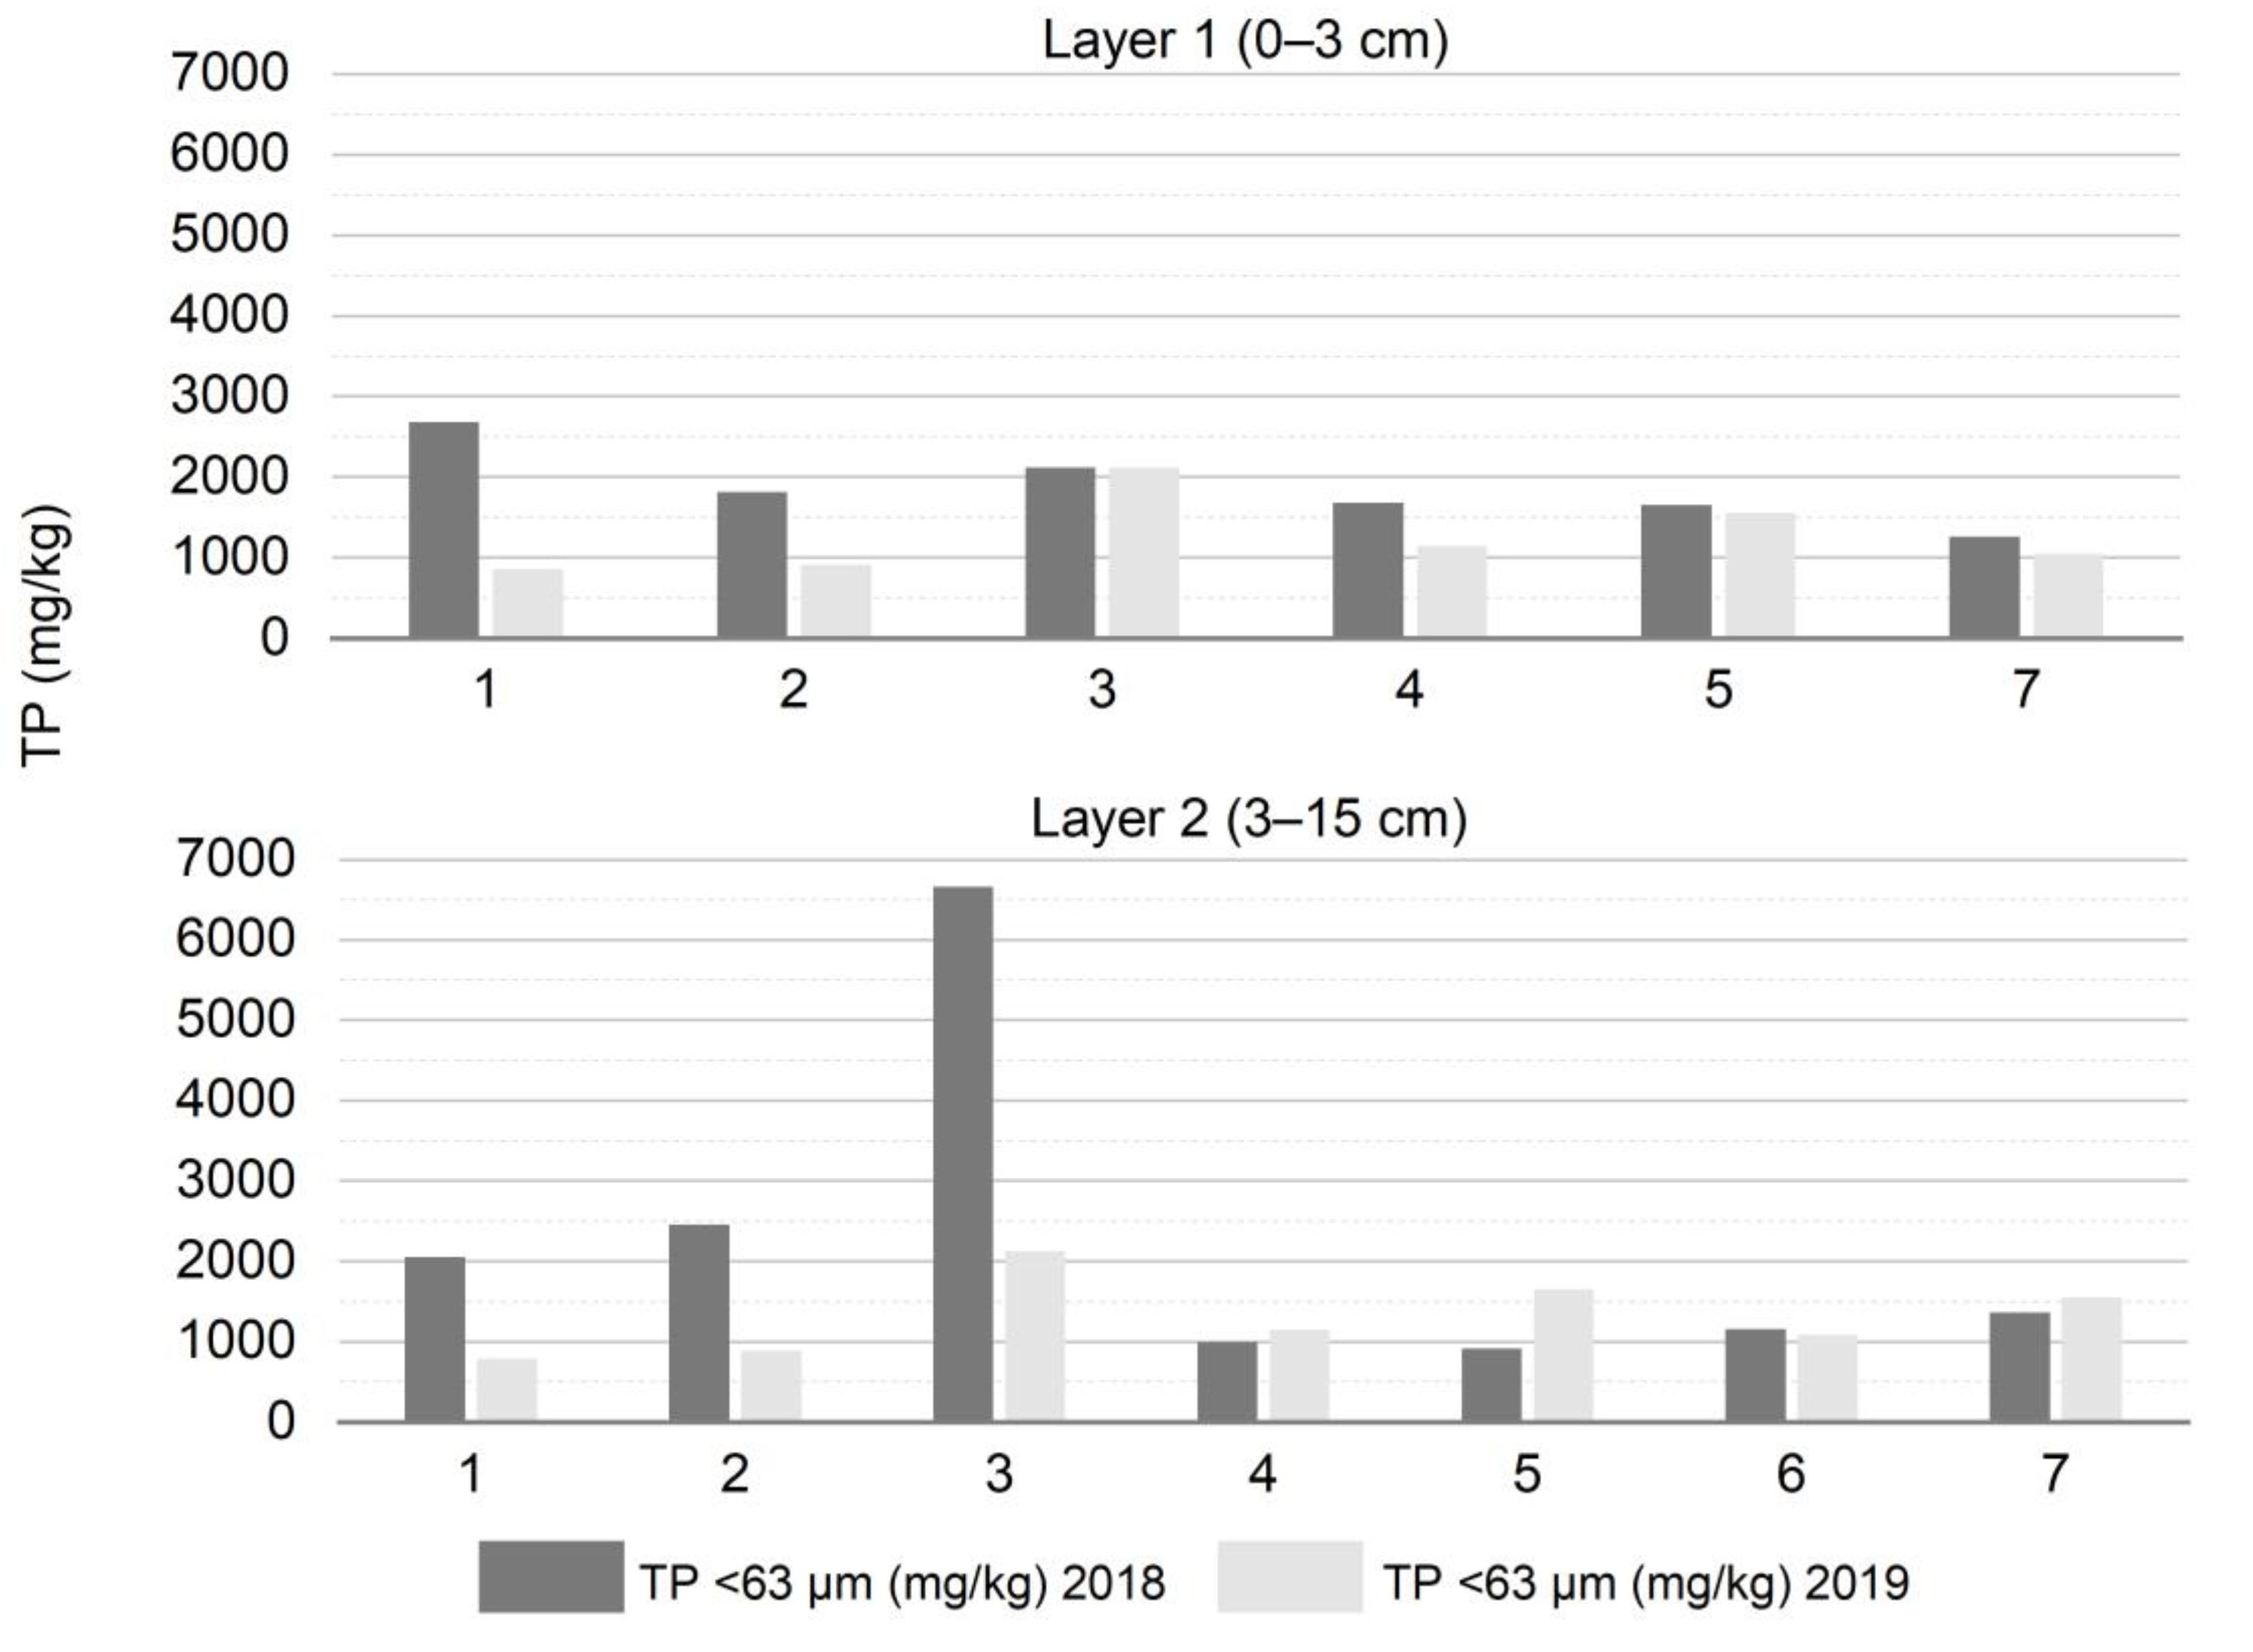
3.1. TP Concentration in the River Sediment

According to Figure 9, a significant TP concentration in the upper layer of the river sediment was observed in 2018, especially at locations 1, 2, and 3, which correspond to the areas of Jardim Boa Vista, Jardim Cecília, and Orleans (three areas with a significant increase in urban land cover, as shown in Figure 3). When comparing the TP concentration of the silt and clay fraction from the second layer of the sediment (the second layer performed better in terms of correlations) to the share of urban area, the Pearson’s correlation coefficient is 0.25. When relating the TP concentration of the silt clay fraction to the urban area (in m2), there is a correlation coefficient of 0.86, indicating a connection between the TP concentration and the urban area coverage. The highest TP concentrations were observed in the tributary passing through the Jardim Boa Vista, reaching a concentration of up to 2500 mg/kg. Location 3 also presented high TP concentrations in the sediment while locations 2, 4, and 5 showed lower values compared to the previously mentioned locations. The lowest TP concentration in the upper sediment layer was observed at location 7, in a tributary whose catchment is covered mainly by arable land. In the first two locations (streams passing through Jardim Cecília and Jardim Boa Vista), a significant reduction in the TP concentration was observed from 2018 to 2019. The TP decrease can be attributed to the improvements of the sewer system in the above-mentioned semi-formal urban areas. In the other sampling locations, no substantial change in the TP content of sediment was observed between the two sampling events, indicating constant intra-annual conditions. The reduction in the sediment TP content at locations 1 and 2 was also observed in the second layer of the sediment (Figure 9). In 2019, an increase in TP content in the second sediment layer was also observed in the creek passing through the Ferraria urban area (5 in Figure 9). However, the most obvious change in TP content was observed in the sediment arriving from the creek passing through the Orleans urban area (3 in Figure 9). In 2018, a TP concentration of 6700 mg/kg of was measured. In 2019, the value decreased to almost 2000 mg/kg (although remaining the highest value from all the sampled locations).

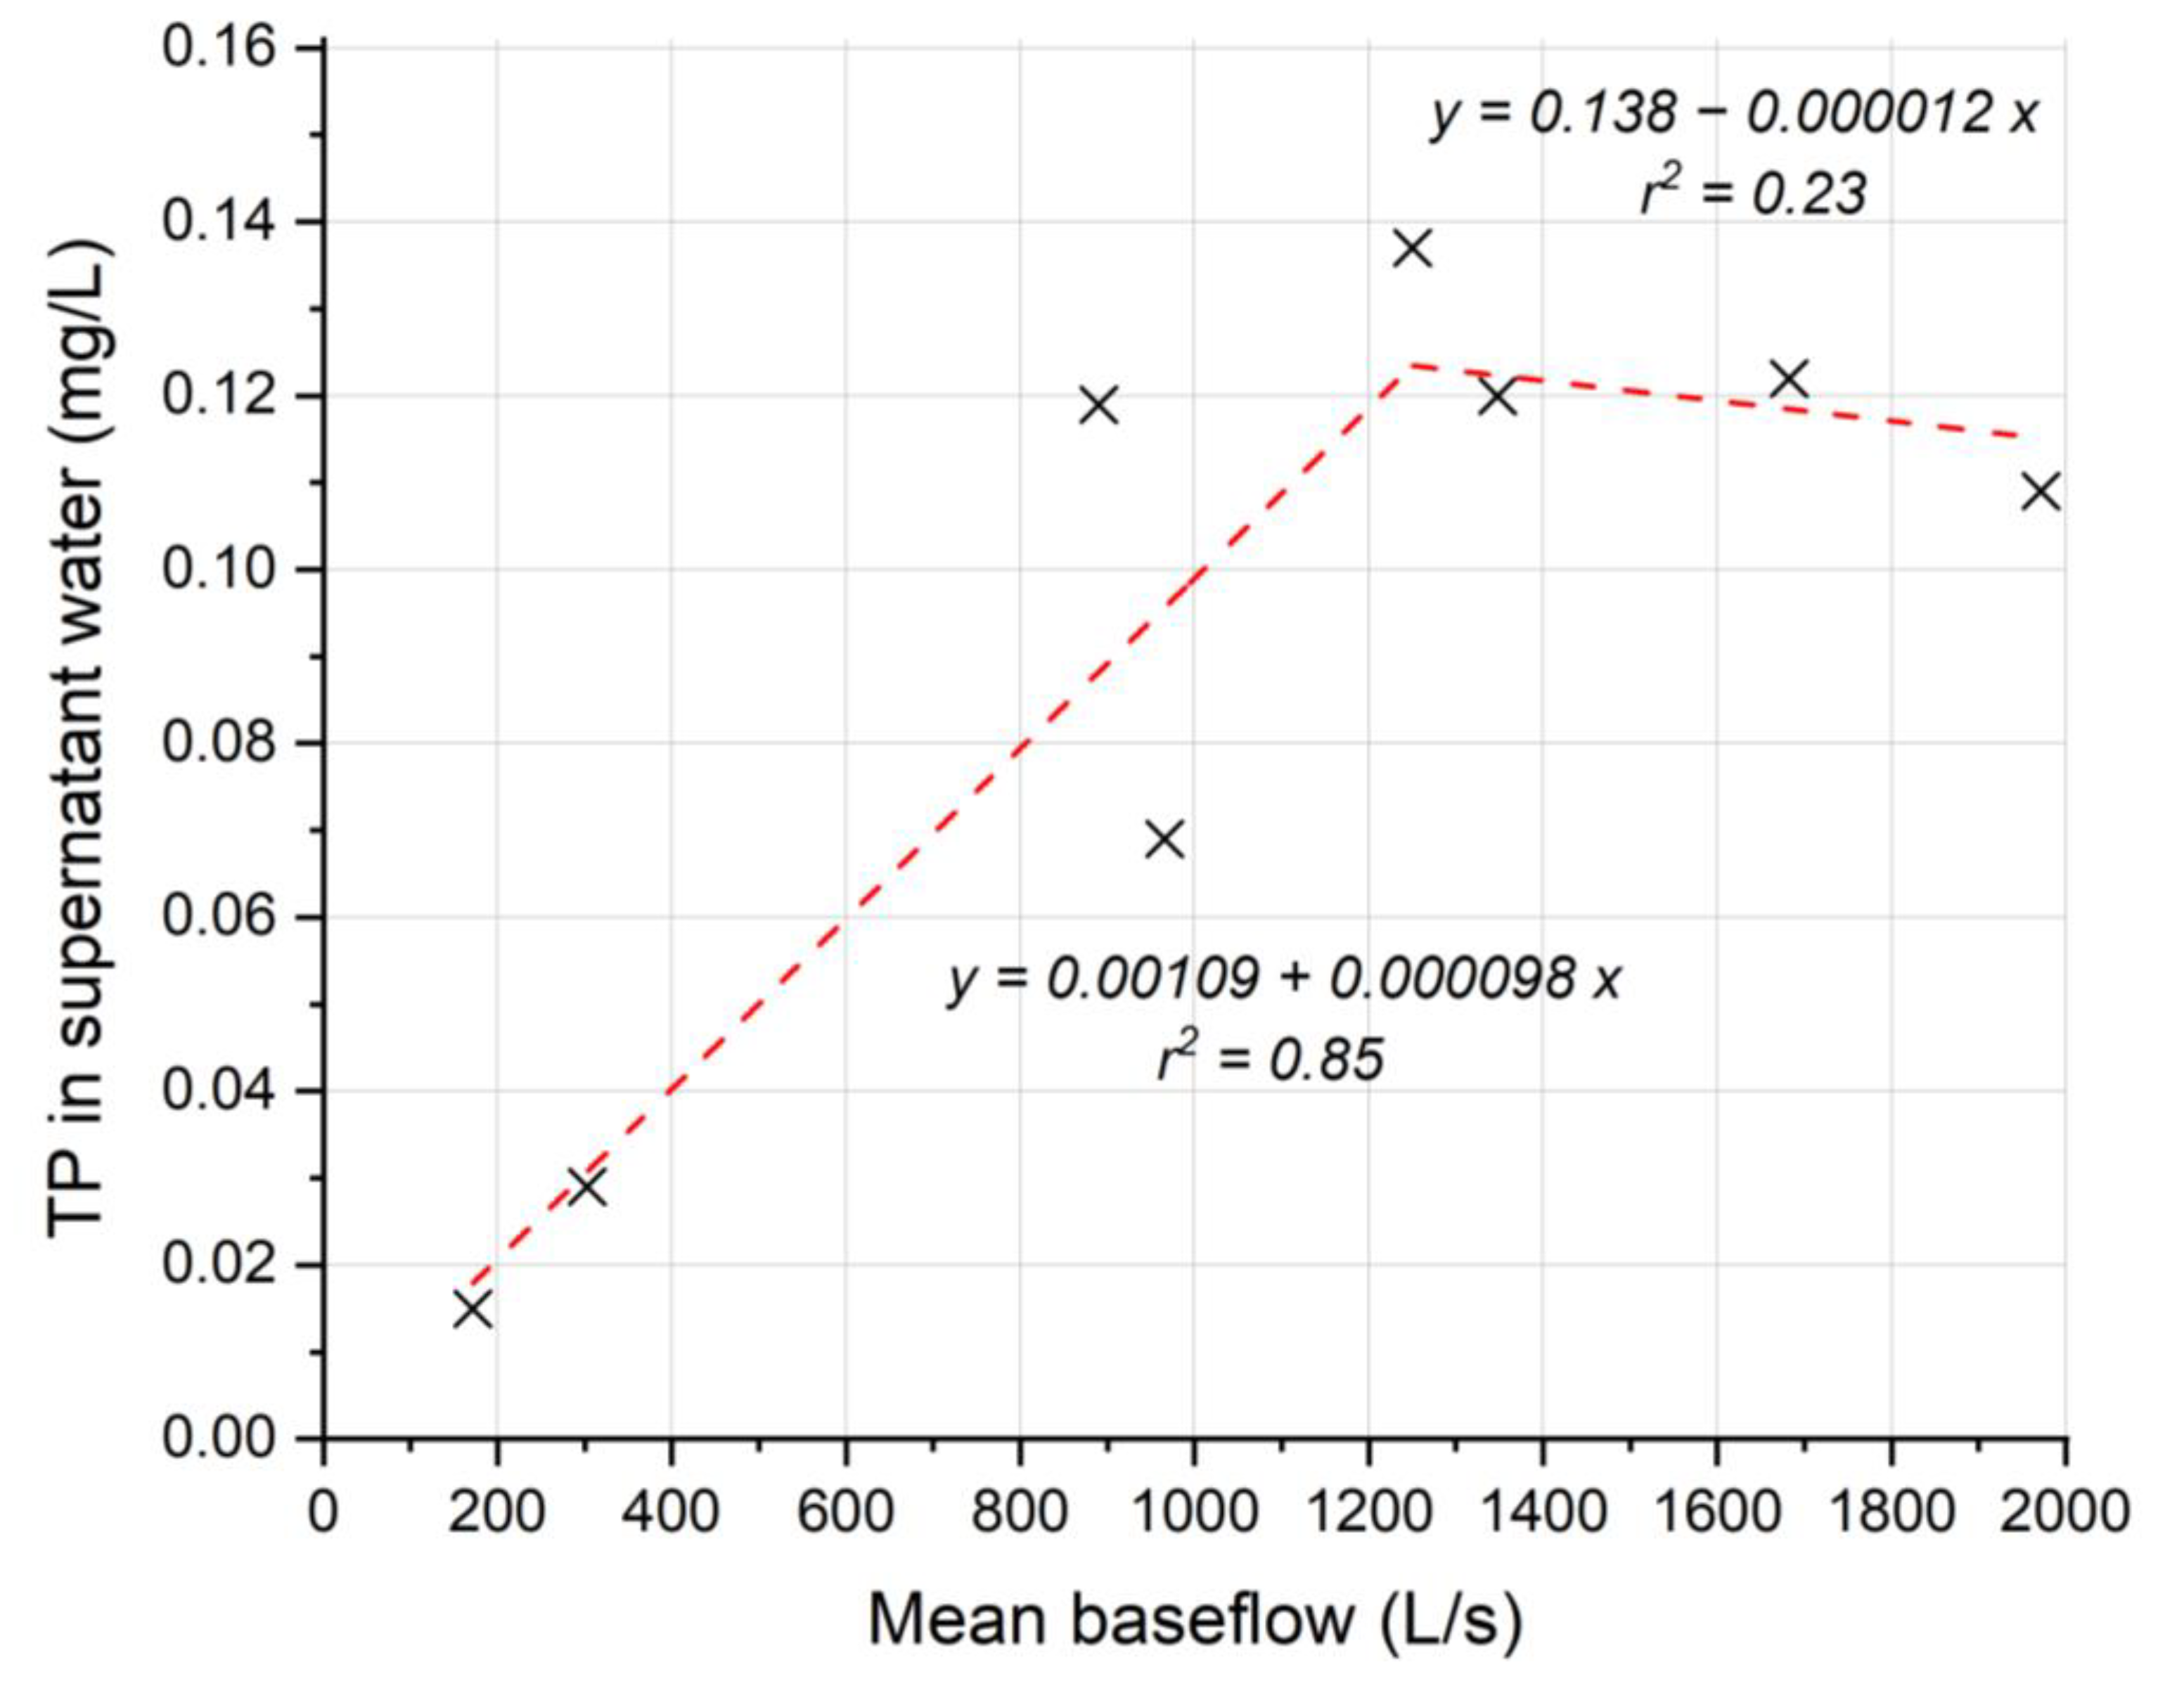
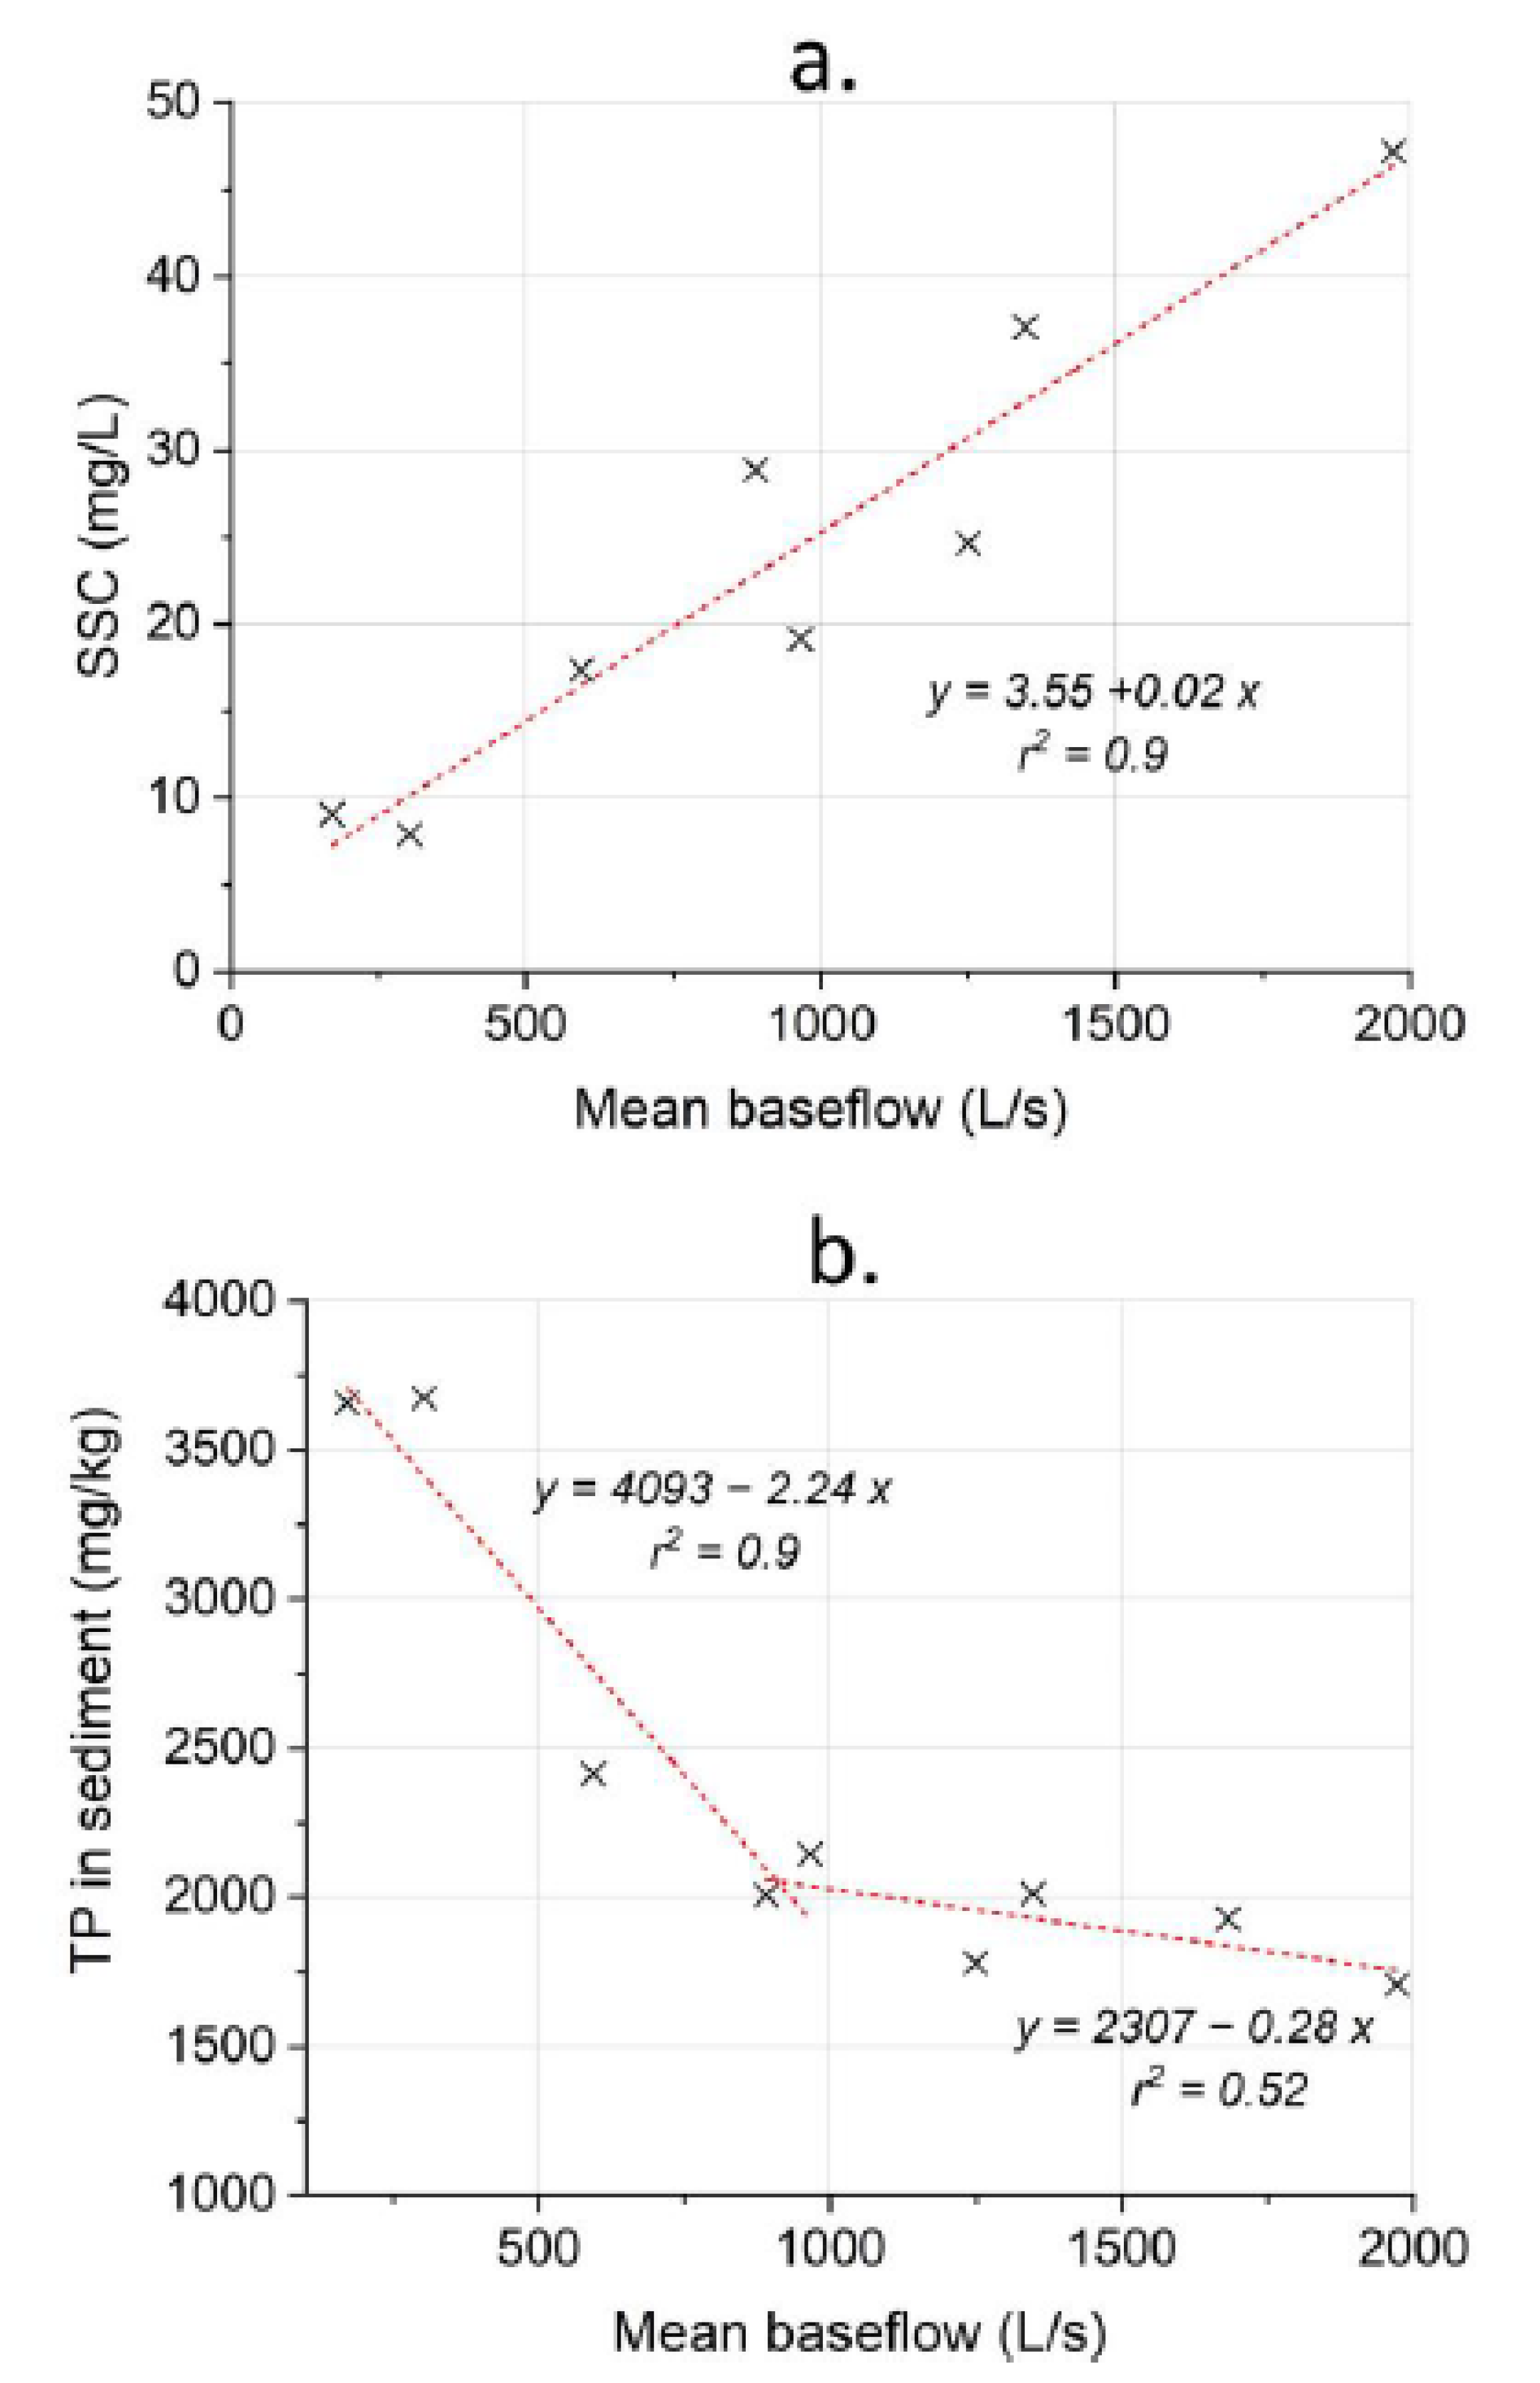
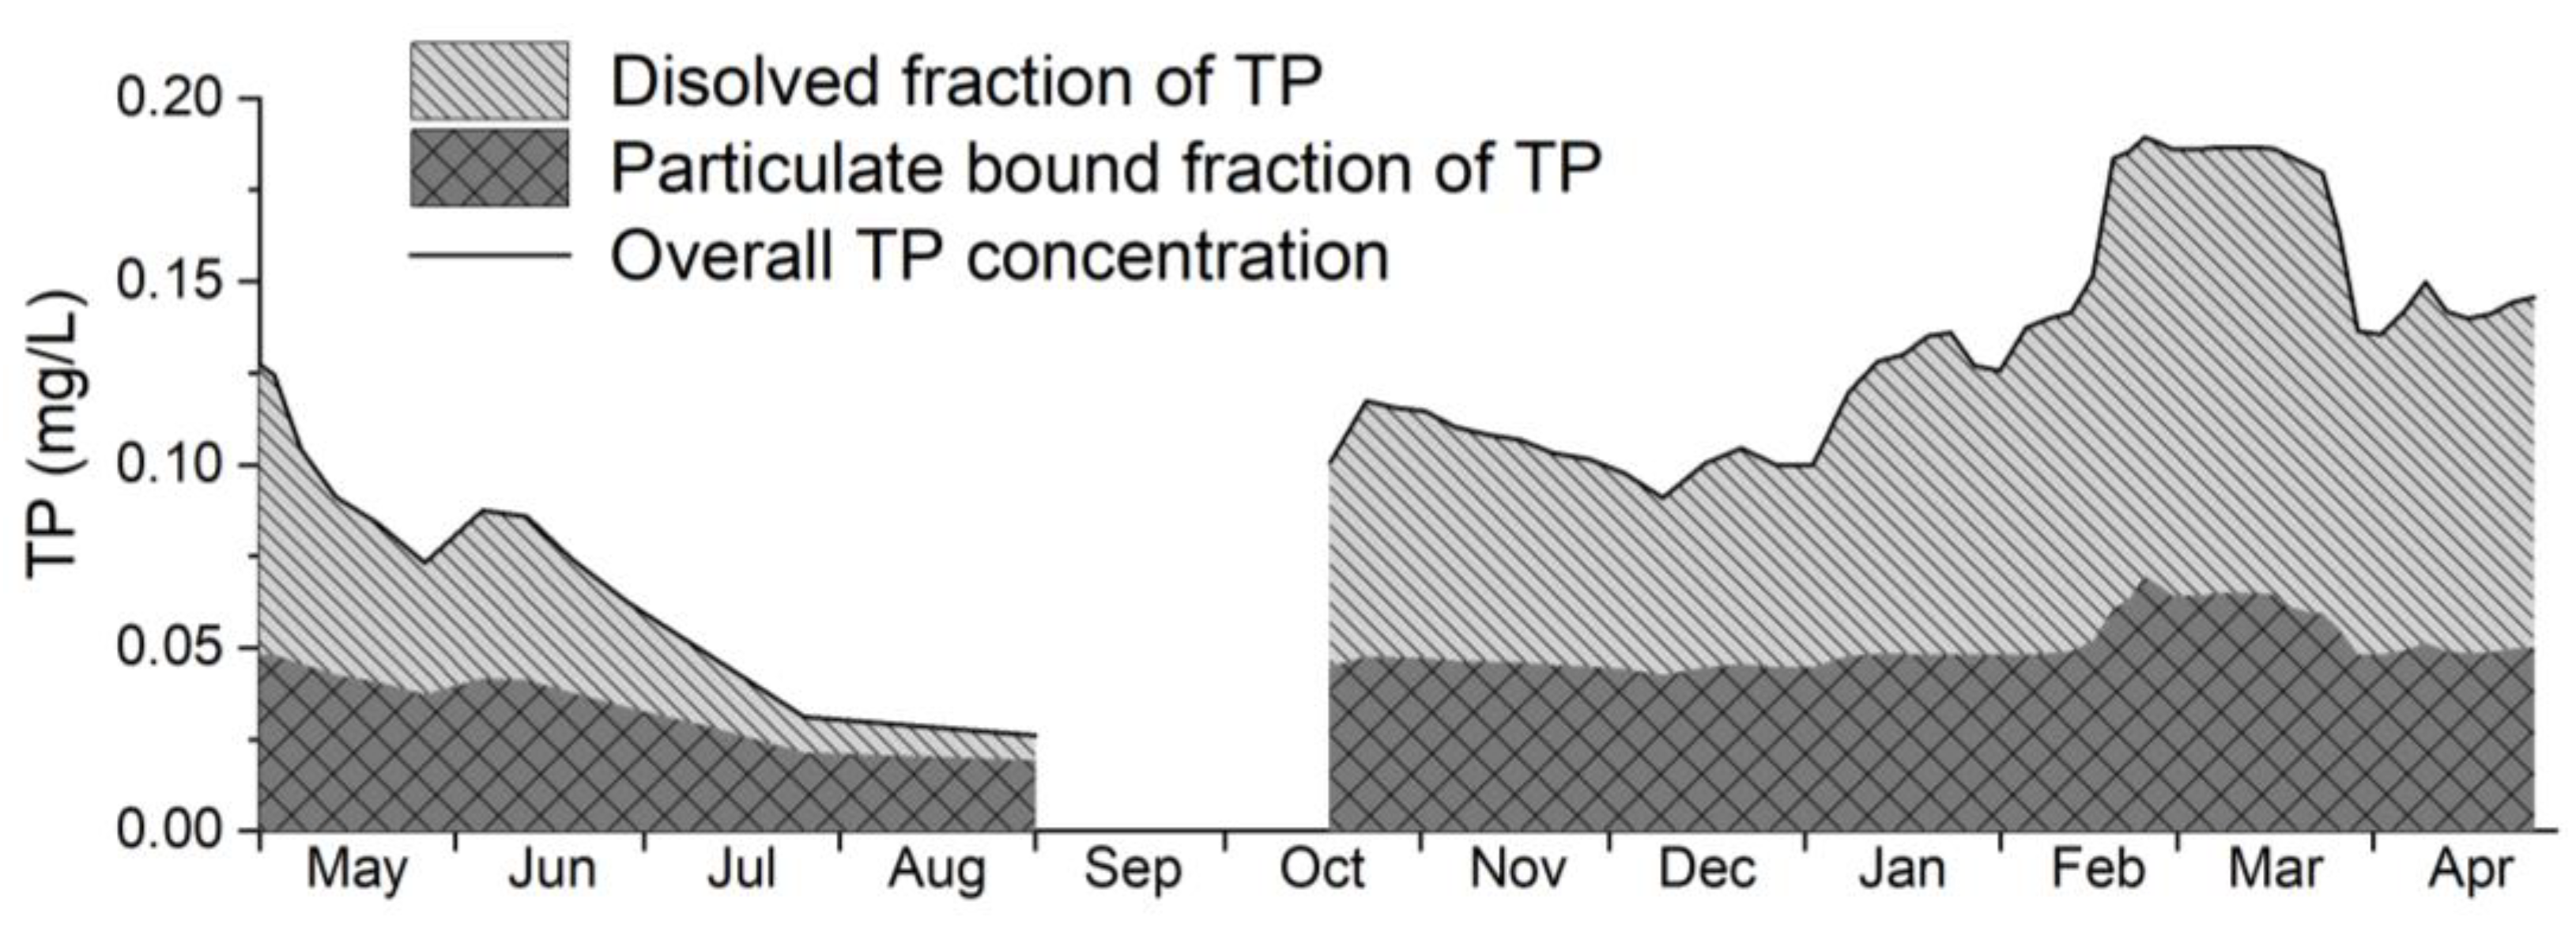
3.2. Monitoring and Modeling Results

As shown in the previous section, the urban areas are sources of significant amounts of TP in the water bodies. Therefore, the next step of the study was the quantification of these emissions. As explained in the Methodology section, the main challenges were encountered in quantifying the share of households not connected (Coefficient A and Coefficient B). Coefficient A was assessed based on water/sewer connection data delivered by SANEPAR, while Coefficient B was calibrated based on the findings of the monitoring station as is described in the following sections.

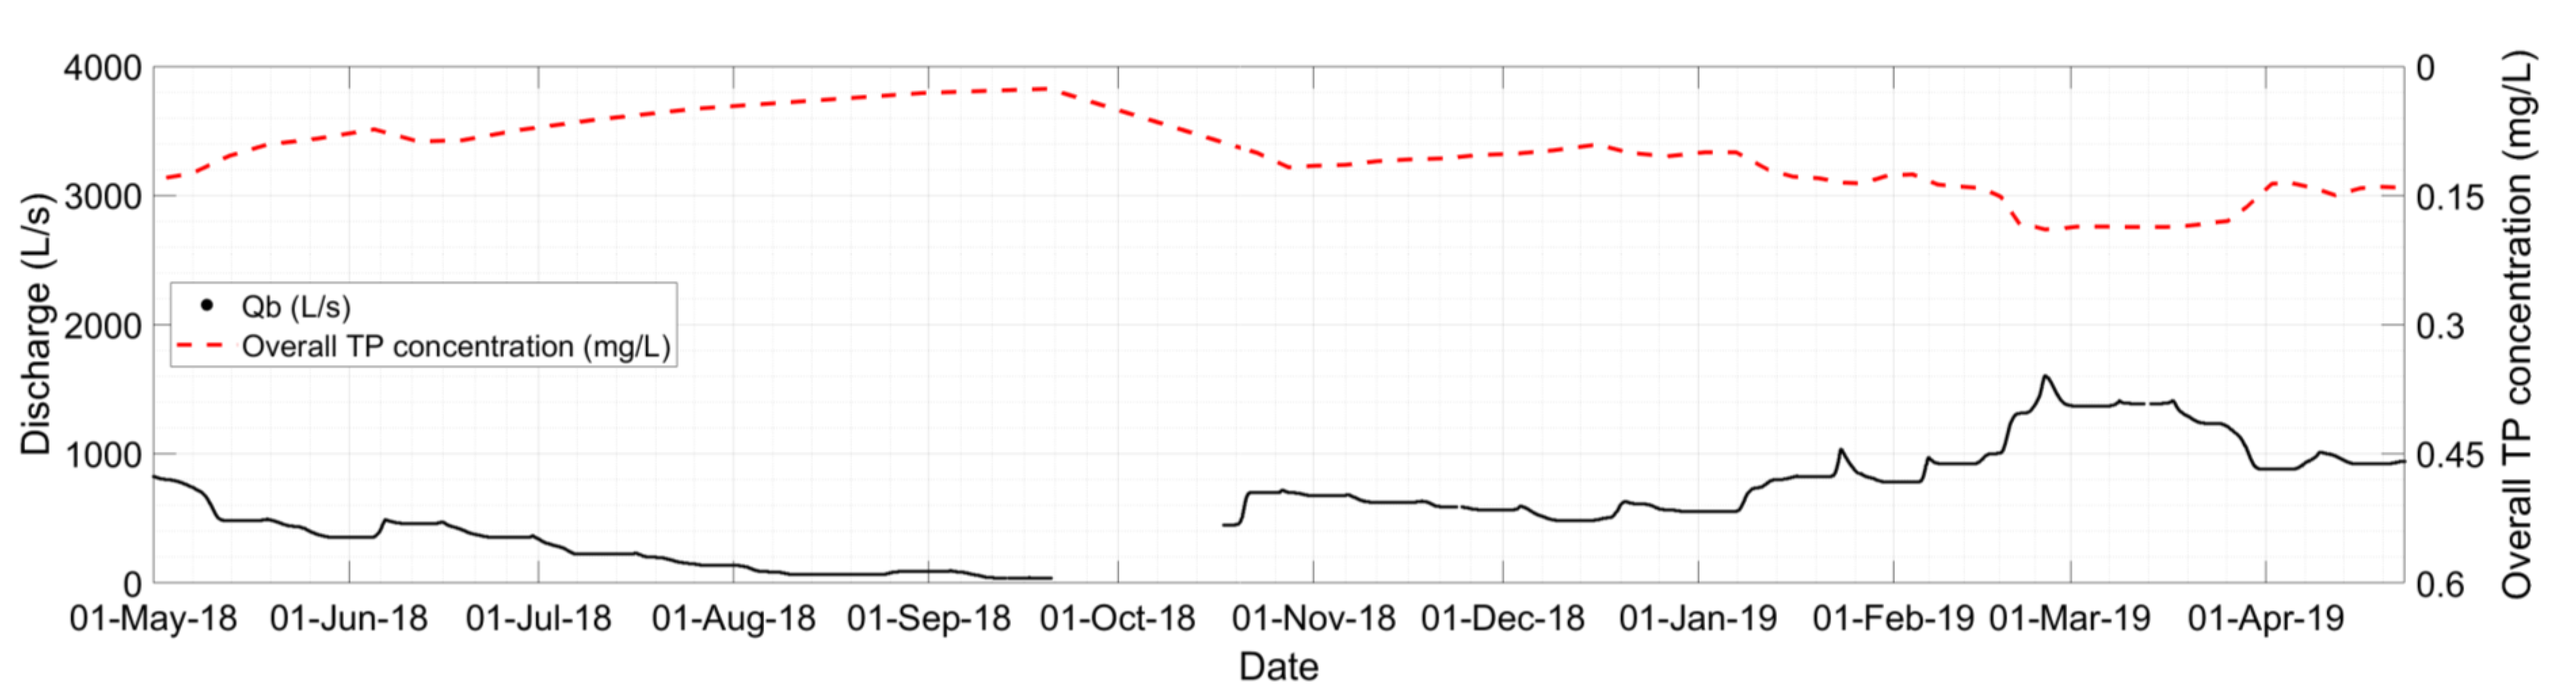
3.2.1. Estimation of Riverine TP Load

Initially, the TP concentrations in the supernatant water were set in relation to the mean baseflow discharge and a rating curve was derived. As shown in Figure 10, the curve has two components: initially increasing until a discharge value of 1250 L/s, and with a slightly decreasing slope afterwards. The TP concentration in the supernatant water reached values of up to 0.14 mg/L, while the minimum value measured was 0.018 mg/L.
Secondly, the sediment mass in the tank was quantified. The mass value was divided by the volume of water in the tank and the suspended solid concentration (SSC) was calculated for the entire composite sample. Subsequently, the sediment-rating curve for baseflow conditions was created (Figure 11a) by setting a relation between the mean baseflow of a sampling event and SSC values. It can be observed that there is a linear relation between the mean baseflow discharge and the SSC. The SSC values reach up to 50 mg/L, which are normal values for baseflow as reported by [25]. At the same location [25] measured SSC values were up to 77.8 mg/L for flow conditions of up to 1.93 m3/s.
Thirdly, a relation was set between the particle-bound P content and the discharge (Figure 11b). As can be observed, there is a distinct connection between the discharge and the particle-bound P concentration. For low-flow conditions, observed during the dry months April–October (lower than 911 L/s as derived from the intersection of the two lines in the graph), the particle-bound P content is highly sensitive to the changes in the discharge. A decrease in the TP concentration follows an increase in the discharge values, which is an expected outcome as the TP in the sediment is diluted with increased discharge. For higher baseflow conditions (greater than 911 L/s, observed during October–April), the TP concentrations are less sensitive to the change in discharge. There is still a decreasing trend in the TP concentration with increasing discharges, but due to the extensive dilution that occurs, the effect is less intense compared to the low flow conditions.
The values of TP in the suspended load in Passaúna were also compared with values of TP from the Barigui River, a catchment bordering Passaúna. [26] measured a mean TP concentration of 1718 ± 643 mg/kg in the suspended solids from three different locations in the catchment. The mean TP concentration in this study reached 2370 mg/kg, or 38% higher than that measured by [26]. The difference in the values can be attributed to the number of sampled events, the degree of urbanization, and the relation of the analyzed sample to the flow conditions. Despite the difference, the values are in the same range and offer an acceptable plausibility check for our results.
For each sub-period from Figure 7, a sediment mass (S) was calculated by multiplying the sediment concentration (SSC) derived from the regression analysis (Figure 11a) with the baseflow discharge (Qb) and the duration (T) of the sub-period (Equation (1)). The particle-bound TP mass from each sub-period (TPMSSC) was calculated by multiplying the sediment mass with the TP content in the settled material derived from the regression curve in Figure 11b (Equation (2)). Finally, the dissolved P mass (TPMwater) was derived by multiplying the TP concentration (CON), obtained from the regression analysis (Figure 10) with the baseflow discharge (Qb) and the duration (T) of the sub-period (Equation (3)). The overall mass of TP (TPM) is equal to the sum of the TP content in suspended solids and water (Equation (4)).
S (kg) = SSC (mg⁄L) × Qb (L⁄s) × T(sec)/1,000,000
TPMssc (kg) = S (kg) × TPC (mg/kg)/1,000,000
TPMwater (kg) = CON (mg/L) × Qb (L/s) × T (sec)/1,000,000
TPM (kg) = TPMssc (kg) + TPMwater (kg) 365
Normally, the annual TP input (TPY) from the catchment would be the sum of all TPM values during the year. Due to problems with the electricity supply in the station during end of September to mid of October, only 338 days of discharge data were available (white blank area in Figure 7). For this reason, the annual TP input in kg was quantified by using a linear extrapolation as shown in Equation (5).
TPY ( kg ) = 365 338 i = 1 64 TPM ( kg ) i
From the final calculations (Equations (1)–(5)), it can be seen that the overall TP mass entering the surface water from the urban areas in the LVS catchment reached 2315 kg for 338 days and 2501 kg for the entire year, whereby 37.8% reach the LVS point as particle-bound P and 62.2% as dissolved P. As shown in Figure 12, the highest TP concentration, thus the highest TP input, was observed in the wet months especially in the period from 1 January 2019 to 30 April 2019. The findings here are aligned with the results of [27]. They also found that for the Timbú River (another river passing through a partly urbanized area in Curitiba) under drought periods, the flow has a greater influence on loads than concentrations, resulting in higher TP loads with higher discharges.
Figure 13 shows that the overall modeled TP concentration follows the same pattern as the dry weather discharge (baseflow), indicating that there is a direct relationship between the two parameters. The data suggest that there is an impact from the diffuse sources and that the sampled events include direct TP input from erosion or surface runoff from agricultural land. However, when comparing the rainfall to the amount of discharge produced (Figure 14), a direct relation can be observed. The delay in the surface runoff generation is also minimal compared to the duration of a sampling event, as the Passaúna catchment is a relatively small hydrological basin. As shown in Figure 14, during the sampled events, no rainfall was recorded and therefore, no surface runoff was collected. The discharge in the river is a product of groundwater and interflow contributions. A first hypothesis is that the sediment stock in the rivers may play an important role in the short-term phosphorus balance in the Passaúna catchment. It appears that on the one hand, during the fading of high flow phases or during dry weather conditions, a significant amount of sediment is deposited in the riverbed. This mass is partially resuspended and transported further downstream afterwards, with increasing flow velocities. This phenomenon can be of importance especially for the small streams that pass through the urban areas. During a lack of rainfall, this small creeks become almost dry and are fed mostly from the wastewater. A large part of the deposited material will be resuspended from the first flush, while part of it will be resuspended and transported with the baseflow. As indicated in the increasing trend in Figure 10, a significant part of the material is also dissolved once set in resuspension, resulting in a higher dissolved phosphorus concentration with increased discharge.
Apart from sediment resuspension, another explanation for the high TP input in the wet months could be the increased concentration of TP in the interflow and groundwater component of discharge [7]. A significant amount of TP from agricultural areas or unsealed urban areas infiltrates the soil in a dissolved form and is transported afterwards through the interflow and groundwater component of the discharge. The regression curve shown in Figure 10 indicates that up to a discharge of 1250 L/s, the interflow and groundwater component have a higher TP concentration than the river. For discharges between 1250 L/s and 2000 L/s the concentration of the groundwater and interflow is reduced. Another important observation is the decreasing trend in the particle-bound TP concentration with a decreasing discharge. The decreasing trend in Figure 11b indicates that there is no input of particle-bound TP with increasing discharge. On the other hand, this hypothesis alone does not explain the increasing trend of SSC concentrations if no surface runoff was recorded. Therefore, the combination of both phenomena, i.e., of river sediment resuspension and a high TP concentration from interflow and the groundwater component, is the most probable.
The argumentation of the last paragraphs is based on the fact that rainfall throughout the catchment is homogeneously distributed and has the same intensity and duration as the weather station. Nevertheless, one can argue that the rainfall characteristics can differ between the locations in the catchment. Local rainfall events in small areas of the catchment might also be responsible for the elevated SSC and the dilution effect recorded. The incoming sediment in the surface runoff originates mainly from areas without vegetation coverage (probably arable land) and has a lower TP concentration compared to the baseflow. The low temporal resolution of the rainfall data (daily) and the existence of only one weather station make it difficult to assess the effects of rainfall heterogeneity on the SSC concentration and TP input at the LVS location.

3.2.2. Coefficient A

By using the data delivered by SANEPAR, the share of unconnected households (Coefficient A) was calculated. In the Ferraria region, 28% of the drinking water connections did not correspond to a sewer system connection, while 72% of the water connections corresponded to a sewer system connection. As explained previously, the 28% includes the connections, which have a decentralized wastewater system and the water connections that directly discharge their untreated sewage into the surrounding creeks.
Based on the most recent census data from the Brazilian Institute of Geography and Statistics (IBGE), in 2010 the area of Ferraria had an average sewer system coverage of 63% (the average was computed as population specific and not area specific). The coverage in the Ferraria region ranged between 22% and 91% (Figure 15 adapted from [17]). Compared to the data of 2019 delivered by SANEPAR, the sanitation company, there has been an increase of approximately 10% in the sewer system coverage in the period 2010–2019.

3.2.3. Coefficient B

The value of 2501 kg TP, derived from monitoring, was used to calibrate the emission model in the LVS catchment. After establishing the model with a default value of Coefficient B, several trials were performed until the modeled value matched the measured value of 2501 kg. It was found that, based on the measured value of TP, 12% of the non-connected (in both areas with and without sewer system) population have a decentralized sewer system (3% of the entire population).
The findings of the model were compared with the data of the 2010 census. In 2010, the urban areas in the LVS catchment had an average sewer system coverage of 68%, or of 4% lower than the Coefficient A used in the model. The share of decentralized systems from IBGE, however, was 28%, and the share of direct discharging households was only 3%. From our approach, the share of direct discharging households reached 25%, while the share of decentralized systems was 3%. With the data from IBGE, the overall TP input would result in 120 kg/a or 10 kg/month for the entire Passaúna catchment. There is a considerable difference between the share of unconnected households from IBGE data and the findings of this study. During the last 10 years, there has been a large increase in the population in the area. A large part of this increase has been registered in the form of semiformal settlements. Therefore, the first explanation would be that the increase in population was followed by an increase in unconnected households.
As explained in the monitoring section, resuspension, interflow, and the groundwater component, together with the possible input from septic tanks [28,29] (due to overflow or lack of compliance with the construction regulations), are included in this pathway. Normally, a modeling path should be used for each of the above phenomena but given the difficulties associated with quantifying each of them separately (lack of groundwater concentration data), for the final calculation, they were all included in this one pathway. In this case, Coefficient B acts more as a calibration factor for the entire model rather than only as a coefficient expressing the share of unconnected households that discharge their untreated sewage directly into the surface water. After assessing both coefficients, they were used to assess the annual TP input from the overall Passaúna catchment in the Passaúna Reservoir. It was found that there is an annual total input of 3508 kg of TP in the Passaúna reservoir only from the baseflow (direct discharge of unconnected households, resuspension of river sediment stock, and finally the TP input from interflow and groundwater flow due to septic-tank leak, or infiltration from agricultural areas).

4. Conclusions

The sediment-sampling campaign provided a better understanding of the effects of urbanization on the aquatic resources. The findings suggest that there is direct pressure from the urban areas (higher compared to that from the areas dominated by agriculture). The temporal dimension of the sampling also implied that with an improvement of the sanitation facilities, a significant reduction of TP input in the rivers was achieved.
In terms of input, the direct relationship between TP concentration and baseflow indicated that groundwater and interflow were major contributors to the TP balance. Apart from infiltration from agricultural areas, septic-tanks leaks might also be an important factor that increases the TP concentration in the groundwater/interflow and thus, the baseflow of the river. The monitoring method showed certain limitations in differentiating between point and diffuse sources. The used method might be more suitable for assessing the overall TP input rather than only the urban TP input.
The results showed that the river sediment stock played probably the most important role in the inter-annual dynamics of phosphorus, when considering a uniform rainfall distribution throughout the catchment. A highly dynamic cycle of sediment deposition and resuspension was observed, meaning that the time period between settling and resuspension is short. For any further assessment of sediment or TP dynamics (time of single monitoring campaigns or model temporal resolution), this fact should be considered. Regarding the long-term P-balance, the reservoir represents the most important P-sink, which increases the risk of eutrophication for a system with almost 100% trapping efficiency.
Overall, the combination of the model and of monitoring provided a valuable understanding of the system and a reliable decision support system to be used for future implementations.
Regarding the future outlook, the constant increase in population and urban areas will continue to exert significant pressure on the aquatic resources. The increased level of urban areas should be responded to with improvements in sanitation facilities in order to decrease the direct P discharges. The increase in urban areas in the region needs to be controlled if not slowed down by the authorities, given the fact that the Passaúna catchment is an environmentally protected area (APA) and an essential asset for the drinking-water system of the Metropolitan Region of Curitiba.

Author Contributions

Conceptualization, K.S., S.H. and S.F.; data curation, K.S., R.T.K., P.G.G., M.B.S. and D.A.B.; formal analysis, M.B.S. and R.T.K.; funding acquisition, S.H. and S.F.; investigation, R.T.K., K.S., P.G.G. and D.A.B.; project administration, S.H. and S.F.; resources, R.T.K.; software, K.S.; supervision, S.F.; visualization, K.S.; writing—original draft, K.S.; writing—review and editing, S.H., M.B.S. and S.F. All authors have read and agreed to the published version of the manuscript.

Funding

This research was funded by the German Federal Ministry of Education and Research within Grant 02WGR1431A, in the framework of the research project MuDak-WRM (https://www.mudak-wrm.kit.edu/ accessed on 31 January 2022).

Acknowledgments

We would like to thank the Operational Development of Sewage Systems and Water Resources Departments at SANEPAR, for the data availability. Special thanks go to Tobias Bleninger for the assistance in the field and to Gabriel Henrique de Almeida Pereira who compiled the data from the MapBiomas. We acknowledge support by the KIT-Publication Fund of the Karlsruhe Institute of Technology.

Conflicts of Interest

The authors declare no conflict of interest.

References

  1. Behrendt, H.; Kornmilch, M.; Opitz, D.; Schmoll, O.; Scholz, G. Estimation of the nutrient inputs into river systems—experiences from German rivers. Reg. Environ. Chang. 2002, 3, 107–117. [Google Scholar] [CrossRef]
  2. Bowes, M.J.; Smith, J.T.; Jarvie, H.P.; Neal, C. Modelling of phosphorus inputs to rivers from diffuse and point sources. Sci. Total Environ. 2008, 395, 125–138. [Google Scholar] [CrossRef] [PubMed] [Green Version]
  3. Tetzlaff, B.; Vereecken, H.; Kunkel, R.; Wendland, F. Modelling phosphorus inputs from agricultural sources and urban areas in river basins. Environ. Geol. 2009, 57, 183–193. [Google Scholar] [CrossRef]
  4. House, W.A.; Denison, F.H. Nutrient dynamics in a lowland stream impacted by sewage effluent: Great Ouse, England. Sci. Total Environ. 1997, 205, 25–49. [Google Scholar] [CrossRef]
  5. House, W.A.; Denison, F.H. Total phosphorus content of river sediments in relationship to calcium, iron and organic matter concentrations. Sci. Total Environ. 2002, 282–283, 341–351. [Google Scholar] [CrossRef]
  6. Jarvie, H.P.; Neal, C.; Withers, P.J.A. Sewage-effluent phosphorus: A greater risk to river eutrophication than agricultural phosphorus? Sci. Total Environ. 2006, 360, 246–253. [Google Scholar] [CrossRef]
  7. Shore, M.; Murphy, S.; Mellander, P.-E.; Shortle, G.; Melland, A.R.; Crockford, L.; O'Flaherty, V.; Williams, L.; Morgan, G.; Jordan, P. Influence of stormflow and baseflow phosphorus pressures on stream ecology in agricultural catchments. Sci. Total Environ. 2017, 590–591, 469–483. [Google Scholar] [CrossRef] [PubMed]
  8. Fuchs, S.; Kaiser, M.; Kiemle, L.; Kittlaus, S.; Rothvoß, S.; Toshovski, S.; Wagner, A.; Wander, R.; Weber, T.; Ziegler, S. Modeling of Regionalized Emissions (MoRE) into Water Bodies: An Open-Source River Basin Management System. Water 2017, 9, 239. [Google Scholar] [CrossRef]
  9. Acosta Porras, E.A.; Kishi, R.T.; Fuchs, S.; Hilgert, S. Estimation of Phosphorus Emissions in the Upper Iguazu Basin (Brazil) Using GIS and the MORE Model. In Proceedings of the International Archives of the Photogrammetry, Remote Sensing and Spatial Information Sciences, Prague, Czech Republic, 12–19 July 2016. [Google Scholar]
  10. Hilgert, S.; Sotiri, K.; Fuchs, S. Advanced assessment of sediment characteristics based on Rheological and hydroacoustic measurements in a Brazilian reservoir. In Proceedings of the 38th IAHR World Congress, Panama City, Panama, 1–6 September 2019. [Google Scholar]
  11. Sotiri, K.; Hilgert, S.; Mannich, M.; Bleninger, T.; Fuchs, S. Implementation of comparative detection approaches for the accurate assessment of sediment thickness and sediment volume in the Passaúna Reservoir. J. Environ. Manag. 2021, 287, 112298. [Google Scholar] [CrossRef] [PubMed]
  12. Carneiro, C.; Kelderman, P.; Irvine, K. Assessment of phosphorus sediment–water exchange through water and mass budget in Passaúna Reservoir (Paraná State, Brazil). Environ. Earth Sci. 2016, 75, 564. [Google Scholar] [CrossRef]
  13. Sotiri, K.; Hilgert, S.; Duraes, M.; Armindo, R.A.; Wolf, N.; Scheer, M.B.; Kishi, R.; Pakzad, K.; Fuchs, S. To What Extent Can a Sediment Yield Model Be Trusted? A Case Study from the Passaúna Catchment, Brazil. Water 2021, 13, 1045. [Google Scholar] [CrossRef]
  14. IAP—Environmental Institute of Paraná State. Monitoramento da Qualidade das Águas dos Reservatórios do Estado do Paraná, no Período de 2005 a 2008 (Monitoring of Reservoir Water Quality in the Paraná State, 2005–2008 Period); IAP: Curitiba, Brazil, 2009. [Google Scholar]
  15. MapBiomas. Projeto de Mapeamento Anual do Uso e Cobertura da Terra no Brasil. Available online: https://plataforma.brasil.mapbiomas.org/ (accessed on 3 October 2021).
  16. SANEPAR. Plano Diretor do Sistema de Esgotamento Sanitário Integrado de Curitiba e Região Metropolitana (SEIC). Plano Diretor de Esgotamento Sanitário dos Sistemas Isolados da Região Metropolitana de Curitiba. Plano Diretor dos Resíduos Sólidos Gerados nos Sistemas de Abastecimento de Água e nos Sistemas de Esgotamento Sanitário; SANEPAR: Curitiba, Brazil, 2015. [Google Scholar]
  17. Instituto Brasileiro de Geografia e Estatística. Base de Informações do Censo Demográfico 2010: Resultados do Universo por Setor Censitário; IBGE: Rio de Janeiro, Brazil, 2011. [Google Scholar]
  18. von Sperling, M. Wastewater Characteristics, Treatment and Disposal; IWA Publishing: London, UK, 2007. [Google Scholar]
  19. Allion, K.; Gebel, M.; Uhlig, M.; Halbfass, S.; Bürger, S.; Kiemle, L.; Fuchs, S. Use of Monitoring Approaches to Verify the Predictive Accuracy of the Modeling of Particle-Bound Solid Inputs to Surface Waters. Water 2021, 13, 3649. [Google Scholar] [CrossRef]
  20. Allion, K.; Kiemle, L.; Fuchs, S. Four Years of Sediment and Phosphorus Monitoring in the Kraichbach River Using Large-Volume Samplers. Water 2022, 14, 120. [Google Scholar] [CrossRef]
  21. Nickel, J.P.; Fuchs, S. Micropollutant emissions from combined sewer overflows. Water Sci. Technol. 2019, 80, 2179–2190. [Google Scholar] [CrossRef] [PubMed]
  22. Wagner, A. Event-Based Measurement and Mean Annual Flux Assessment of Suspended Sediment in Meso Scale Catchments. Ph.D. Thesis, Karlsruhe Institute of Technology, Karlsruhe, Germany, 2019. [Google Scholar]
  23. Nickel, J.P.; Fuchs, S. Large-Volume Samplers for Efficient Composite Sampling and Particle Characterization in Sewer Systems. Water 2021, 13, 2831. [Google Scholar] [CrossRef]
  24. Tang, W.; Carey, S.K. HydRun: A MATLAB toolbox for rainfall-runoff analysis. Hydrol. Process. 2017, 31, 2670–2682. [Google Scholar] [CrossRef]
  25. Wosiacki, L.; Knapik, H.; Bleninger, T. Medição De Transporte De Sedimento Em Suspensão E Mapeamento De Seção Transversal Utilizando Medições Acústicas. Available online: https://files.abrhidro.org.br/Eventos/Trabalhos/98/ENES20200023-1-20200621-161045.pdf (accessed on 24 February 2022).
  26. Macedo Neto, D.; Froehner, S.; Sanez, J. Spatial variation of metals and phosphorus in sediments of a river influenced by urbanization. RBRH 2017, 22. [Google Scholar] [CrossRef] [Green Version]
  27. Carneiro, C.; Scheer, M.B.; Possetti, G.R.C. Phosphorus behaviour in a river during periods of drought and rain. J. Environ. Eng. Sci. 2018, 13, 117–126. [Google Scholar] [CrossRef] [Green Version]
  28. da Silva Peixoto, F.; Cavalcante, I.N.; Gomes, D.F. Influence of Land Use and Sanitation Issues on Water Quality of an Urban Aquifer. Water Resour. Manag. 2020, 34, 653–674. [Google Scholar] [CrossRef]
  29. Hirata, R.; Cagnon, F.; Bernice, A.; Maldaner, C.H.; Galvão, P.; Marques, C.; Terada, R.; Varnier, C.; Ryan, M.C.; Bertolo, R. Nitrate Contamination in Brazilian Urban Aquifers: A Tenacious Problem. Water 2020, 12, 2709. [Google Scholar] [CrossRef]
Figure 1. Location of the study area (left). Passaúna catchment and the coverage of urban areas in the catchment (right).
Water 14 00809 g001
Figure 2. Population density [17] (left) and sewer system (right) in the Passaúna catchment.
Water 14 00809 g002
Figure 3. River sampling locations and their respective catchment. The table shows the share of each land cover class in percentage.
Water 14 00809 g003
Figure 4. Schematic representation of the modelling approach.
Water 14 00809 g004
Figure 5. Location of the LVS and the land use/cover of its hydrological sub-catchment.
Water 14 00809 g005
Figure 6. Measurement duration of the LVS station. Only the numbered events were used to assess the TP input.
Water 14 00809 g006
Figure 7. Time periods with a cumulative baseflow volume of 280,000 m3.
Water 14 00809 g007
Figure 8. Sewage system and drinking water connections in the region of Ferraria.
Water 14 00809 g008
Figure 9. TP concentration (mg/kg) in the river sediment.
Water 14 00809 g009
Figure 10. Rating curve between mean baseflow and TP in supernatant water.
Water 14 00809 g010
Figure 11. (a) SSC rating curve for low flow conditions. (b) Relation between mean baseflow and TP in the suspended solids (sediment in the tank).
Water 14 00809 g011
Figure 12. Average concentration of TP in the river during one year.
Water 14 00809 g012
Figure 13. Comparison between mean baseflow and TP concentration. The figure shows that both curves follow a similar temporal pattern, indicating that the TP concentration and Qb have a direct connection.
Water 14 00809 g013
Figure 14. Relation between precipitation and discharge. The figure shows that there is no significant delay between rainfall and surface runoff. Additionally, during the sampled events, no significant rainfall was observed, indicating the absence of a surface runoff component in the sampled water.
Water 14 00809 g014
Figure 15. Sewage system coverage in the Ferraria region (adapted from [17]).
Water 14 00809 g015
Publisher’s Note: MDPI stays neutral with regard to jurisdictional claims in published maps and institutional affiliations.

