
Dissolved Methane in Coastal Waters of the Northeastern Black Sea


 ,
, 
Abstract
:1. Introduction
2. Materials and Methods
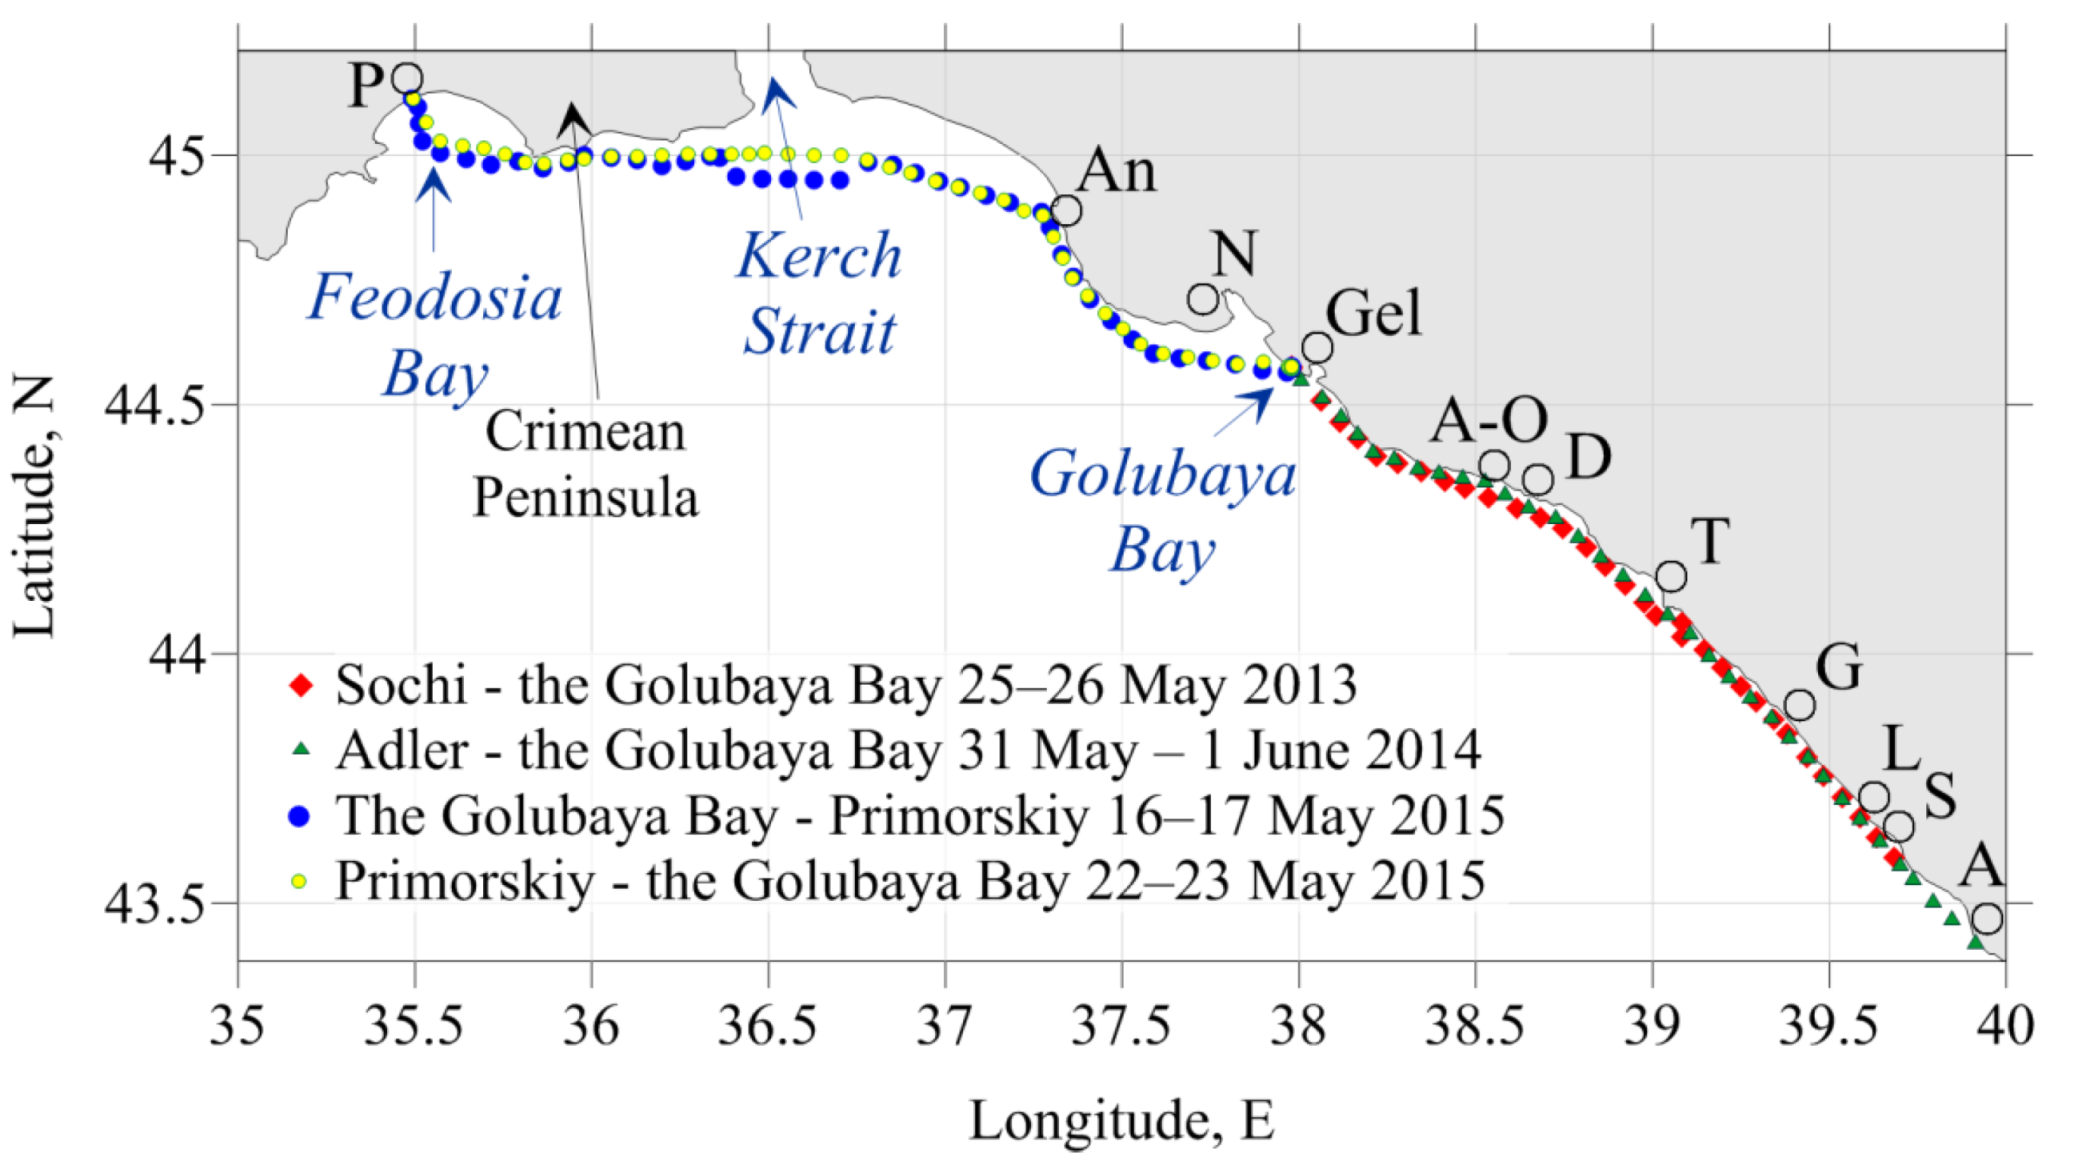
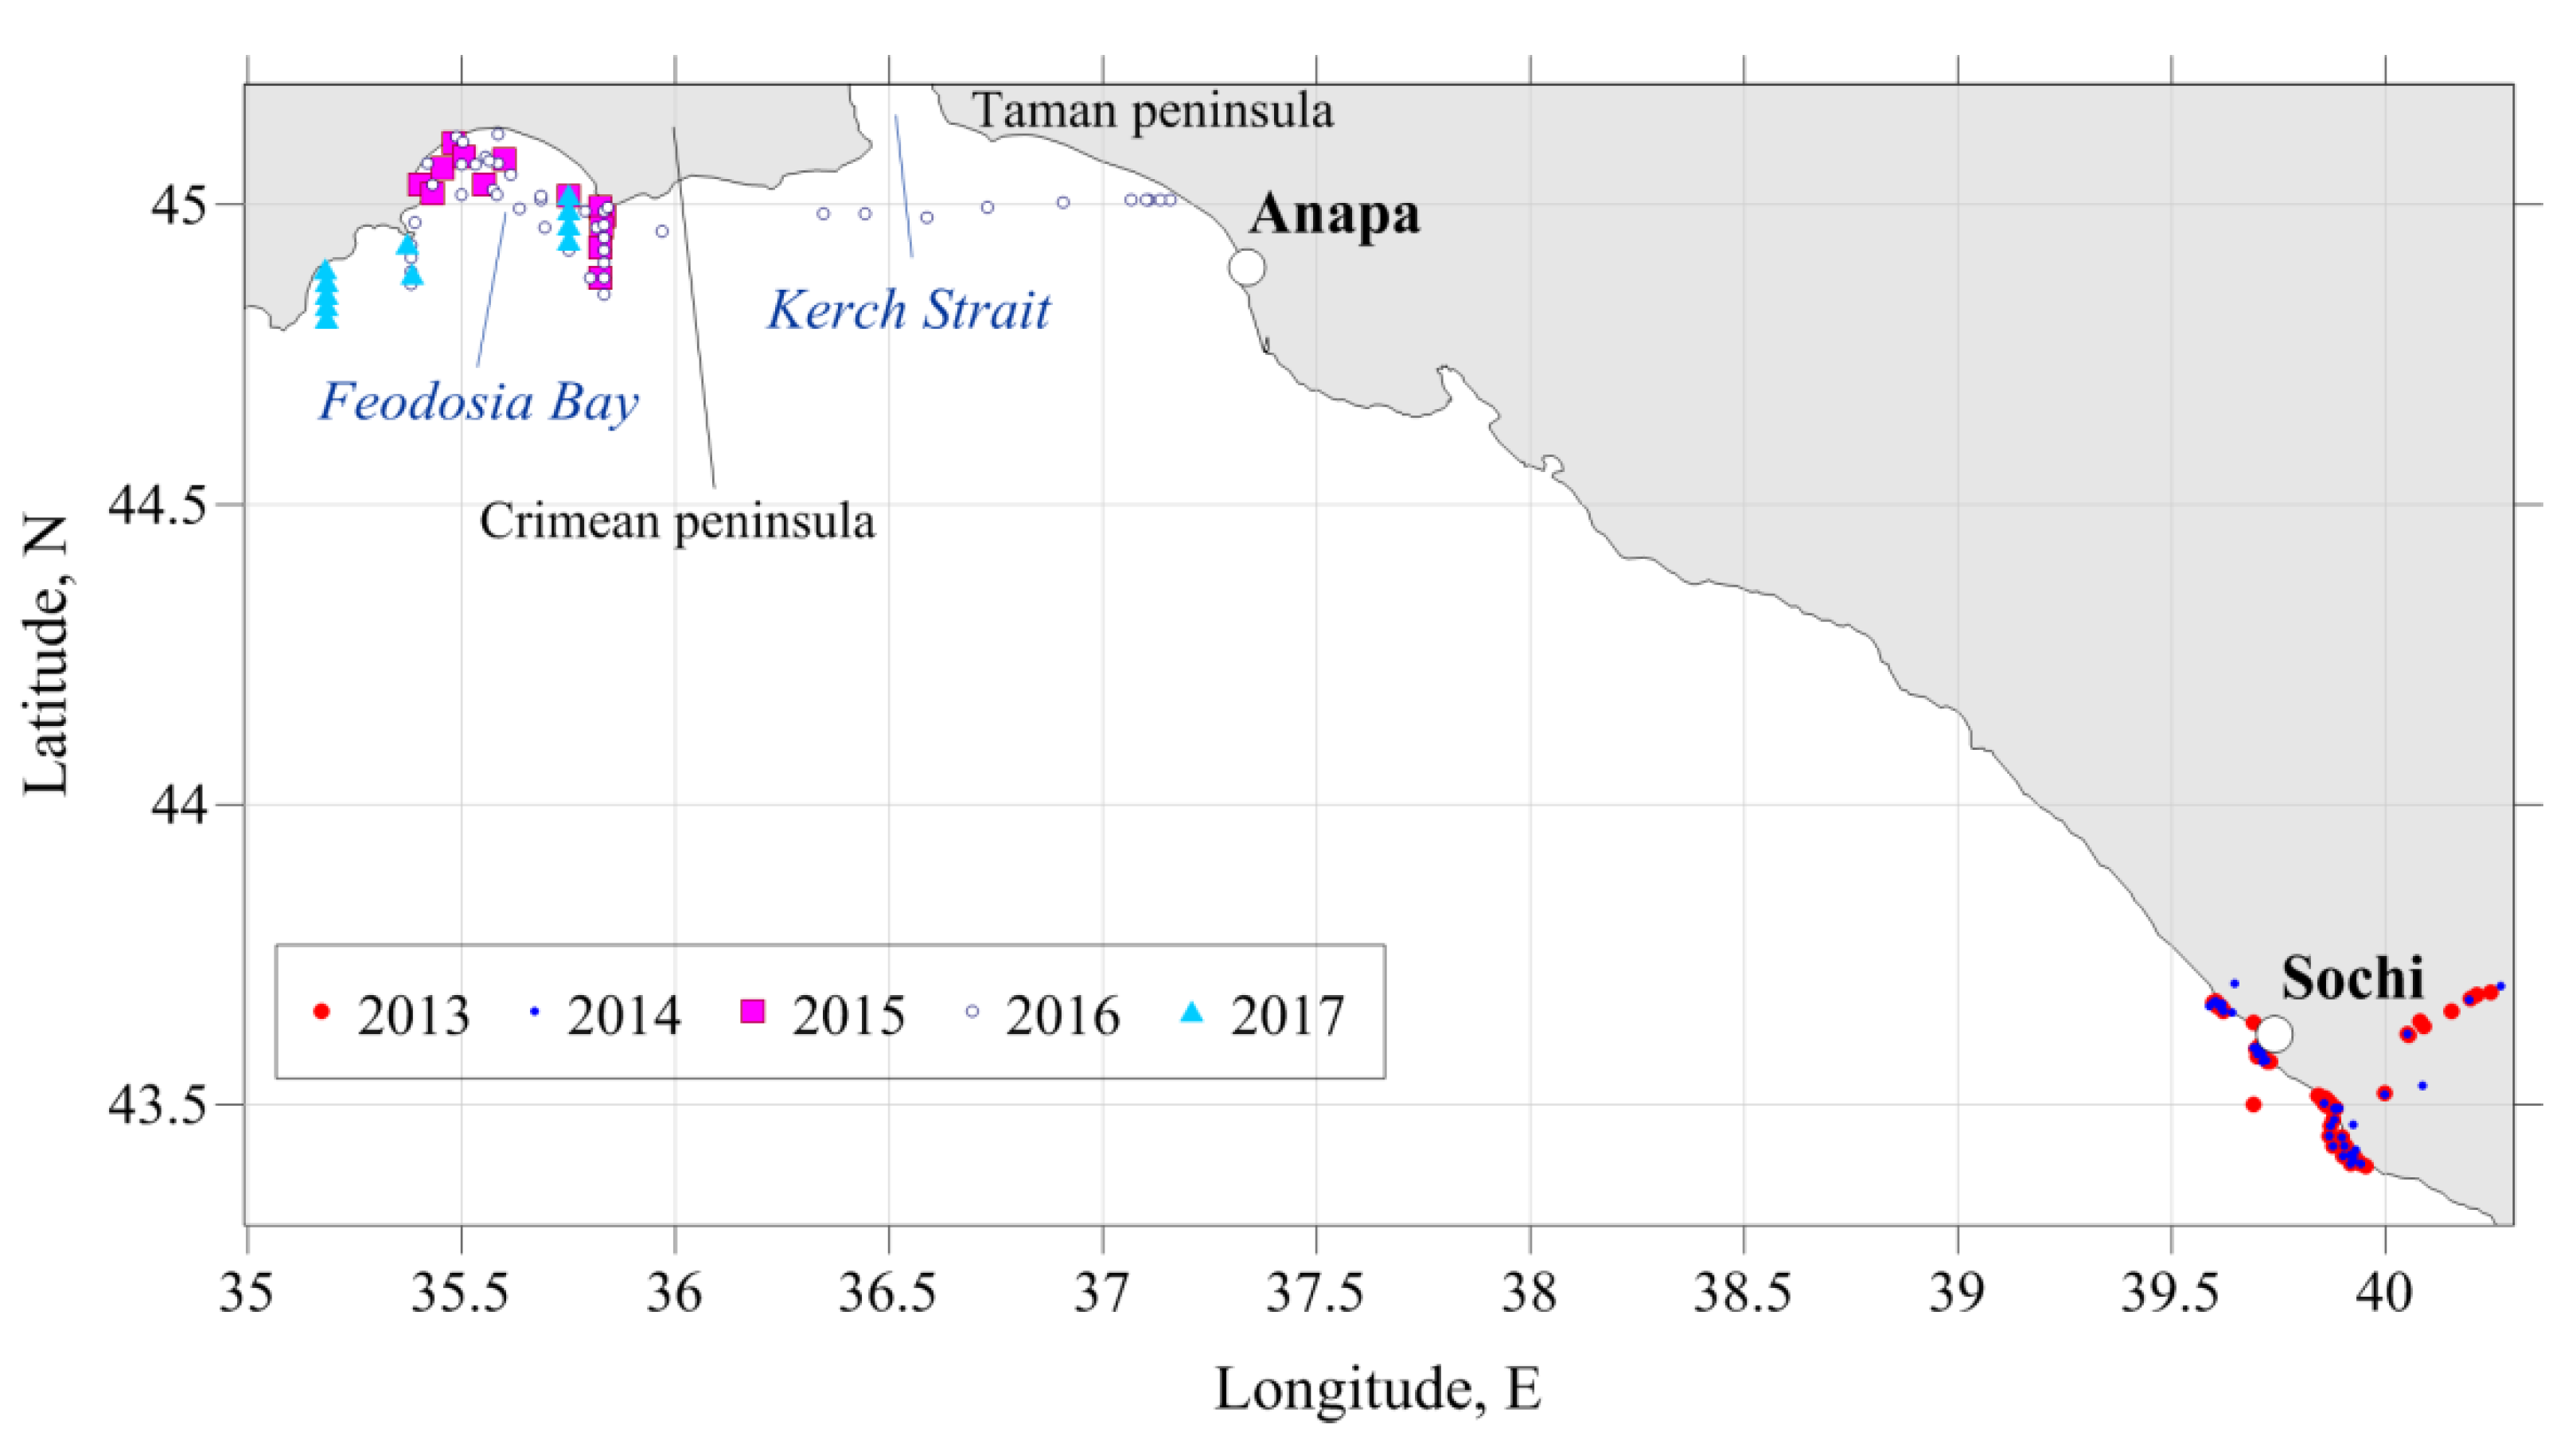
2.1. Study Area
2.2. Water Sampling and Analysis
3. Results
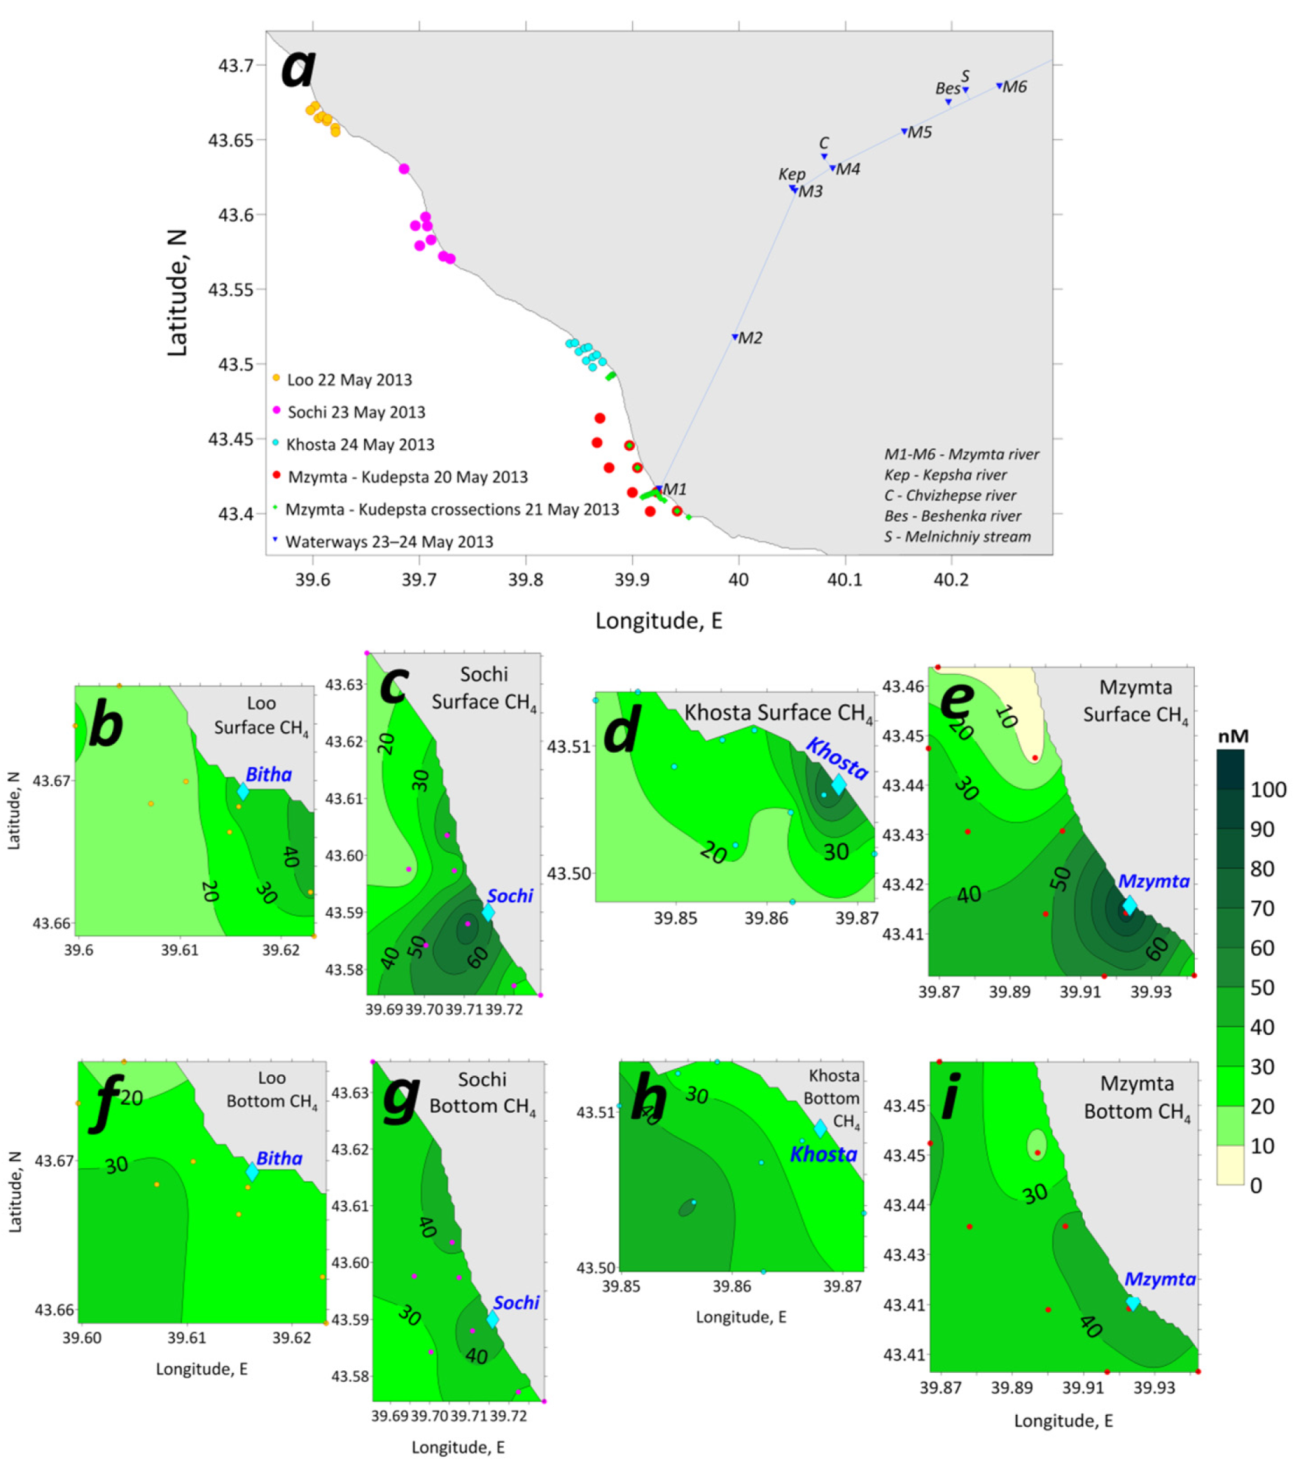
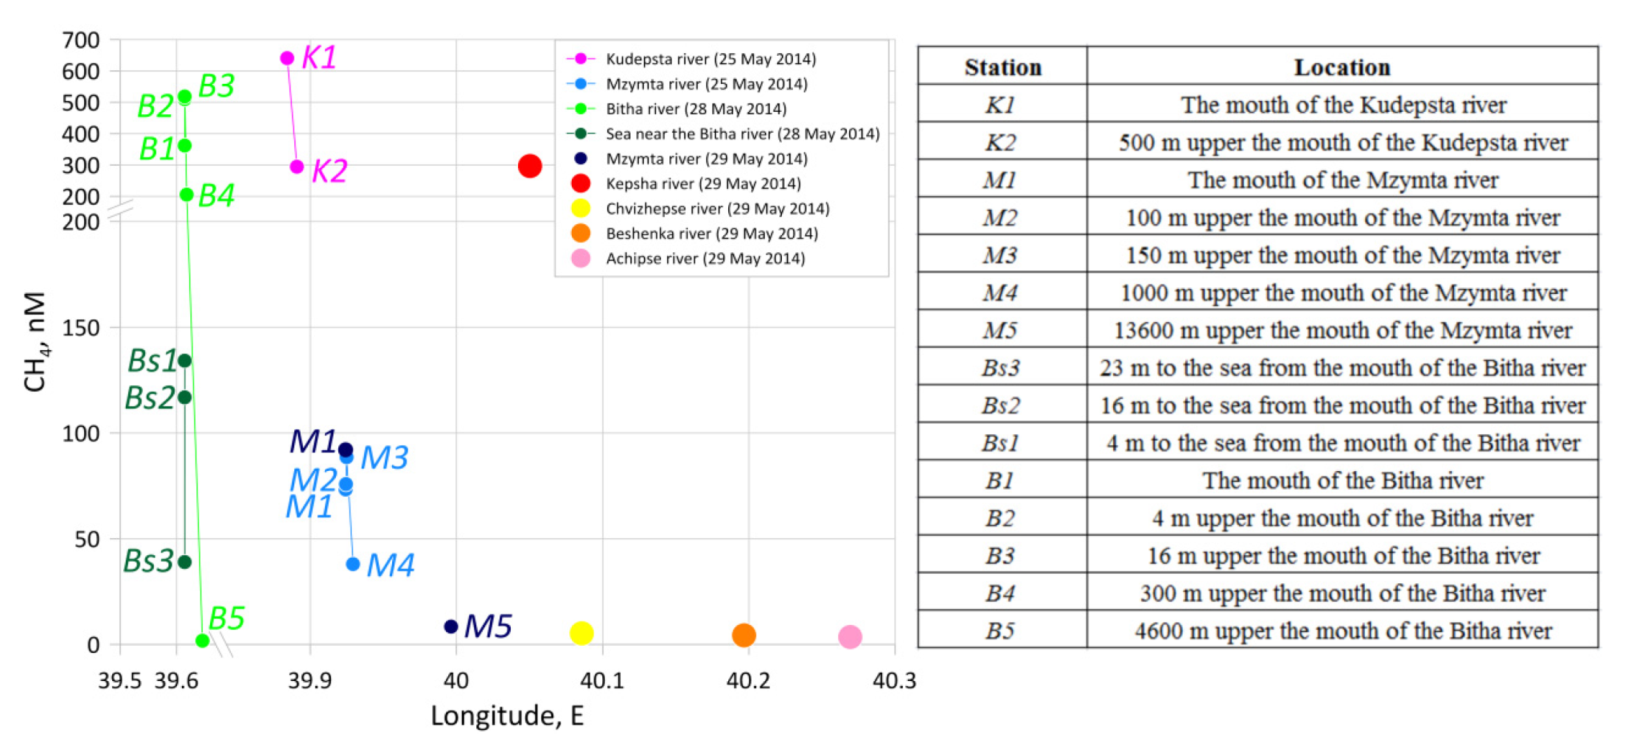
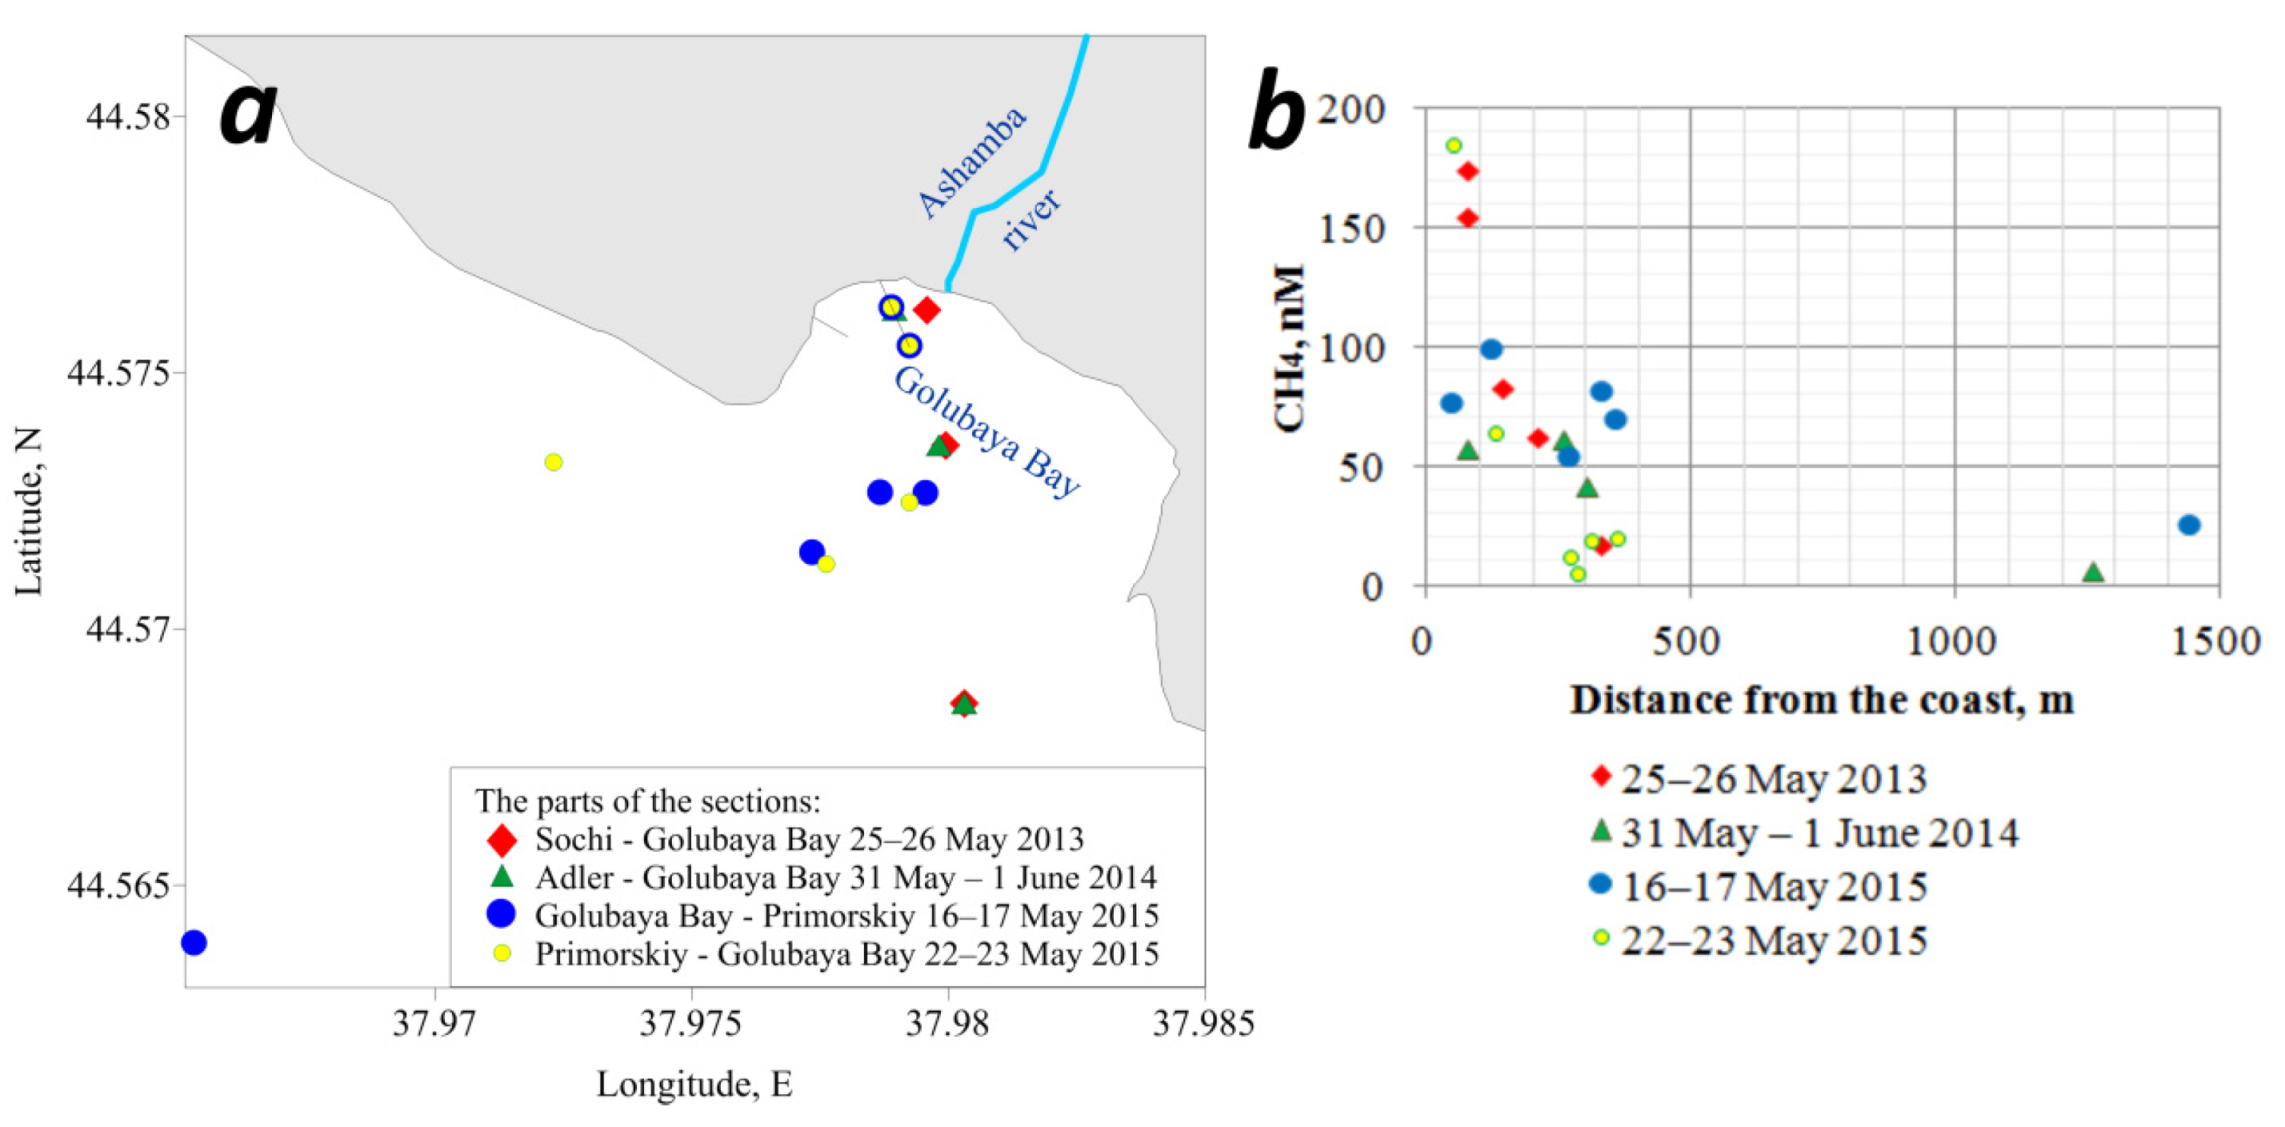
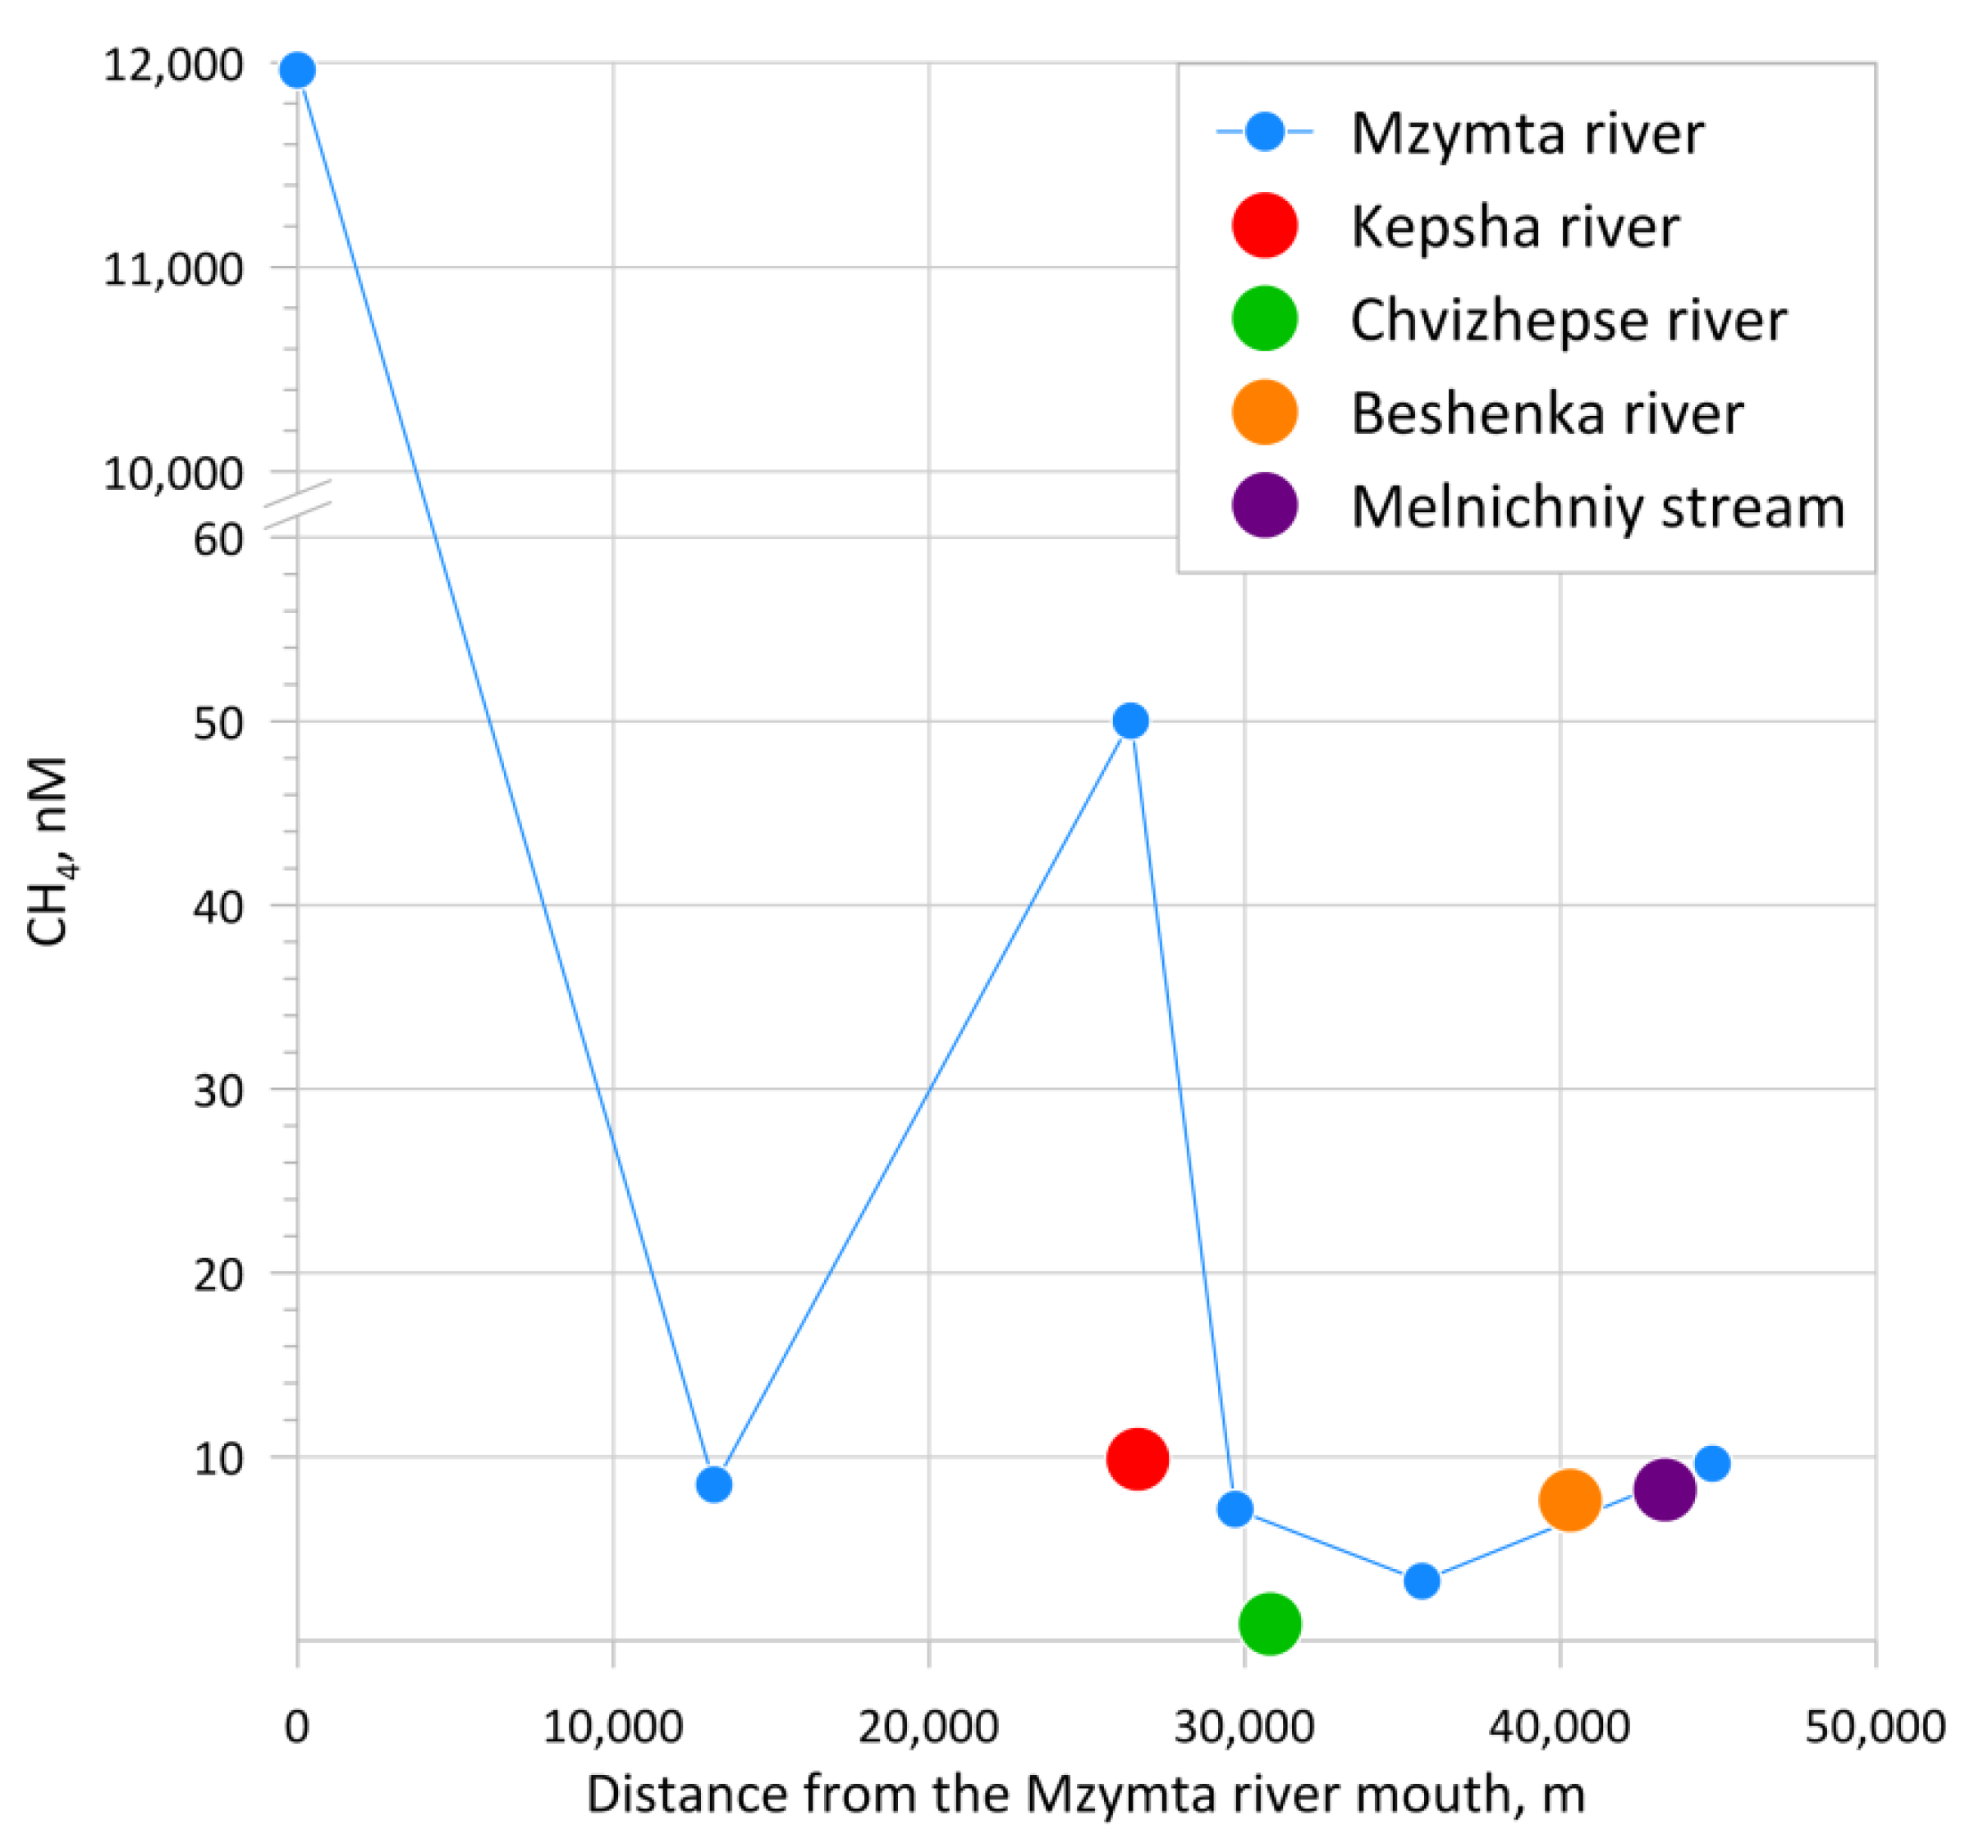
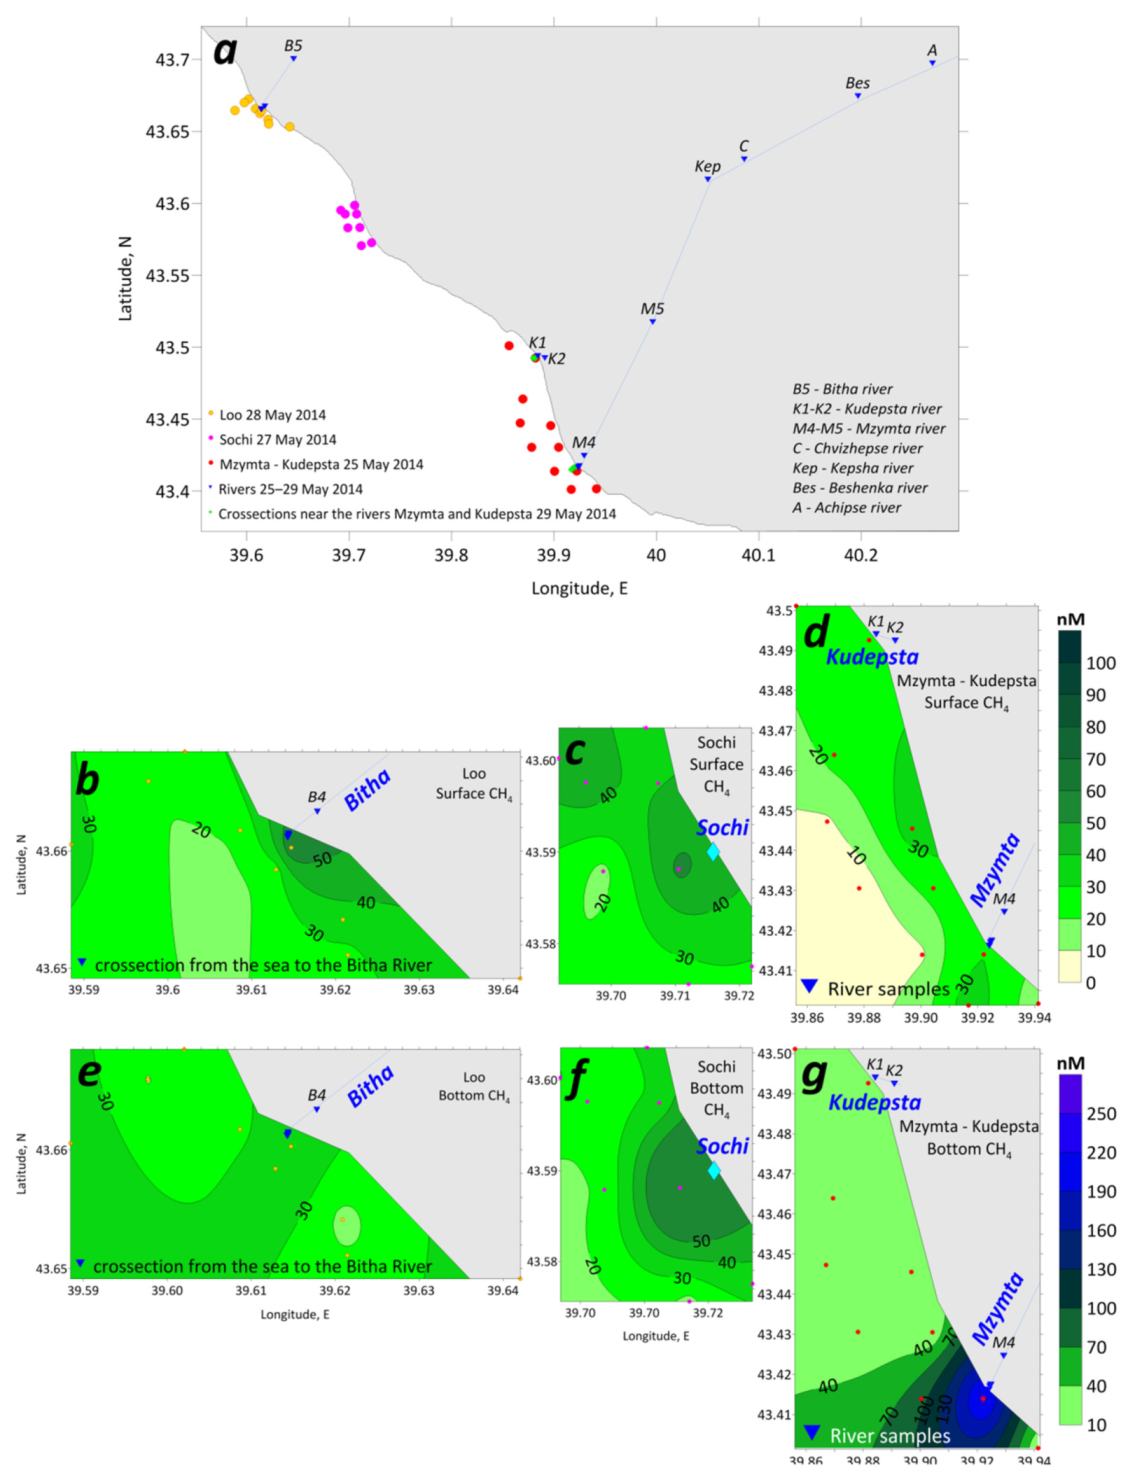
3.1. Sochi
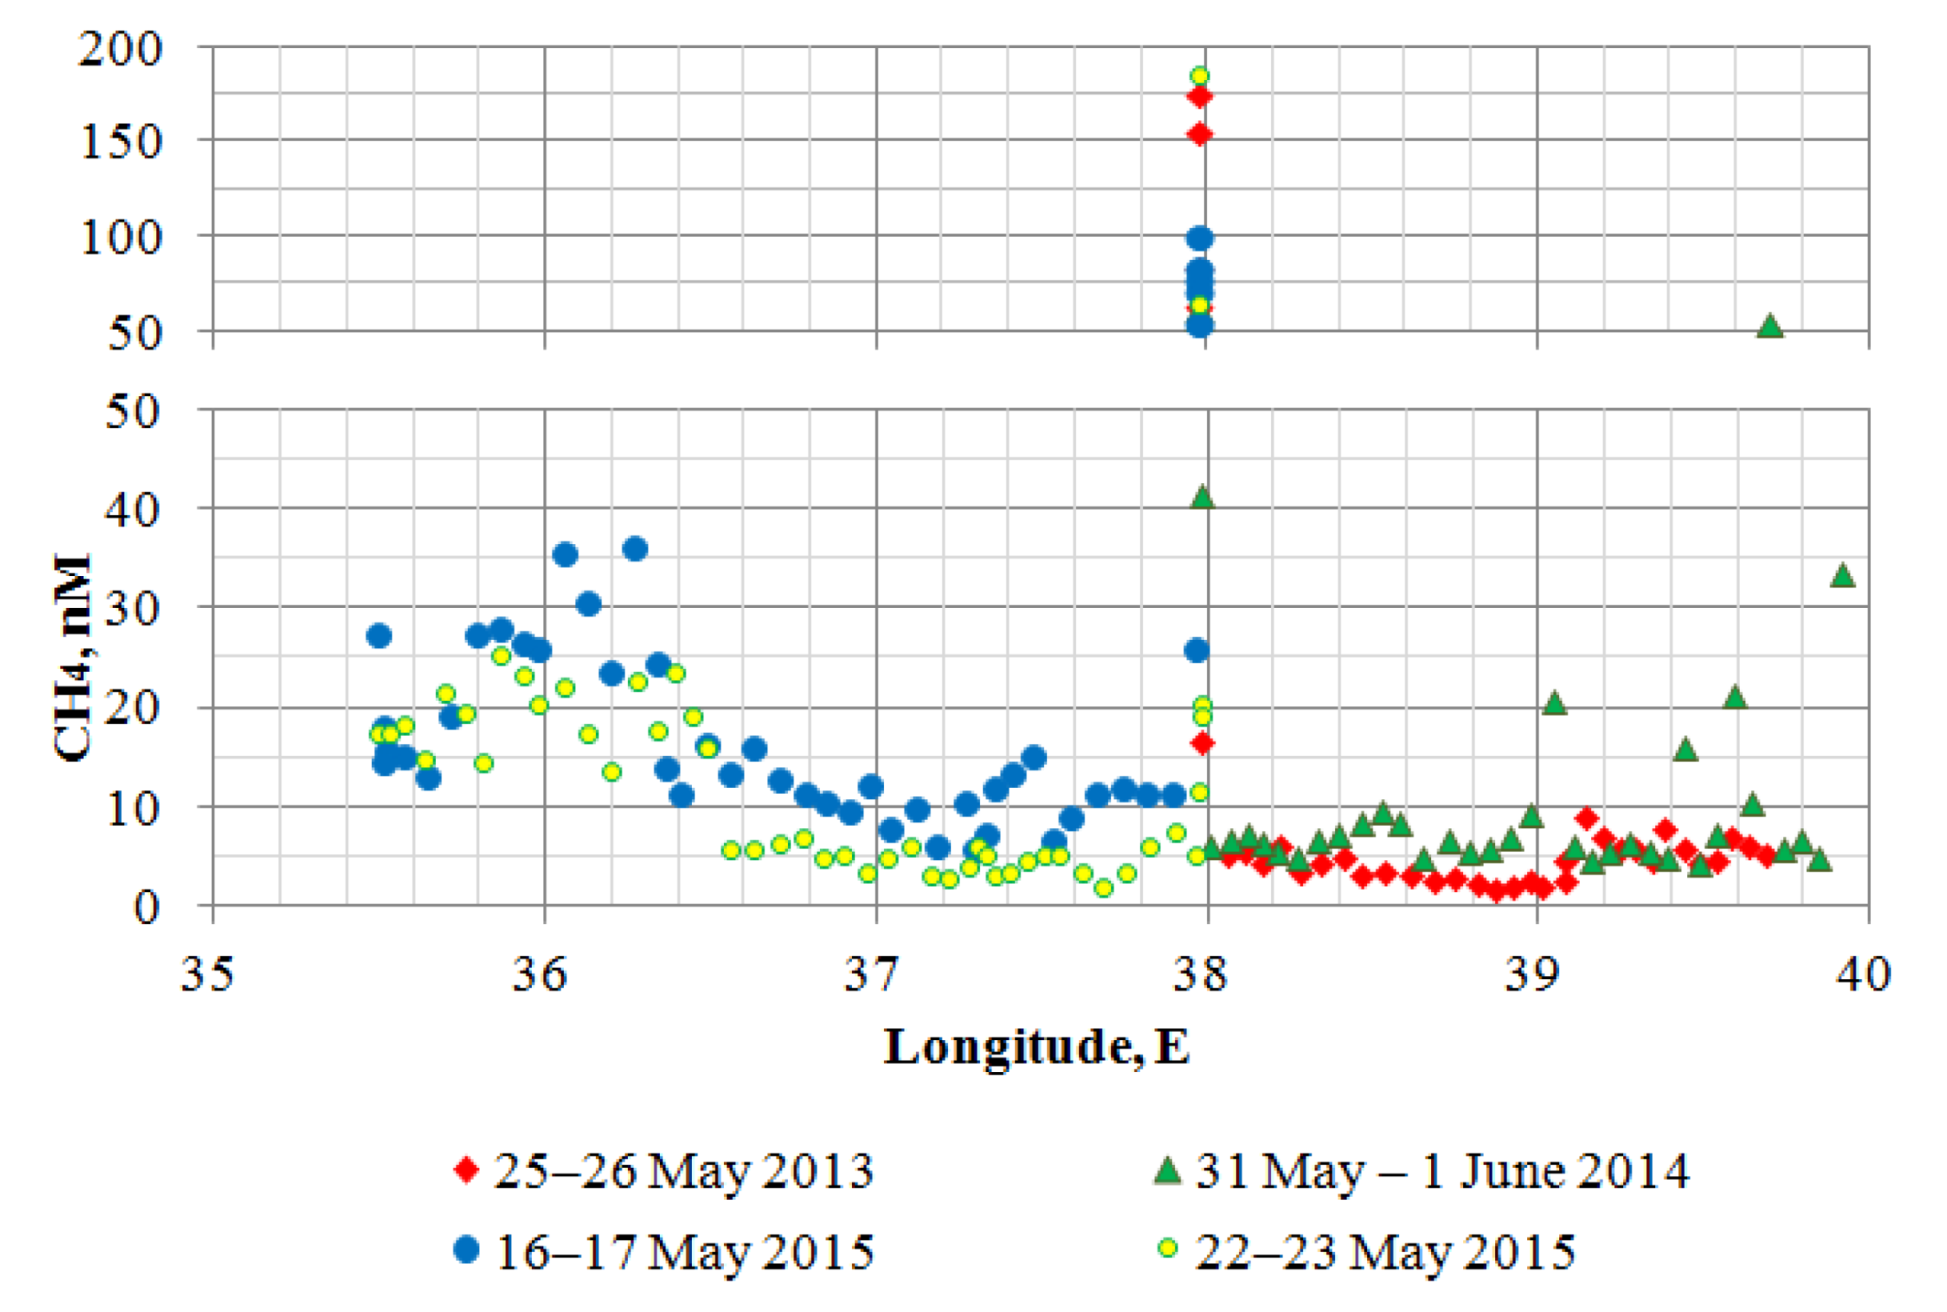
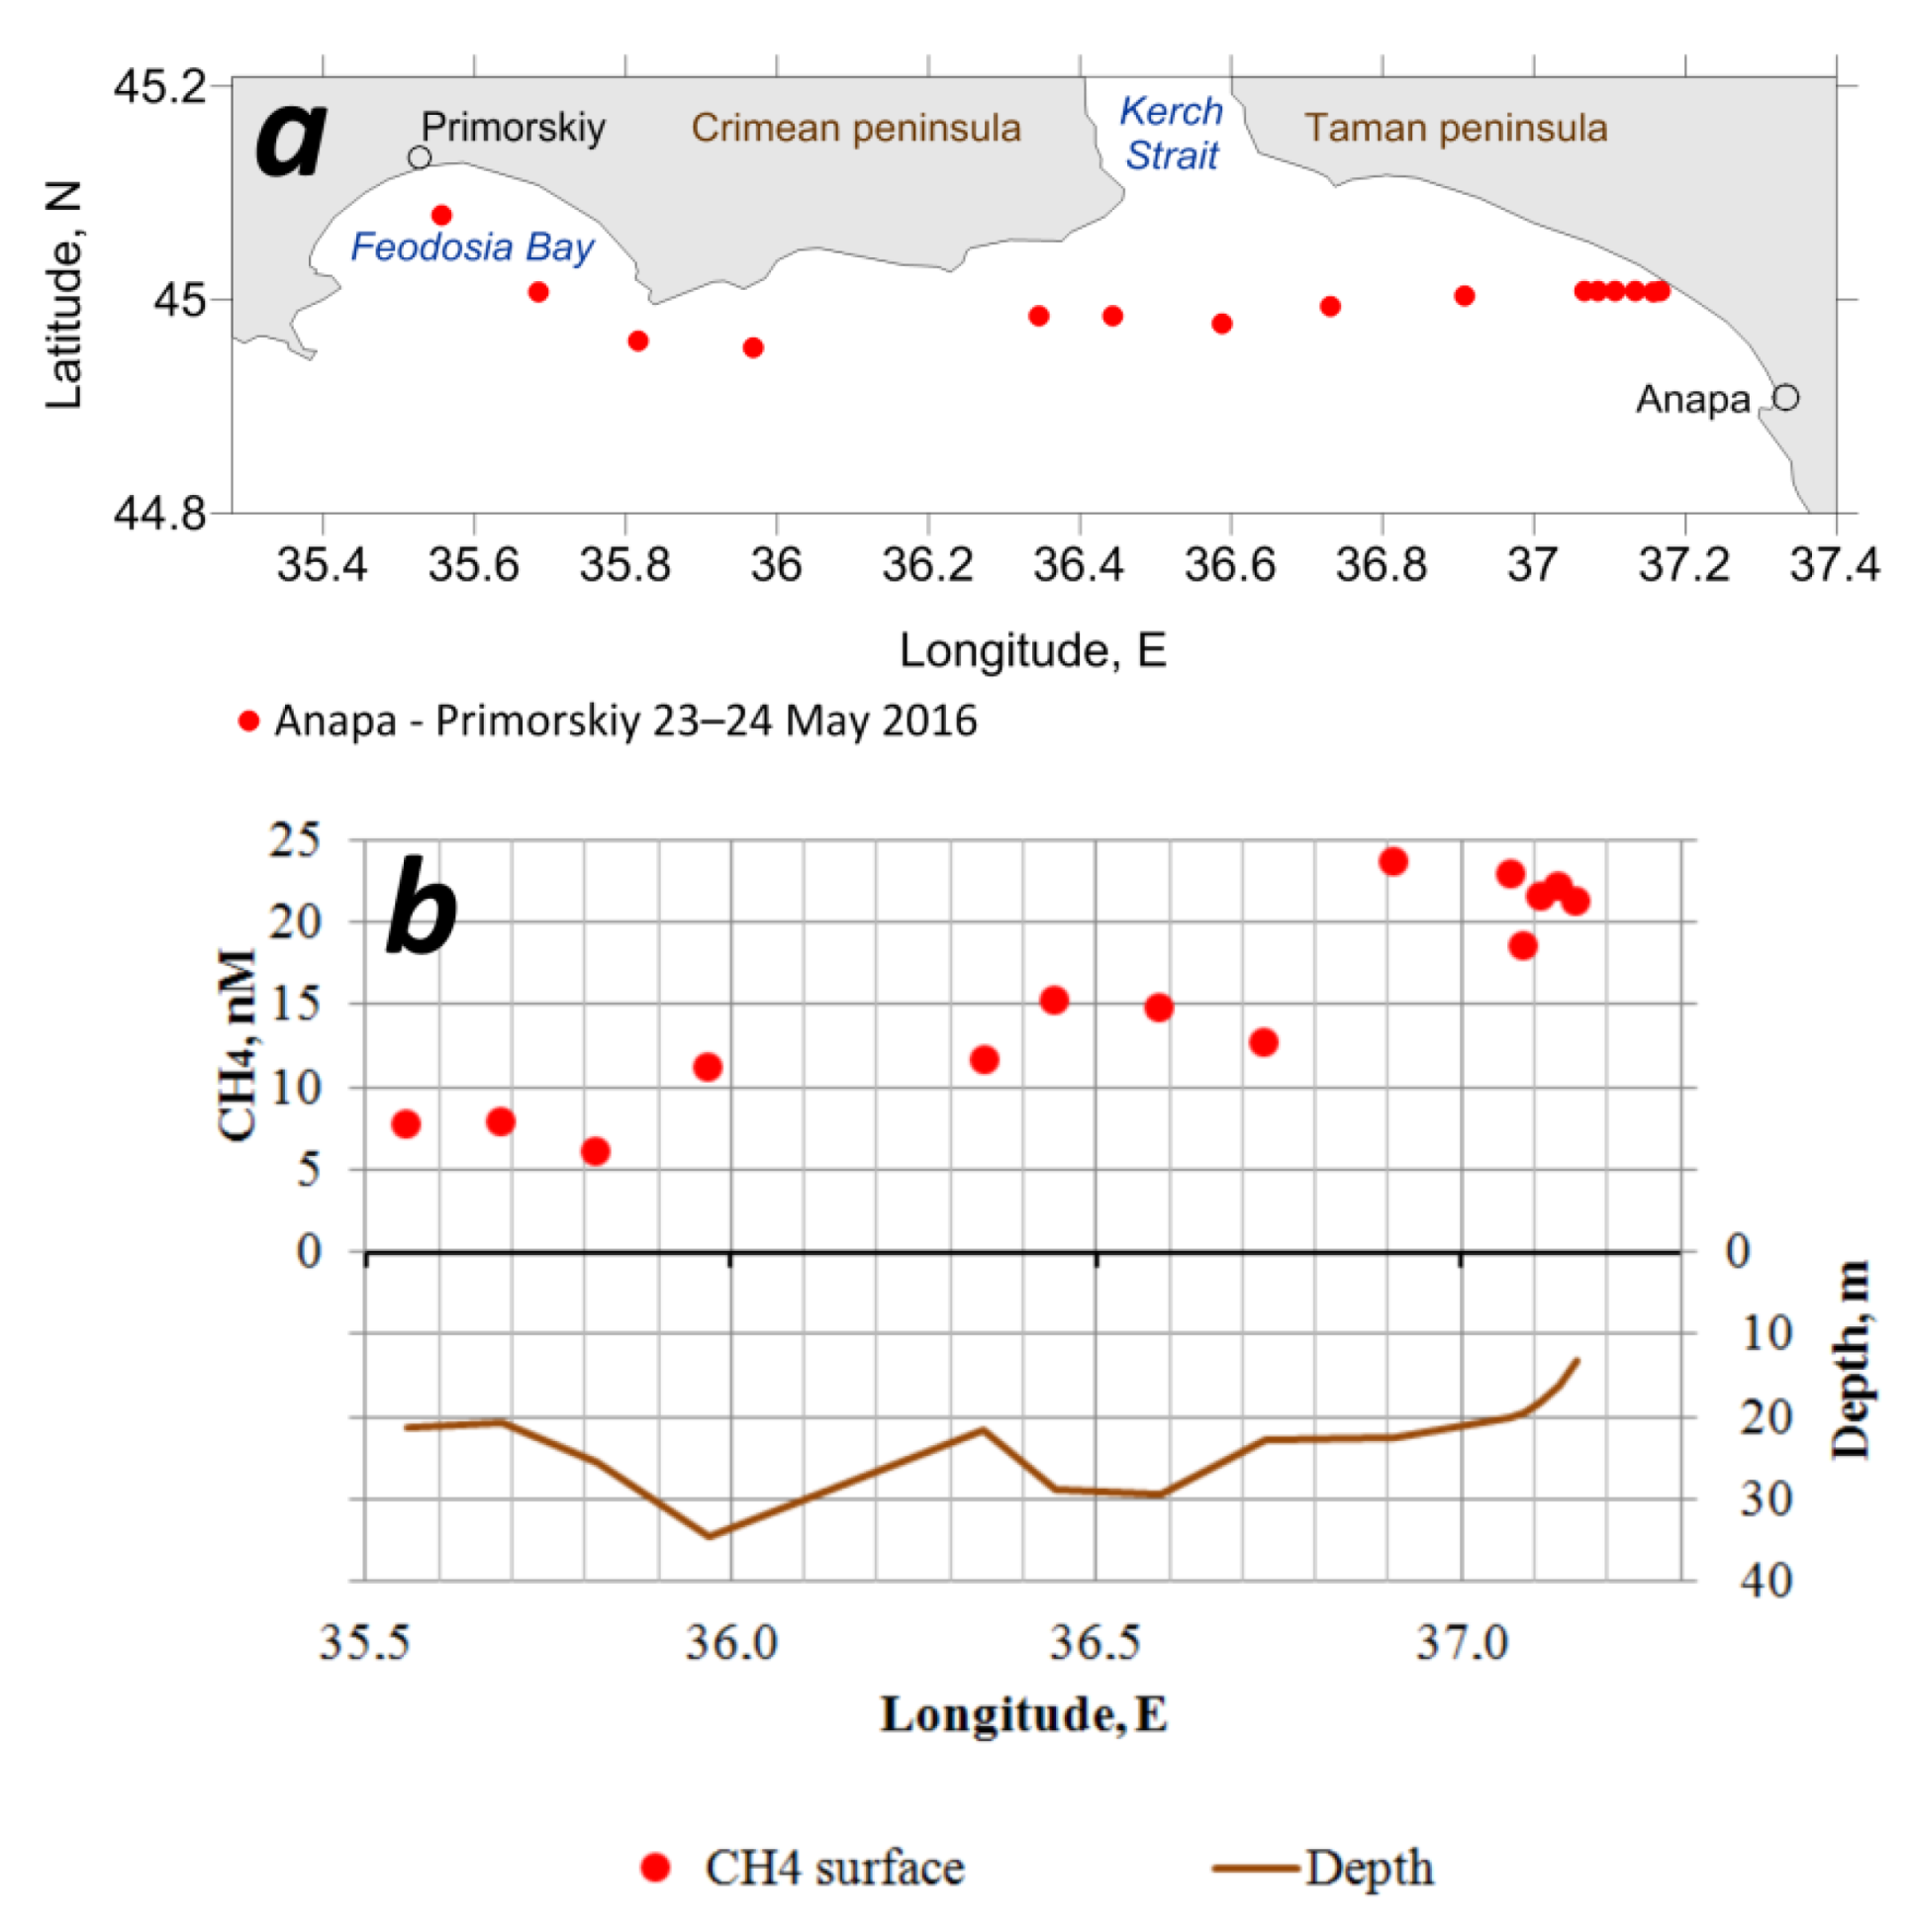
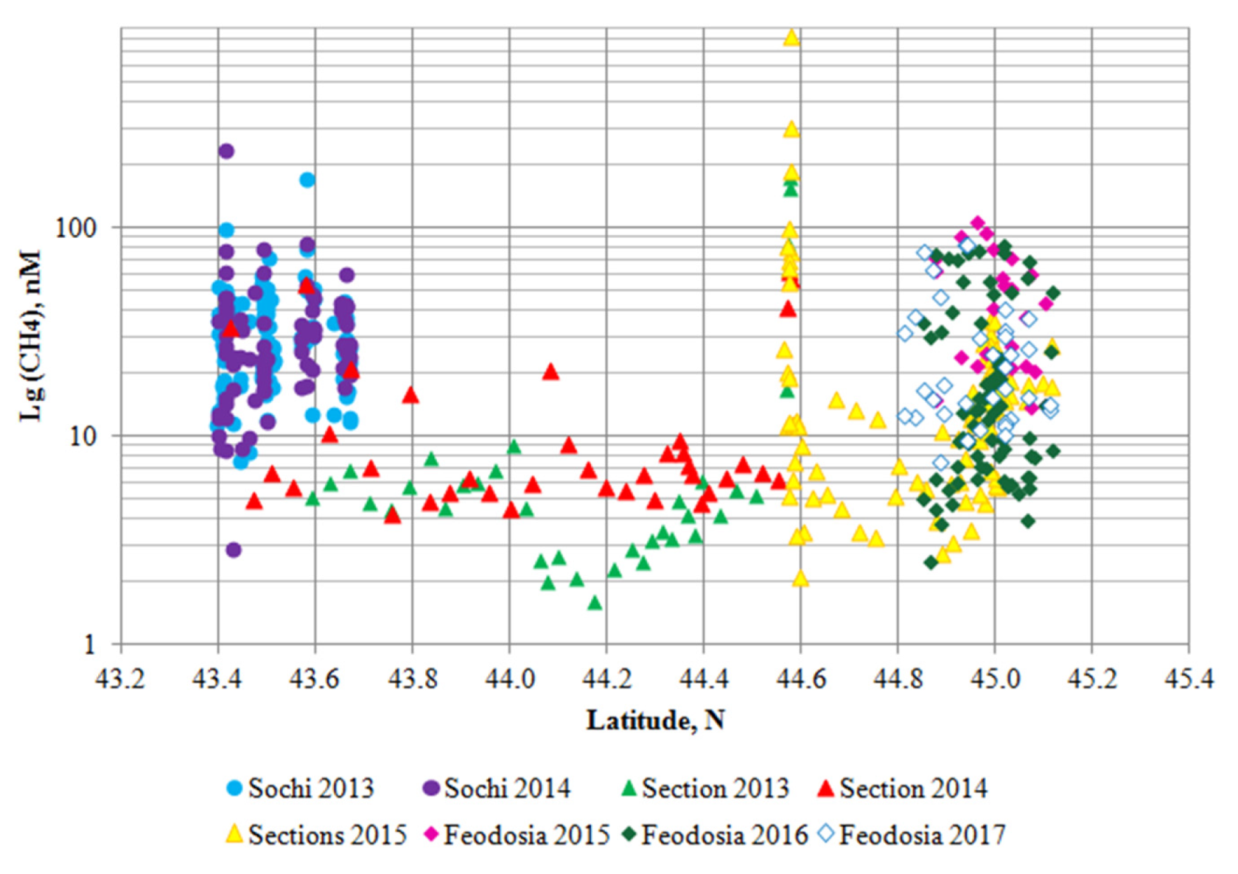
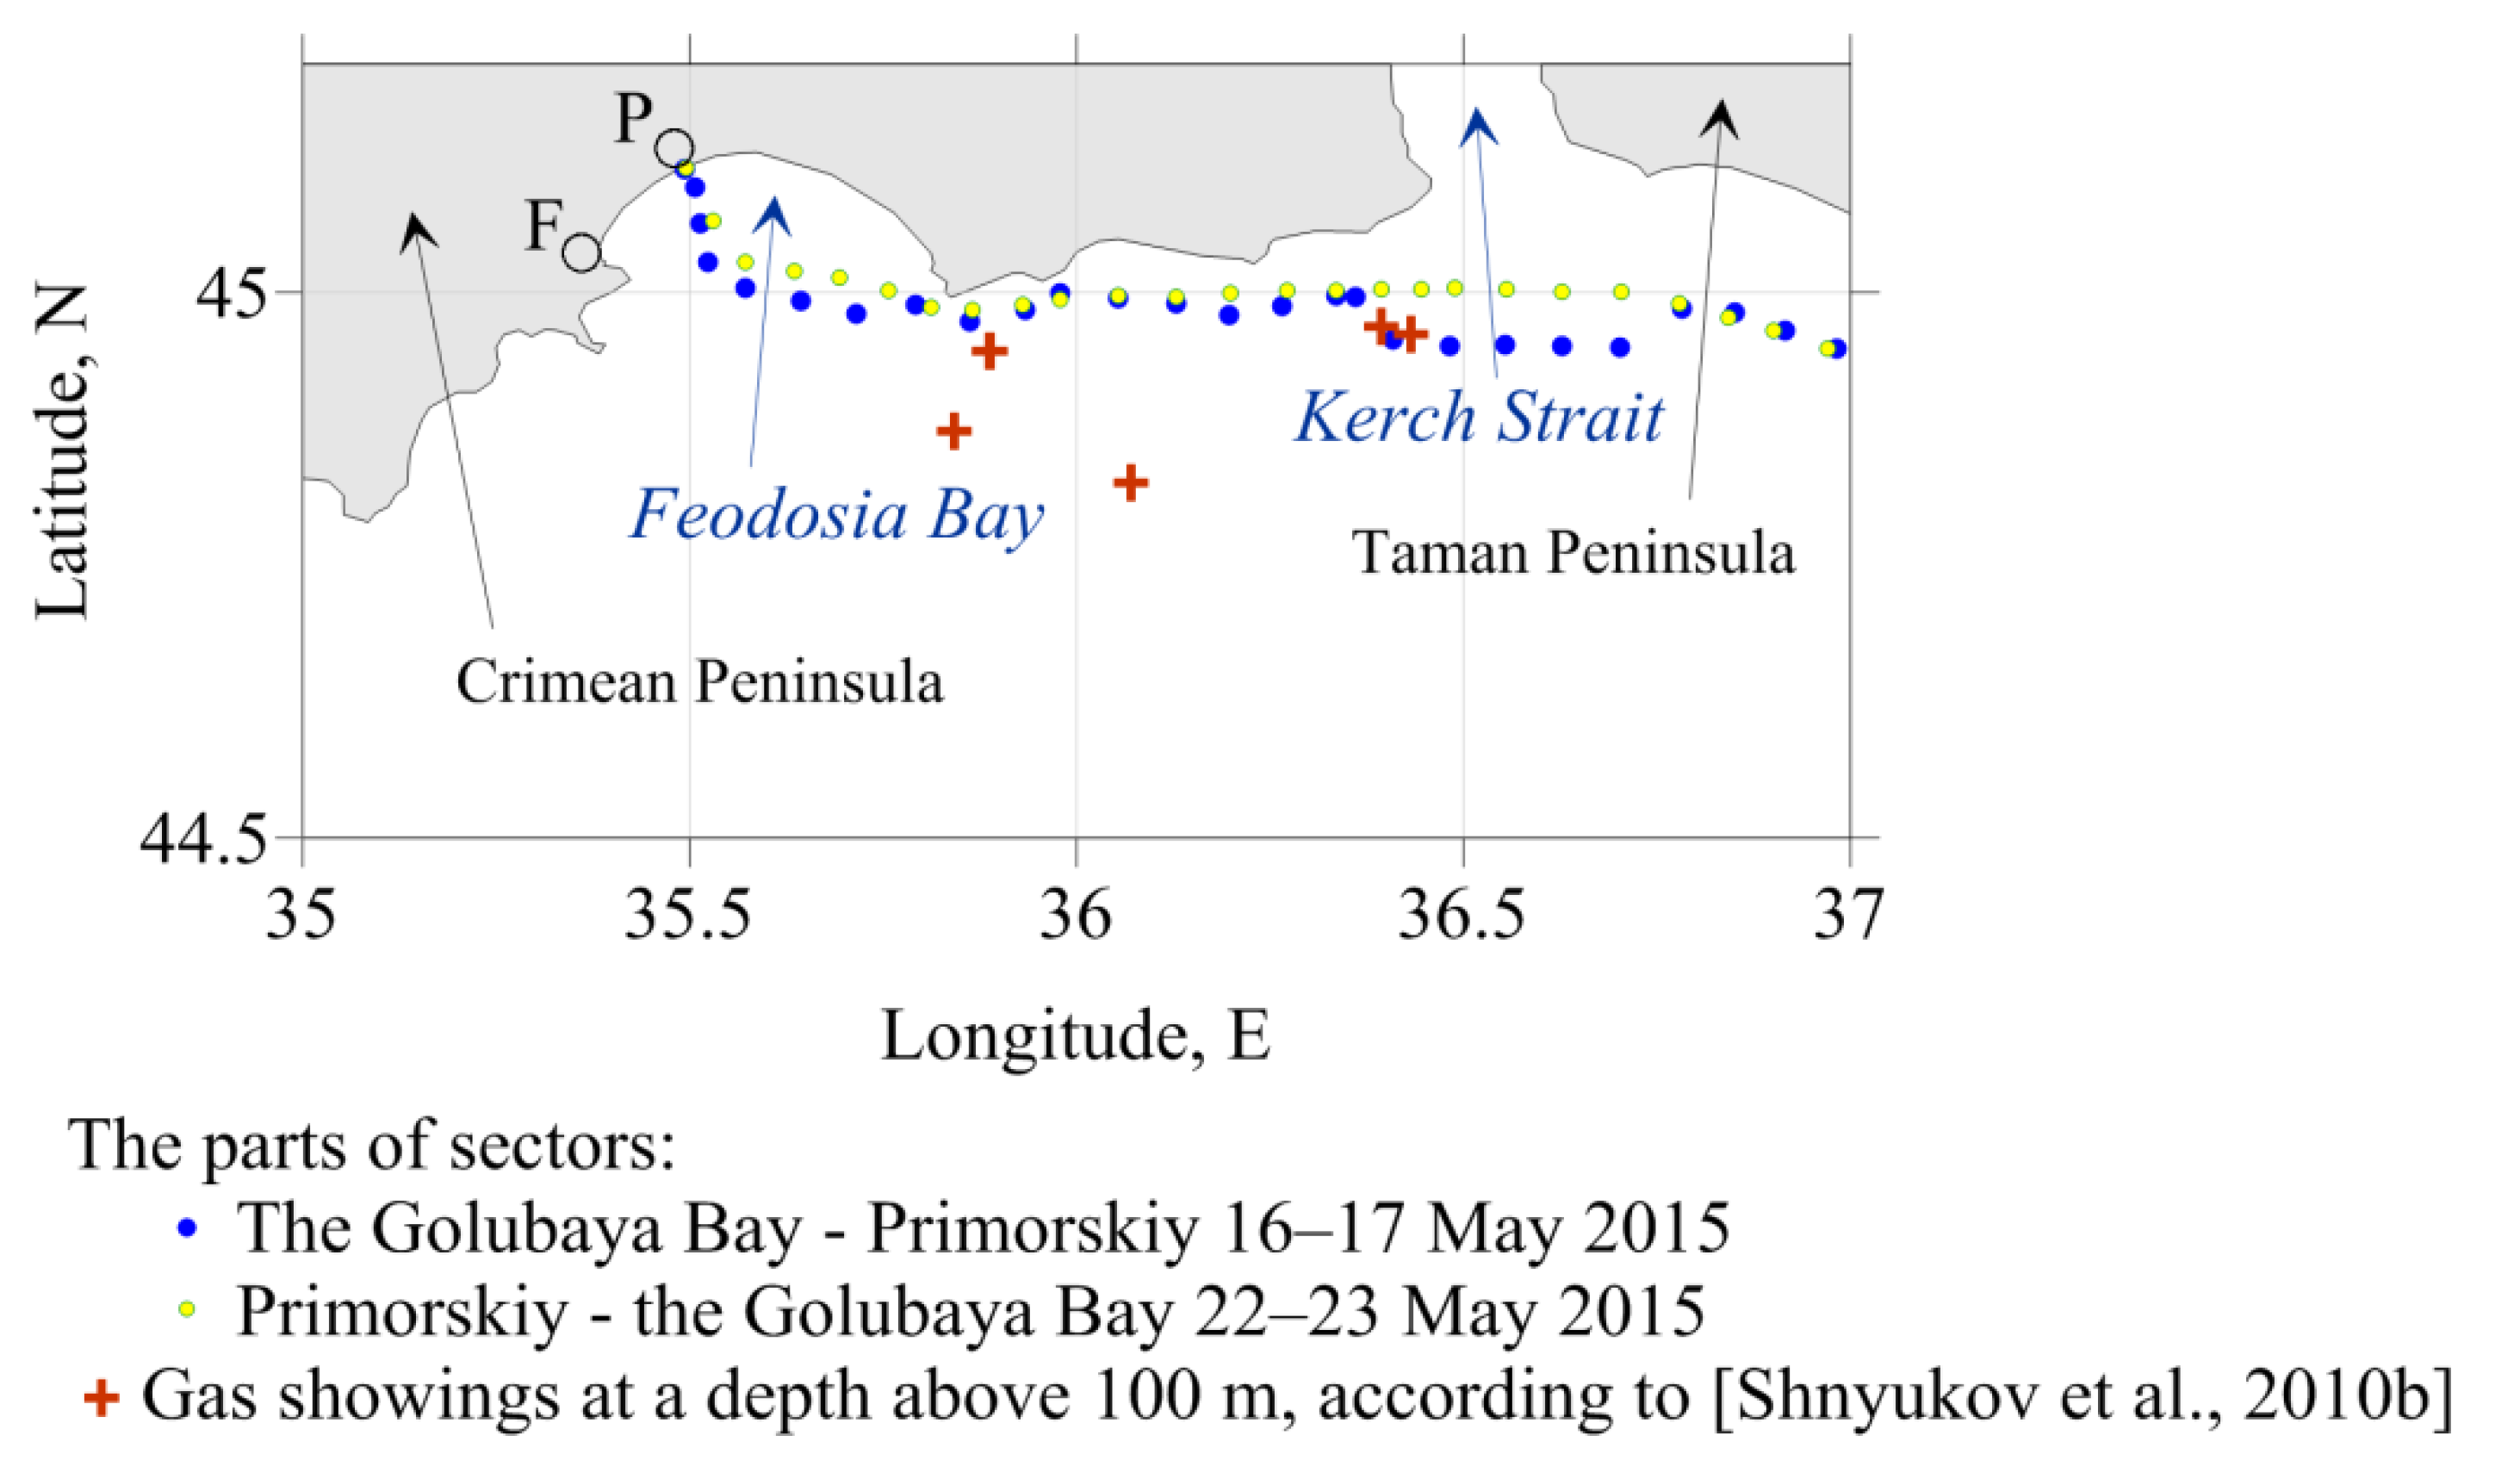
3.2. Along-Shore Sections from Sochi to Feodosia Bay
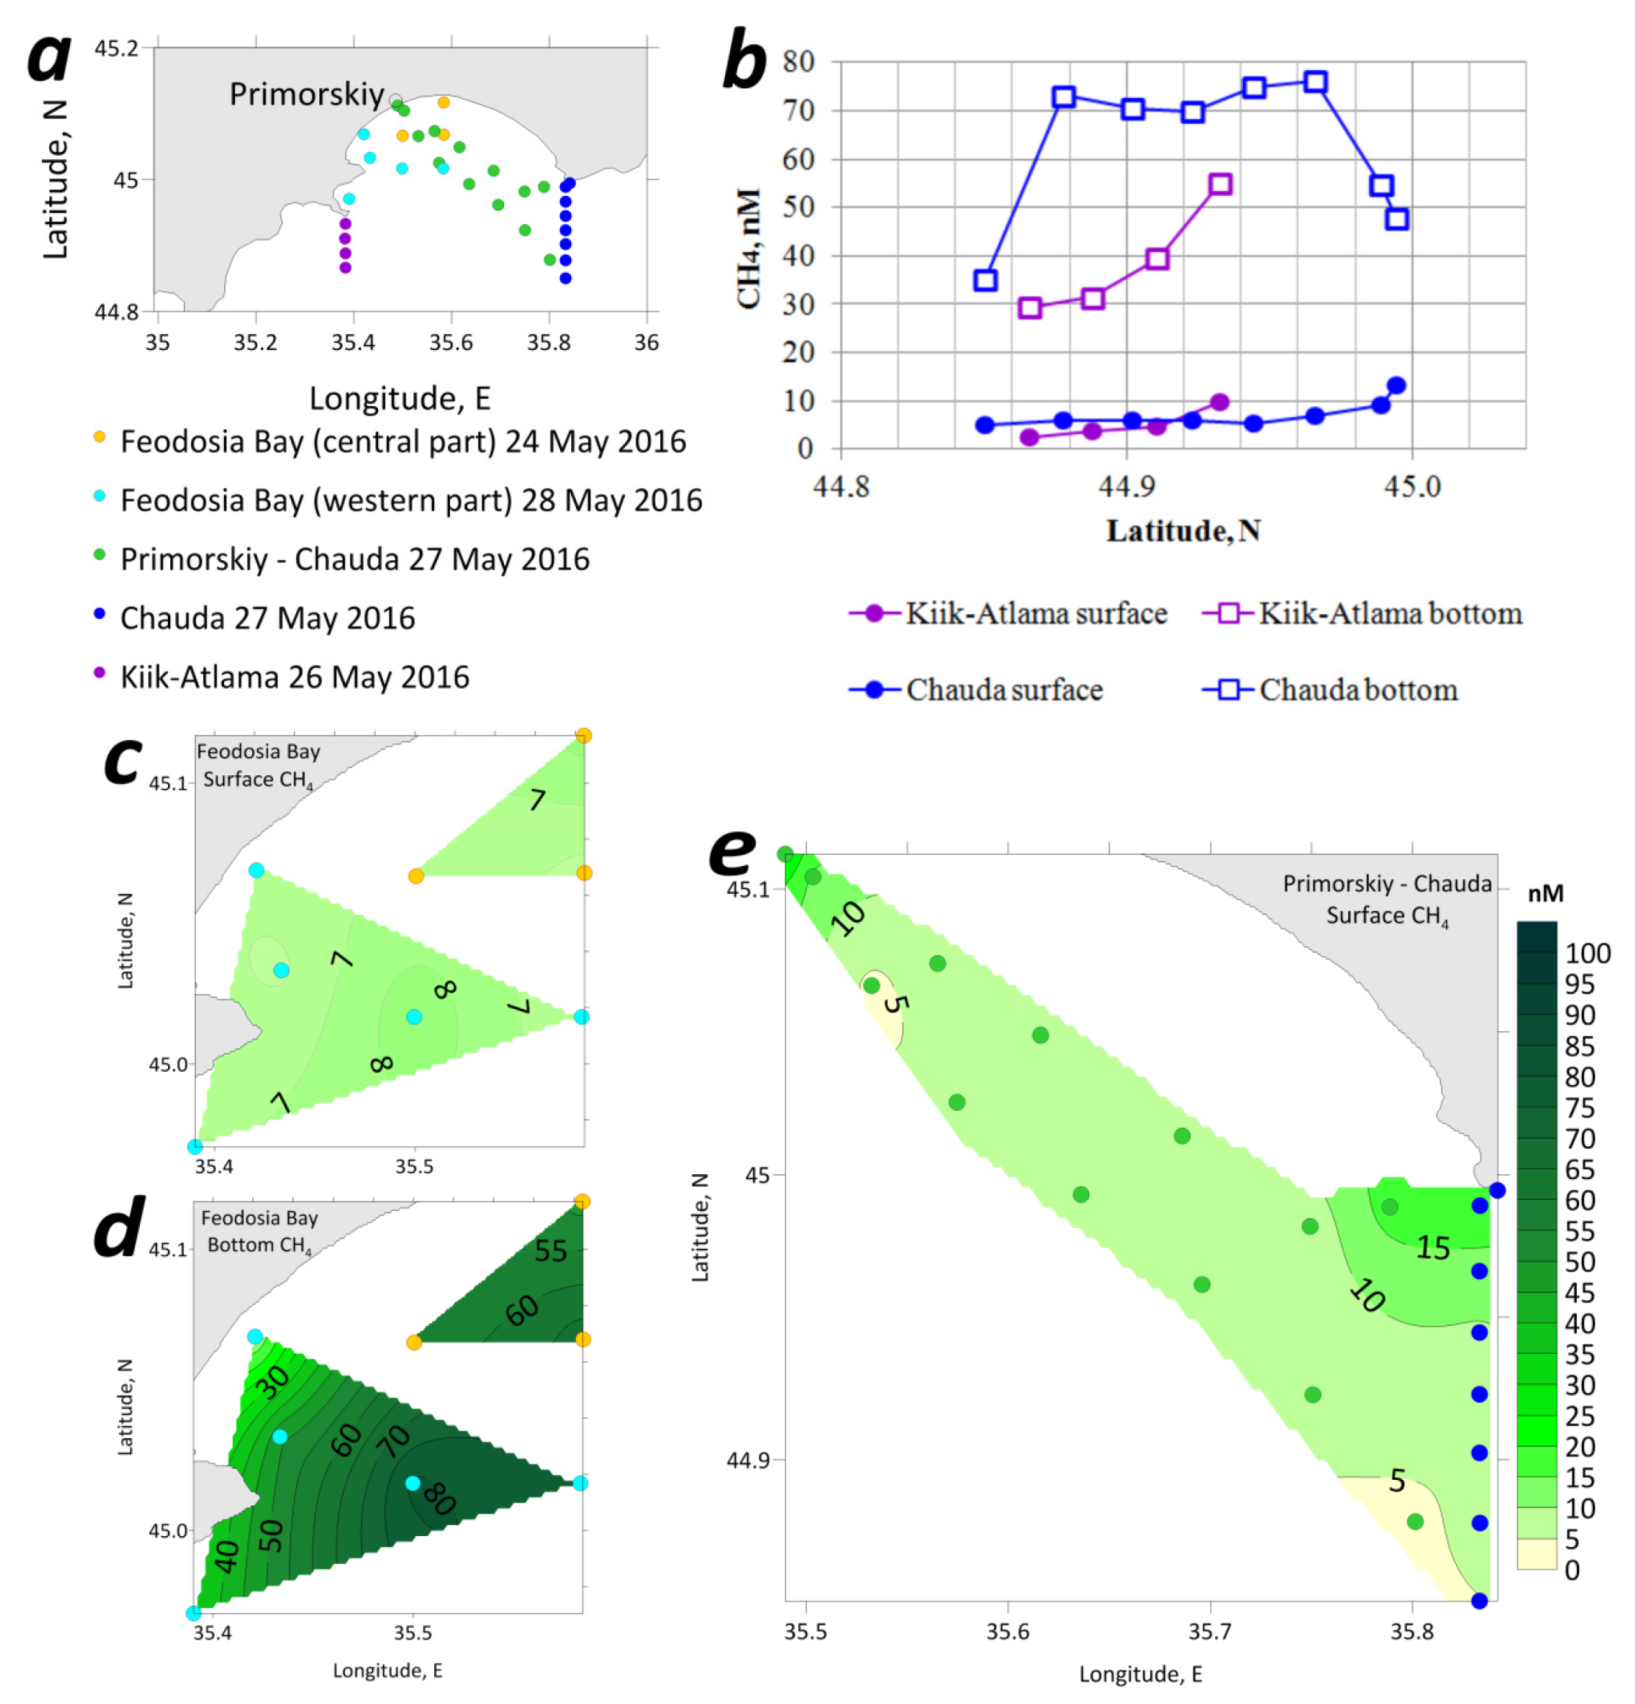
3.3. Feodosia Bay
4. Discussion
4.1. Sochi
4.2. Along-Shore Sections from Sochi to Feodosia Bay
4.3. Feodosia Bay
5. Conclusions
Supplementary Materials
Author Contributions
Funding
Institutional Review Board Statement
Informed Consent Statement
Data Availability Statement
Acknowledgments
Conflicts of Interest
References
- Kiene, R.P. Microbial Production and Consumption of Greenhouse Gases: Methane, Nitrogen Oxides, Halomethanes; Rogers, J.E., Whitman, W.B., Eds.; American Society for Microbiology: Washington, DC, USA, 1991; pp. 111–146. [Google Scholar]
- Karl, D.M.; Tilbrook, B.D. Production and transport of methane in oceanic particulate organic matter. Nature 1994, 368, 732. [Google Scholar] [CrossRef]
- Repeta, D.J.; Ferrón, S.; Sosa, O.A.; Johnson, C.G.; Repeta, L.D.; Acker, M.; DeLong, E.F.; Karl, D.M. Marine methane paradox explained by bacterial degradation of dissolved organic matter. Nat. Geosci. 2016, 9, 884. [Google Scholar] [CrossRef]
- Lein, A.Y.; Ivanov, M.V. The largest methane reservoir on the Earth. Priroda 2005, 2, 19–26. [Google Scholar]
- Dimitrov, P.; Dachev, V.; Nikolov, H.; Parlichev, D. Natural gas seepages in the offshore area of the Balchik Bay. Oceanology 1979, 4, 43–49. [Google Scholar]
- Amouroux, D.; Roberts, G.; Rapsomanikis, S.; Andreae, M.O. Biogenic gas (CH4, N2O, DMS) emission to the atmosphere from near-shore and shelf waters of the north-western Black Sea. Estuar. Coast. Shelf Sci. 2002, 54, 575–587. [Google Scholar] [CrossRef] [Green Version]
- Egorov, V.N.; Pimenov, N.V.; Malakhova, T.V.; Kanapatsky, T.A.; Artyomov, Y.G.; Malakhova, L.V. Biogeochemical characteristics of the distribution of methane in water and bottom sediments in places of jet gas evolution in the waters of the Sevastopol bays. Mar. Environ. J. 2012, 11, 41–52. (In Russian) [Google Scholar]
- Egorov, A.V.; Lobkovskii, L.I.; Kovachev, S.A.; Esina, E.A.; Marina, M.M.; Berlin, Y.M.; Levchenko, O.V.; Merklin, L.R. Methane anomaly in the waters of the Anapa shelf and its possible relation to oil-and-gas bearing structures. Oceanology 2008, 48, 68–76. [Google Scholar] [CrossRef]
- Egorov, V.N.; Artemov, Y.G.; Gulin, S.B. Metanovye Sipy v Chernom More: Sredoobrazujushchaja i Ekologicheskaja rol’ [The Methane Seeps in the Black Sea: Environment-Forming and Ecological Role]; NPC “EKOSI-Gidrofizika”: Sevastopol, Russia, 2011; 405p. (In Russian) [Google Scholar]
- Fedorov, Y.A.; Khoroshevskaya, V.O. Methane, mercury and hydrogen sulfide in water and bottom sediments of the northeast coast of the Black Sea. Izvestiya vysshikh uchebnykh zavedeniy. Severo-Kavkazskiy region. Yestestvennyye nauki. North Caucasus region. Nat. Sci. 2009, 5, 132–135. (In Russian) [Google Scholar]
- Rusanov, I.I.; Lein, A.Y.; Pimenov, N.V.; Yusupov, S.K.; Ivanov, M.V. The biogeochemical cycle of methane on the northwestern shelf of the Black Sea. Microbiology 2002, 71, 479–487. [Google Scholar] [CrossRef]
- Zavialov, P.O.; Makkaveev, P.N.; Konovalov, B.V.; Osadchiev, A.A.; Khlebopashev, P.V.; Pelevin, V.V.; Grabovskiy, A.B.; Izhitskiy, A.S.; Goncharenko, I.V.; Soloviev, D.M.; et al. Hydrophysical and hydrochemical characteristics of the sea areas adjacent to the estuaries of small rivers of the Russian coast of the Black Sea. Oceanology 2014, 54, 265–280. [Google Scholar] [CrossRef]
- Osadchiev, A.; Korshenko, E. Small river plumes off the northeastern coast of the Black Sea under average climatic and flooding discharge conditions. Ocean. Sci. 2017, 13, 465–482. [Google Scholar] [CrossRef] [Green Version]
- Izhitskiy, A.S.; Zavialov, P.O. 2017, Hydrophysical state of the Gulf of Feodosia in May. Oceanology 2015, 57, 485–491. [Google Scholar] [CrossRef]
- Zavialov, I.; Osadchiev, A.; Sedakov, R.; Barnier, B.; Molines, J.M.; Belokopytov, V. Water exchange between the Sea of Azov and the Black Sea through the Kerch Strait. Ocean. Sci. 2020, 16, 15–30. [Google Scholar] [CrossRef] [Green Version]
- Kondrat’ev, S.I. Dynamics of hydrochemical composition of waters in the Feodosia Bay as the result of water inflow from the sea of Azov during winter in 2006–2007. Ecol. Saf. Coast. Shelf Zones Complex Explor. Shelf Resour. 2009, 18, 30–38. [Google Scholar]
- Rusanov, I.I.; Yusupov, S.K.; Zasko, D.N.; Zakharova, E.E.; Anokhina, L.L.; Pimenov, N.V. On the Nature of Methane in the Aerobic Water Column of the Black Sea//Abstracts of the All-Russian Scientific and Practical Conference “Methane in Marine Ecosystems” (META MARE 2014); “ECOSI-Hydrophysics”: Sevastopol, Russia, 2014; pp. 106–109. (In Russian) [Google Scholar]
- Rusanov, I.I.; Zasko, D.N.; Zakharova, E.E.; Anokhina, L.L.; Yusupov, S.K.; Savvichev, A.S.; Lein, A.Y.; Ivanov, M.V.; Pimenov, N.V. Peculiarities in the distribution and genesis of methane in the aerobic water column of the Black and East Arctic Seas. Geology of the seas and oceans. Materials of the XXI International Scientific Conference (School) on marine geology. M GEOS 2015, 4, 82–86. (In Russian) [Google Scholar]
- Bolshakov, A.M.; Egorov, A.V. Methods of study of the gas composition of samples of water and bottom sediments. In Himicheskiy Analiz Morskih Osadkov [The Chemical Analysis of Water Sediments]; Nauka: Moscow, Russia, 1987; pp. 248–251. (In Russian) [Google Scholar]
- Kampbell, D.H.; Wilson, J.T.; Vandegrift, S.A. Dissolved oxygen and methane in water by a GC headspace equilibration technique. Int. J. Environ. Anal. Chem. 1989, 36, 249–257. [Google Scholar] [CrossRef]
- Wiesenburg, D.A.; Guinasso, N.L., Jr. Equilibrium solubilities of methane, carbon monoxide, and hydrogen in water and sea water. J. Chem. Eng. Data 1979, 24, 356–360. [Google Scholar] [CrossRef]
- De Angelis, M.A.; Lilley, M.D. Methane in surface waters of Oregon estuaries and rivers1. Limnol. Oceanogr. 1987, 32, 716–722. [Google Scholar] [CrossRef]
- Fedorov, Y.A.; Tambieva, N.S.; Garkusha, D.N.; Khoroshevskaya, V.O. Metan v vodnyh Ekosistemah [Methane in Water Ecosystems]; Rostizdat: Rostov-on-Don, Russia, 2005; 329p. (In Russian) [Google Scholar]
- Bordovskiy, O.K.; Ivanenkov, V.N. Chemistry of oceanic waters. In Okeanologija. Himija Okeana [Oceanology. Ocean Chemistry]; Nauka: Moscow, Russia, 1979; Volume 1, 518p. (In Russian) [Google Scholar]
- Reeburgh, W.S. Oceanic methane biogeochemistry. Chem. Rev. 2007, 107, 486–513. [Google Scholar] [CrossRef] [Green Version]
- Capone, D.G.; Kiene, R.P. Comparison of microbial dynamics in marine and freshwater sediments: Contrasts in anaerobic carbon catabolism. Limnol. Oceanogr. 1988, 33, 725–749. [Google Scholar] [CrossRef]
- Lasareva, E.V.; Parfenova, A.M.; Demina, T.S.; Romanova, N.D.; Belyaev, N.A.; Romankevich, E.A. Transport of the colloid matter of riverine runoff through estuaries. Oceanology 2017, 57, 520–529. [Google Scholar] [CrossRef]
- Martens, C.S.; Goldhaber, M.B. Early diagenesis in transitional sedimentary environments of the White Oak River Estuary, North Carolina. Limnol. Oceanogr. 1978, 23, 428–441. [Google Scholar] [CrossRef]
- Romankevich, E.A.; Vetrov, A.A. Fluxes and masses of organic carbon in the ocean. Geochem. Int. 1997, 35, 829–836. [Google Scholar]
- Vinogradov, M.E.; Vedernikov, V.I.; Romankevich, E.A.; Vetrov, A.A. Components of the carbon cycle in the Russian Arctic Seas: Primary production and flux of C org from the photic layer. Oceanology 2000, 40, 204–215. [Google Scholar]
- Shakhova, N.; Semiletov, I. Methane release and coastal environment in the East Siberian Arctic shelf. J. Mar. Syst. 2007, 66, 227–243. [Google Scholar] [CrossRef]
- Reeburgh, W.S.; Ward, B.B.; Whalen, S.C.; Sandbeck, K.A.; Kilpatrickt, K.A.; Kerkhof, L.J. Black Sea methane geochemistry. Deep Sea Res. Part A Oceanogr. Res. Pap. 1991, 38, S1189–S1210. [Google Scholar] [CrossRef] [Green Version]
- Lomakin, P.D.; Chepyzhenko, A.I.; Chepyzhenko, A.A. Estimation of the concentration of dissolved oil products in coastal waters of the Crimea based on optical measurements. Ekologicheskaja Bezopasnost’ Pribrezhnoj i Shel’fovoj zon i Kompleksnye Issledovanija Resursov Shel’fa (Ecol. Saf. Coast. Shelf Zones Complex Investig. Shelf Resour.) 2006, 14, 245–258. (In Russian) [Google Scholar]
- Shimkus, K.M.; Moskalenko, V.N.; Ryan, W.B.F.; Pitman, W.C., III. Gas-bearing Quaternary sediments of the Kerch area of the Black Sea shelf and their relation with the coastal lithofacies. Bjulleten’ Moskovskogo Obshchestva Ispytatelej Prirody Otdelenie Geologii (Bull. Mosc. Soc. Nat. Dep. Geol.) 1998, 73, 51–55. (In Russian) [Google Scholar]
- Shnyukov, E.F.; Emelyanov, V.A.; Kuznetsov, A.S.; Kukovskaya, T.S.; Shchiptsov, A.A. Geological and geochemical studies in the 65th cruise of the RV “Professor Vodyanitskiy” in the Black Sea (July–August 2010). Geologija i Poleznye Iskopaemye Mirovogo Okeana [Geol. Miner. Resour. World Ocean] 2010, 3, 94–98. (In Russian) [Google Scholar]
- Shnyukov, E.F.; Pasynkov, A.A.; Lyubitskiy, A.A.; Inozemtsev, Y.I.; Rybak, E.N.; Kuznetsov, A.S. Mud volcanoes on the Kerch area of shelf and slope of the Black Sea. Geologija i Poleznye Iskopaemye Mirovogo Okeana [Geol. Miner. Resour. World Ocean] 2010, 3, 28–36. (In Russian) [Google Scholar]
- Shnyukov, E.F.; Sobolevskiy, Y.V.; Gnatenko, G.I.; Naumenko, P.I.; Kutniy, V.A. Grjazevye vulkany Kerchensko-Tamanskoj oblasti: Atlas [Mud volcanoes of the Kerch-Taman region: Atlas]; Naukova Dumka: Kiev, Ukraine, 1986; 152p. (In Russian) [Google Scholar]
- Kruglyakova, R.P.; Kruglyakova, M.V.; Shevtsova, N.T. Geological and geochemical characteristics of natural hydrocarbon showings in the Black Sea. Geologija i Poleznye Iskopaemye Mirovogo Okeana [Geol. Miner. Resour. World Ocean] 2009, 1, 37–51. (In Russian) [Google Scholar]
- Khoroshevskaya, V.O. Patterns of formation and distribution of methane in the coastal waters of the Azov-Black Sea basin. In Extended Abstract of PhD Dissertation; Southern Federal University: Rostov-on-Don, Russia, 2010. (In Russian) [Google Scholar]
- Scranton, M.I.; Brewer, P.G. Occurrence of methane in the near-surface waters of the western subtropical North-Atlantic. Deep Sea Res. 1977, 24, 127–138. [Google Scholar] [CrossRef]
- Reeburgh, W.S.; Heggie, D.T. Microbial methane consumption reactions and their effect on methane distributions in freshwater and marine environments 1. Limnol. Oceanogr. 1977, 22, 1–9. [Google Scholar] [CrossRef] [Green Version]


Publisher’s Note: MDPI stays neutral with regard to jurisdictional claims in published maps and institutional affiliations. |
© 2022 by the authors. Licensee MDPI, Basel, Switzerland. This article is an open access article distributed under the terms and conditions of the Creative Commons Attribution (CC BY) license (https://creativecommons.org/licenses/by/4.0/).
Share and Cite
Izhitskaya, E.S.; Egorov, A.V.; Izhitskiy, A.S.; Möller, O.O., Jr.; Zavialov, P.O. Dissolved Methane in Coastal Waters of the Northeastern Black Sea. Water 2022, 14, 732. https://doi.org/10.3390/w14050732
Izhitskaya ES, Egorov AV, Izhitskiy AS, Möller OO Jr., Zavialov PO. Dissolved Methane in Coastal Waters of the Northeastern Black Sea. Water. 2022; 14(5):732. https://doi.org/10.3390/w14050732
Chicago/Turabian StyleIzhitskaya, Elena S., Alexander V. Egorov, Alexander S. Izhitskiy, Osmar O. Möller, Jr., and Peter O. Zavialov. 2022. "Dissolved Methane in Coastal Waters of the Northeastern Black Sea" Water 14, no. 5: 732. https://doi.org/10.3390/w14050732
APA StyleIzhitskaya, E. S., Egorov, A. V., Izhitskiy, A. S., Möller, O. O., Jr., & Zavialov, P. O. (2022). Dissolved Methane in Coastal Waters of the Northeastern Black Sea. Water, 14(5), 732. https://doi.org/10.3390/w14050732