Article

Long-Term 10 m Resolution Water Dynamics of Qinghai Lake and the Driving Factors

1
Shaanxi Key Laboratory of Earth Surface System and Environmental Carrying Capacity, Northwest University, Xi’an 710127, China
2
College of Urban and Environmental Sciences, Northwest University, Xi’an 710127, China
3
Institute of Earth Surface System and Hazards, Northwest University, Xi’an 710127, China
*
Author to whom correspondence should be addressed.
Water 2022, 14(4), 671; https://doi.org/10.3390/w14040671
Submission received: 25 December 2021 / Revised: 16 February 2022 / Accepted: 18 February 2022 / Published: 21 February 2022

Abstract

:
As the largest inland saltwater lake in China, Qinghai Lake plays an important role in regional sustainable development and ecological environment protection. In this study, we adopted a spatial downscaling model for mapping lake water at 10 m resolution through integrating Sentinel-2 and Landsat data, which was applied to map the water extent of Qinghai Lake from 1991 to 2020. This was further combined with the Hydroweb water level dataset to establish an area-level relationship to acquire the 30-year water level and water volume. Then, the driving factors of its water dynamics were analyzed based on the grey system theory. It was found that the lake area, water level, and water volume decreased from 1991 to 2004, but then showed an increasing trend afterwards. The lake area ranges from 4199.23 to 4494.99 km2. The water level decreased with a speed of ~0.05 m/a before 2004 and then increased with a speed of 0.22 m/a thereafter. Correspondingly, the water volume declined by 5.29 km3 in the first 13 years, and rapidly increased by 15.57 km3 thereafter. The correlation between climatic factors and the water volume of Qinghai Lake is significant. Precipitation has the greatest positive impact on the water volume variation with the relational grade of 0.912, while evaporation has a negative impact.

1. Introduction

Lakes are an important part of global hydrological and ecological processes [1,2,3], providing humans with indispensable resources and services, including drinking water supply, agricultural production, transportation, recreation, fishery, etc. [4,5]. Ongoing global warming and climatic change [6] is enhancing the global hydrological cycle and affecting water availability. As a result, efficient management of water resources is needed [7,8]. Warming-induced hydrological cycle intensification and its impacts on local and global ecosystems have brought increasing attention to the links between climatic change/variability, hydrological processes, and water resources across various temporal and spatial scales during the last few decades [9,10]. Therefore, understanding the hydrological changes of lakes and their potential driving factors can provide insights into lake conservation and water resource management [11,12]. As the largest inland saltwater lake in China, Qinghai Lake is located at the northeastern part of the Tibetan Plateau, which is extremely sensitive to climate change and plays a crucial role in maintaining the regional hydrological cycle [13]. Therefore, monitoring the long-term dynamics of Qinghai Lake and analyzing its driving factors are of great significance for local sustainable development and ecological environment protection.
Remote sensing provides an effective way of monitoring surface water, mainly in the forms of microwave remote sensing and optical remote sensing. Microwave remote sensing is powerful due to its less atmospheric effect and all-weather observation [14], while optical remote sensing is widely used because of the data availability and appropriate spatial and temporal resolutions [15]. For example, high temporal resolution multispectral data, including MODIS and AVHRR, have been widely used to detect the seasonal and inter-annual changes of lakes in the Tibetan Plateau [16], bearing in mind that the coarse resolution may cause a lack of water extraction details and low accuracy at a regional scale [17,18], while higher spatial resolution remote sensing data (e.g., Landsat imagery) make it possible to accurately detect and delineate the water body information [19,20,21,22]. For example, Cui et al. [23] analyzed the coastline change of Qinghai Lake and its surrounding lakes from 1973 to 2015 by utilizing multitemporal Landsat imagery. Zhang et al. [24] estimated the water balances of the ten largest lakes in China using ICESat and Landsat data between 2003 and 2009. They proved that satellite remote sensing could serve as a fast and effective tool for estimating lake water balance. Although Landsat imagery has higher spatial resolution in comparison with MODIS or AVHRR, the accuracy of water body extraction was still limited by its 30 m resolution. Sentinel-2 satellites are able to obtain multispectral remote sensing data with a higher spatial resolution of up to 10 m, which is assumed to be better for mapping surface water [25]. Existing research, such as Du et al. [26] and Yang et al. [27], has demonstrated that Sentinel-2 data can provide more explicit and accurate surface water information with the advantages of intensively and continuously monitoring the surface of the Earth and higher spatial resolution. However, as this is a recent satellite mission, its data have a relatively short time series, which fails to meet the requirements of long-term analysis of lake water dynamics.
The mixed pixel issue usually hinders the accurate drawing and monitoring of lake water. There are two popular methods to alleviate mixed pixel issues, pixel unmixing and reconstruction, and spatial and temporal fusion [25]. The purpose of pixel unmixing and reconstruction is to achieve higher resolution land cover mapping from coarse-resolution data under the assumption that each mixed pixel can be expressed in the form of certain combinations of a number of pure spectral signatures [25]. Spatial and temporal fusion (spatio-temporal fusion) aims to blend high spatial resolution data with high temporal resolution data to achieve both high spatial and high temporal resolutions [28,29,30,31], so that the mixed pixel issue of the coarse spatial resolution data can be alleviated. Wu et al. [32] proposed a downscaling algorithm that established a statistical regression model between MODIS and Landsat data for generating a higher resolution inundation map from MODIS. Through this downscaling process, they managed to generate 30 m water maps from coarse resolution MODIS data while keeping their high temporal resolution. It was proved that the downscaled water maps provide more spatial details and have higher accuracy.
The rapid development of remote sensing technology also brings new ideas for monitoring lake water volume changes. This can be achieved by combing the lake area derived from optical remote sensing and water level estimated by satellite altimetry data. Satellite radar/laser altimeters such as TOPEX/POSEIDON, ENVISAT, JASON-1, and ICESat/GLAS have been successfully applied for monitoring lake level variations [33,34,35,36]. For example, Zhang et al. [37] utilized Landsat and ICESat datasets to examine annual changes in lake area, level, and volume of the Tibetan Plateau and explored the reasons for the lake water volume changes from the 1970s to 2015. The Hydroweb, maintained by LEGOS/GOHS in France, provides water level/area information derived from a combination of multiple altimetry satellite observations of more than 150 inland lakes and reservoirs [38], which serves as a useful data source for lake monitoring. For example, Liu et al. [39] combined the Hydroweb and Landsat data recorded from 1975 to 2015 to evaluate water volume variations and the water balance of Taihu Lake.
In this study, we aim to achieve a long-term and high-resolution analysis of the water variation of Qinghai Lake in the past 30 years. To fulfil this objective, we adopt Wu et al.’s [32] downscaling method to generate 10 m resolution water maps from a long-term Landsat image series, with Sentinel-2 data as the auxiliary. To facilitate the computation, we implement this method on Google Earth Engine (GEE) [40], an advanced remote sensing cloud computing platform for large-scale and long-term remote sensing analysis and processing. We also want to combine the long-term water area variation with water level information to estimate the water volume dynamics of Qinghai Lake, and ultimately analyze the driving factors.

2. Study Area and Materials
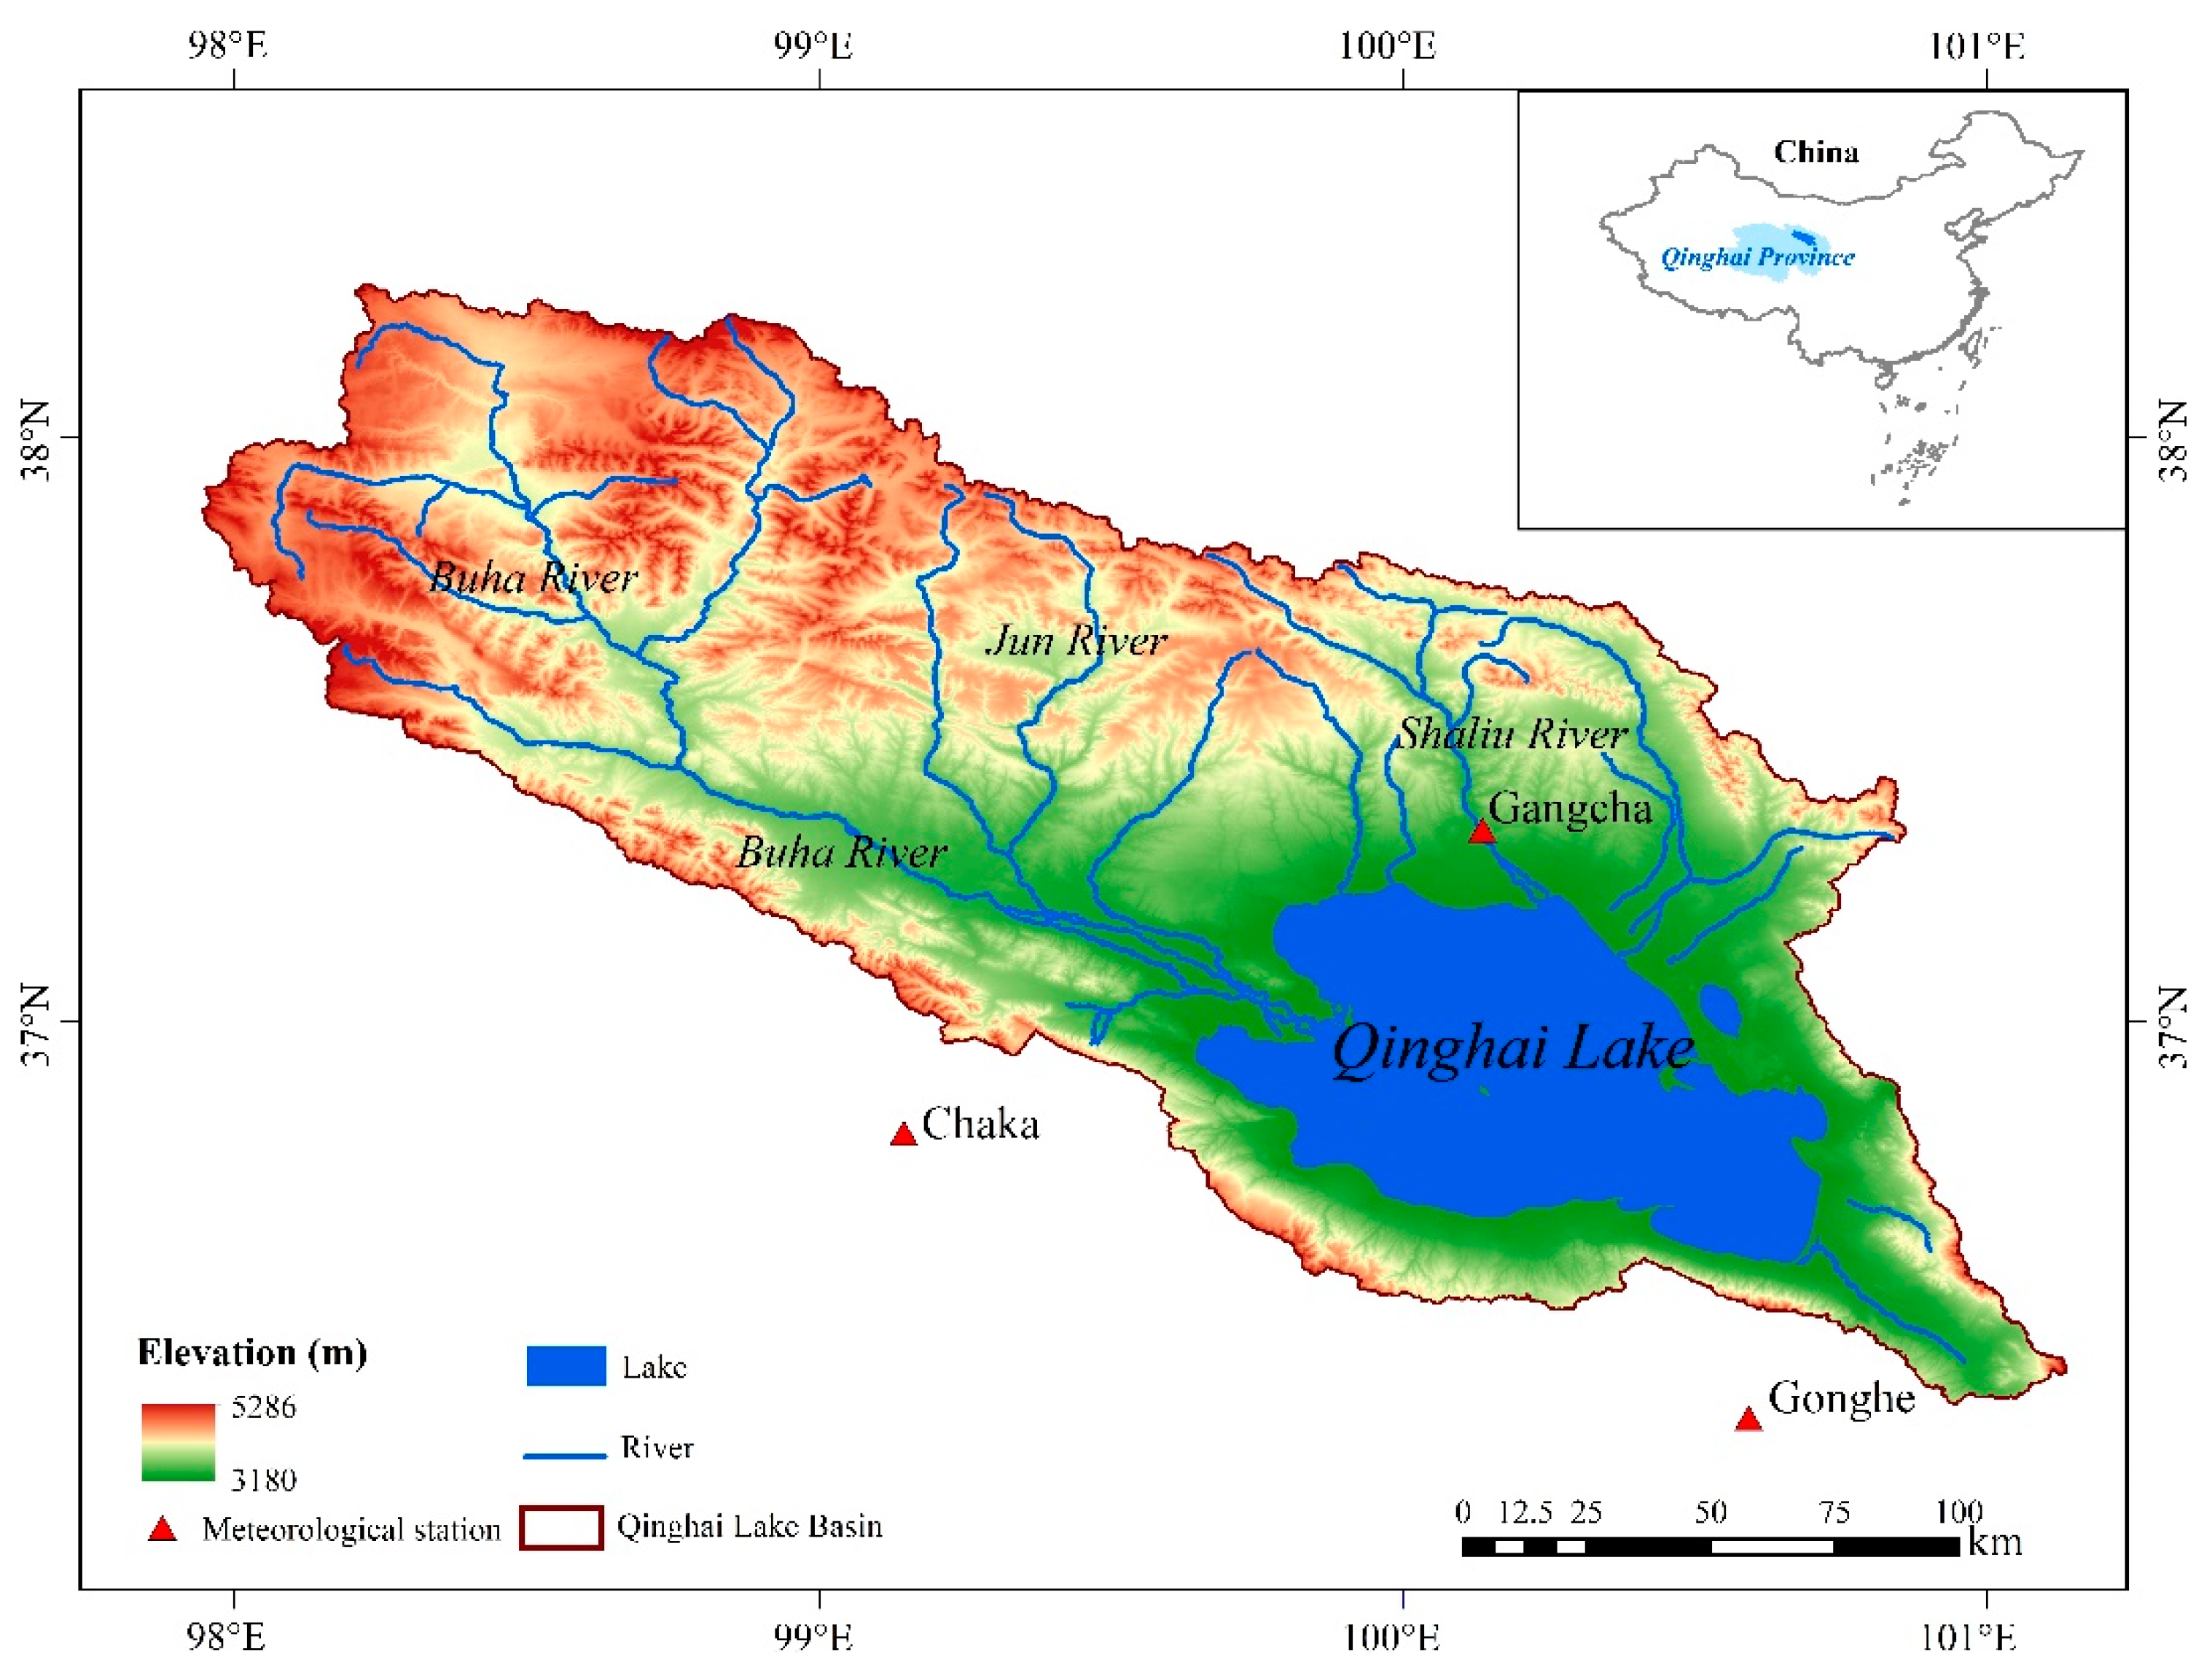
2.1. Study Area

Qinghai Lake is the largest plateau inland saltwater lake in China, located in the northeast corner of the Tibet Plateau (36°32′–37°15′ N, 99°36′–100°47′ E) (Figure 1) at an altitude of 3196 m. It belongs to the semi-arid climate on a continental plateau, with large evaporation, great temperature difference between day and night, and a short frost-free and long freezing period [41]. The annual precipitation in the lake area is about 357 mm, and the annual average temperature is approximately 1.2 °C [42]. More than 40 rivers (or streams) flow into Qinghai Lake, with the two largest rivers, the Buha River and Shaliu River, accounting for 63% of the total recharge volume [43]. As a closed inland lake, the variations of Qinghai Lake water are closely related to, and highly affected by the climate, while human activities contribute little [41,42,44], probably because it is a salt lake.

2.2. Materials

Data used in this study include Landsat imagery, Sentinel-2 imagery, water level data from the Hydroweb, and meteorological data (Table 1). Landsat 5 TM, Landsat 7 ETM+, and Landsat 8 OLI data were employed together to implement a long-term earth observation from 1991–2020. Sentinel-2 MSI imagery, with a spatial resolution up to 10 m, was employed to establish the downscaling model to generate 10 m water extent from Landsat data. Both Landsat and Sentinel-2 data were obtained and pre-processed on GEE. Considering the interference of clouds, Landsat images from May to November were mosaiced to generate a cloud-free image for each year. In order to reduce distortion caused by projection, Sentinel-2 data were reprojected to the same coordinate system as Landsat data (WGS 84/UTM zone 47N). The Hydroweb dataset (http://Hydroweb.theia-land.fr, accessed on 20 October 2020) provides long-term water level, area, and water storage estimations of major lakes globally. Its water level dataset is a fusion of multiple altimetry satellites with different service years, including Topex-Poseidon (1992–2005), Jason-1 (2001–2013), ICESat (2003–2009), Jason-2 (2008-), Jason-3 (2016-), Sentinel-3A (2016-), ICESat-2 (2018-), and so on [35]. Meteorological data were obtained from the China Surface Climate Data Daily Value Dataset (V3.0) published by the China Meteorological Data Service Center (https://data.cma.cn/en/?r=data/index, accessed on 20 October 2020). We acquired temperature, evaporation, and precipitation of Gangcha, Chaka, and Gonghe stations near Qinghai Lake from this dataset, and used them to analyze the driving factors of Qinghai Lake’s water dynamics.

3. Methodology

We utilized Landsat and Sentinel-2 images in the overlapping period (2015–2019) on GEE to establish the statistical regression downscaling model as developed by Wu et al. [32]. This model was then applied to generate long-term (1991–2020) and high-resolution (10 m) water maps from Landsat imagery. Through integrating with the water level from the Hydroweb dataset, the water volume variation in the past 30 years was analyzed based on the area-level relationship. Finally, the meteorological dataset was used to analyze the driving factors of lake volume changes. The flowchart of the methodology of this study is shown in Figure 2.

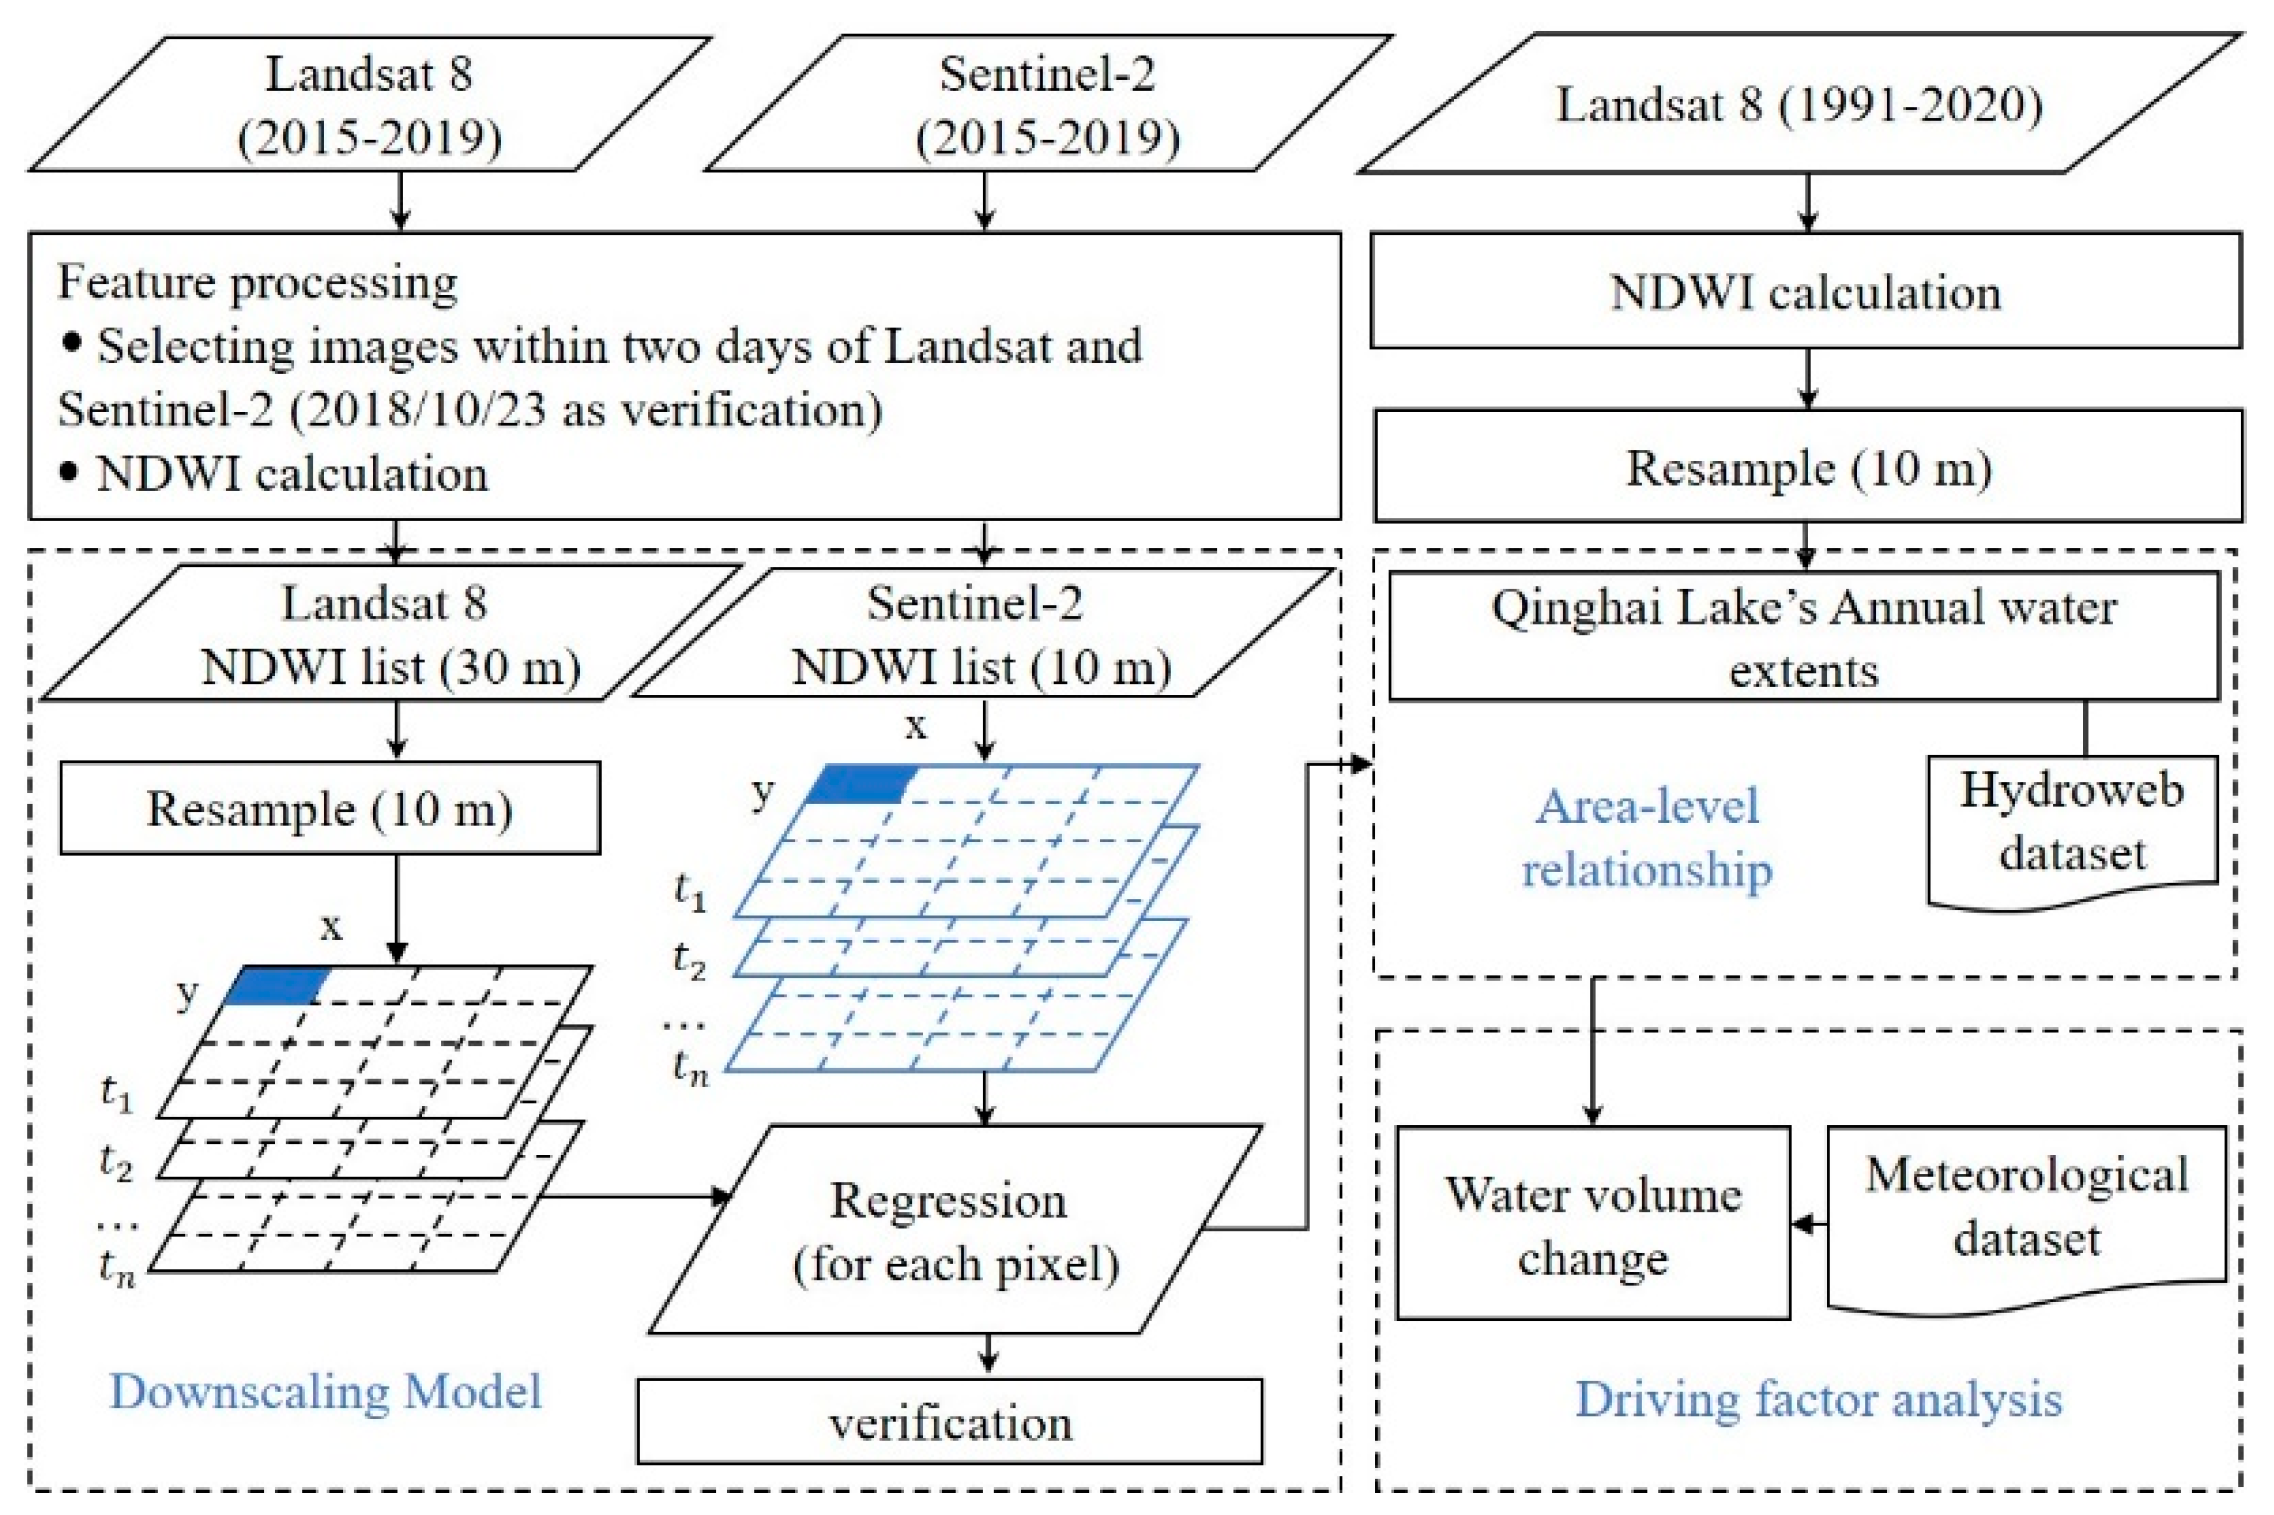
3.1. Downscaled Mapping of Surface Water

We adopted the statistical regression model proposed by Wu et al. [32] to downscale Landsat imagery from 30 m to 10 m resolution, with the assistance of 10 m resolution Sentinel-2 data. This model is based on regressing water index images derived from Landsat and Sentinel-2 (Equation (1)). Specifically, Landsat 8 and Sentinel-2 with close dates (less than 3 days) from 2015 to 2019 were selected to construct the regression model (Table 2). Among the selected 11 pairs of Landsat-8 and Sentinel-2 images, the one on 23 October 2018 was selected to validate the downscaled results only, while the remaining were selected for regression.
NDWI i , j , t Fine = a i , j · NDWI i , j , t Coarse + b i , j ,
In Equation (1), a i , j and b i , j are the fitted regression coefficients, NDWI i , j , t Fine and NDWI i , j , t Coarse are the normalized difference water index (NDWI) [45] of fine and coarse resolution images at time t and pixel location (x, y), respectively. NDWI was calculated as the normalized difference of GREEN and near-infrared (NIR) bands (Equation (2)).
NDWI = ( GREEN NIR ) / ( GREEN + NIR ) ,
We first resampled the coarse resolution NDWI image to the same resolution as the fine resolution NDWI imagery using the NEAREST interpolation method, i.e., resampled the 30 m Landsat NDWI to 10 m resolution, and then established the regression model based on the resampled Landsat NDWI and Sentinel-2 NDWI on a pixel-by-pixel basis. Using this model, higher resolution (10 m) NDWI images can be generated from any input of Landsat NDWI image. OTSU thresholding [46] was then applied to the resultant NDWI images to extract the surface water extent.

3.2. Water Volume Estimation

To calculate the relative water volume variation, the lake was assumed to be circular with a regular shape. In this study, we adopted the method used in [47] to estimate the lake volume change ( Δ V ), as shown in Equation (3).
Δ V = 1 3 ( H 1 H 2 ) · ( A 1 + A 2 + A 1 · A 2 ) ,
where H 1 and A 1 represent the corresponding lake water level and area at time 1, and H 2 and A 2 are the water level and area at time 2, respectively.

3.3. Driving Factor Analysis

As the human activities had limited impacts on the water volume variation of Qinghai Lake [48], we assume there is no impact caused by anthropogenic factors and only analyze the climatic driving factors for lake water dynamics. Due to the complexity of climatic change and the diversity of influencing factors of lakes, nonlinear constraints and uncertainties are involved in the consideration of the impact of climate elements on the lake dynamics, which causes extensive greyness [49]. Therefore, the Grey Relation Analysis (GRA) [50] was applied to analyze the response of the water volume to climate factors. The GRA uses the correlation of two sequences to characterize the degree of association between them, called the relational grade, which is calculated as:
R ij = 1 N t = 1 N R ij ( t ) ,
where R ij represents the relational grade between the sequences of i and j, N is the length of the sequence, and R ij ( t ) is the correlation coefficient between the sequences of i and j at time t, calculated as Equation (5):
R ij ( t ) = Δ min + ρ Δ max Δ ij ( t ) + ρ Δ max ,
where Δ min and Δ max denote the minimum and maximum of the absolute difference of two sequences at each time, respectively, Δ ij ( t ) represents the absolute error between sequences at time t, and ρ is the resolution coefficient ( ρ ( 0 , 1 ) ), usually set to 0.5 [49].
In addition, we adopted three different methods to calculate the correlation coefficient, namely Pearson [51], Spearman [51], and Kendall [51], to compare with the GRA analysis results. The Pearson correlation coefficient was also used to investigate the climate influence on water volume, which was calculated as Equation (6):
r = n x i y i x i y i n x 2 ( x i ) 2 n y 2 ( y i ) 2 ,
where r is the correlation coefficient ranging from −1 to 1, x and y are the values of the two variables, and n is the number of samples. While the absolution value of r is closer to 1, the correlation between variables is stronger.

4. Results

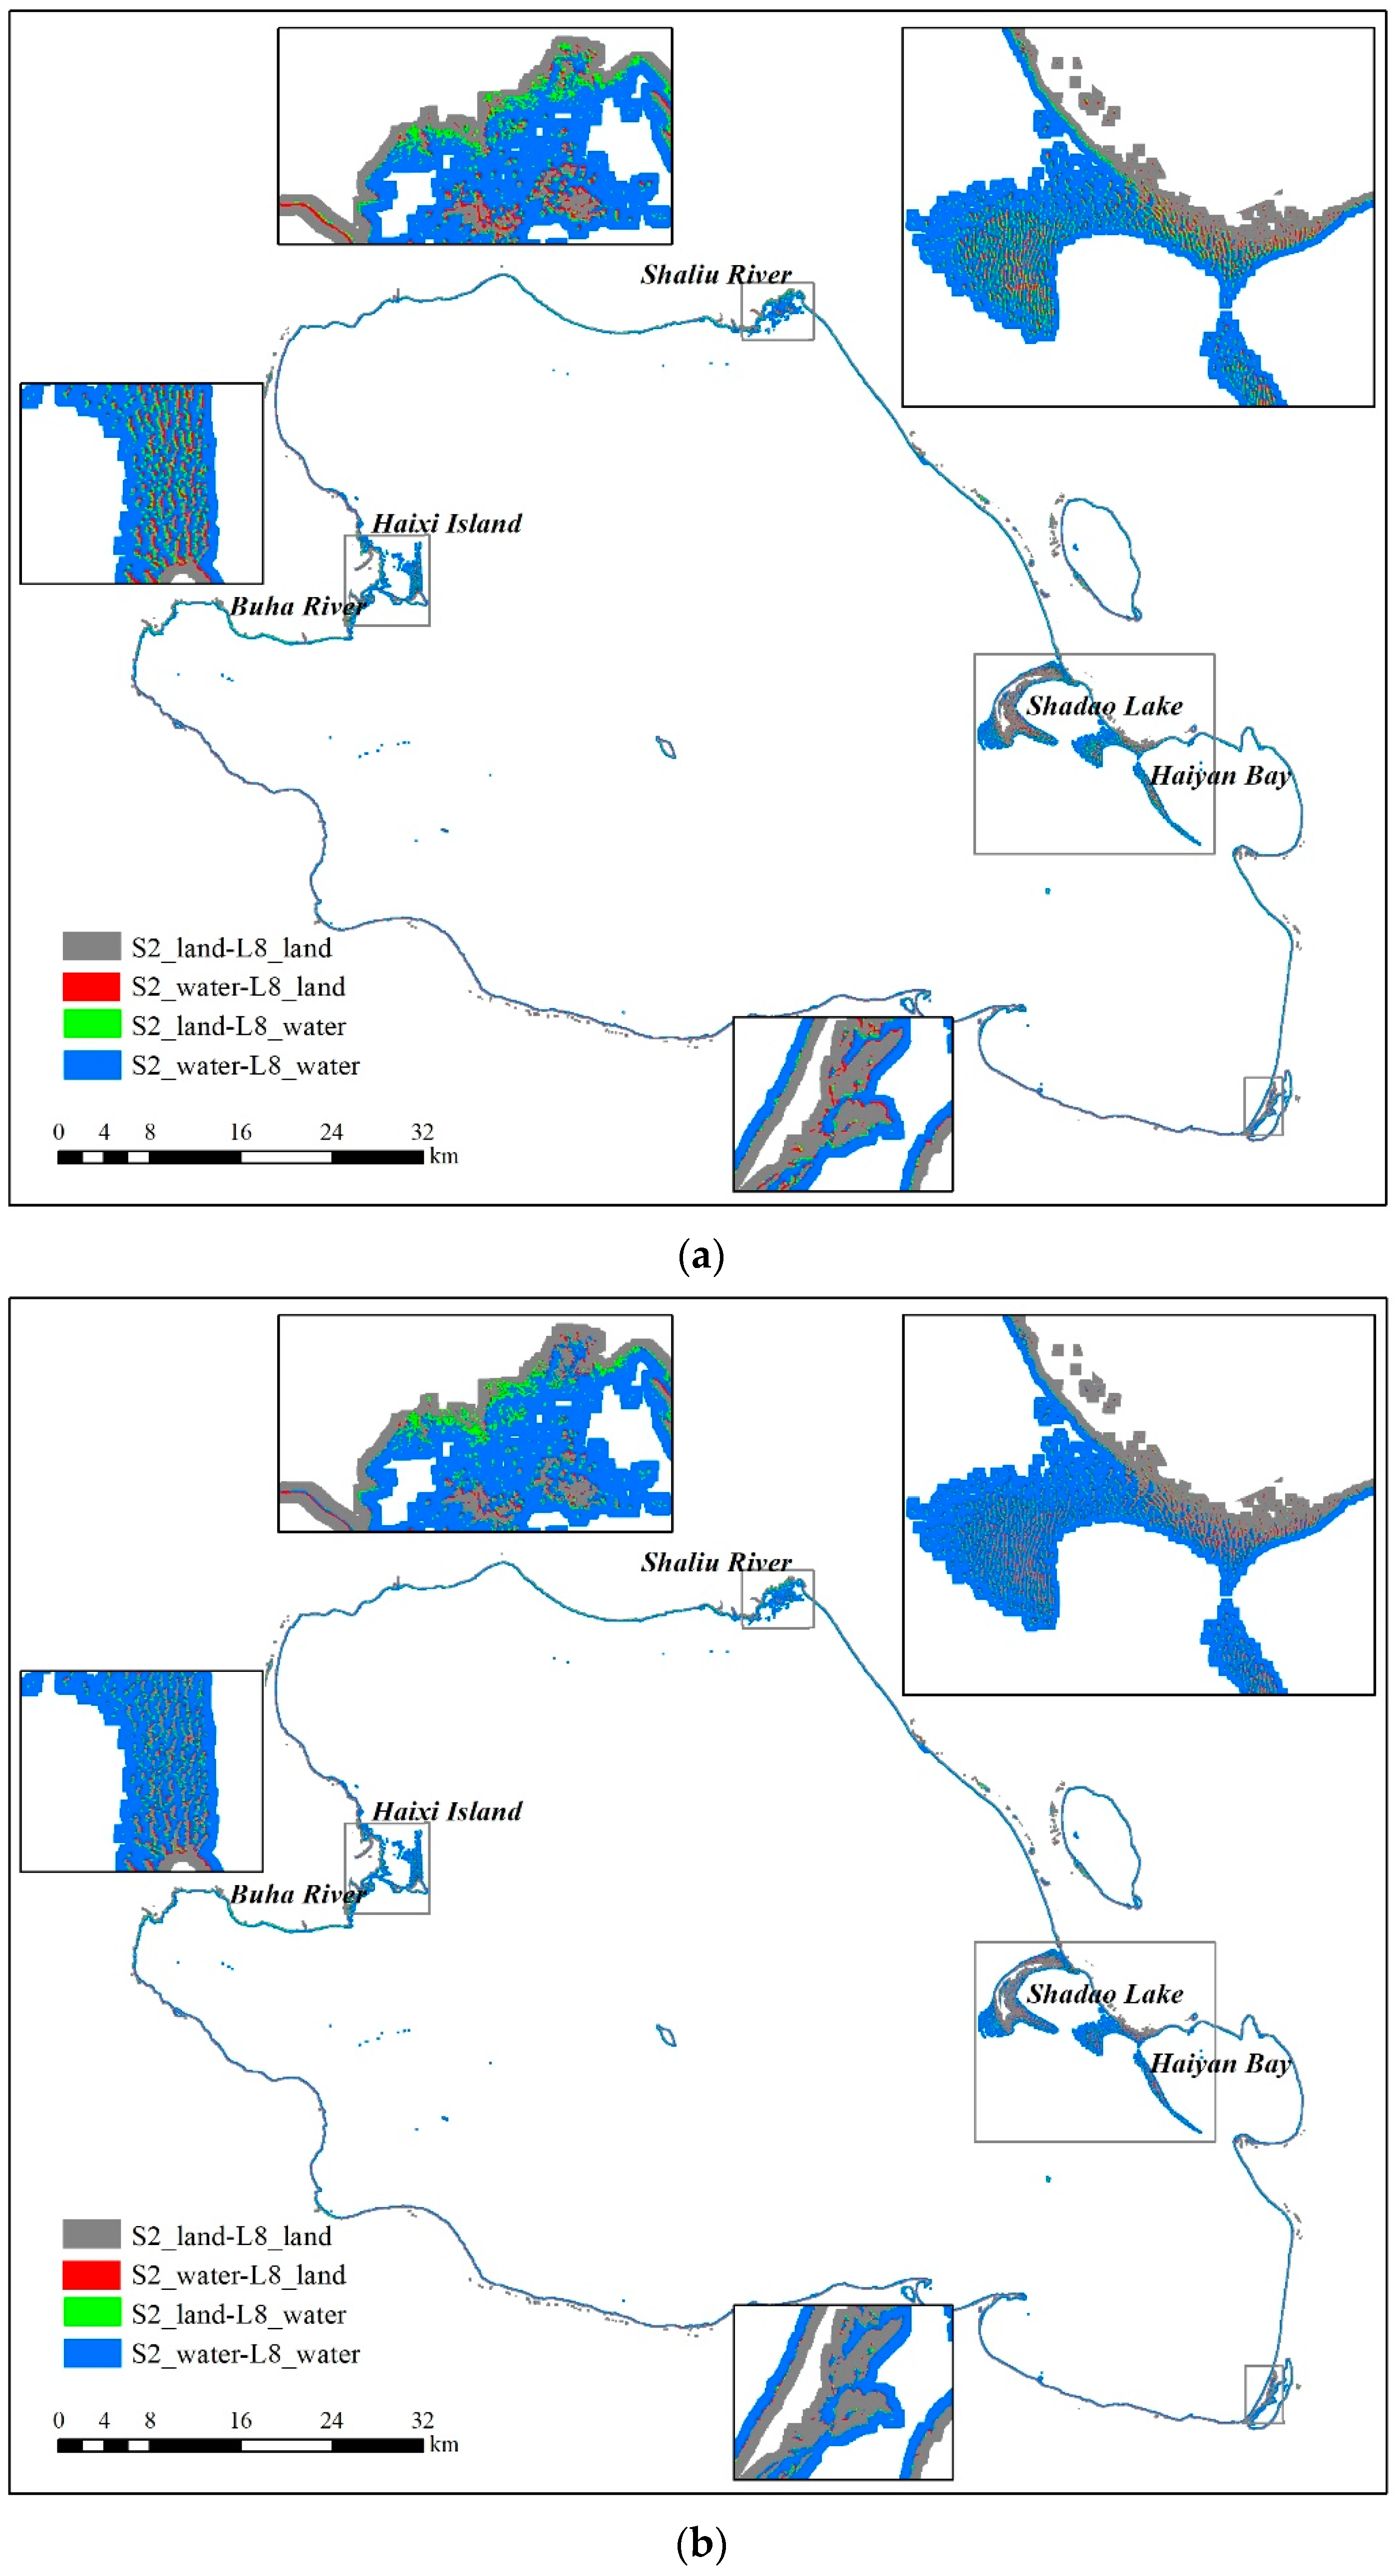
4.1. Validation of Downscaled Water Maps

We utilized a pair of Landsat 8 and Sentinel-2 images on 23 October 2018, which were not employed for establishing the downscaling model but to validate the downscaling method. A 10 m resolution water map was generated from a downscaled NDWI image derived from the Landsat 8 image using OTSU thresholding. Another 10 m resolution water map derived directly from the Sentinel-2 image was employed as the reference to validate the downscaled result. Two maps were generated by overlaying the water map derived from the original Landsat image and the downscaled result with the Sentinel-2 derived referencing water map, respectively (Figure 3). From these maps, it is obvious that the Landsat 8 image can accurately extract the major water body of Qinghai Lake, either with or without the downscaling process. The extraction differences are mainly distributed along the boundary, especially in Haixi Island, the estuaries of the Buha River and Shaliu River, the sandy area of Shadao Lake, and Haiyan Bay. Compared with the referencing Sentinel-2 water map, the water map derived from the original Landsat 8 image has many misclassified pixels, shown as red color for omission errors and green color for commission errors. The water map derived from downscaled Landsat 8 data showed some improvement, with more detailed features and small water bodies successfully being extracted, for example in the sandy area.
Based on these overlaying results (Figure 3), we calculated a confusion matrix by counting the number of four types of overlay map pixels. In this process, as both the reference and verification object are raster data, we took all the pixels as the samples to construct the confusion matrix, based on which accuracy indicators including commission error, omission error, overall accuracy, and Kappa coefficient were calculated (Table 3). It was found that the overall accuracy was clearly improved from 88.35% to 92.10%, and the commission error decreased by 2.46% and omission error by 1.94%. The Kappa coefficient was increased from 0.77 to 0.84. These accuracy indices suggest that the lake water was mapped more accurately by the downscaling method.

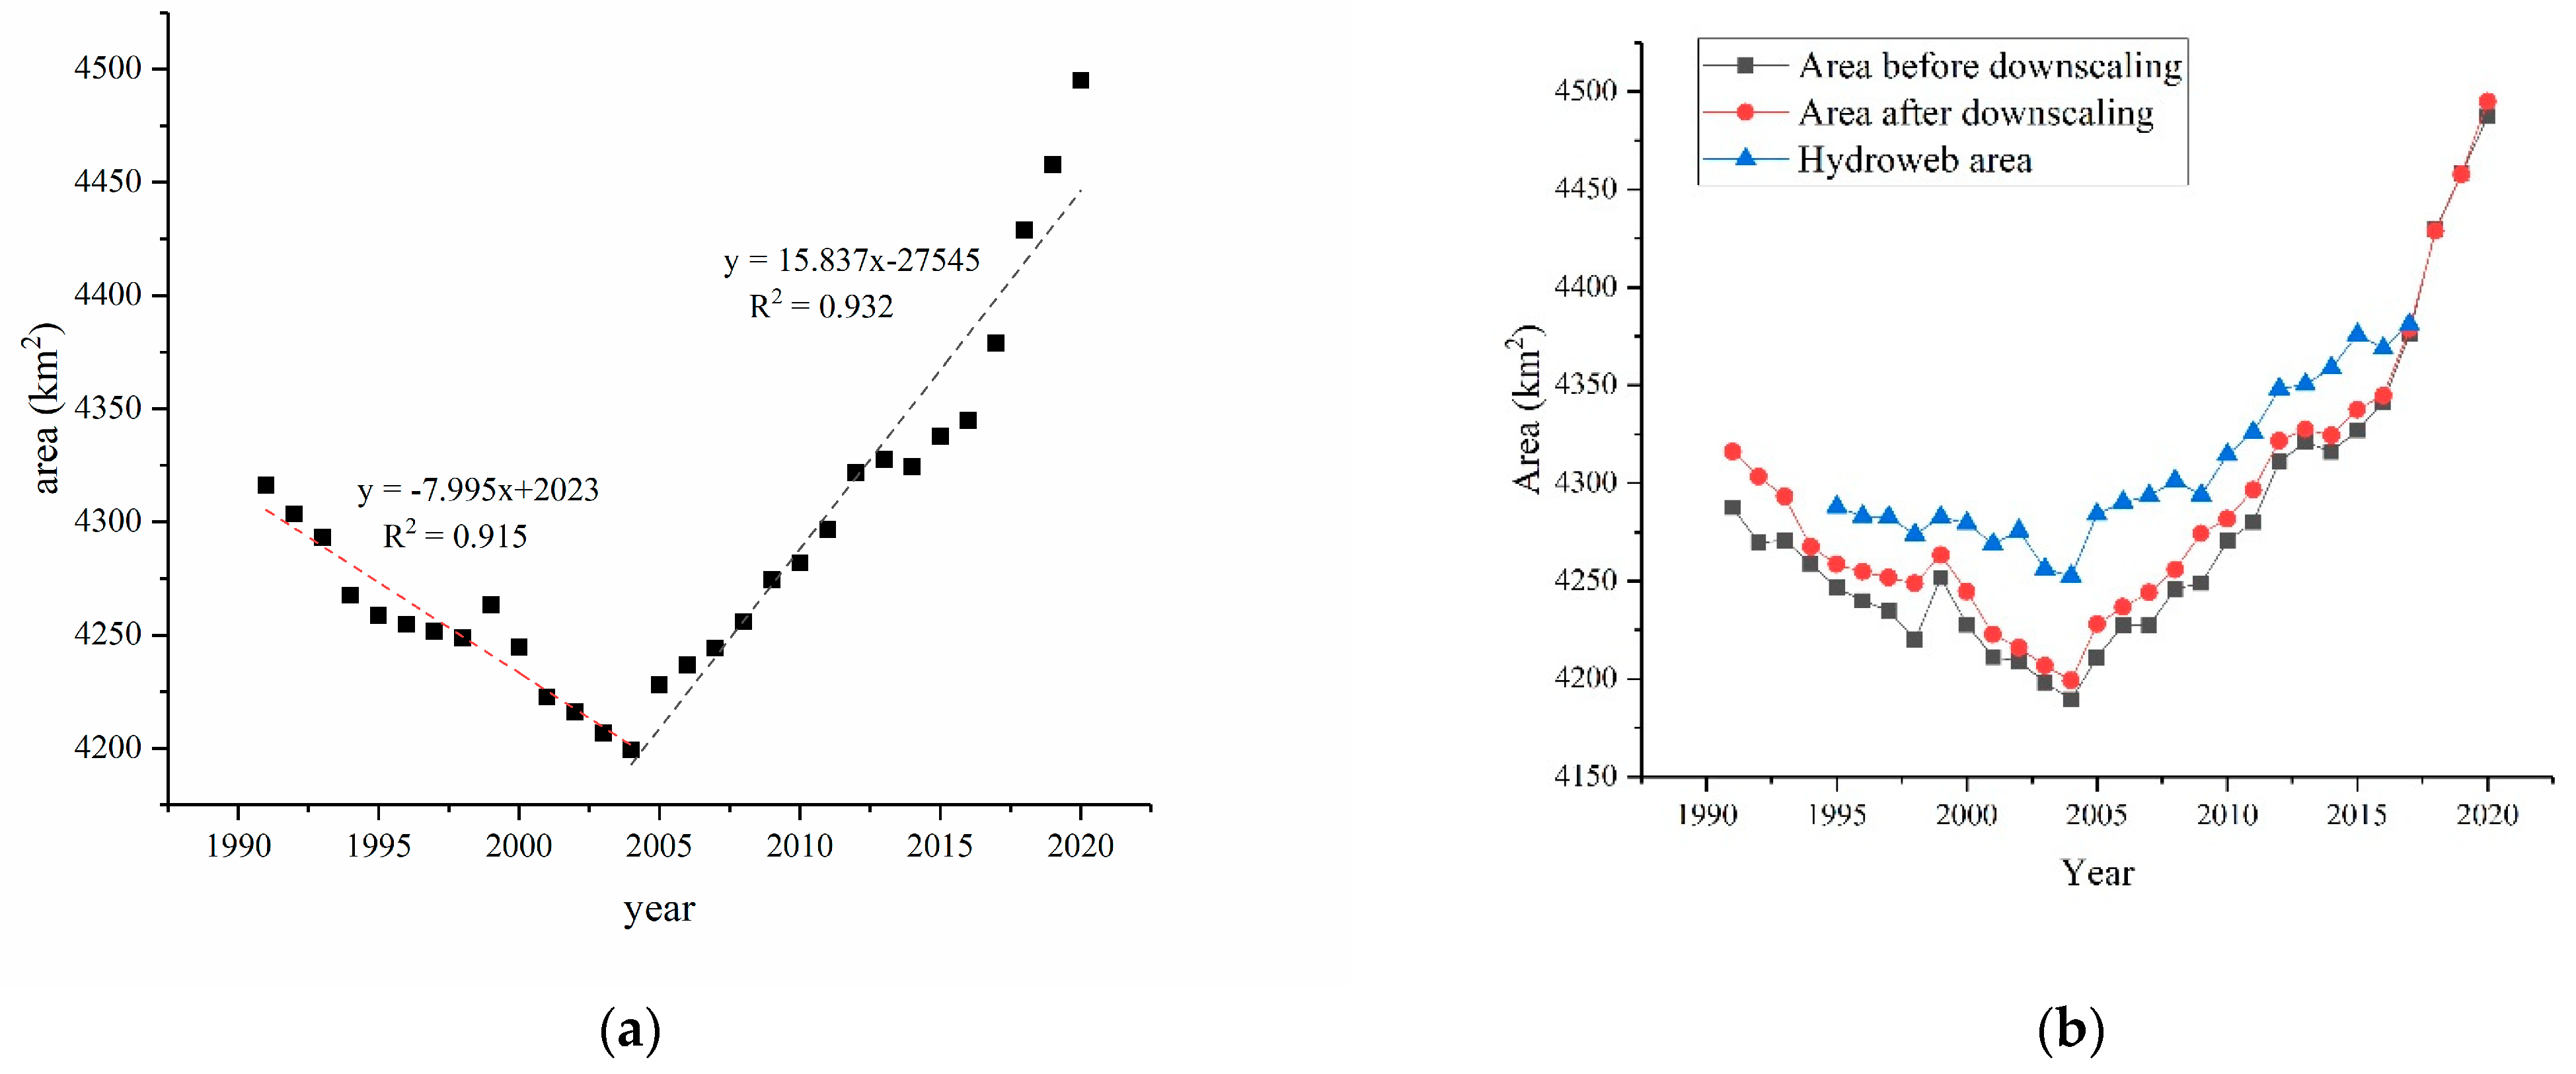
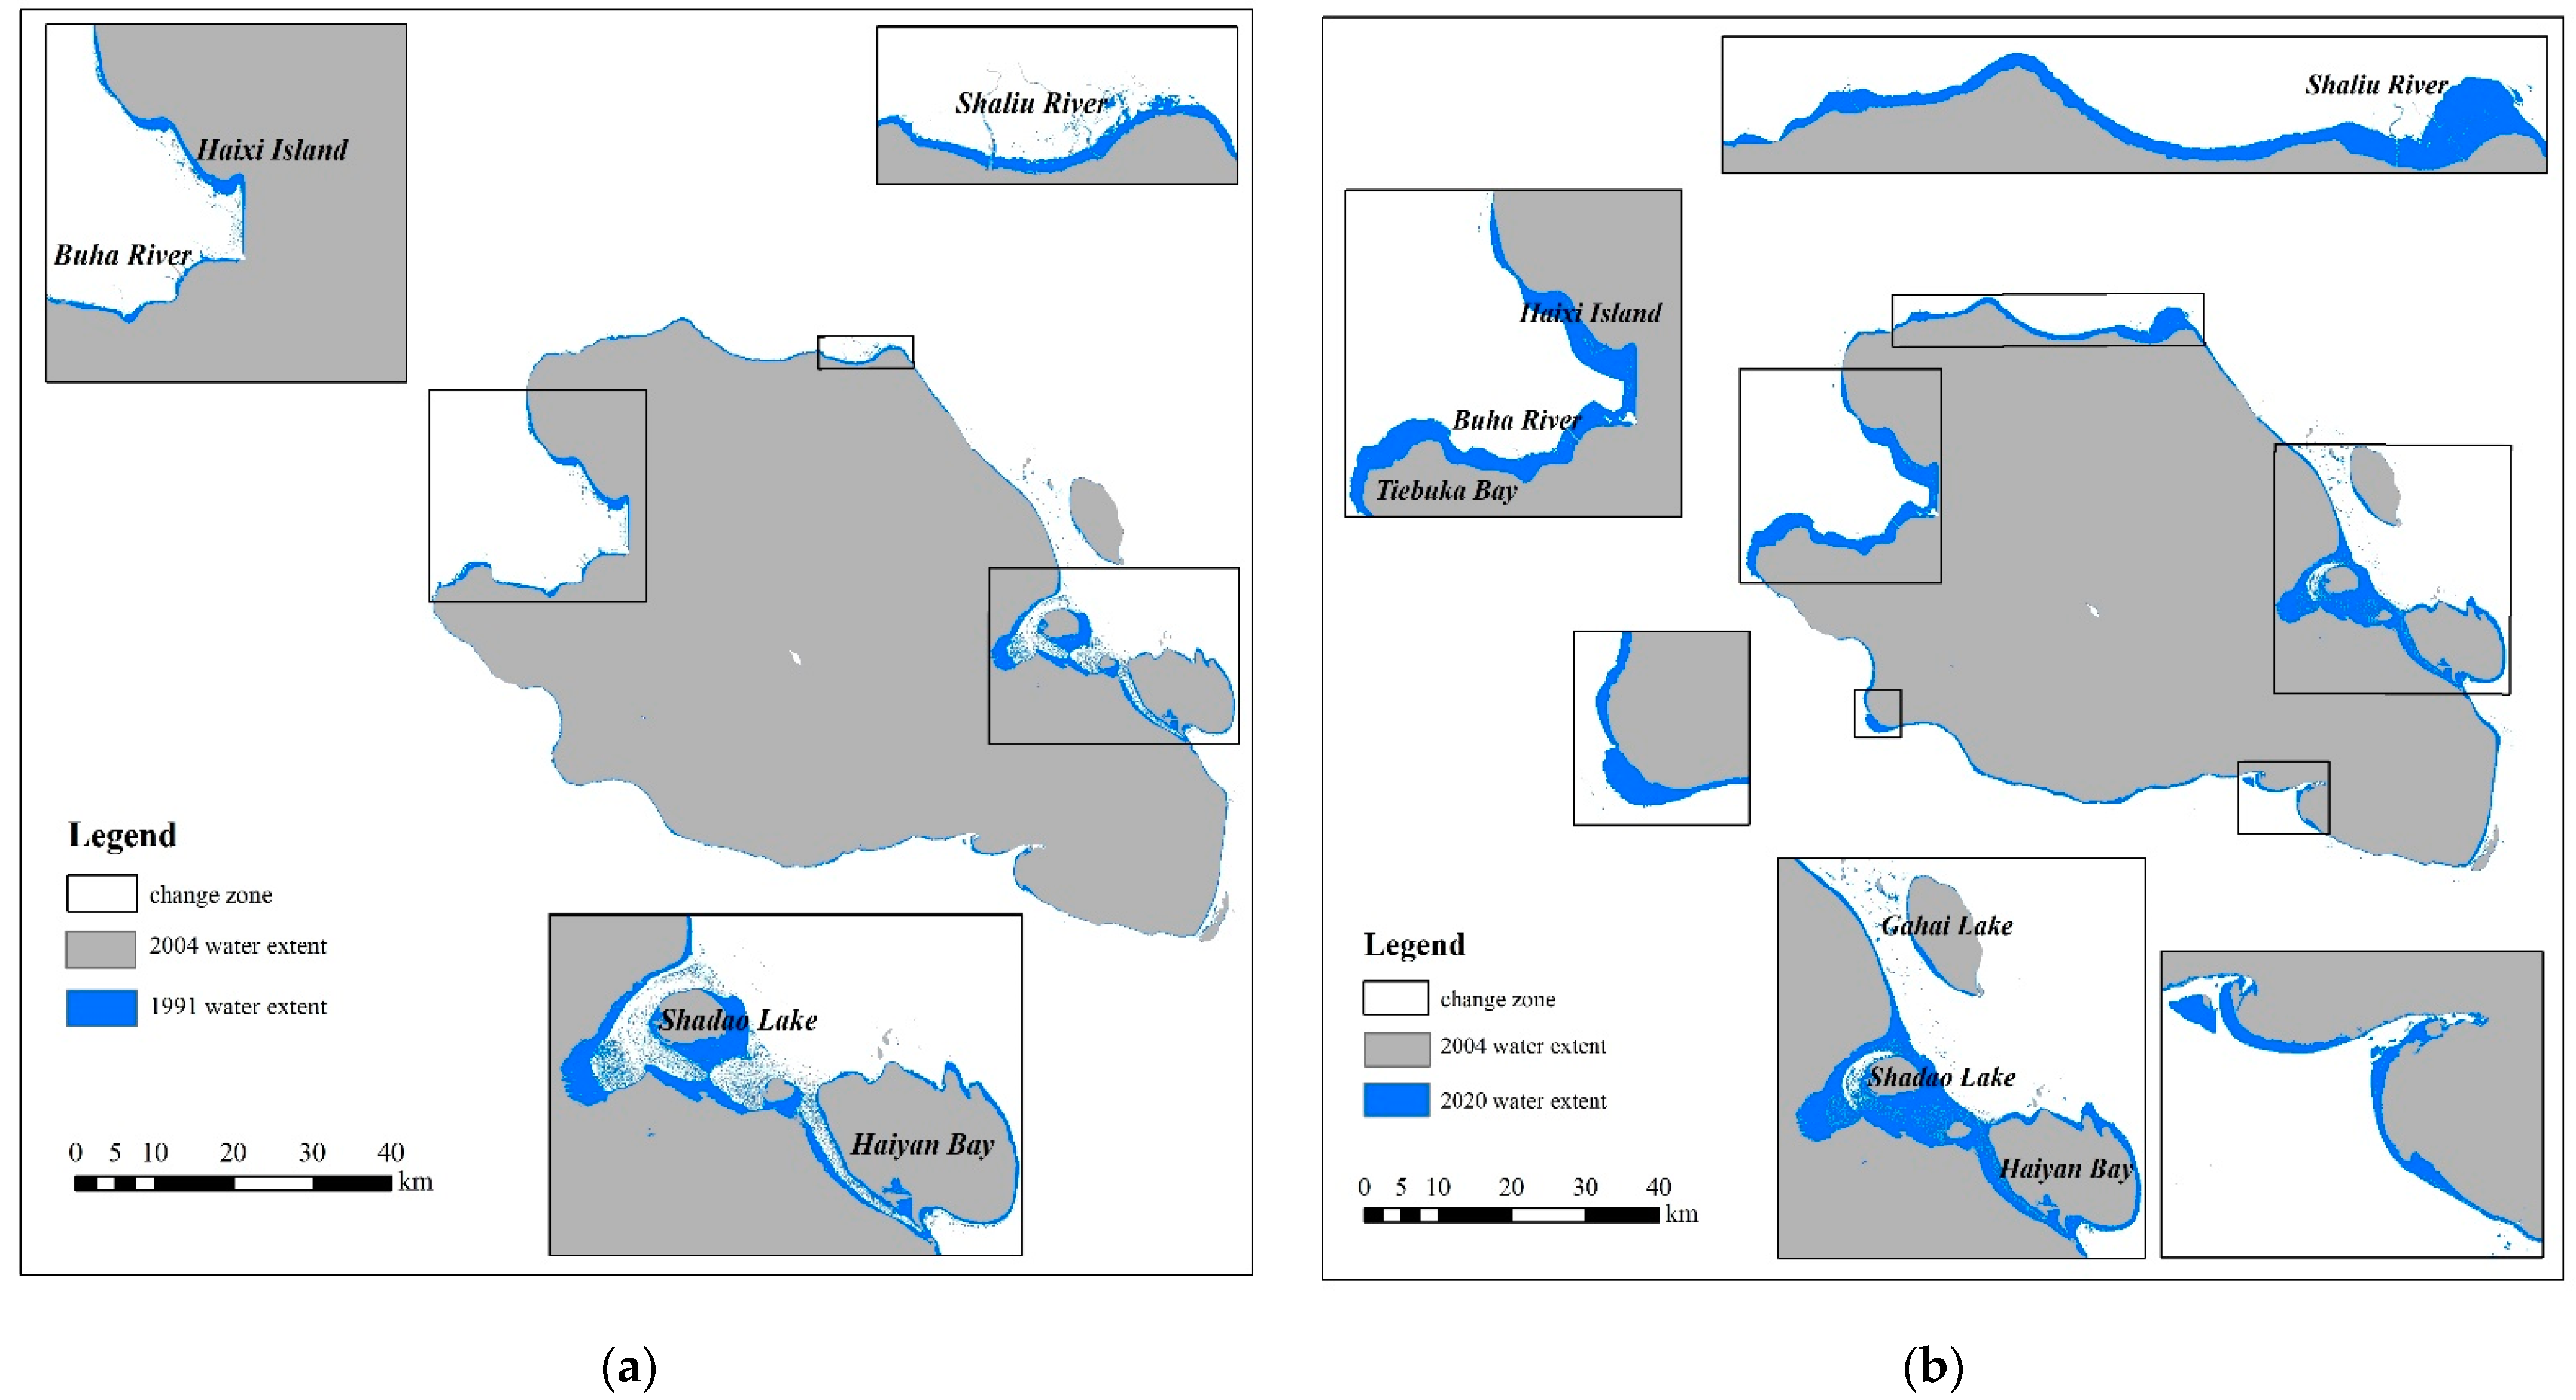
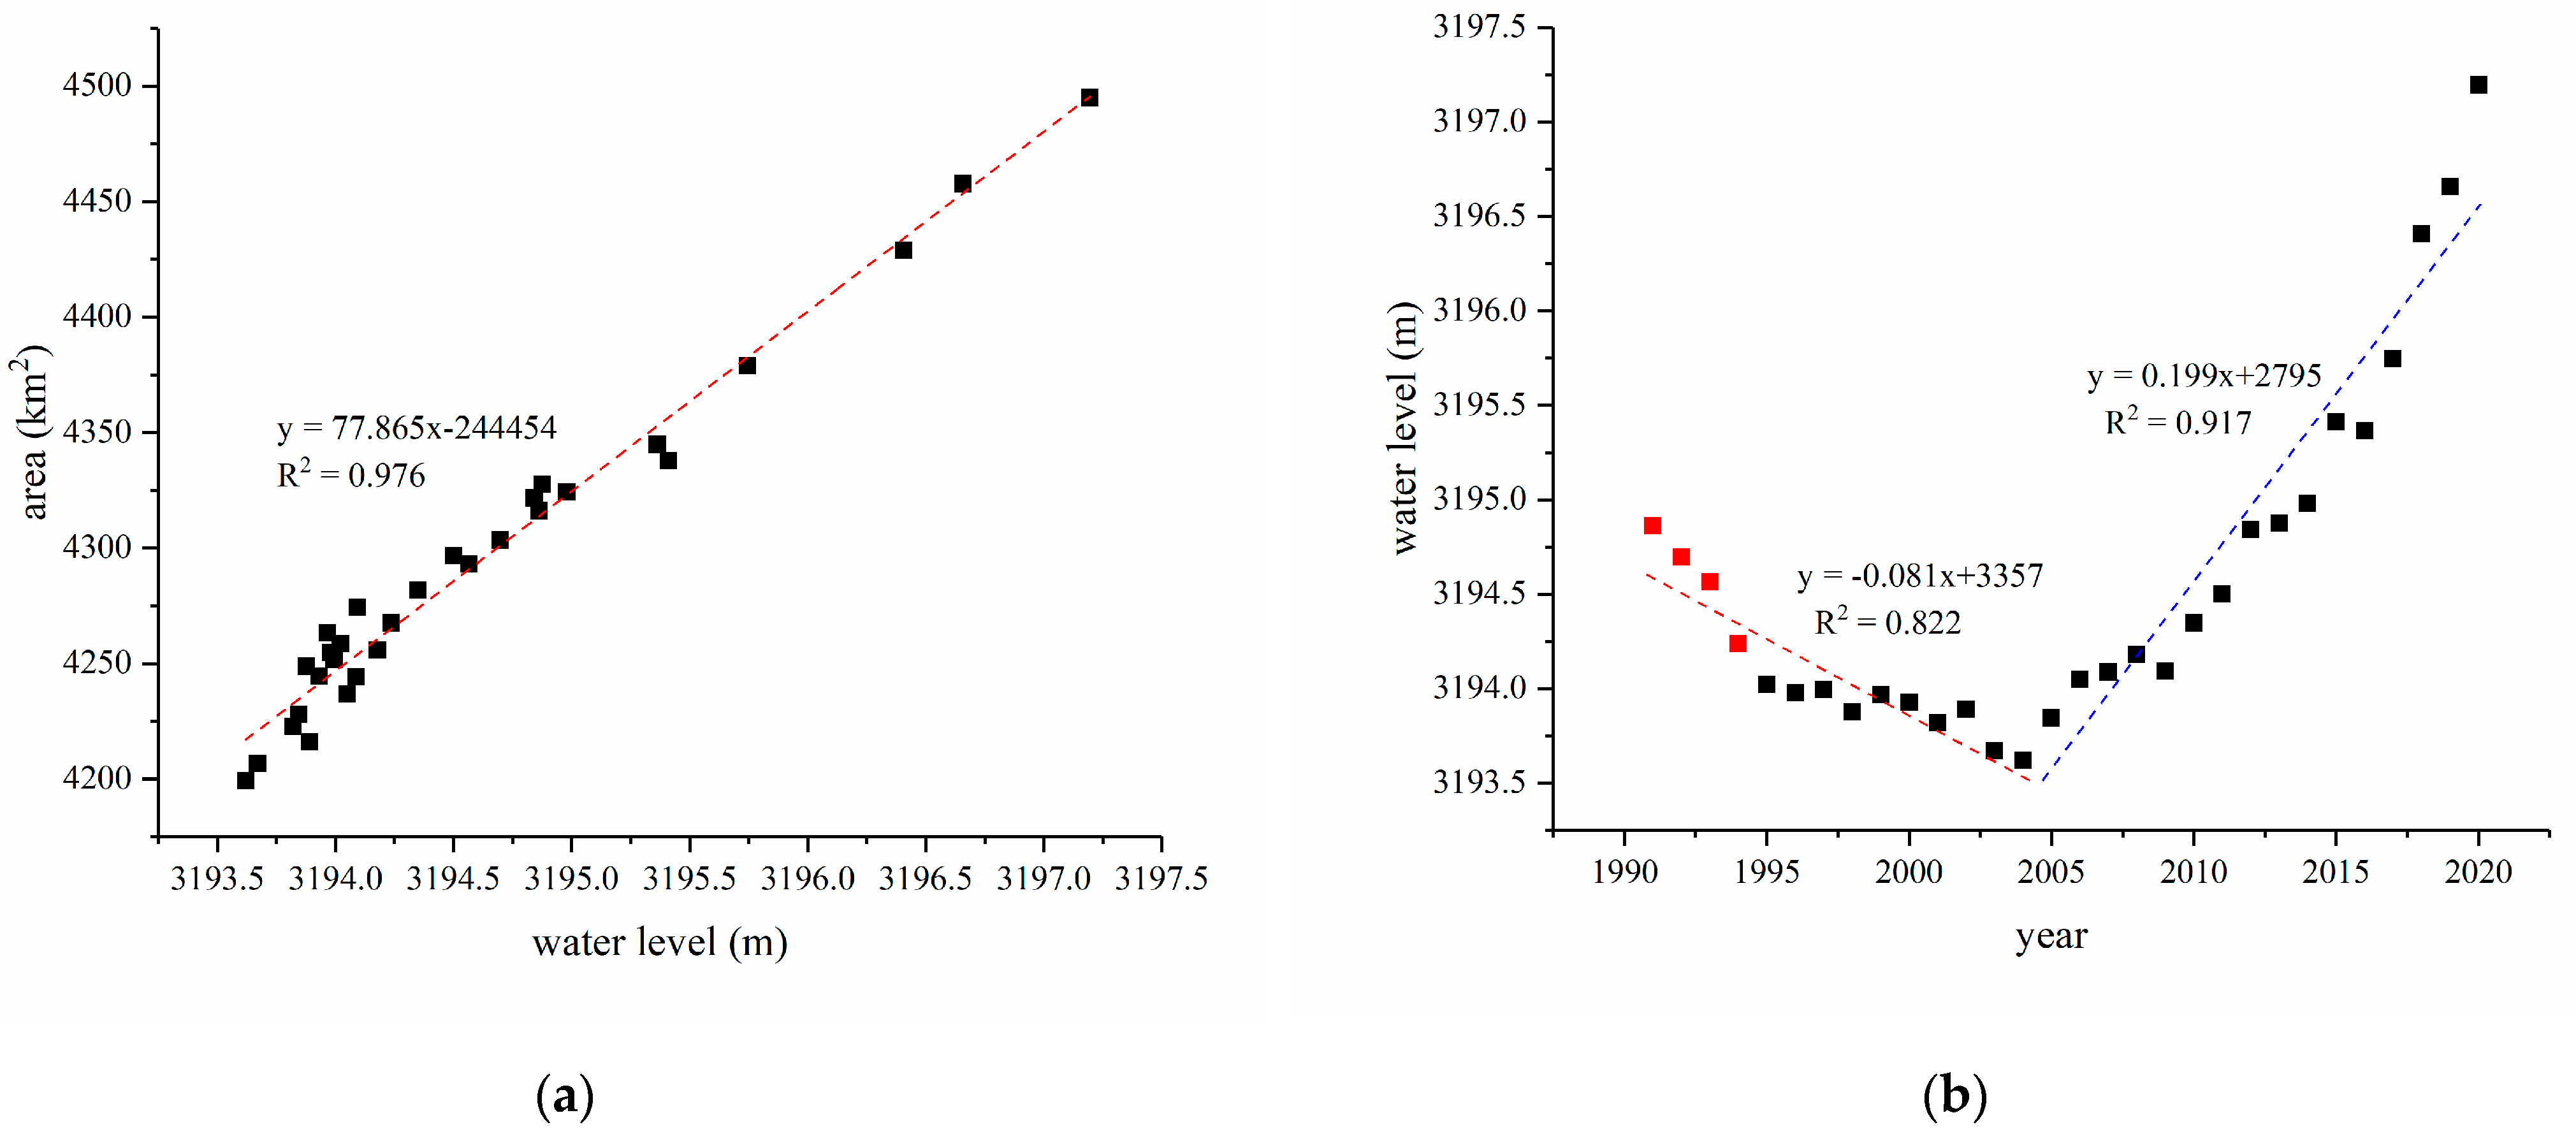
4.2. Lake Area and Shoreline Dynamics

We applied the downscaling model to generate 10 m resolution water maps from selected Landsat images for Qinghai Lake from 1991 to 2020. The lake water area exhibits a two-phase changing pattern as shown in Figure 4a. Taking 2004 as a turning point, the water area showed an overall downward trend at the first stage, dropping from 4316.20 km2 in 1991 to 4199.23 km2 in 2004. Since 2004, the water area of Qinghai Lake has been increasing gradually, reaching 4494.99 km2 in 2020, with an annual growth rate of 18.49 km2/a.
We compared the lake area derived from Landsat before and after downscaling with that extracted from the Hydroweb dataset (Figure 4b). Hydroweb only provides area estimation of Qinghai Lake from 1995 to 2017 through a combination of multiple satellite data such as Landsat and CBERS-2 [35]. The annual area was taken from the average value from May to November. It is shown in Figure 4b that the annual lake water areas are consistent among the three data sources. The Hydroweb area is overall slightly higher than the area derived from Landsat images, which may be accounted for by the area integrated by different remote sensing satellites. It is also observed that through the downscaling process, the Qinghai Lake area extracted by the Landsat images is closer to the observations of Hydroweb.
We took 1991, 2004, and 2020 to elaborate the spatial dynamics of Qinghai Lake shoreline (Figure 5). It can be seen clearly that the shoreline at the west, east, and north banks shrank in 2004 in comparison with 1991, particularly in the east bank. In 2004, Shadao Lake was separated from the main body of Qinghai Lake due to water receding. Compared with 2004, the water extent of Qinghai Lake in 2020 was much larger. The Shadao Lake and Haiyan Bay on the east was integrated with the main body of Qinghai Lake. The Tiebuka Bay, Buha River, and Haixi Island also expended significantly, but the Gahai Lake has not changed significantly. In addition, the shoreline on the south bank also had an apparent expansion from 2004 to 2020.

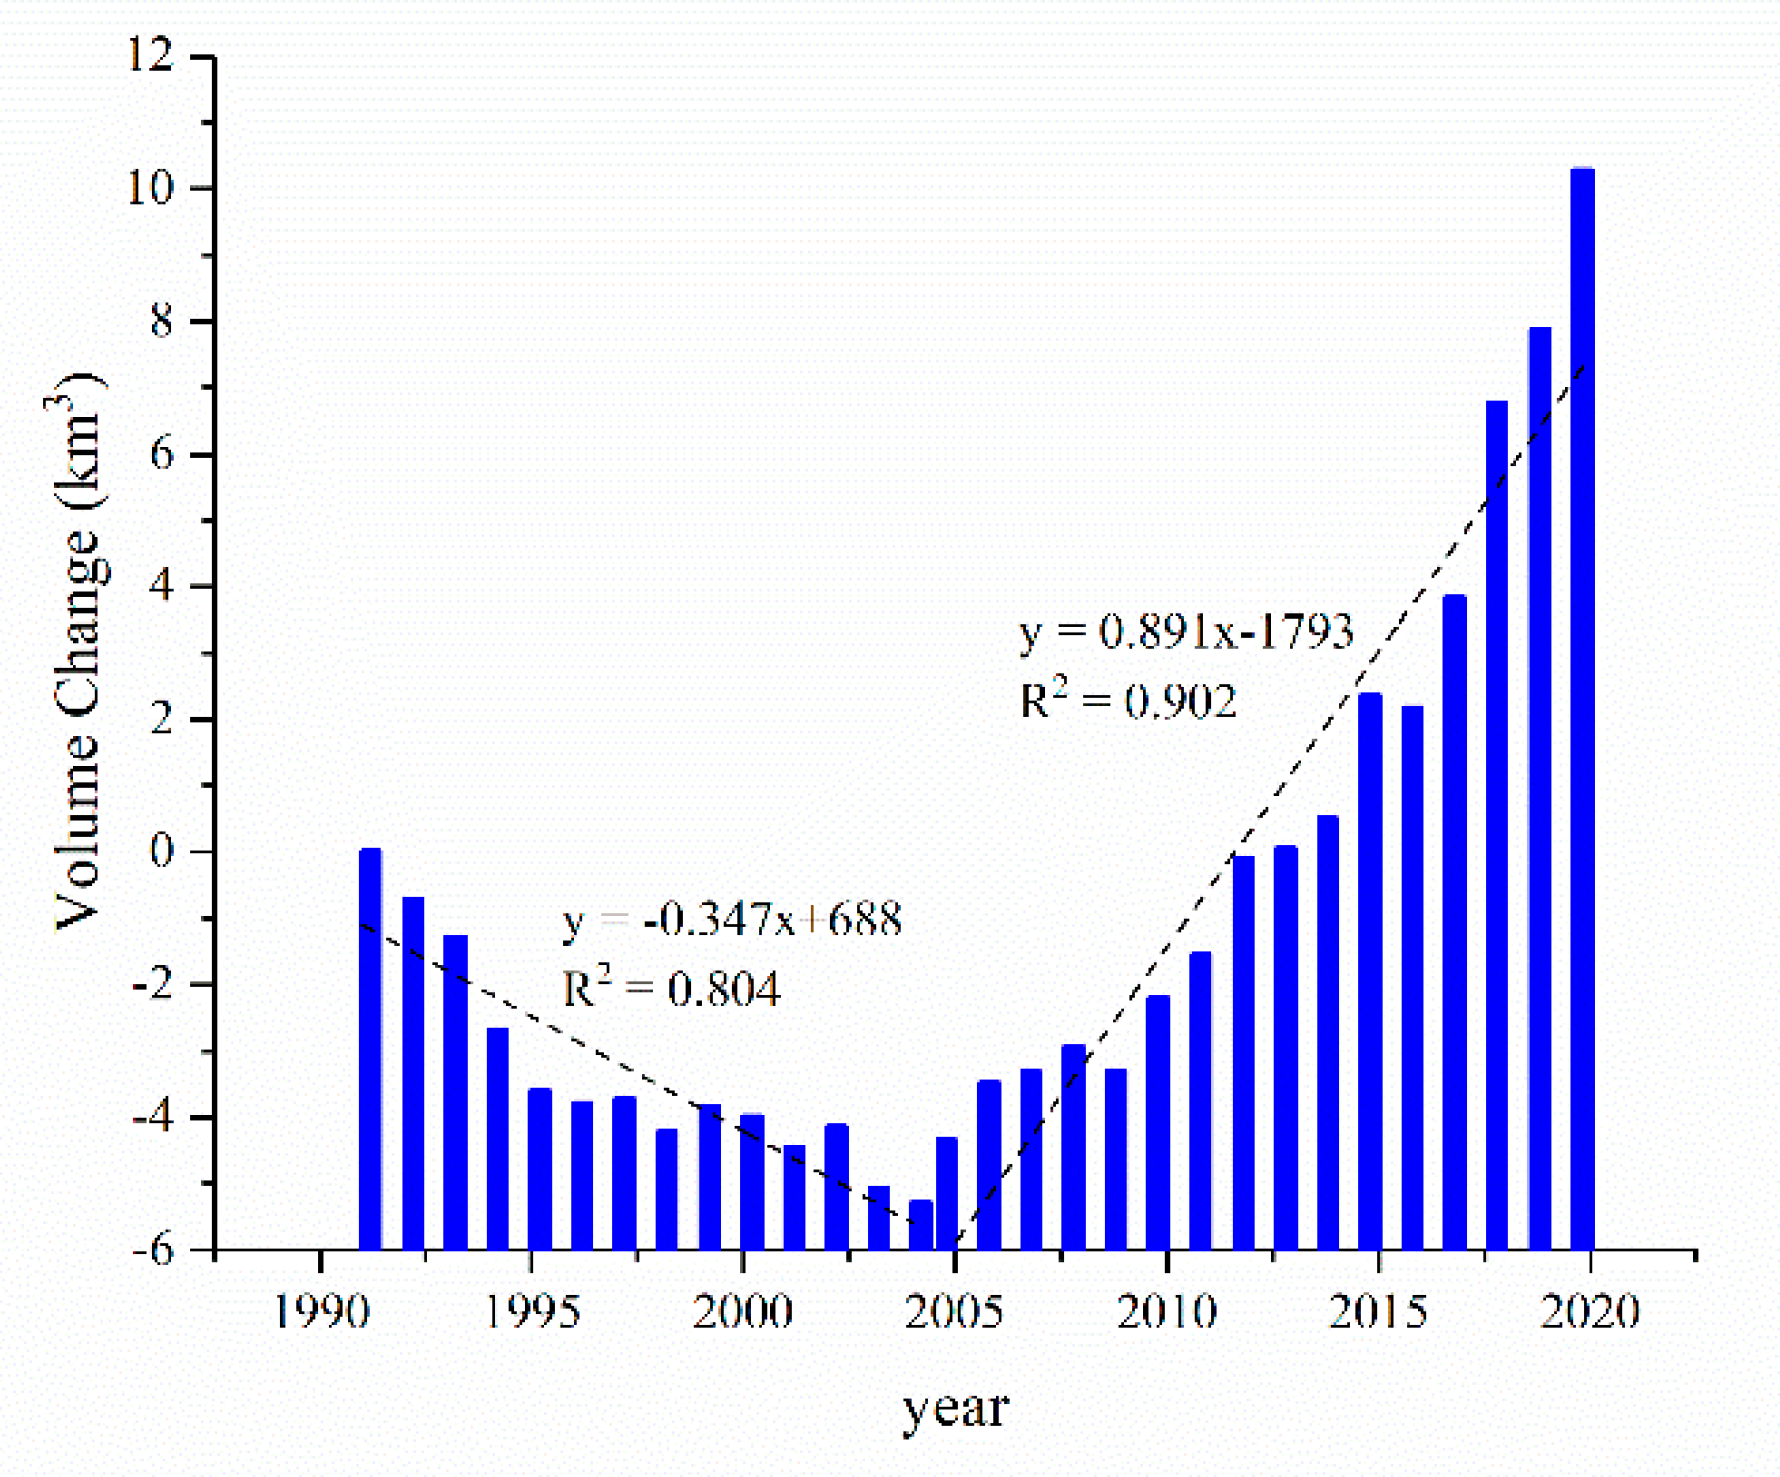
4.3. Lake Water Volume Variation

We extracted the annual average water level of Qinghai Lake from the Hydroweb dataset by taking the average water level from May to November each year. Due to the data availability, we only have the water level record from 1995–2020. The water level dropped from 3194.22 m in 1995 to 3193.62 m in 2004 with an average descending speed of 0.05 m/a, and then raised to 3197.20 m in 2020, with an average rate of 0.22 m/a. A significant correlation between the area and water level of Qinghai Lake was identified (R2 = 0.976, RMSE = 11.67, Figure 6a). Based on the regression model of water level and area, we estimated the water level of Qinghai Lake from 1991 to 1994 (red dots in Figure 6b) and made a full time series of the water level for 1991–2020 (Figure 6b). Similar to the area variation, the water level variation of Qinghai Lake also exhibits a first-decline-then-increase pattern. We fit a linear regression for the water level of 1991–2004 and 2004–2020, respectively, and found that both periods have significant linear trends, with R2 both greater than 0.8.
Taking the water volume of 1991 as the baseline, the water volume dynamics in the past 30 years were calculated from water area and water level using Equation (3). As shown in Figure 7, it is clear that the water volume also shows a first-decline-then-increase pattern. We also fit a linear regression for the water volume variation in 1991–2004 and 2004–2020, respectively. It was found that both regression models have a high R2, suggesting significant linear trends. From these models, it is obvious that the water volume decreased from 1991 to 2004, with a fitted rate near to 0.38 km3/a, while it increased from 2004 to 2020, with a fitted rate of 0.89 km3/a.

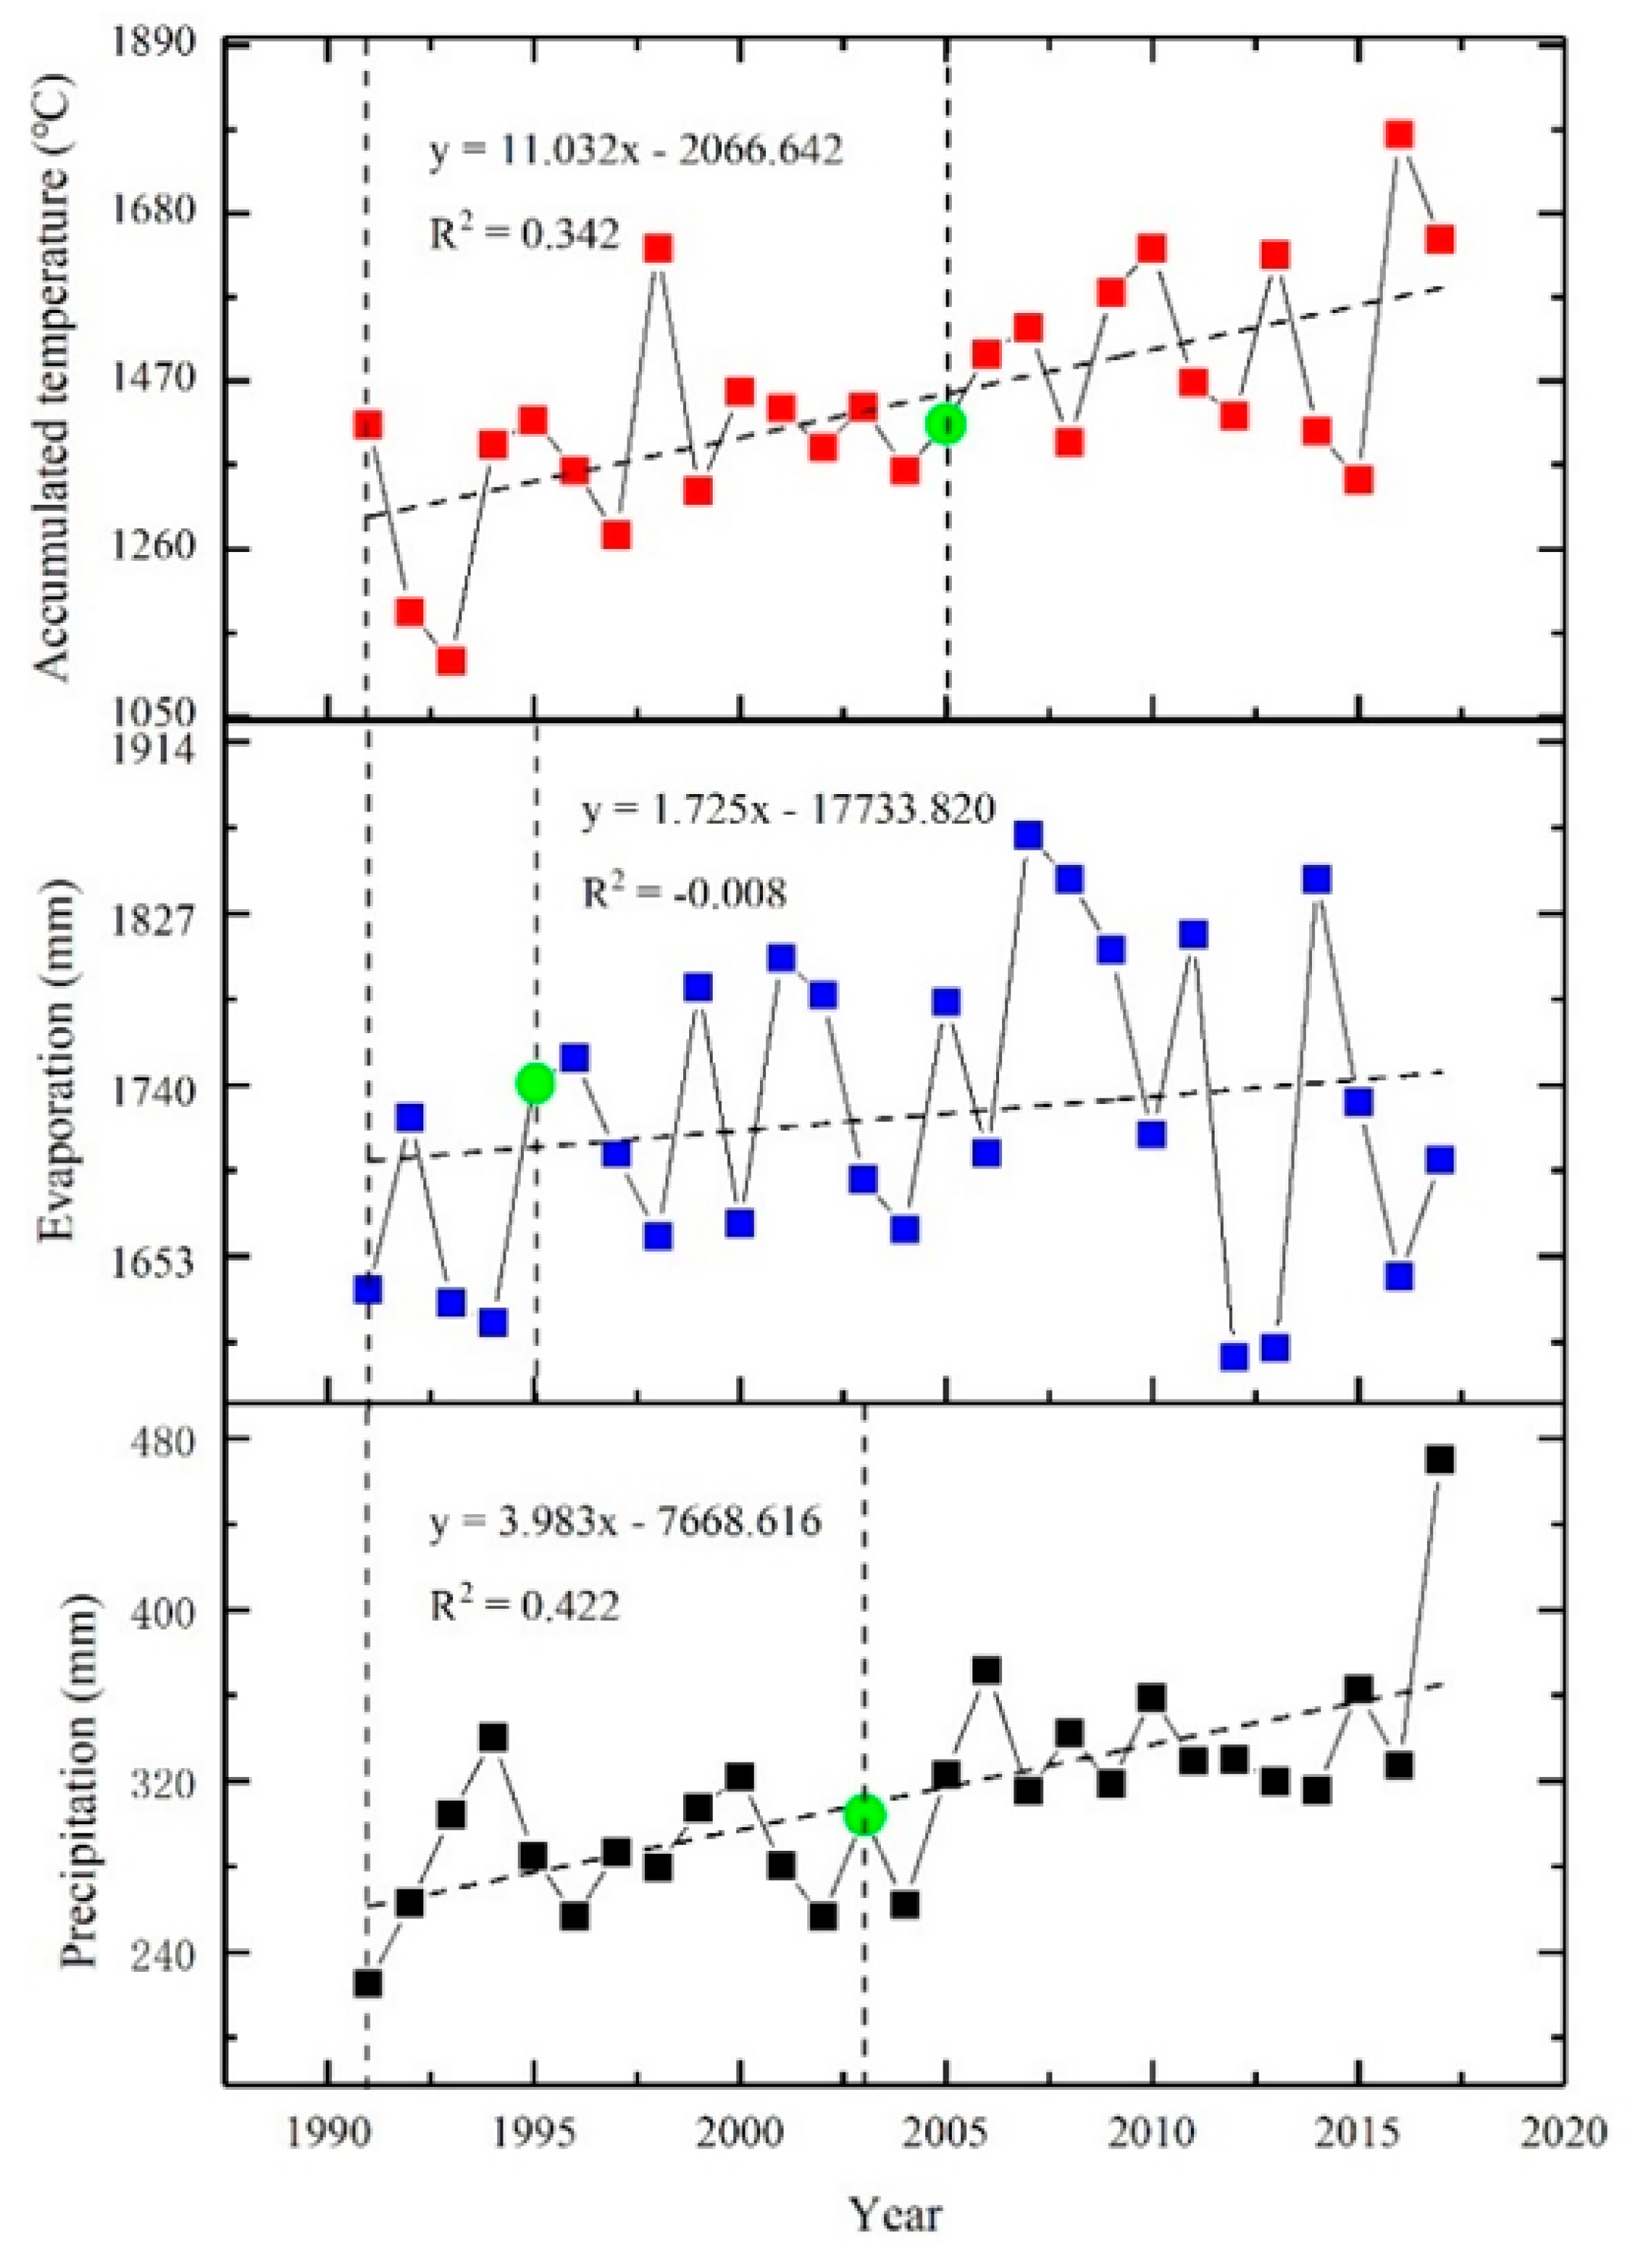
4.4. Driving Factors of Qinghai Lake Water Variation

In this paper, we calculated the annual accumulated temperature by selecting the daily temperature greater than 10 °C, which is proven to be increasingly important for assessing the impact of climate change [52].We adopted the Mann–Kendall (M–K) [53] trend analysis to identify the tipping point and trend of accumulated temperature, precipitation, and evaporation from 1991 to 2017 in Qinghai Lake Basin (Figure 8). The M–K method is a nonparametric analysis method that has been extensively used for time-series hydrological analysis [54]. The results show that the annual accumulated temperature, precipitation, and evaporation in the Qinghai Lake Basin was overall increasing gradually. The tipping points of accumulated temperature and precipitation are 2005 and 2003, respectively, which is close to the turning point of the lake water volume. The average accumulated temperature in 1991–2005 is 1374.47 °C, which jumps to 1520.15 °C in 2005–2017. The average precipitation changes from 285.31 mm in 1991–2003 to 336.67 mm in 2003–2017. However, the change point of evaporation occurs in 1995. The average evaporation of 1991–1995 and 1995–2017 are 1669.86 mm and 1736.36 mm, respectively.
We employed the GRA to investigate how the climatic elements have affected the relative water volume of Qinghai Lake in the past 30 years. The relational grade (Table 4) between the annual accumulated temperature, precipitation, and evaporation, and the water volume of Qinghai Lake was obtained through Equations (4) and (5). In addition, three different correlation analysis methods (i.e., Pearson, Kendall, and Spearman) were adopted for cross comparison.
According to the results of three different correlation analyses, the correlation of precipitation is the highest no matter which method is applied. The correlation between water volume and accumulated temperature is relatively low, while that with evaporation is negative. The relational grade of GRA also suggests that precipitation has the greatest impact on the water volume, with a relational grade of 0.95. The accumulated temperature has a value of 0.56, and evaporation exerts the weakest effect on water volume dynamics, with a relational grade of 0.51.
To further explore the relationship between climate factors and Qinghai Lake water volume, we performed the Pearson analysis in 1991–2004 and 2004–2017 separately (Table 5). During the period of 1991–2004, it seems that the accumulated temperature is the major factor affecting the decline of Qinghai Lake water volume. For the period of 2004–2017, the increase of water volume seems to be mainly positively affected by the precipitation, with the correlation coefficient close to 0.6 and p < 0.05.

5. Discussion

As the largest inland saline lake on the plateau in China, Qinghai Lake not only regulates the local climate through the “lake effect”, but also directly affects the wetlands and sandy land around the lake. This study made full use of the continuity of the medium- to high-resolution Landsat imagery and combined them with higher-resolution Sentinel-2 imagery for more accurate and long-term monitoring of Qinghai Lake water area dynamics. Meanwhile, the water level data acquired by satellite altimetry were employed to transform the Landsat-based water area dynamics to water volume dynamics. The results show that the water area, water level, and water volume of Qinghai Lake from 1991 to 2020 all exhibit a first-decline-then-increase pattern. The turning point occurred in 2004, when the water level and area reached the minimum. Since then, Qinghai Lake has entered into a period of stable expansion. Overall, our findings were found to be consistent with previous studies [23,24,48,55,56]. However, compared with the annual average water level obtained from gauge stations of Qinghai Lake by Li et al. [42], the water level of the Hydroweb dataset is relatively higher. Due to the lack of lake bathymetry dataset, the water volume estimated in this study only represents the water volume change relative to 1991, instead of the real water volume change. Moreover, different altimetry data have different uncertainties due to their different data quality. In the future, we will consider combining the lake bathymetry and fusing different altimetry satellite data to deepen the research on water level and water volume.
Existing studies have proven that local climate change in the Qinghai Lake Basin in recent years leads to gradual increases in temperature and precipitation and decreases in evapotranspiration [48,57]. Zhang et al. [37] found that increased net precipitation contributes the majority of the water supply (74%) for the lake volume increase, followed by glacier mass loss (13%) and ground ice melt due to permafrost degradation (12%) on the Tibetan Plateau from 2003–2009. Song et al. [58] also pointed out that the meltwater from mountainous glaciers and snow cover have become important water sources for Qinghai Lake, supported by the work of Zhang et al. [33]. Considering the increasing contribution of glaciers and precipitation to the water balance, it is anticipated that the water volume of the plateau inland lakes will continue to increase in the next few decades. We also found that the increasing precipitation had a major contribution to the increase of Qinghai Lake’s water volume, indicating possible continuous water increasing in the near future [59]. Continuous rising of water level and expansion of water area may breed a better ecological environment and richer biodiversity, which would be beneficial for local ecological protection and desertification prevention [48].

6. Conclusions

We integrated Landsat and Sentinel-2 remote sensing imagery to construct a long-term 10 m resolution lake water area variation series, which was further associated with the Hydroweb water level dataset to estimate the water volume change. Through this process, we were able to provide the highest resolution long-term Qinghai Lake water monitoring results to date. The driving factors of lake water variation were further analyzed through the grey theory. Based on the results, we draw the following conclusions.
(1) The spatial downscaling method that was incorporated with the Sentinel-2 and Landsat imagery can effectively take advantage of Landsat’s long time series and Sentinel-2’s high spatial resolution and thus achieve long-term and high-resolution lake monitoring. The resultant water extent was proven to have an improved overall accuracy of 92.10% and Kappa coefficient of 0.84.
(2) The area, water level, and water volume of the Qinghai Lake exhibit the same first-decline-then-increase pattern, with 2004 as the turning point. The minimum lake area that occurred in 2004 is 4199.23 km2, and the maximum is 4494.99 km2 in 2020. The water level dropped from 3194.22 m in 1995 to 3193.62 m in 2004 with an average descending speed of 0.05 m/a, and then raised to 3197.20 m in 2020, with an average rate of 0.22 m/a. The water volume decreased between 1991 and 2004, with a fitted rate of 0.34 km3/a, while it increased between 2004 and 2020, with a fitted rate of 0.89 km3/a.
(3) The results of the GRA and three correlation analyses all indicate that precipitation has the greatest impact on the water volume variation of Qinghai Lake, followed by accumulated temperature and evaporation. From 1991–2004, the Pearson correlation analysis indicates that accumulated temperature is the primary factor affecting the decline of Qinghai Lake water volume, while the increase of water volume from 2004–2017 seems to be mainly positively affected by precipitation.

Author Contributions

Conceptualization, W.L. and C.H.; Data curation, Q.C.; Formal analysis, Q.C.; Funding acquisition, C.H.; Methodology, Q.C. and C.H.; Resources, C.H.; Software, Q.C.; Supervision, C.H.; Writing—original draft, Q.C.; Writing—review and editing, W.L. and C.H. All authors have read and agreed to the published version of the manuscript.

Funding

This work was funded by the Shaanxi Natural Science Foundation (2021JM-314), and the National Key R&D Program of China (2017YFC0404302).

Institutional Review Board Statement

Not applicable.

Informed Consent Statement

Not applicable.

Data Availability Statement

Not applicable.

Conflicts of Interest

The authors declare no conflict of interest.

References

  1. Sobek, S.; Algesten, G.; BergstrÖM, A.-K.; Jansson, M.; Tranvik, L.J. The catchment and climate regulation of pCO2 in boreal lakes. Glob. Change Biol. 2003, 9, 630–641. [Google Scholar] [CrossRef]
  2. Verpoorter, C.; Kutser, T.; Seekell, D.A.; Tranvik, L.J. A global inventory of lakes based on high-resolution satellite imagery. Geophys. Res. Lett. 2014, 41, 6396–6402. [Google Scholar] [CrossRef]
  3. Wang, J.; Song, C.; Reager, J.T.; Yao, F.; Famiglietti, J.S.; Sheng, Y.; MacDonald, G.M.; Brun, F.; Schmied, H.M.; Marston, R.A.; et al. Recent global decline in endorheic basin water storages. Nat. Geosci. 2018, 11, 926–932. [Google Scholar] [CrossRef] [Green Version]
  4. Alsdorf, D.E.; Rodríguez, E.; Lettenmaier, D.P. Measuring surface water from space. Rev. Geophys. 2007, 45. [Google Scholar] [CrossRef]
  5. Lehner, B.; Döll, P. Development and validation of a global database of lakes, reservoirs and wetlands. J. Hydrol. 2004, 296, 1–22. [Google Scholar] [CrossRef]
  6. Hansen, J.; Ruedy, R.; Sato, M.; Lo, K. Global surface temperature change. Rev. Geophys. 2010, 48, RG4004. [Google Scholar] [CrossRef] [Green Version]
  7. Jung, M.; Kim, H.; Mallari, K.J.B.; Pak, G.; Yoon, J. Analysis of effects of climate change on runoff in an urban drainage system: A case study from Seoul, Korea. Water Sci. Technol. 2014, 71, 653–660. [Google Scholar] [CrossRef]
  8. Li, B.; Yu, Z.; Liang, Z.; Song, K.; Li, H.; Wang, Y.; Zhang, W.; Acharya, K. Effects of Climate Variations and Human Activities on Runoff in the Zoige Alpine Wetland in the Eastern Edge of the Tibetan Plateau. J. Hydrol. Eng. 2014, 19, 1026–1035. [Google Scholar] [CrossRef]
  9. Qin, B.; Huang, Q. Evaluation of the Climatic Change Impacts on the Inland Lake—A Case Study of Lake Qinghai, China. Clim. Change 1998, 39, 695–714. [Google Scholar] [CrossRef]
  10. Rouhani, H.; Jafarzadeh, M.S. Assessing the climate change impact on hydrological response in the Gorganrood River Basin, Iran. J. Water Clim. Change 2017, 9, 421–433. [Google Scholar] [CrossRef]
  11. Zhu, J.; Song, C.; Wang, J.; Ke, L. China’s inland water dynamics: The significance of water body types. Proc. Natl. Acad. Sci. USA 2020, 117, 13876–13878. [Google Scholar] [CrossRef] [PubMed]
  12. Luo, S.; Song, C.; Zhan, P.; Liu, K.; Chen, T.; Li, W.; Ke, L. Refined estimation of lake water level and storage changes on the Tibetan Plateau from ICESat/ICESat-2. Catena 2021, 200, 105177. [Google Scholar] [CrossRef]
  13. Wang, H.; Long, H.; Li, X.; Yu, F. Evaluation of changes in ecological security in China’s Qinghai Lake Basin from 2000 to 2013 and the relationship to land use and climate change. Environ. Earth Sci. 2014, 72, 341–354. [Google Scholar] [CrossRef]
  14. Schumann, G.J.P.; Moller, D.K. Microwave remote sensing of flood inundation. Phys. Chem. Earth Parts A/B/C 2015, 83–84, 84–95. [Google Scholar] [CrossRef]
  15. Huang, C.; Chen, Y.; Wu, J.; Li, L.; Liu, R. An evaluation of Suomi NPP-VIIRS data for surface water detection. Remote. Sens. Lett. 2015, 6, 155–164. [Google Scholar] [CrossRef]
  16. Song, C.; Huang, B.; Ke, L. Inter-annual changes of alpine inland lake water storage on the Tibetan Plateau: Detection and analysis by integrating satellite altimetry and optical imagery. Hydrol. Process. 2014, 28, 2411–2418. [Google Scholar] [CrossRef]
  17. Lyons, E.A.; Sheng, Y.; Smith, L.C.; Li, J.; Hinkel, K.M.; Lenters, J.D.; Wang, J. Quantifying sources of error in multitemporal multisensor lake mapping. Int. J. Remote. Sens. 2013, 34, 7887–7905. [Google Scholar] [CrossRef]
  18. Li, S.; Sun, D.; Goldberg, M.; Stefanidis, A. Derivation of 30-m-resolution water maps from TERRA/MODIS and SRTM. Remote. Sens. Environ. 2013, 134, 417–430. [Google Scholar] [CrossRef]
  19. Smith, L.C. Satellite remote sensing of river inundation area, stage, and discharge: A review. Hydrol. Process. 1997, 11, 1427–1439. [Google Scholar] [CrossRef]
  20. Jain, S.K.; Singh, R.D.; Jain, M.K.; Lohani, A.K. Delineation of Flood-Prone Areas Using Remote Sensing Techniques. Water Resour. Manag. 2005, 19, 333–347. [Google Scholar] [CrossRef]
  21. Frazier, P.S.; Page, K.J. Water body detection and delineation with Landsat TM data. Photogramm. Eng. Remote. Sens. 2000, 66, 1461–1468. [Google Scholar]
  22. Du, Z.; Li, W.; Zhou, D.; Tian, L.; Ling, F.; Wang, H.; Gui, Y.; Sun, B. Analysis of Landsat-8 OLI imagery for land surface water mapping. Remote. Sens. Lett. 2014, 5, 672–681. [Google Scholar] [CrossRef]
  23. Cui, B.-L.; Xiao, B.; Li, X.-Y.; Wang, Q.; Zhang, Z.-H.; Zhan, C.; Li, X.-D. Exploring the geomorphological processes of Qinghai Lake and surrounding lakes in the northeastern Tibetan Plateau, using Multitemporal Landsat Imagery (1973–2015). Glob. Planet. Change 2017, 152, 167–175. [Google Scholar] [CrossRef] [Green Version]
  24. Zhang, G.; Xie, H.; Yao, T.; Kang, S. Water balance estimates of ten greatest lakes in China using ICESat and Landsat data. Chin. Sci. Bull. 2013, 58, 3815–3829. [Google Scholar] [CrossRef] [Green Version]
  25. Huang, C.; Chen, Y.; Zhang, S.; Wu, J. Detecting, Extracting, and Monitoring Surface Water from Space Using Optical Sensors: A Review. Rev. Geophys. 2018, 56, 333–360. [Google Scholar] [CrossRef]
  26. Du, Y.; Zhang, Y.; Ling, F.; Wang, Q.; Li, W.; Li, X. Water Bodies’ Mapping from Sentinel-2 Imagery with Modified Normalized Difference Water Index at 10-m Spatial Resolution Produced by Sharpening the SWIR Band. Remote Sens. 2016, 8, 354. [Google Scholar] [CrossRef] [Green Version]
  27. Yang, X.; Zhao, S.; Qin, X.; Zhao, N.; Liang, L. Mapping of Urban Surface Water Bodies from Sentinel-2 MSI Imagery at 10 m Resolution via NDWI-Based Image Sharpening. Remote Sens. 2017, 9, 596. [Google Scholar] [CrossRef] [Green Version]
  28. Emelyanova, I.V.; McVicar, T.R.; Van Niel, T.G.; Li, L.T.; van Dijk, A.I.J.M. Assessing the accuracy of blending Landsat–MODIS surface reflectances in two landscapes with contrasting spatial and temporal dynamics: A framework for algorithm selection. Remote. Sens. Environ. 2013, 133, 193–209. [Google Scholar] [CrossRef]
  29. Feng, G.; Masek, J.; Schwaller, M.; Hall, F. On the blending of the Landsat and MODIS surface reflectance: Predicting daily Landsat surface reflectance. IEEE Trans. Geosci. Remote. Sens. 2006, 44, 2207–2218. [Google Scholar] [CrossRef]
  30. Zhu, X.; Chen, J.; Gao, F.; Chen, X.; Masek, J.G. An enhanced spatial and temporal adaptive reflectance fusion model for complex heterogeneous regions. Remote. Sens. Environ. 2010, 114, 2610–2623. [Google Scholar] [CrossRef]
  31. Wu, P.; Shen, H.; Zhang, L.; Göttsche, F.-M. Integrated fusion of multi-scale polar-orbiting and geostationary satellite observations for the mapping of high spatial and temporal resolution land surface temperature. Remote. Sens. Environ. 2015, 156, 169–181. [Google Scholar] [CrossRef]
  32. Wu, G.; Liu, Y. Downscaling Surface Water Inundation from Coarse Data to Fine-Scale Resolution: Methodology and Accuracy Assessment. Remote Sens. 2015, 7, 15989–16003. [Google Scholar] [CrossRef] [Green Version]
  33. Zhang, G.; Xie, H.; Kang, S.; Yi, D.; Ackley, S.F. Monitoring lake level changes on the Tibetan Plateau using ICESat altimetry data (2003–2009). Remote. Sens. Environ. 2011, 115, 1733–1742. [Google Scholar] [CrossRef]
  34. Medina, C.E.; Gomez-Enri, J.; Alonso, J.J.; Villares, P. Water level fluctuations derived from ENVISAT Radar Altimeter (RA-2) and in-situ measurements in a subtropical waterbody: Lake Izabal (Guatemala). Remote Sens. Environ. 2008, 112, 3604–3617. [Google Scholar] [CrossRef]
  35. Crétaux, J.F.; Arsen, A.; Calmant, S.; Kouraev, A.; Vuglinski, V.; Bergé-Nguyen, M.; Gennero, M.C.; Nino, F.; Abarca Del Rio, R.; Cazenave, A.; et al. SOLS: A lake database to monitor in the Near Real Time water level and storage variations from remote sensing data. Adv. Space Res. 2011, 47, 1497–1507. [Google Scholar] [CrossRef]
  36. Birkett, C.M. The contribution of TOPEX/POSEIDON to the global monitoring of climatically sensitive lakes. J. Geophys. Res. Ocean. 1995, 100, 25179–25204. [Google Scholar] [CrossRef]
  37. Zhang, G.; Yao, T.; Shum, C.K.; Yi, S.; Yang, K.; Xie, H.; Feng, W.; Bolch, T.; Wang, L.; Behrangi, A.; et al. Lake volume and groundwater storage variations in Tibetan Plateau’s endorheic basin. Geophys. Res. Lett. 2017, 44, 5550–5560. [Google Scholar] [CrossRef]
  38. Yue, H.; Liu, Y.; Wei, J. Dynamic change and spatial analysis of Great Lakes in China based on Hydroweb and Landsat data. Arab. J. Geosci. 2021, 14, 149. [Google Scholar] [CrossRef]
  39. Liu, Y.; Li, Y.; Lu, Y.; Yue, H. Remote Sensing Analysis of Volume in Taihu Lake: Application for Icesat/Hydroweb and Landsat Data. Int. Arch. Photogramm. Remote. Sens. Spat. Inf. Sci. 2018, XLII-3, 1161–1163. [Google Scholar] [CrossRef] [Green Version]
  40. Gorelick, N.; Hancher, M.; Dixon, M.; Ilyushchenko, S.; Thau, D.; Moore, R. Google Earth Engine: Planetary-scale geospatial analysis for everyone. Remote. Sens. Environ. 2017, 202, 18–27. [Google Scholar] [CrossRef]
  41. Chang, B.; He, K.-N.; Li, R.-J.; Sheng, Z.-P.; Wang, H. Linkage of Climatic Factors and Human Activities with Water Level Fluctuations in Qinghai Lake in the Northeastern Tibetan Plateau, China. Water 2017, 9, 552. [Google Scholar] [CrossRef] [Green Version]
  42. Li, X.-Y.; Cui, B.-L. The impact of climate changes on water level of Qinghai Lake in China over the past 50 years. Hydrol. Res. 2016, 47, 532–542. [Google Scholar] [CrossRef] [Green Version]
  43. Cui, B.-L.; Li, X.-Y. Stable isotopes reveal sources of precipitation in the Qinghai Lake Basin of the northeastern Tibetan Plateau. Sci. Total. Environ. 2015, 527–528, 26–37. [Google Scholar] [CrossRef] [PubMed]
  44. Li, X.-Y.; Xu, H.-Y.; Sun, Y.-L.; Zhang, D.-S.; Yang, Z.-P. Lake-Level Change and Water Balance Analysis at Lake Qinghai, West China during Recent Decades. Water Resour. Manag. 2006, 21, 1505–1516. [Google Scholar] [CrossRef]
  45. McFeeters, S.K. The use of the Normalized Difference Water Index (NDWI) in the delineation of open water features. Int. J. Remote. Sens. 1996, 17, 1425–1432. [Google Scholar] [CrossRef]
  46. Guo, Q.; Pu, R.; Li, J.; Cheng, J. A weighted normalized difference water index for water extraction using Landsat imagery. Int. J. Remote. Sens. 2017, 38, 5430–5445. [Google Scholar] [CrossRef]
  47. Zhang, G.; Chen, W.; Xie, H. Tibetan Plateau’s Lake Level and Volume Changes from NASA’s ICESat/ICESat-2 and Landsat Missions. Geophys. Res. Lett. 2019, 46, 13107–13118. [Google Scholar] [CrossRef]
  48. Zhang, M.; Song, Y.; Dong, H. Hydrological trend of Qinghai Lake over the last 60 years: Driven by climate variations or human activities? J. Water Clim. Change 2019, 10, 524–534. [Google Scholar] [CrossRef]
  49. Allen, R.G.P.; Luis, S.; Raes, D.; Smith, M. Crop evapotranspiration-Guidelines for computing crop water requirements-FAO Irrigation and drainage paper 56. Food Agric. Organ. United 1998, 300, D05109. [Google Scholar]
  50. Chan, J.W.K.; Tong, T.K.L. Multi-criteria material selections and end-of-life product strategy: Grey relational analysis approach. Mater. Des. 2007, 28, 1539–1546. [Google Scholar] [CrossRef]
  51. Bolboaca, S.-D.; Jäntschi, L. Pearson versus Spearman, Kendall’s tau correlation analysis on structure-activity relationships of biologic active compounds. Leonardo J. Sci. 2006, 5, 179–200. [Google Scholar]
  52. Hallett, S.H.; Jones, R.J.A. Compilation of an accumulated temperature database for use in an environmental information system. Agric. For. Meteorol. 1993, 63, 21–34. [Google Scholar] [CrossRef]
  53. Wang, M.; Du, L.; Ke, Y.; Huang, M.; Zhang, J.; Zhao, Y.; Li, X.; Gong, H. Impact of Climate Variabilities and Human Activities on Surface Water Extents in Reservoirs of Yongding River Basin, China, from 1985 to 2016 Based on Landsat Observations and Time Series Analysis. Remote Sens. 2019, 11, 560. [Google Scholar] [CrossRef] [Green Version]
  54. Choi, W.; Nauth, K.; Choi, J.; Becker, S. Urbanization and Rainfall–Runoff Relationships in the Milwaukee River Basin. Prof. Geogr. 2016, 68, 14–25. [Google Scholar] [CrossRef] [Green Version]
  55. Fu, C.; Wu, H.; Zhu, Z.; Song, C.; Xue, B.; Wu, H.; Ji, Z.; Dong, L. Exploring the potential factors on the striking water level variation of the two largest semi-arid-region lakes in northeastern Asia. Catena 2021, 198, 105037. [Google Scholar] [CrossRef]
  56. Wang, L.; Chen, C.; Thomas, M.; Kaban, M.K.; Güntner, A.; Du, J. Increased water storage of Lake Qinghai during 2004–2012 from GRACE data, hydrological models, radar altimetry and in situ measurements. Geophys. J. Int. 2018, 212, 679–693. [Google Scholar] [CrossRef]
  57. Fang, J.; Li, G.; Rubinato, M.; Ma, G.; Zhou, J.; Jia, G.; Yu, X.; Wang, H. Analysis of Long-Term Water Level Variations in Qinghai Lake in China. Water 2019, 11, 2136. [Google Scholar] [CrossRef] [Green Version]
  58. Song, C.; Huang, B.; Ke, L. Modeling and analysis of lake water storage changes on the Tibetan Plateau using multi-mission satellite data. Remote. Sens. Environ. 2013, 135, 25–35. [Google Scholar] [CrossRef]
  59. Fan, C.; Song, C.; Li, W.; Liu, K.; Cheng, J.; Fu, C.; Chen, T.; Ke, L.; Wang, J. What drives the rapid water-level recovery of the largest lake (Qinghai Lake) of China over the past half century? J. Hydrol. 2021, 593, 125921. [Google Scholar] [CrossRef]
Figure 1. Qinghai Lake Basin.
Water 14 00671 g001
Figure 2. Workflow of this study.
Water 14 00671 g002
Figure 3. Comparison between Sentinel-2 and Landsat 8 water maps, (a) original Landsat 8 image, and (b) downscaled Landsat 8 image. Grey color (S2_land-L8_land) stands for pixels that were identified as Land on Sentinel-2 image and Land on original/downscaled Landsat 8 image. Red color (S2_warer-L8_land) stands for pixels that were identified as Water on Sentinel-2 image and Land on original/downscaled Landsat 8 image (omission error). Green color (S2_land-L8_water) stands for pixels that were identified as Land on Sentinel-2 image and Water on original/downscaled Landsat 8 image (commission error). Blue color (S2_water-L8_water) stands for pixels that were identified as Water on Sentinel-2 image and Water on original/downscaled Landsat 8 image.
Water 14 00671 g003
Figure 4. (a) Annual water area of Qinghai Lake; (b) annual lake area derived from the Landsat image before and after downscaling, in comparison with that extracted from Hydroweb dataset (available for 1995–2017).
Water 14 00671 g004
Figure 5. Shoreline change of Qinghai Lake for (a) 1991–2004, and (b) 2004–2020.
Water 14 00671 g005
Figure 6. (a) The area-level correlation; (b) The water level of the Qinghai Lake in 1991–2020.
Water 14 00671 g006
Figure 7. 30-year water volume dynamics of Qinghai Lake based on water volume of 1991.
Water 14 00671 g007
Figure 8. The change point and trend of accumulated temperature, precipitation, and evaporation from 1991 to 2017 in Qinghai Lake Basin.
Water 14 00671 g008
Table 1. Materials used in this study.
YearSelected BandsSpatial Resolution (m)Purpose
Landsat 5 TM1991–2011B2, B430Water extraction
Landsat 7 ETM+2012B2, B430Water extraction
Landsat 8 OLI2013–2020B3, B530Downscaling Model & water extraction
Sentinel-2 MSI2015–2019B3, B810Downscaling Model
Hydroweb dataset1995–2020--Water volume estimation
Meteorological dataset1991–2017--Driving factor analysis
Table 2. Selected Landsat 8 and Sentinel-2 imagery for establishing the regression model. The bolded pair was for validation only.
SequenceThe Date of Landsat 8The Date of Sentinel-2
12016/07/292016/07/30
22016/10/172016/10/18
32017/07/162017/07/15
42017/11/052017/11/07
52017/12/072017/12/07
62018/02/092018/02/10
72018/02/252018/02/25
82018/03/132018/03/12
92018/10/232018/10/23
102019/01/112019/01/11
112019/04/172019/04/16
Table 3. The accuracy of water maps derived from the original Landsat 8 image and downscaled Landsat 8 image.
Accuracy IndicatorsLandsat 8 ImageDownscaled Landsat 8 Image
commission error (%)6.183.72
omission error (%)5.473.53
overall accuracy (%)88.3592.10
Kappa coefficient0.770.84
Table 4. The correlation of annual mean values of accumulated temperature, precipitation, and evaporation with the annual water volume.
Accumulated TemperaturePrecipitationEvaporation
Pearson0.250.46 *−0.26
Kendall0.120.28−0.14
Spearman0.140.40 *−0.23
Relational grade0.560.950.51
Note: * p < 0.05.
Table 5. Pearson’s r between climate factors and water volume for period 1991–2004 and 2004–2017.
PeriodAccumulated TemperaturePrecipitationEvaporation
1991–2004−0.70 **0.12−0.24
2004–20170.360.60 *−0.32
Note: * p < 0.05; ** p < 0.01.
Publisher’s Note: MDPI stays neutral with regard to jurisdictional claims in published maps and institutional affiliations.

