Article

Assessing the Influences of Land Use Change on Groundwater Hydrochemistry in an Oasis-Desert Region of Central Asia

1
State Key Laboratory of Desert and Oasis Ecology, Xinjiang Institute of Ecology and Geography, Chinese Academy of Sciences, Urumqi 830011, China
2
University of Chinese Academy of Sciences, Beijing 100000, China
*
Authors to whom correspondence should be addressed.
Water 2022, 14(4), 651; https://doi.org/10.3390/w14040651
Submission received: 22 December 2021 / Revised: 15 February 2022 / Accepted: 16 February 2022 / Published: 19 February 2022
(This article belongs to the Special Issue Advances in Studies on Ecohydrological Processes in the Arid Area)

Abstract

:
Land use change greatly affects groundwater hydrochemical cycling and thereby food and ecosystem security in arid regions. Spatiotemporal distribution of groundwater hydrochemistry is vital to understand groundwater water-salt migration processes in the context of land use change, while it is not well known in the oasis-desert region of arid inland basins. Here, to investigate the influences of land use change on groundwater hydrochemistry and suggest sustainable management, 67 water samples were obtained in the Luntai Oasis, a typical oasis desert of Central Asia. Stable isotopes and chemical components of samples were analyzed. Piper and Gibbs plots were used to elaborate the chemical type and major mechanisms controlling water chemistry, respectively. The results showed that cultivated land area has markedly expanded in the Luntai Oasis over the last 20 years (increasing by 121.8%). Groundwater seasonal dynamics and groundwater–surface water interaction were altered dramatically by farmland expansion and groundwater exploitation. Specifically, the spatial heterogeneity and seasonal variability of groundwater hydrochemistry were significant. Compared with the desert area, the δ18O and TDS of river water and shallow groundwater in the oasis cropland exhibited lower values but greater seasonal variation. Higher TDS was observed in autumn for river water, and in spring for shallow groundwater. The chemical evolution of phreatic water was mainly controlled by the evaporation-crystallization process and rock dominance, with a chemical type of Cl-SO4-Na-Mg. Significant spatiotemporal heterogeneity of groundwater hydrochemistry demonstrated the influence of climatic, hydrogeological, land use, and anthropogenic conditions. Groundwater overexploitation would cause phreatic water leakage into confined water, promoting groundwater quality deterioration due to fresh saltwater mixing. Improving agricultural drainage ditches in conjunction with restricting farmland expansion and groundwater extraction is an effective way to alleviate groundwater environment deterioration and maintain oasis-desert ecosystems in arid regions.

1. Introduction

Groundwater is crucial for eco-environmental protection and economic development in arid regions due to limited surface water, especially in arid inland regions [1,2,3]. Groundwater dynamics are governed by the coupled effects of climate inputs and anthropogenic activities [4,5,6]. In recent decades, human intervention (e.g., land use change and irrigation) has caused groundwater depletion and aquifer salinization in arid and semi-arid areas, challenging the local water-food-ecological security [7,8,9,10,11]. Undoubtedly, the expansion of cultivated areas is necessary to satisfy the food requirements of a growing population, resulting in a markedly increasing irrigation water demand for agriculture development thanks to well-developed irrigation canal systems [3,11,12]. However, large-scale farmland expansion has led to groundwater overexploitation for irrigation, thus noticeably altering groundwater hydrochemical cycling (e.g., groundwater salinization) in arid regions, in turn affecting public health, groundwater resource renewability, soil fertility, and vegetation growth [13,14]. Groundwater hydrochemistry is crucial for biogeochemical cycling because it could impact water utilization and the ecological function of groundwater [15,16]. Therefore, a deep understanding of groundwater hydrochemistry and groundwater–surface water interactions impacted by land use change is essential for effective groundwater management for ecological and human requirements in oasis-desert regions [17].
Tarim River Basin is located in the arid region of Central Asia and is the core region of constructing the ‘Silk Road Economic Belt’, which is the largest inland river in China [5]. Groundwater resources play a significant role in maintaining oasis-desert ecosystems in the Tarim Basin [18]. In the past 30 years, farmland expansion in conjunction with groundwater overexploitation has substantially altered groundwater water-salt migration processes and their seasonality in the oasis-desert region of the Tarim River Basin [19]. Accordingly, the vegetation survival in desert regions and the agricultural potential in oasis regions in the Tarim Basin are threatened, such as phreatic decline and groundwater environment deterioration [4,13,20]. Thus, the ecological restoration and irrigated agriculture development in arid inland regions ought to be based on groundwater environment improvement, by focusing on the groundwater hydrochemistry dynamic in responses to land use change [21]. However, a comprehensive assessment of groundwater hydrochemistry dynamic in responses to land use change is still scarce in the oasis-desert regions of Tarim Basin, owing to complex groundwater–surface water interactions, scarce observation data, and intense anthropogenic interferences.
Groundwater hydrochemistry dynamics under farmland expansion are relatively variable and complex [5]. Based on positioning observations, remote sensing inversion, hydrochemical and isotopic techniques, and hydrological modeling, previous studies in arid regions primarily focused on the spatial distributions, temporal dynamics [16,22], origin and age [23,24], migration process, and evolution mechanism [21,25,26] of groundwater hydrochemical components. Simultaneously, several studies have invested the influence of human and climate reasons on groundwater hydrochemistry in arid inland areas [16,27], the freshwater–saltwater interaction between confined aquifers and phreatic aquifers [28,29], as well as groundwater–surface water connectivity [17]. Krishan et al. [29] found that salinity in upper and deeper aquifers exhibited good connectivity in the Punjab state. Moreover, groundwater salinity in arid areas could be influenced by the local climatic conditions, hydrogeologic factors, land use types, groundwater recharge, and discharge as well as anthropogenic reasons (e.g., agricultural activities, water transfer, and groundwater extraction) [13,30,31]. Krishan et al. [31] stated that human activities are leading to the expansion of groundwater salinization. Meanwhile, groundwater hydrochemistry could be controlled by the coupling of multiple mechanisms, including evaporation–condensation, leaching and dissolution, precipitation, flushing and mixing, ion exchange, and subsurface biological activity [22,26,31,32]. Additionally, researchers found that spatiotemporal patterns of ion contents in groundwater can provide an insight into the salt origin, evolution, and migration pathways within the aquifers [26,33], which is helpful to understand groundwater water-salt migration in arid areas [34,35]. Yet, alteration of groundwater water–salt circulation by land use change and its influence on groundwater hydrochemistry evolution in the long term are not well known in the oasis-desert region of the Tarim Basin, particularly under the impact of cultivated area expansion.
This study assessed the influences of land use change on groundwater hydrochemistry using the isotopic and chemical data from 67 water samples obtained in the Luntai Oasis, a typical oasis-desert of the Tarim Basin. The main objectives of our research were to: (a) investigate the spatiotemporal patterns of groundwater hydrochemistry; (b) identify the effects of land use change on groundwater salinity in oasis and desert areas; (c) explore changes in groundwater water-salt circulation and groundwater–surface water interaction within the oasis-desert region. The study aims to not only help improve our understanding of groundwater water–salt migration under agricultural activities but also provide recommendations for optimizing groundwater management and maintaining oasis-desert ecosystems in arid inland regions.

2. Materials and Methods
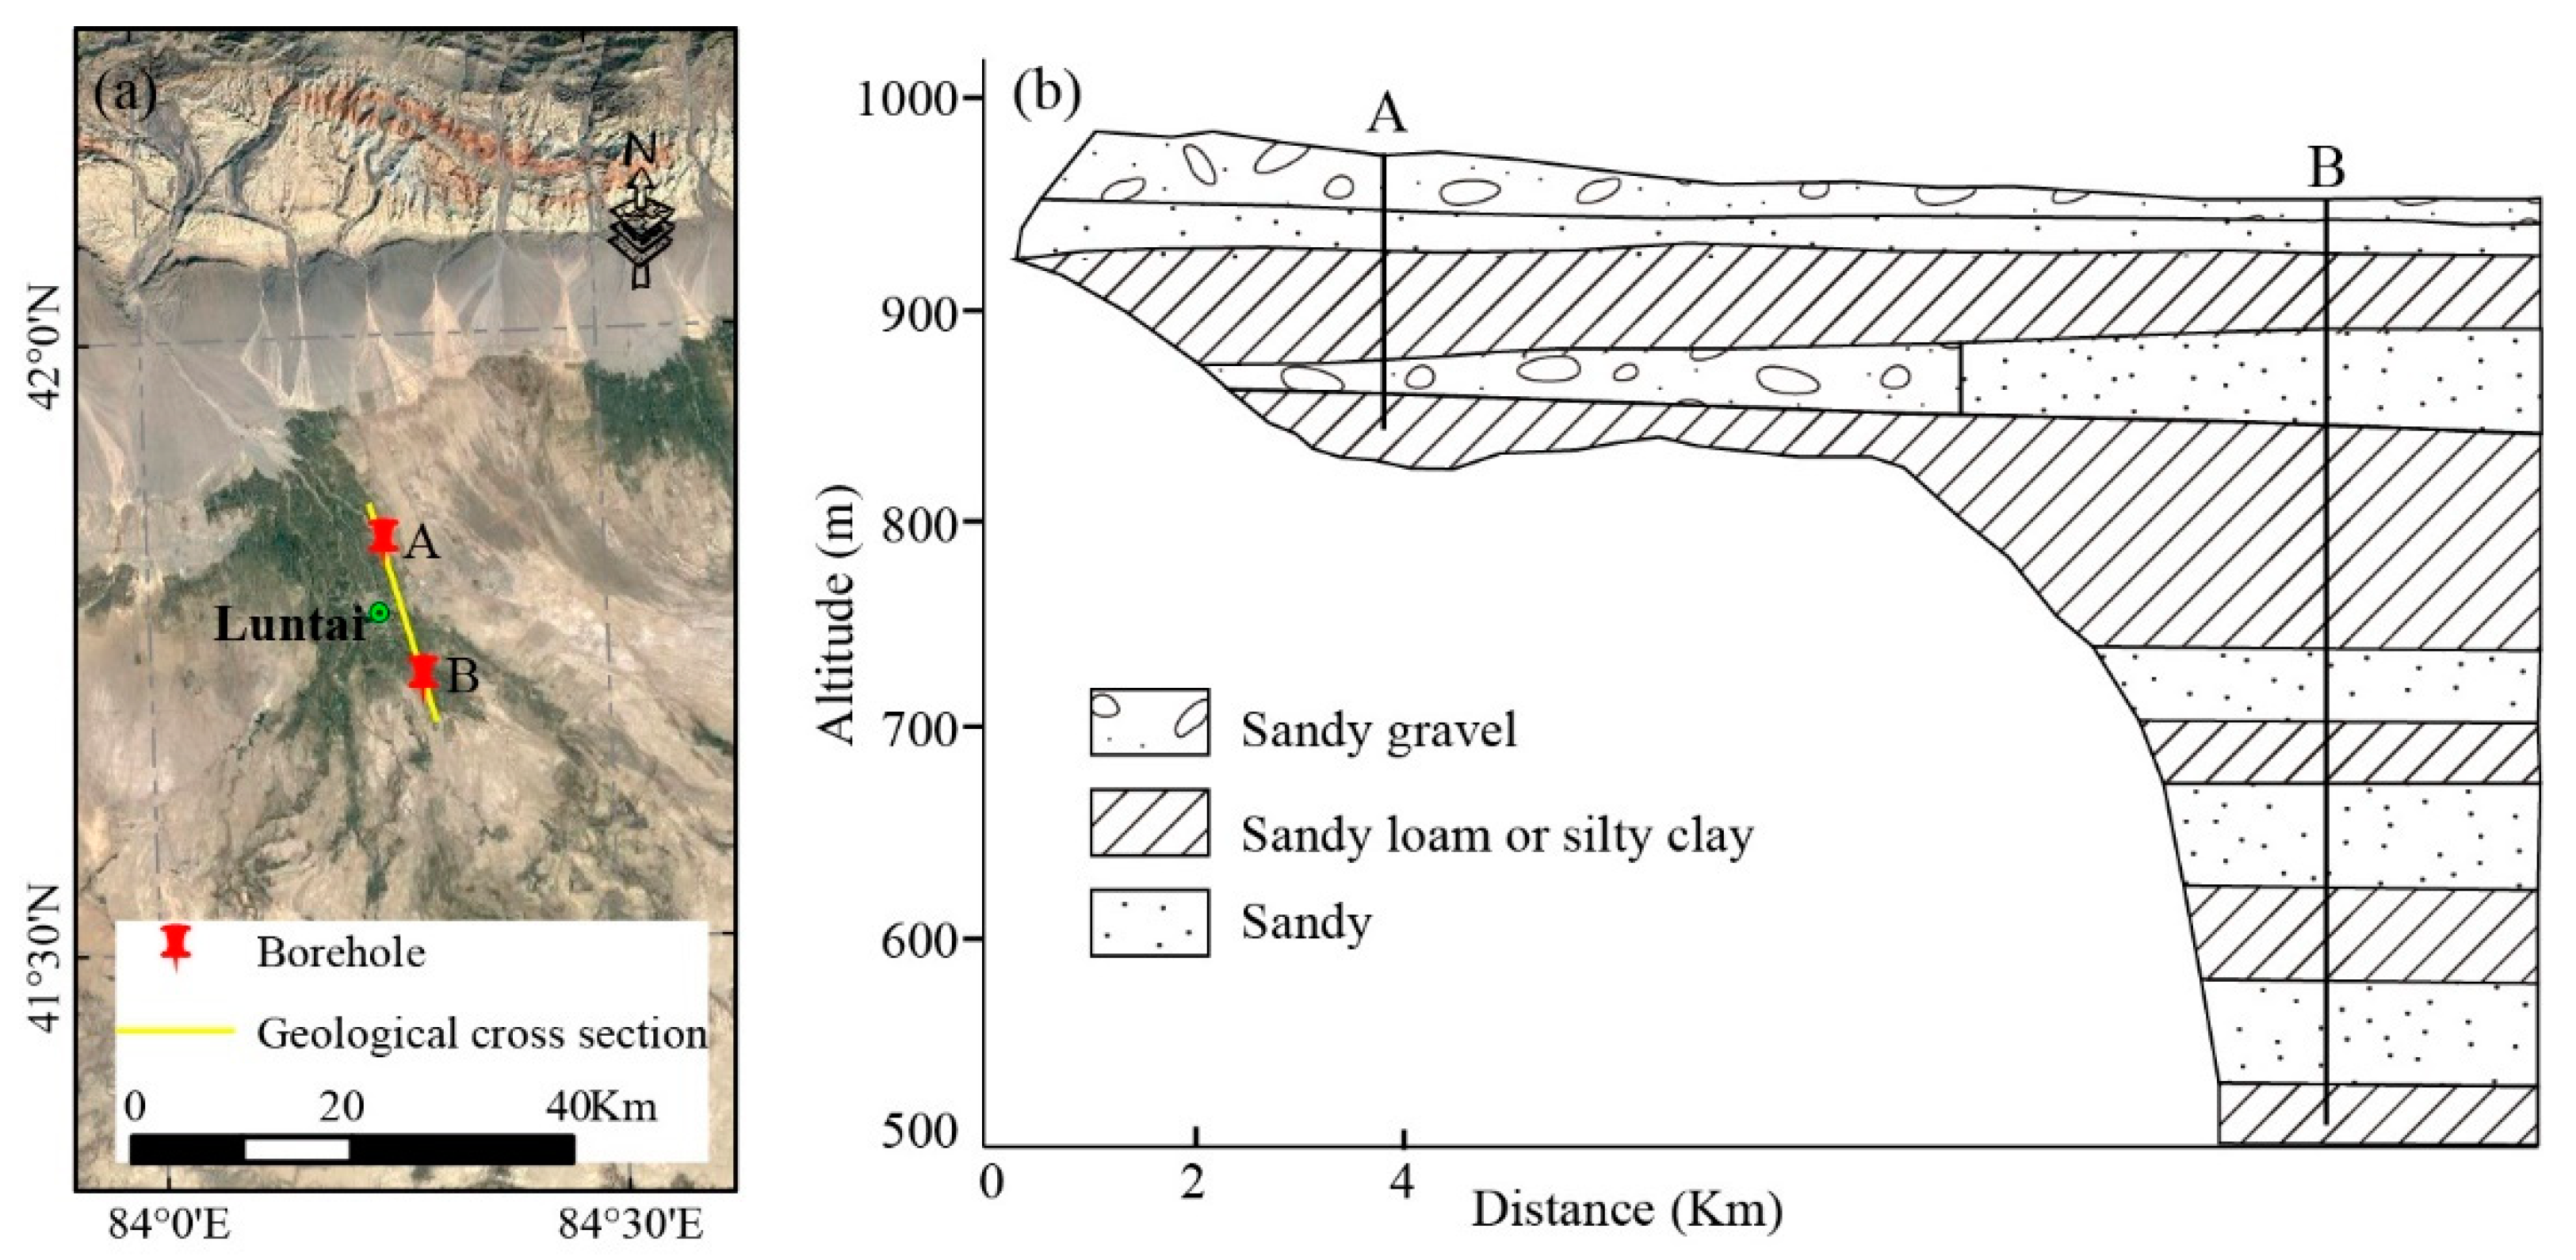
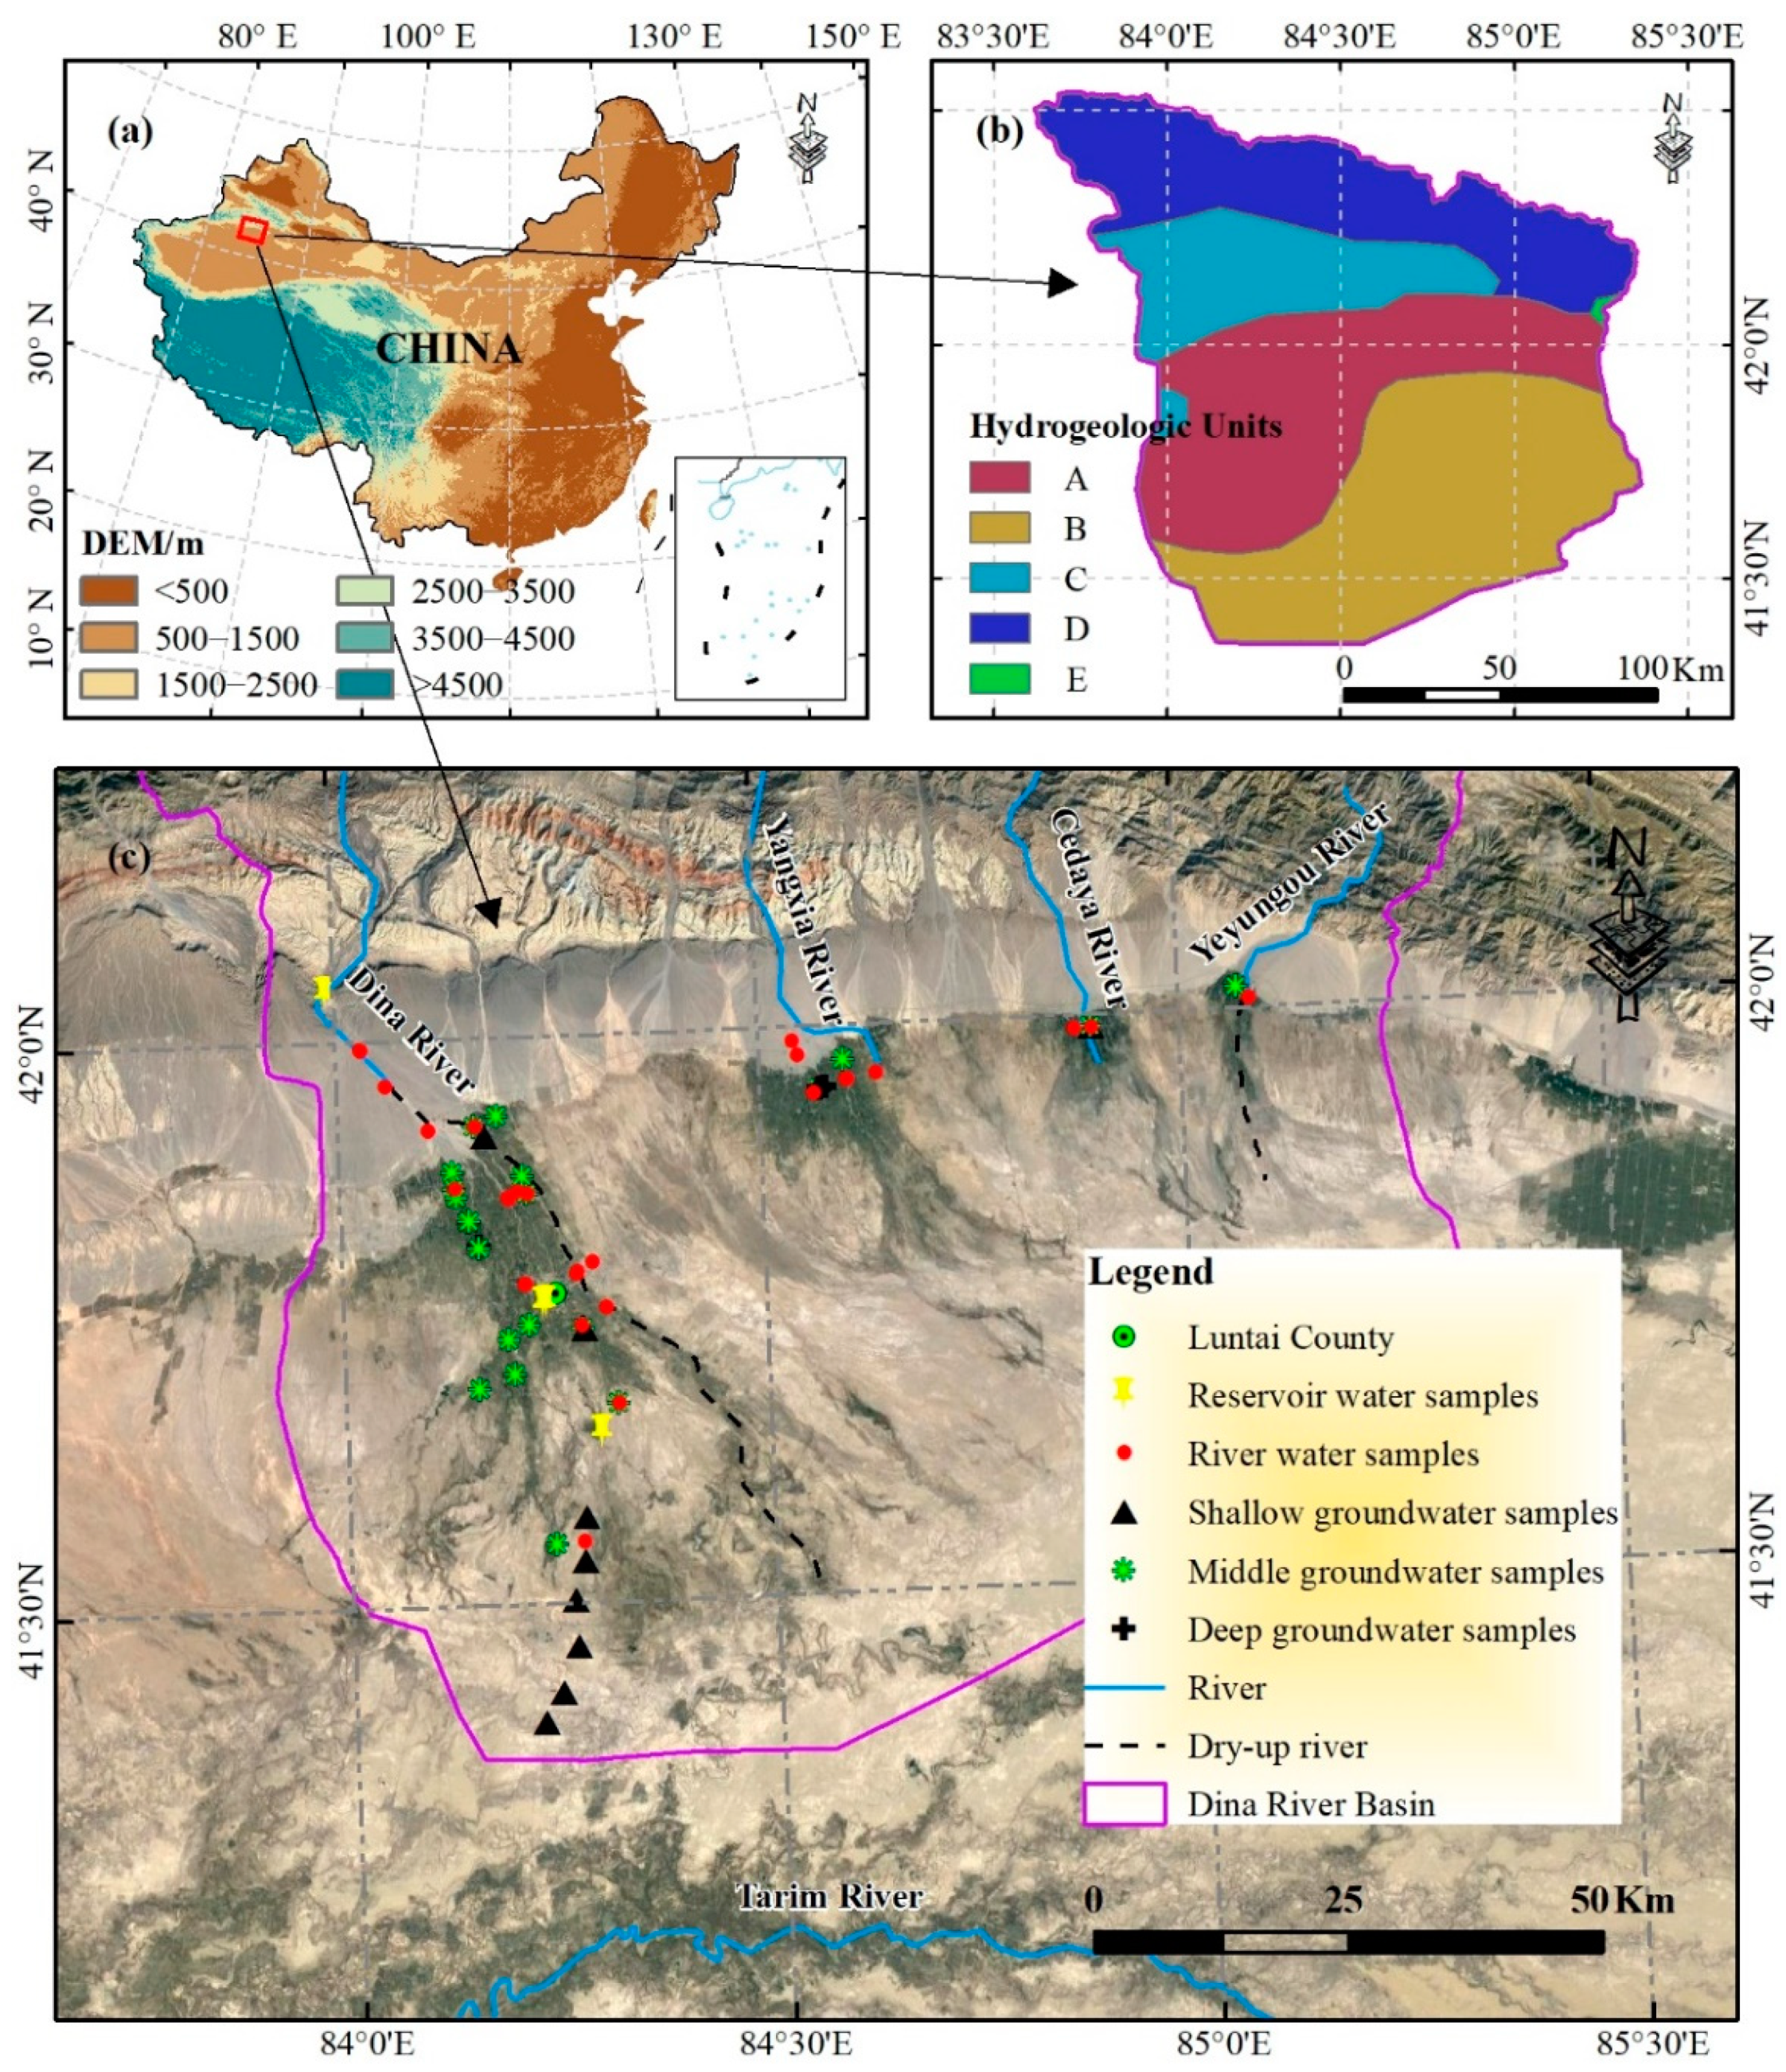
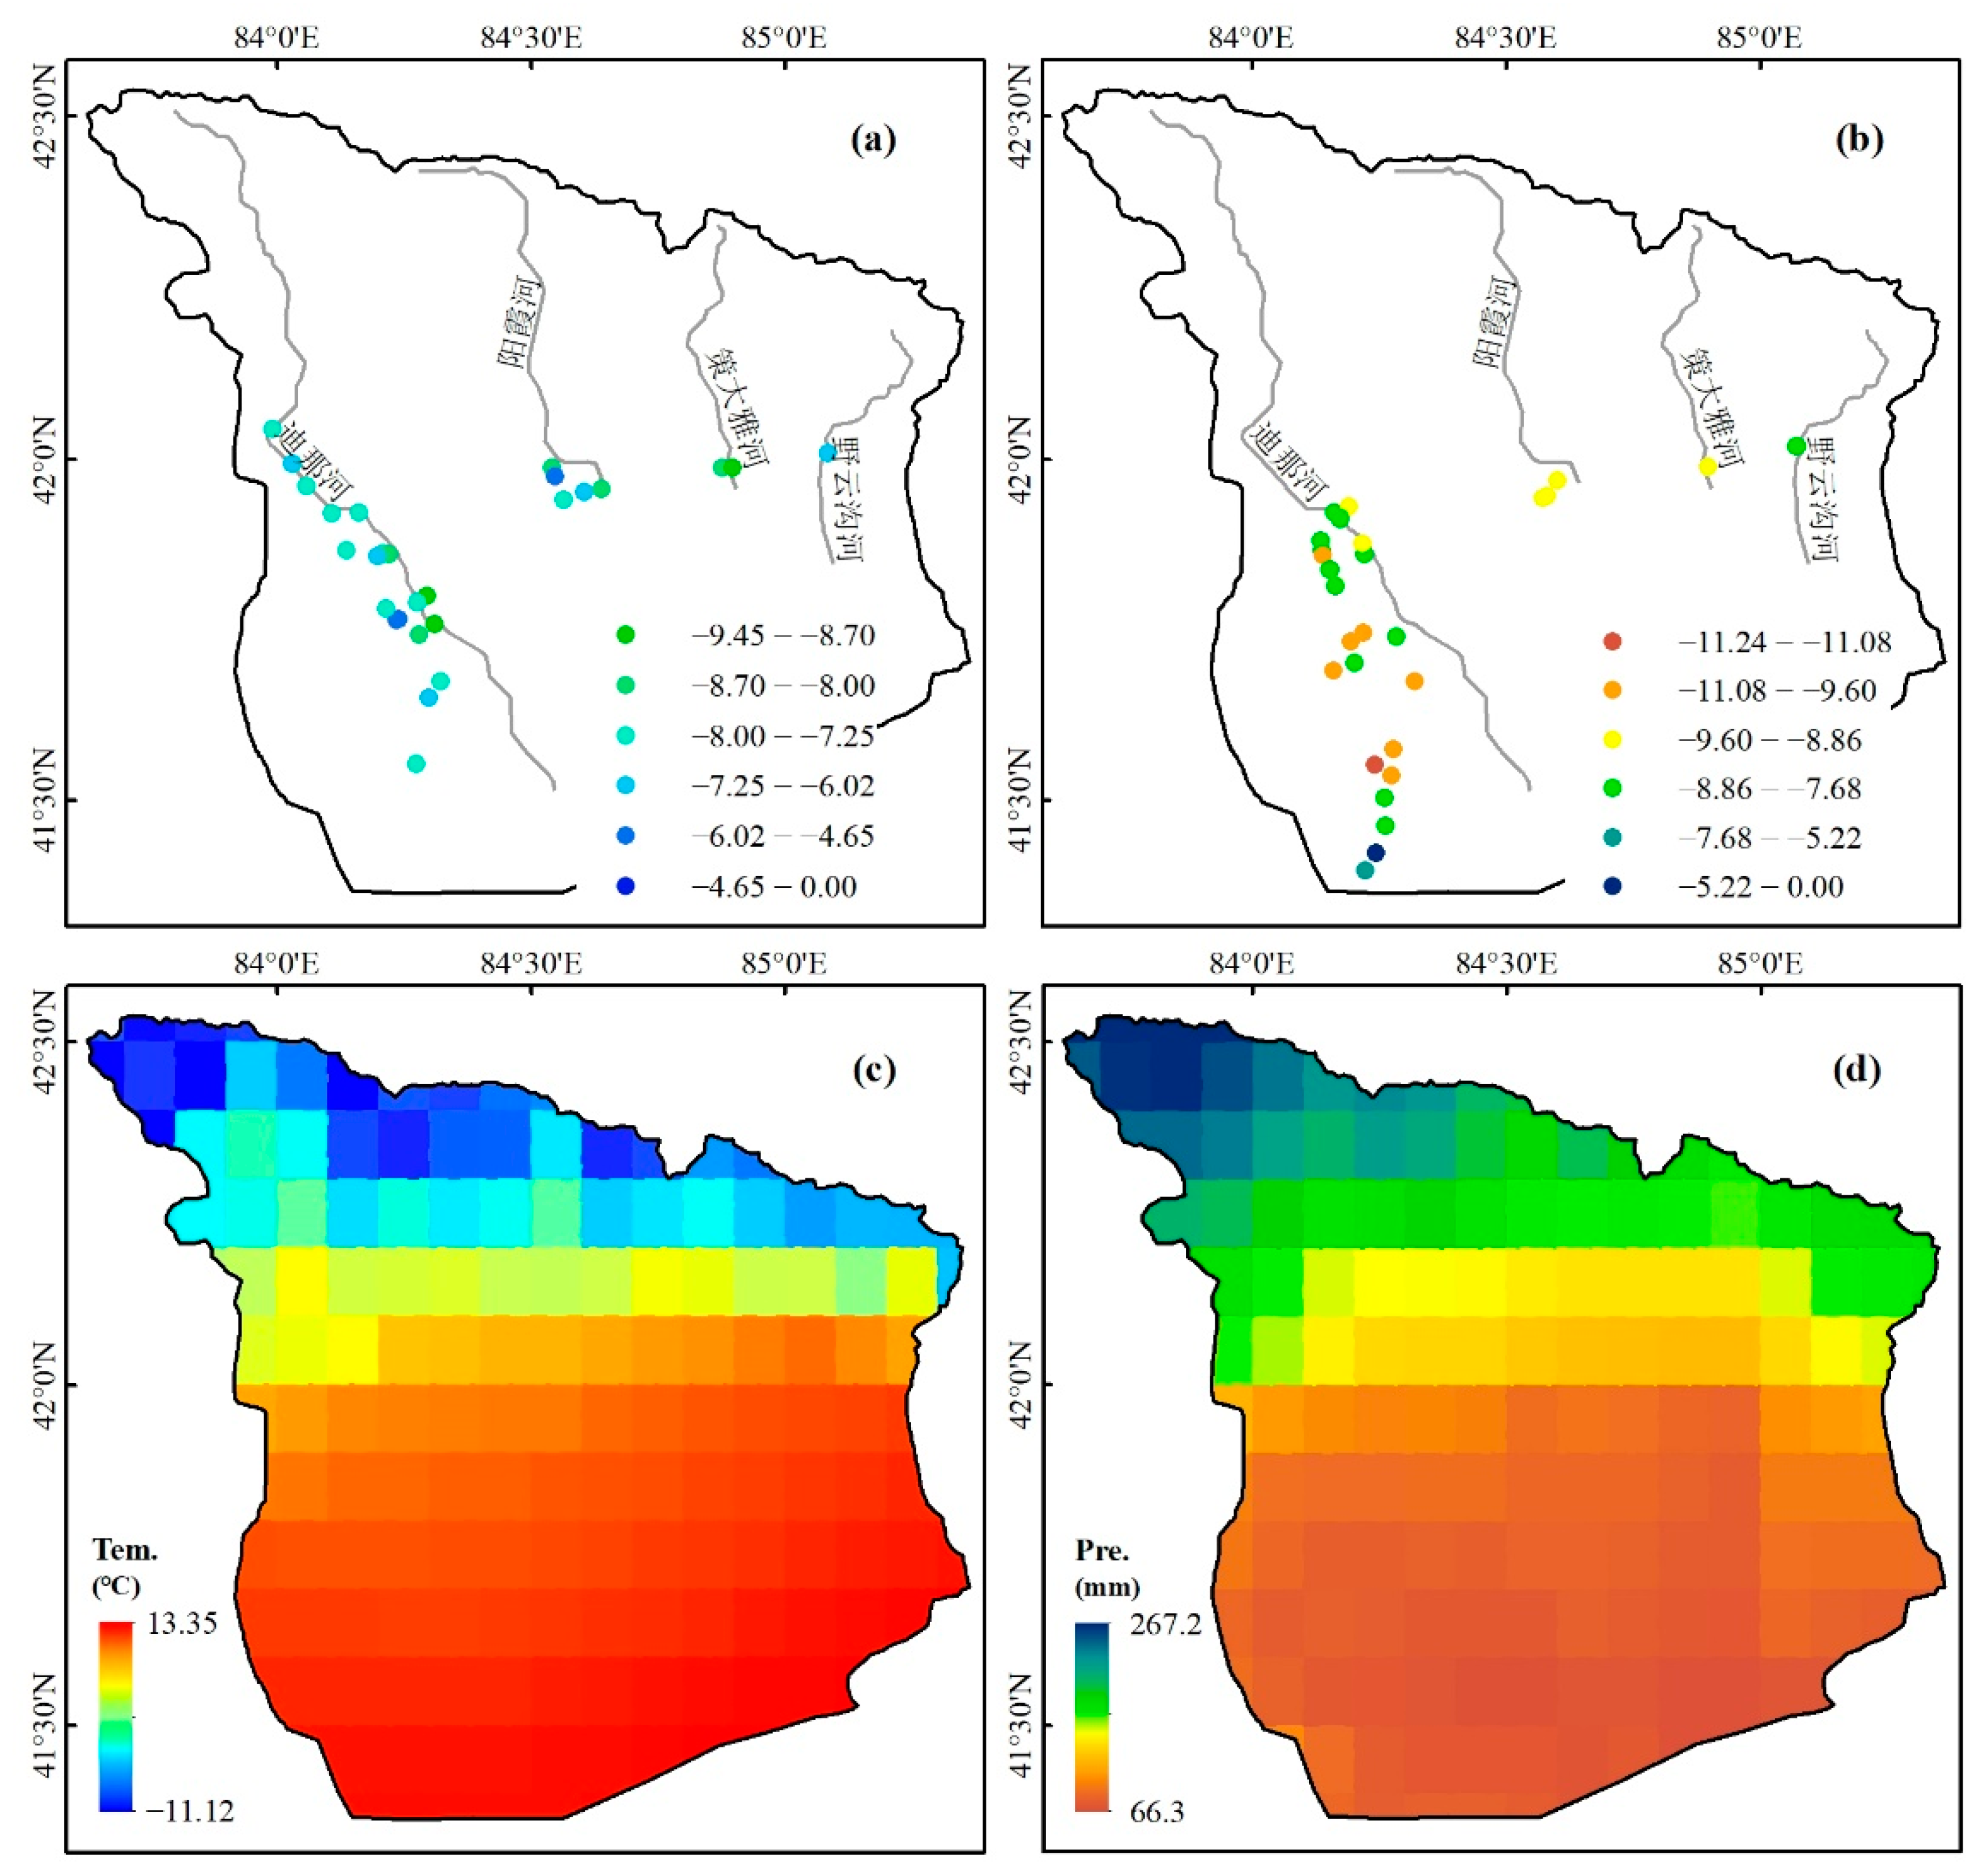
2.1. Study Area

Our study area is the Luntai Oasis (83.88–85.39° E, 41.32–42.14° N), located in the middle and lower reaches of the Dina River Basin, covers an area of 7.76 × 10³ km2, with an altitude from 868 to 2243 m (Figure 1a). The Dina River Basin (83.53–85.51° E, 41.27–42.60° N) is located in the northern Tarim Basin and the southern Tianshan Mountains, including the Dina River, Yangxia River, Cedaya River, and Yeyungou River, and the general terrain is high in the northeast and low in the southwest (Figure 1c). The Luntai Oasis has a temperate arid continental climate, and the mean annual temperature and precipitation are 11.2 °C and 65.4 mm, respectively (data from the Chinese National Meteorological Center; available online: http://cdc.cma.gov.cn (accessed on 18 August 2021)). Peak precipitation occurs in June, and more than 70% of the annual precipitation occurs from May to September. The highest and lowest air temperatures are generally in July and January, respectively. Furthermore, the annual streamflow into the Luntai Oasis is about 5.244 × 10⁸ m3, and has one peak, with the flood season from May to September. More than 90% of the streamflow is diverted into farmland for irrigation, which, over the past few decades, has caused river dried-up within the oasis, and a small amount of flood is discharged only in the flood season [5].
The Luntai Oasis is a piedmont plain region with Quaternary sediments of various hydrogeologic units, which comprises the interstratified fine sandstone, silty fine sandstone, pebbly gravel, and pebbly sandstone, forming aquitards and porous aquifers (Figure 1b and Figure 2b). The northern margin is proluvial sediment, mainly covered by pebbly sandstone (thickness > 50 m). The southern part is alluvial sediment, mainly covered by fine sandstone (thickness = 40–60 m). Moreover, the central part is alluvial-proluvial sediment, mainly covered by fine sandstone (thickness = 20–50 m). The aquifer thickness is relatively small in the northern part of the oasis, while gradually increasing and becoming uniform in the southern part. As shown in Figure 2, the thickness of the second to fifth aquifers at the borehole B is 83.34, 142.16, 78.43, and 95.10 m, respectively. Furthermore, the main land use types within the Luntai Oasis include bare land (62.9%), grassland (18.8%), and cultivated land (17.2%) in 2020. Crops in the Luntai Oasis are mainly dominated by wheat and cotton, and the dominant artificial economic forests are apricot and pear trees.

2.2. Data Collection and Analysis

During the period from April to November in 2019, groundwater and surface water were sampled within the oasis-desert region of Dina River Basin in spring (April), summer (August), and autumn (November) (Figure 1c). Surface water samples included river water and reservoir water, where river water was sampled from the Dina River, Yangxia River, Cedaya River, and Yeyungou River. Groundwater samples in the Luntai Oasis were collected from boreholes (long-term monitoring wells) and pumped wells (including domestic, industrial, and irrigation wells), which were classified into deep groundwater (well depth > 100 m), middle groundwater (20–100 m of well depth), and shallow groundwater (well depth < 20 m) based on the hydrogeological conditions [21]. A total of 67 samples were obtained, including 6 reservoir water samples, 20 river water samples, 21 shallow groundwater samples, 18 middle groundwater samples, and 2 deep groundwater samples. Water samples were filtered through a 0.22 μm filter in situ, and immediately sealed in polyethylene bottles, then stored in a refrigerator (4 °C) until laboratory measurement.
Chemical components and stable water isotopes of all the water samples were analyzed at the State Key Laboratory of Desert and Oasis Ecology, Xinjiang Institute of Ecology and Geography, Chinese Academy of Sciences. δ2H and δ18O values of water samples were analyzed by a liquid water isotope analyzer (LGR DLT-100) and expressed relative to the VSMOW (Vienna Standard Mean Ocean Water) in per million (δ, ‰). The measurement precisions of δ18O and δ2H were ±0.1‰ and ±0.8‰, respectively. The TDS concentration (total dissolved solids) of water samples was determined in situ by a multi-parameter meter (YSI ProPlus), with a measurement precision of 0.01 mg/L. Furthermore, major dissolved ions concentrations (Cl, SO42−, Na+, K+, Ca2+, and Mg2+) of water samples were analyzed by an ion chromatograph (Dionex-320), and the CO32−and HCO3 concentrations were determined using the titration method. The measurement precision of major dissolved ions was below 1%, with the detection limit of 0.1 mg/L and the ionic charge balance error of water samples was within ±10%.
In this study, runoff data at the outlets of mountainous tributaries in the Dina River Basin were obtained from the Water Resource Bureau of Luntai County, China. Precipitation and air temperature data were collected from the Chinese National Meteorological Information Centre (Available online: http://cdc.cma.gov.cn (accessed on 18 August 2021)). LULC (land use and land cover) data were derived from the ESA CCI LC products (300 m resolution, 2000 to 2015) and the C3S Global Land Cover products (300 m resolution, 2016 to 2020). NDVI (normalized difference vegetation index) data were derived from the MODIS NDVI product (MOD13Q1), with a 250 m spatial resolution and 16-day temporal resolution. Furthermore, data statistical analyses were conducted using ArcGIS (ver. 10.6), MATLAB (ver. R2018a), and Origin (ver. 2021). The inverse distance weighting (IDW) method was used to interpolate the data of TDS, Cl, LULC, air temperature, and precipitation into 250 m grid data. Piper and Gibbs plots were used to elaborate the chemical type and major mechanisms controlling water chemistry, respectively.

3. Results

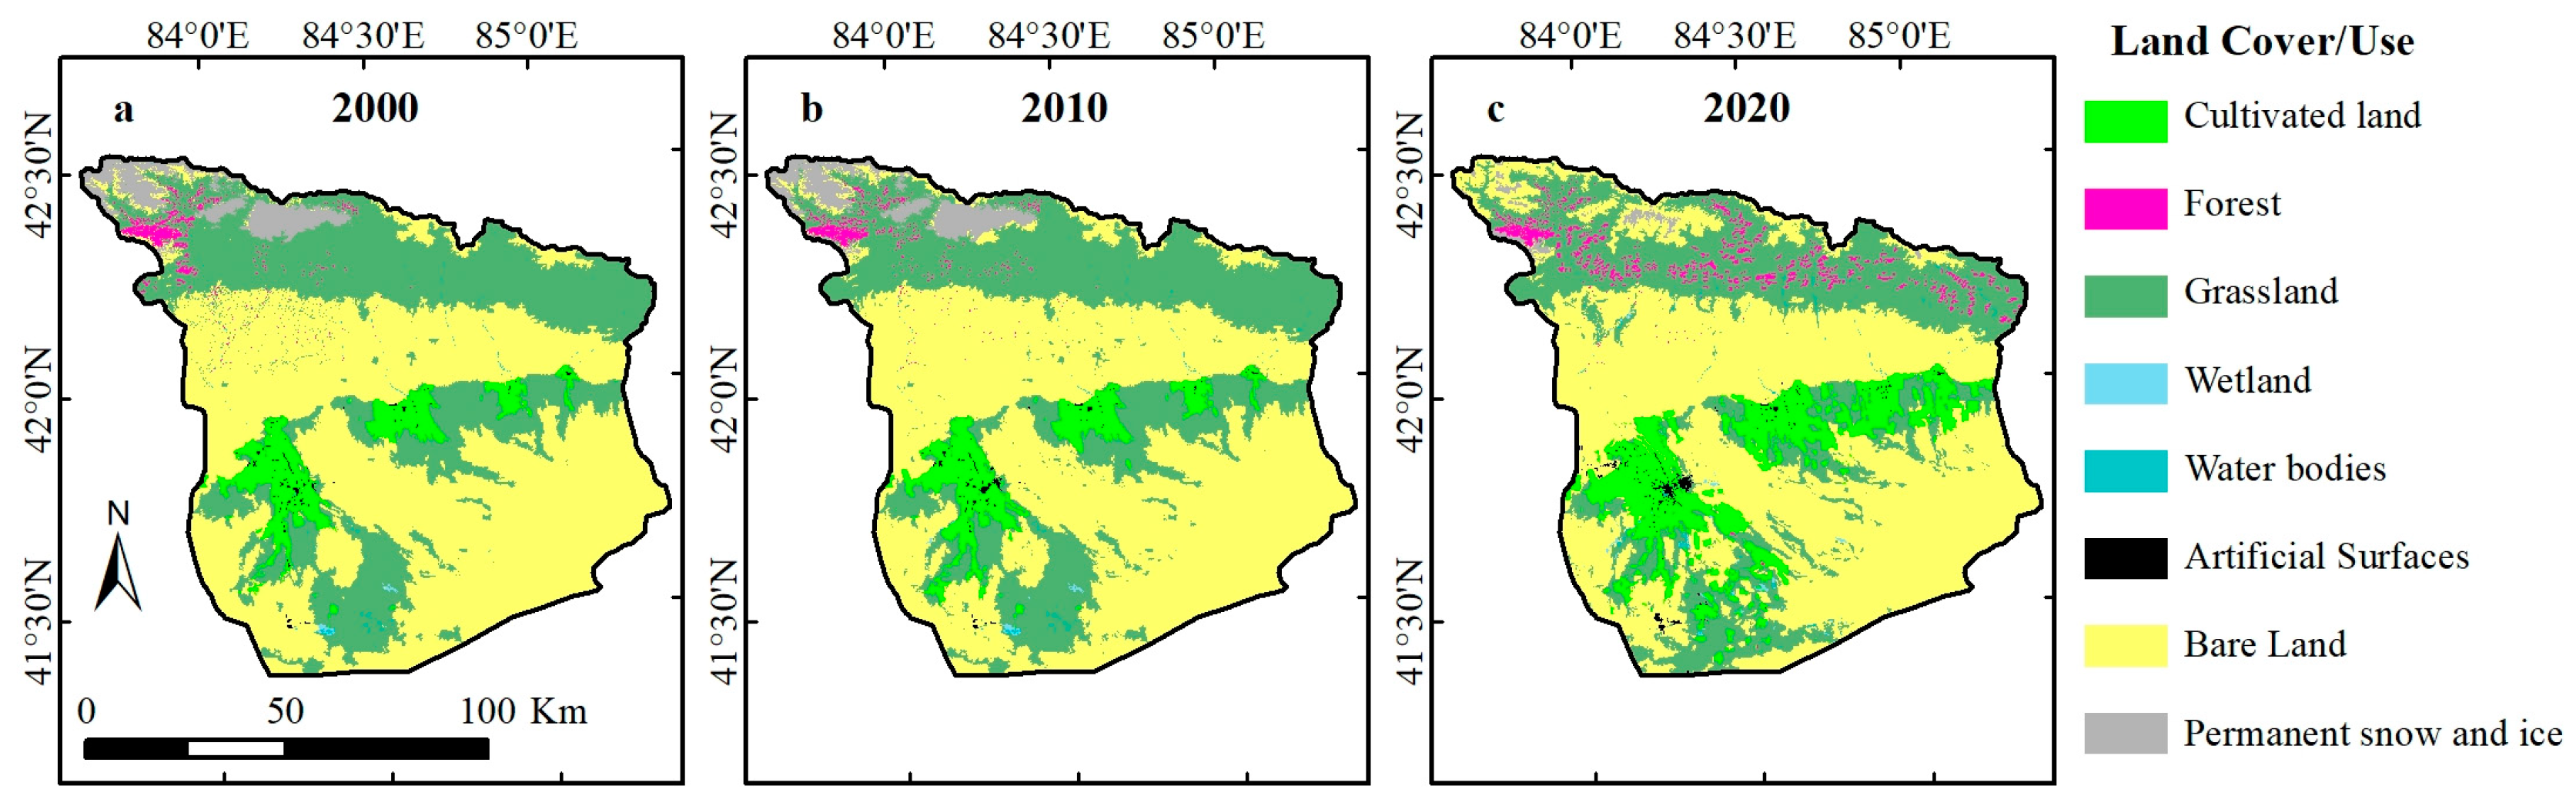
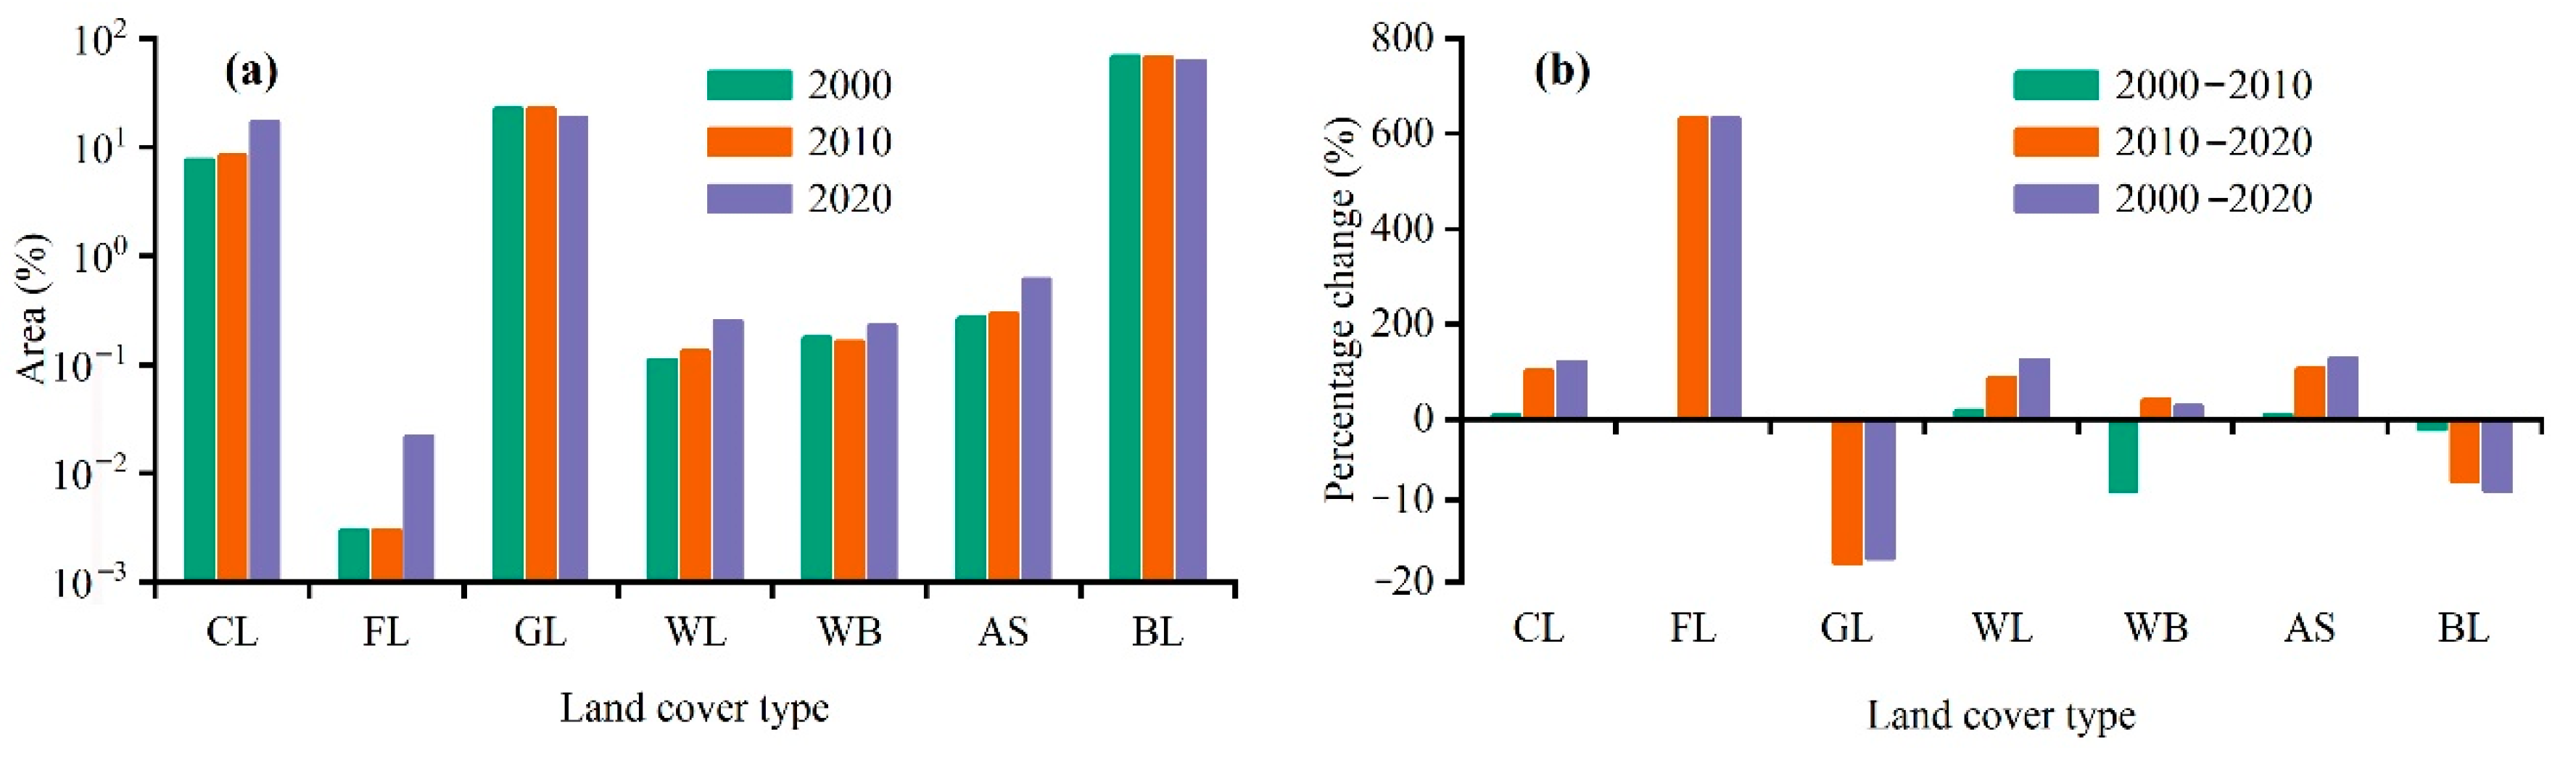
3.1. Variations of Land Use and Land Cover

Figure 3 exhibits the spatial distributions of LULC in the Dina River Basin for 2000, 2010 and 2020. Cultivated land was primarily distributed in the middle and southwest of the basin, forest mainly in the north, grassland mainly in the north, middle and southwest, and bare land mainly in the northern margin, middle, and south (Figure 3). Furthermore, the area coverage and percentage change of various land cover types from 2000 to 2020 were prepared for the middle and lower reaches of the Dina River Basin (Figure 4 and Table 1). As shown in Figure 3a, the dominant land use type was bare land, covering more than 60% of the basin area (68.94%, 68.05%, and 62.85% in 2000, 2010, and 2020, respectively). Grassland was second in dominance (22.75%, 22.91%, and 18.84% in 2000, 2010, and 2020, respectively), followed by cultivated land (7.74%, 8.44%, and 17.18% in 2000, 2010, and 2020, respectively), while forest accounted for the least coverage during 2000 to 2020 (0.02% in 2020). In general, the area of cultivated land, forest, wetland, water bodies, and artificial surfaces gradually increased from 2000 to 2020, while the area of grassland and bare land gradually decreased as time goes on (Figure 4). Cultivated land, forest, wetland, water bodies, and artificial surfaces continuously increased to 17.18%, 0.02%, 0.25%, 0.23%, and 0.62%, respectively, in 2020 (Figure 4a). Conversely, bare land and grassland continuously decreased to 62.85% and 18.84%, respectively, in 2020 (Figure 4a).
Overall, the area coverage of various land use types varied slightly within the Luntai Oasis from 2000 to 2010, while varied significantly from 2010 to 2020, especially for the cultivated land, bare land, and grassland (Figure 4 and Table 1). From 2000 to 2020, the largest area change was found in cultivated land, which persistently increased by 678.39 km2 (103.5%) between 2010 and 2020 and by 732.38 km2 (121.8%) between 2000 and 2020 (Table 1 and Figure 4b). On the other hand, bare land area underwent a marked decrease by 403.90 km2 (7.6%) between 2010 and 2020 and by 472.85 km2 (8.8%) between 2000 and 2020, and grassland area decreased noticeably between 2000 and 2020, by 303.05 km2 (17.2%). It is obvious that the increase in cultivated land area was transferred mainly from bare land and grassland within the Luntai Oasis from 2000 to 2020. Moreover, the highest percentage change was found in forest land area, increasing by 633.3% between 2000 and 2020 in the oasis, whereas its area change was relatively small (by 1.40 km2), mainly due to the increase in artificial forest area (ecological forest and economic forest). Wetland and artificial surface areas also underwent a persistent increase by 125.9% (10.99 km2) and 129.3% (27.08 km2), respectively, from 2000 to 2020 in the oasis (Figure 4b). Water bodies area decreased by 8.8% (1.26 km2) between 2000 and 2010, while undergoing a general increase by 41.2% (5.31 km2) between 2010 to 2020.

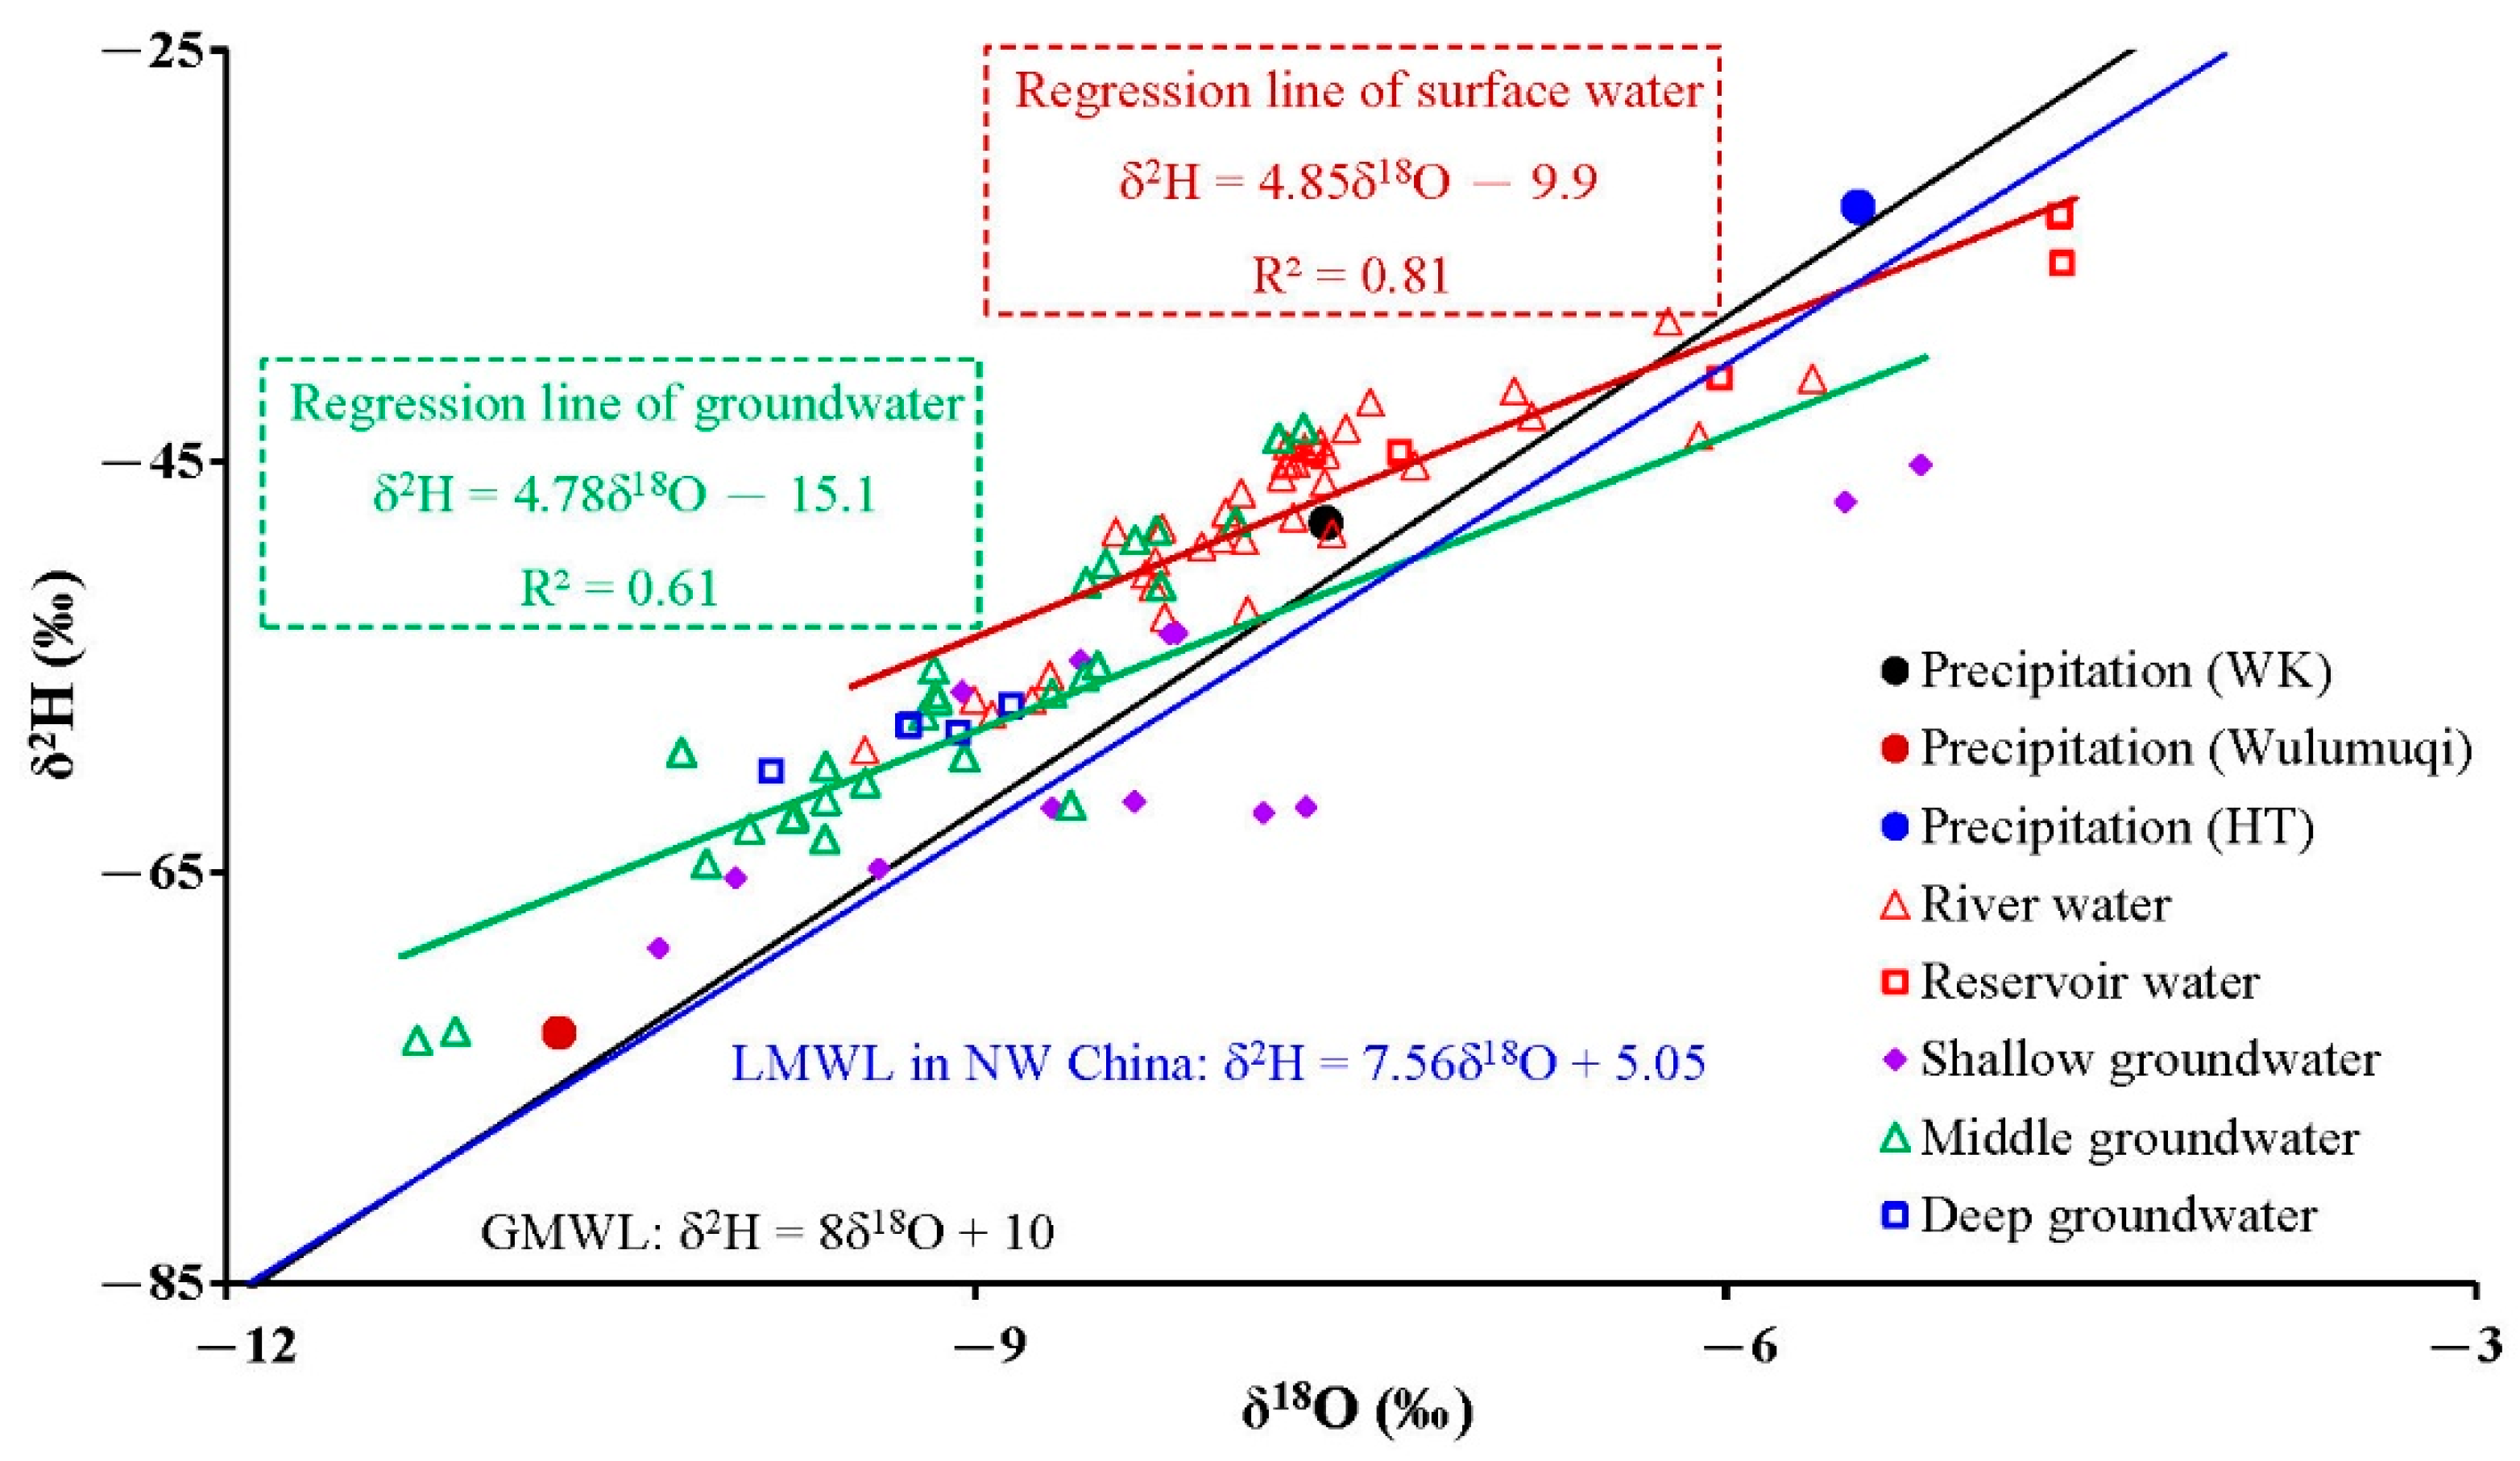
3.2. Stable Water Isotopic Composition
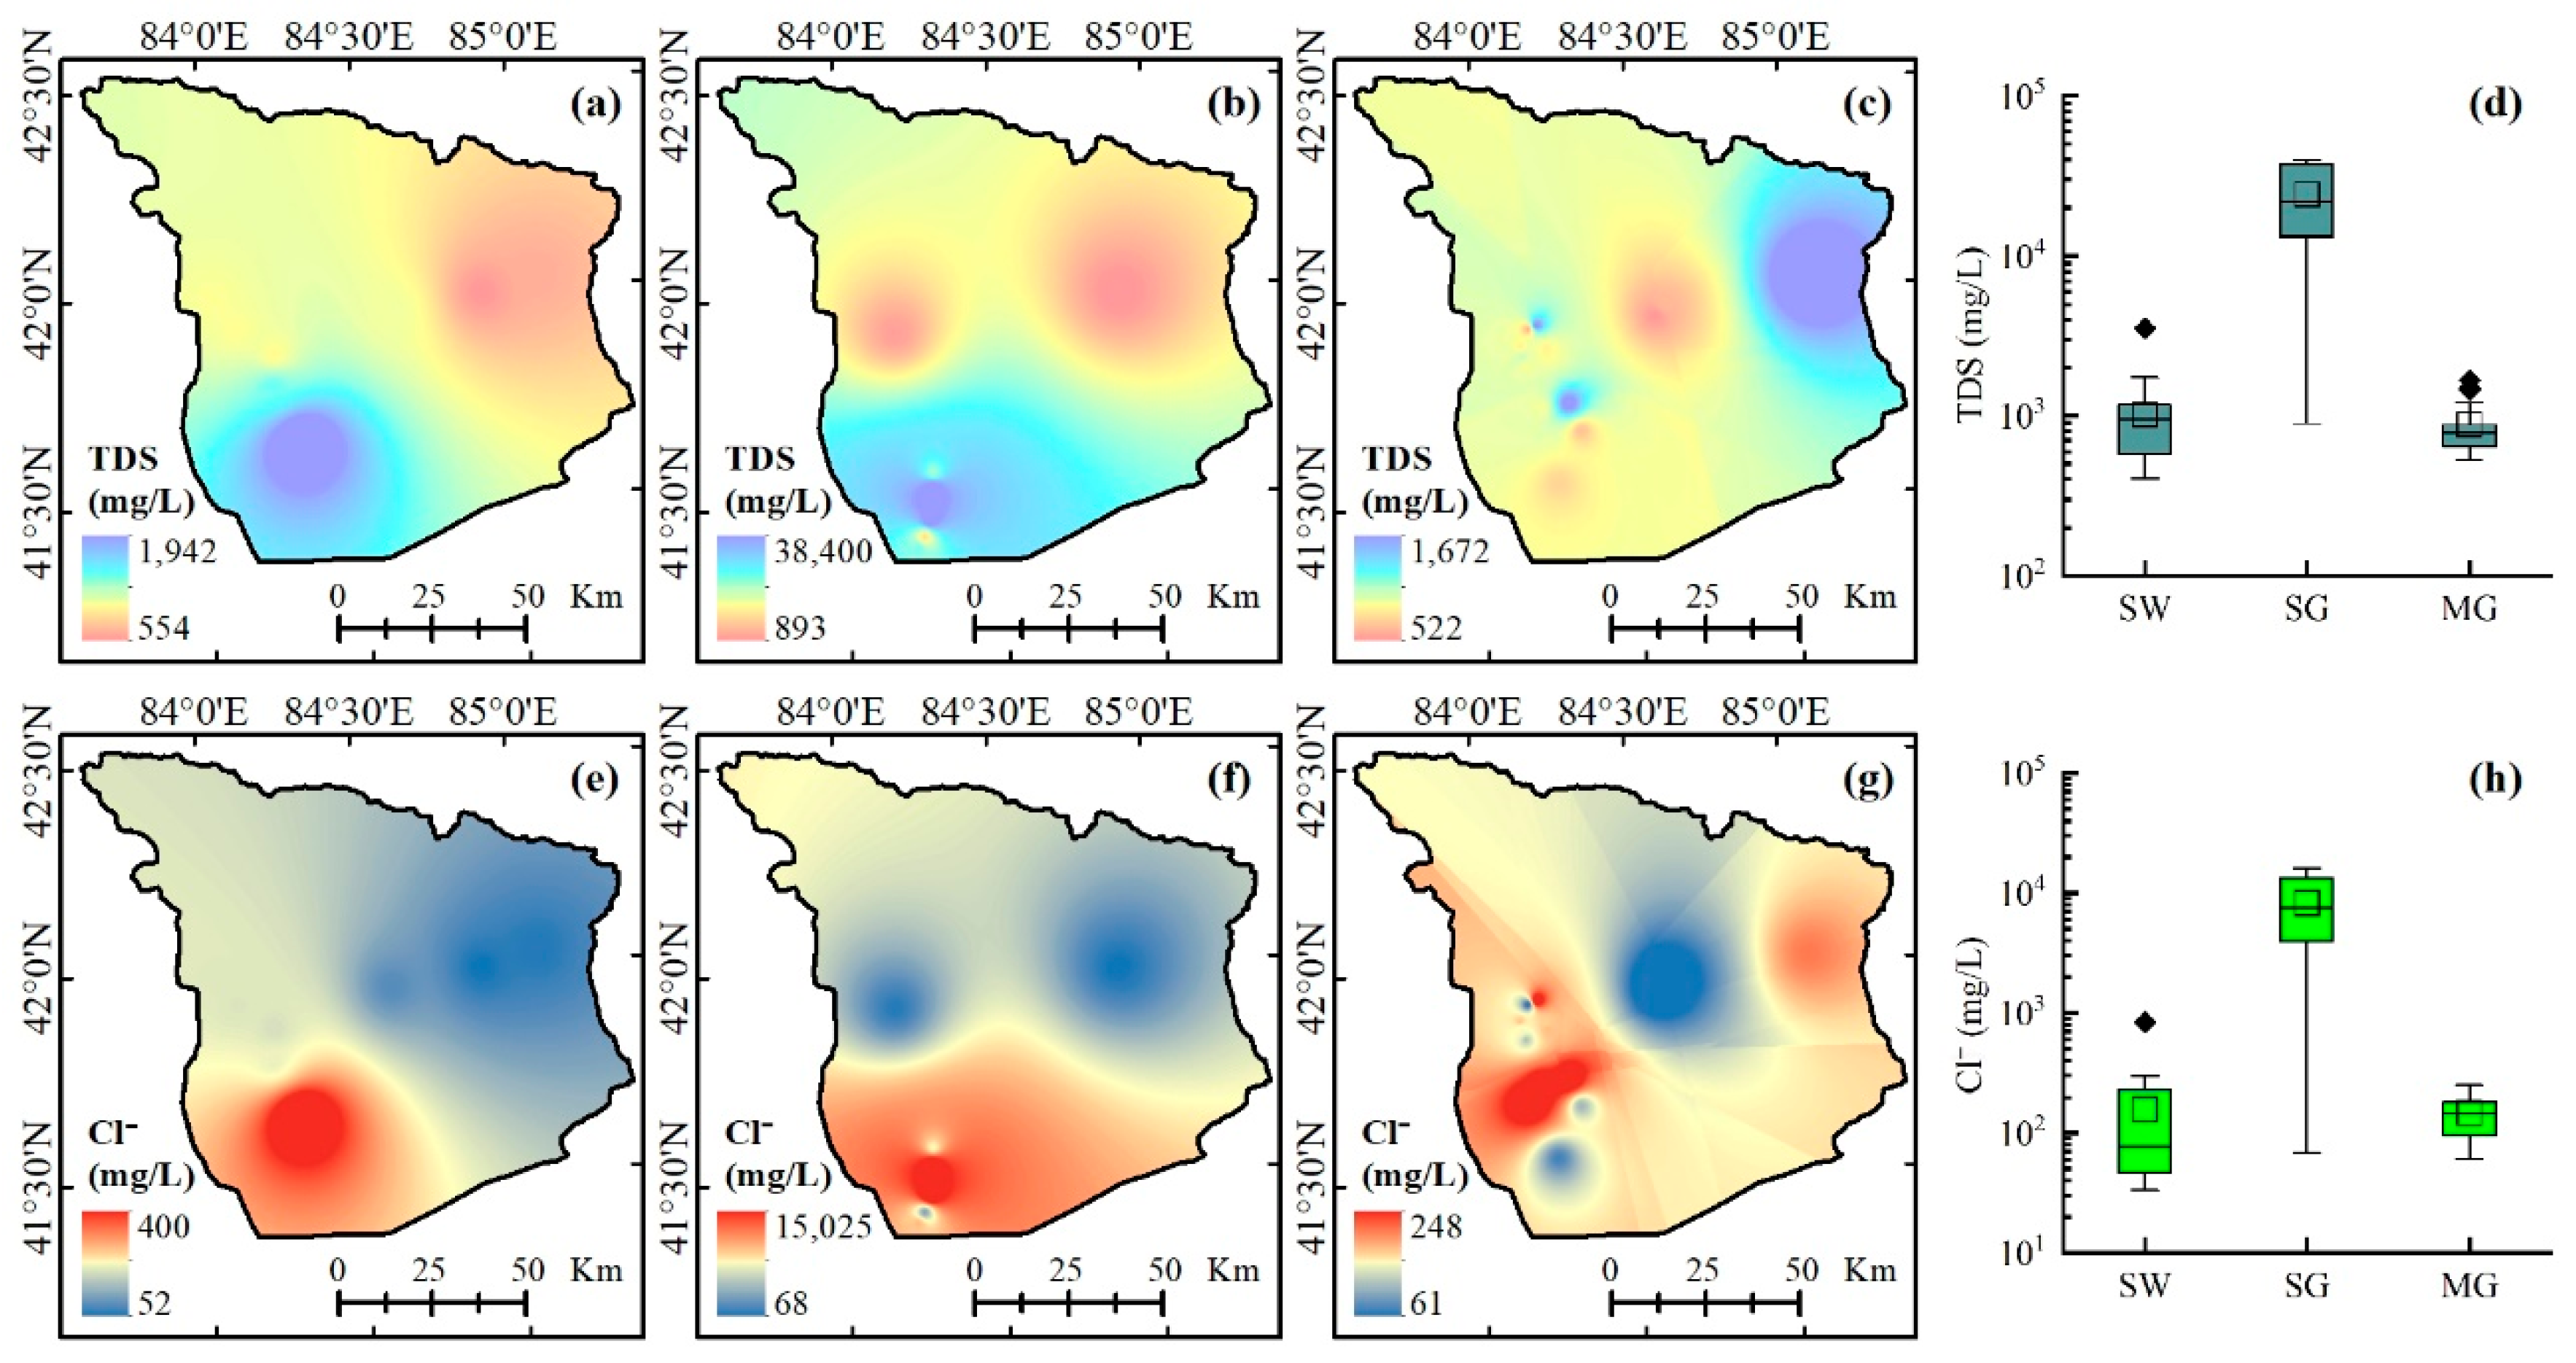
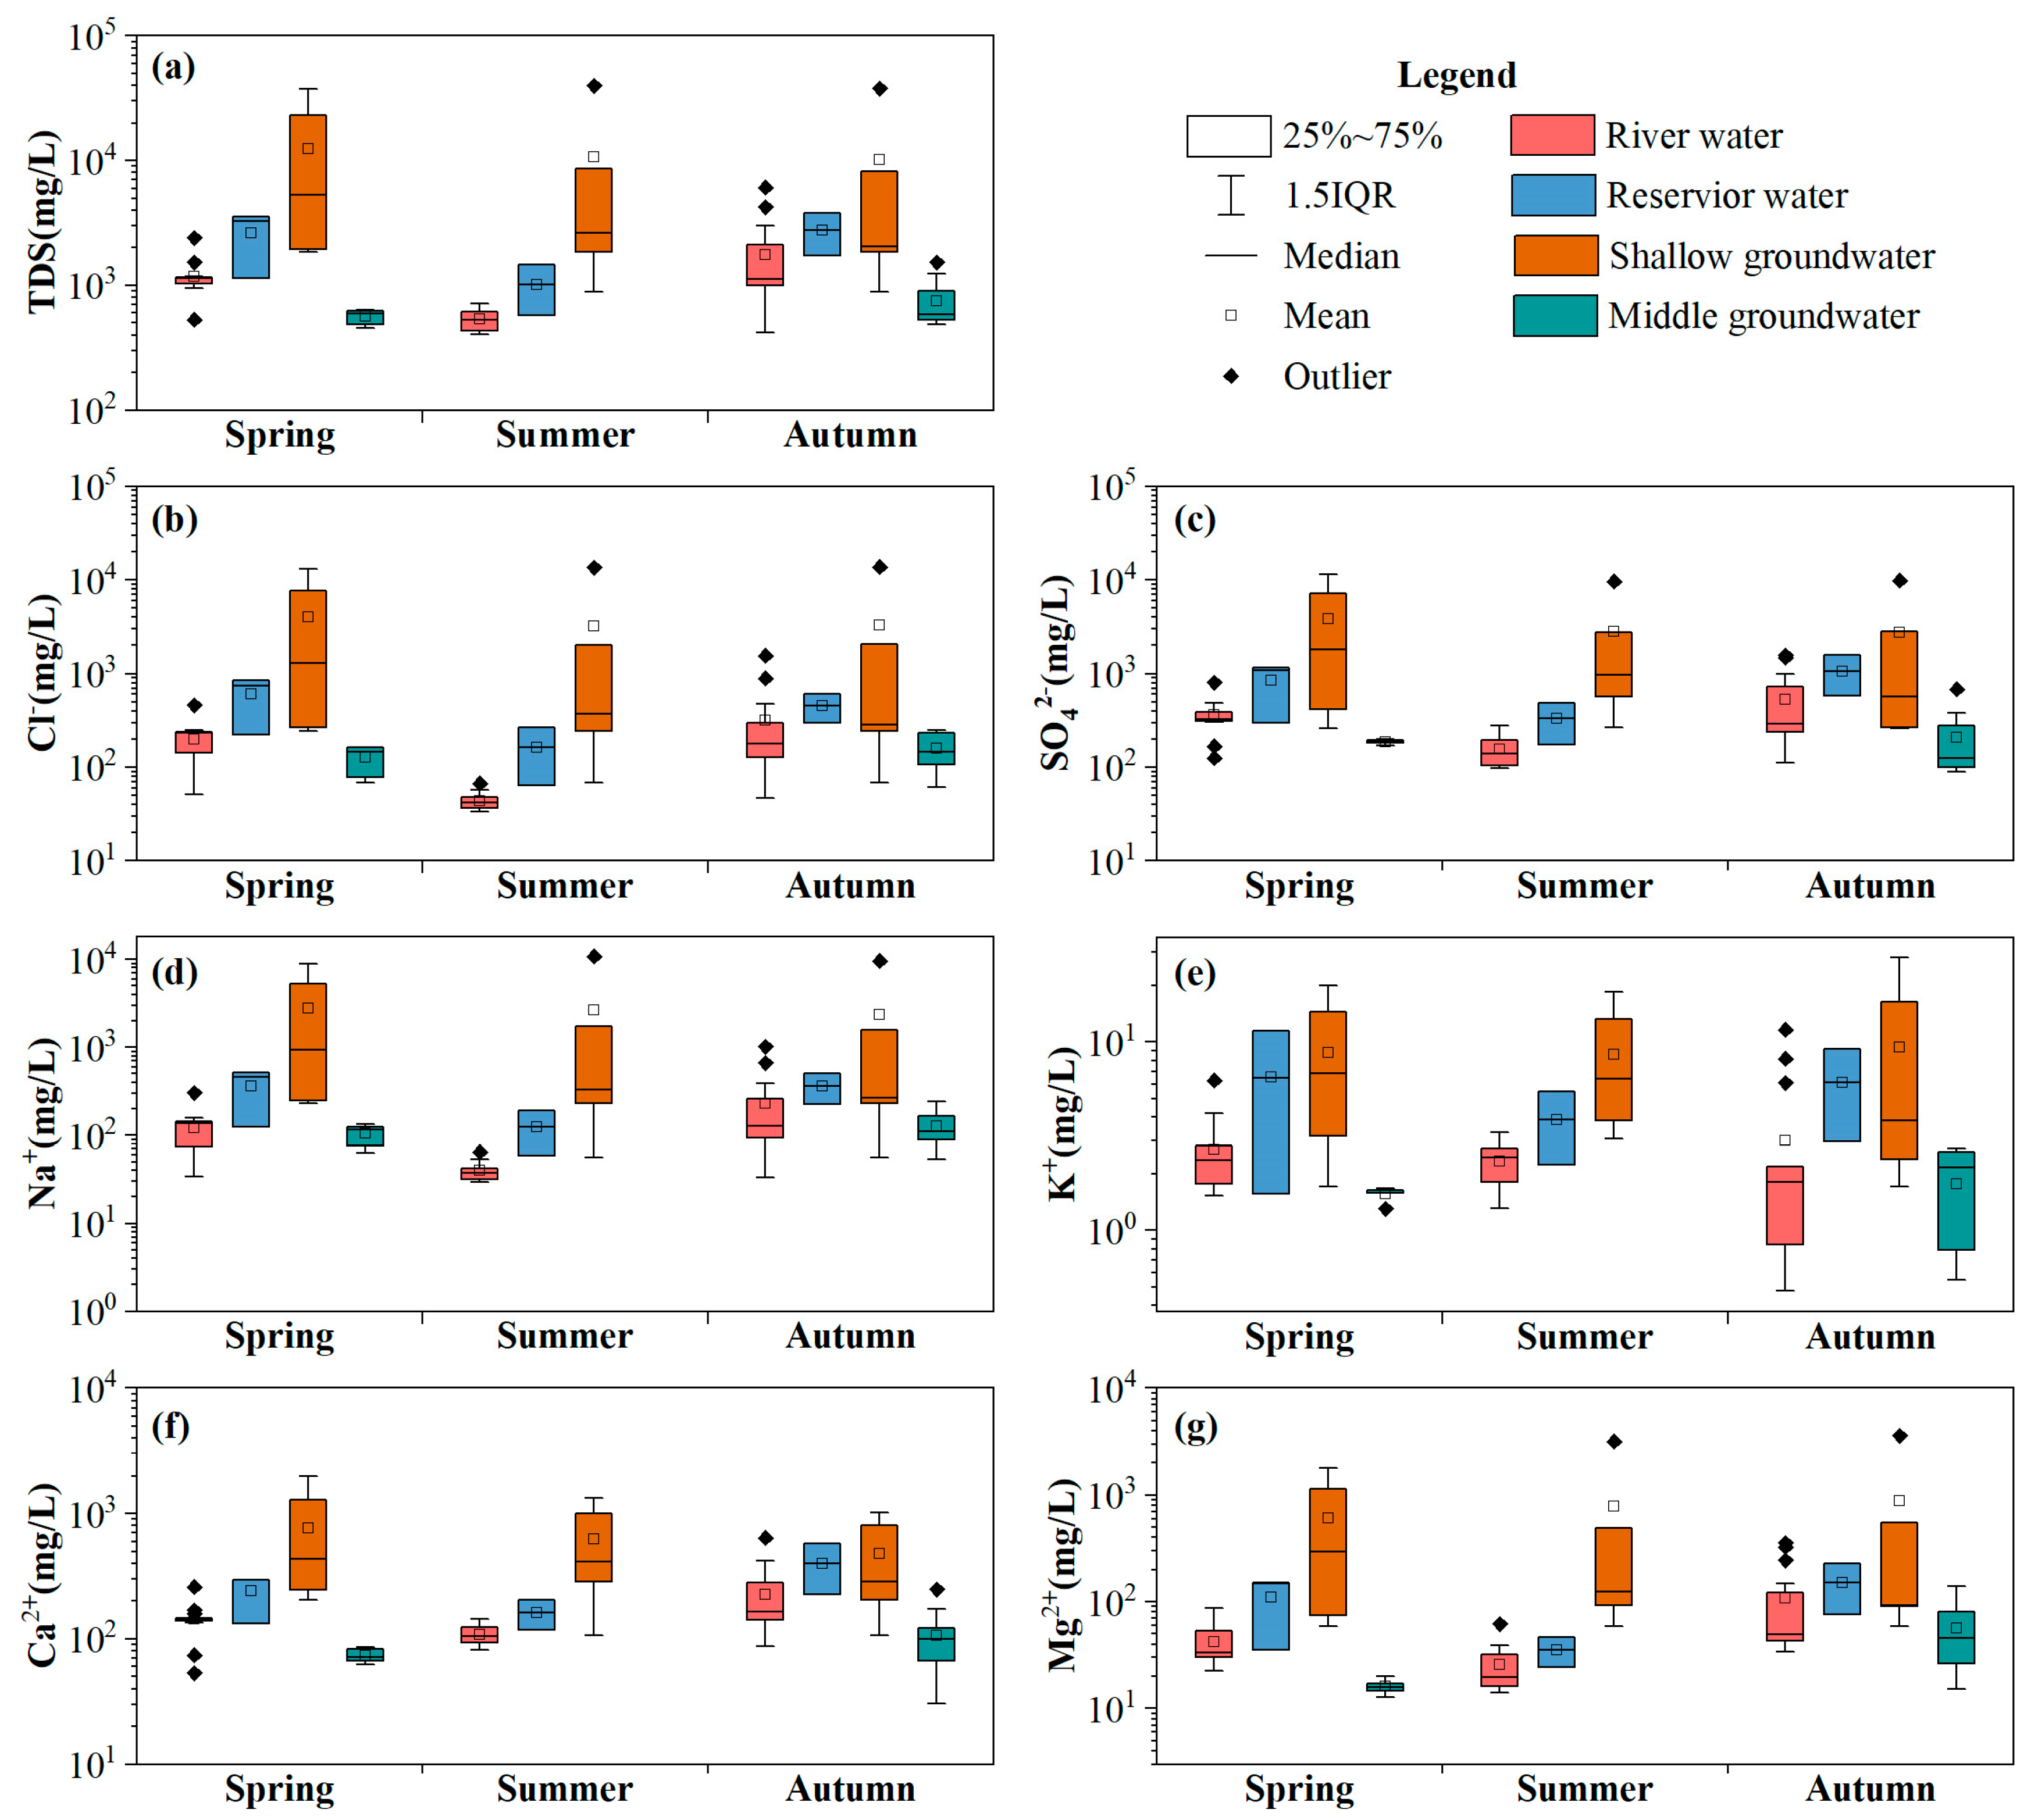
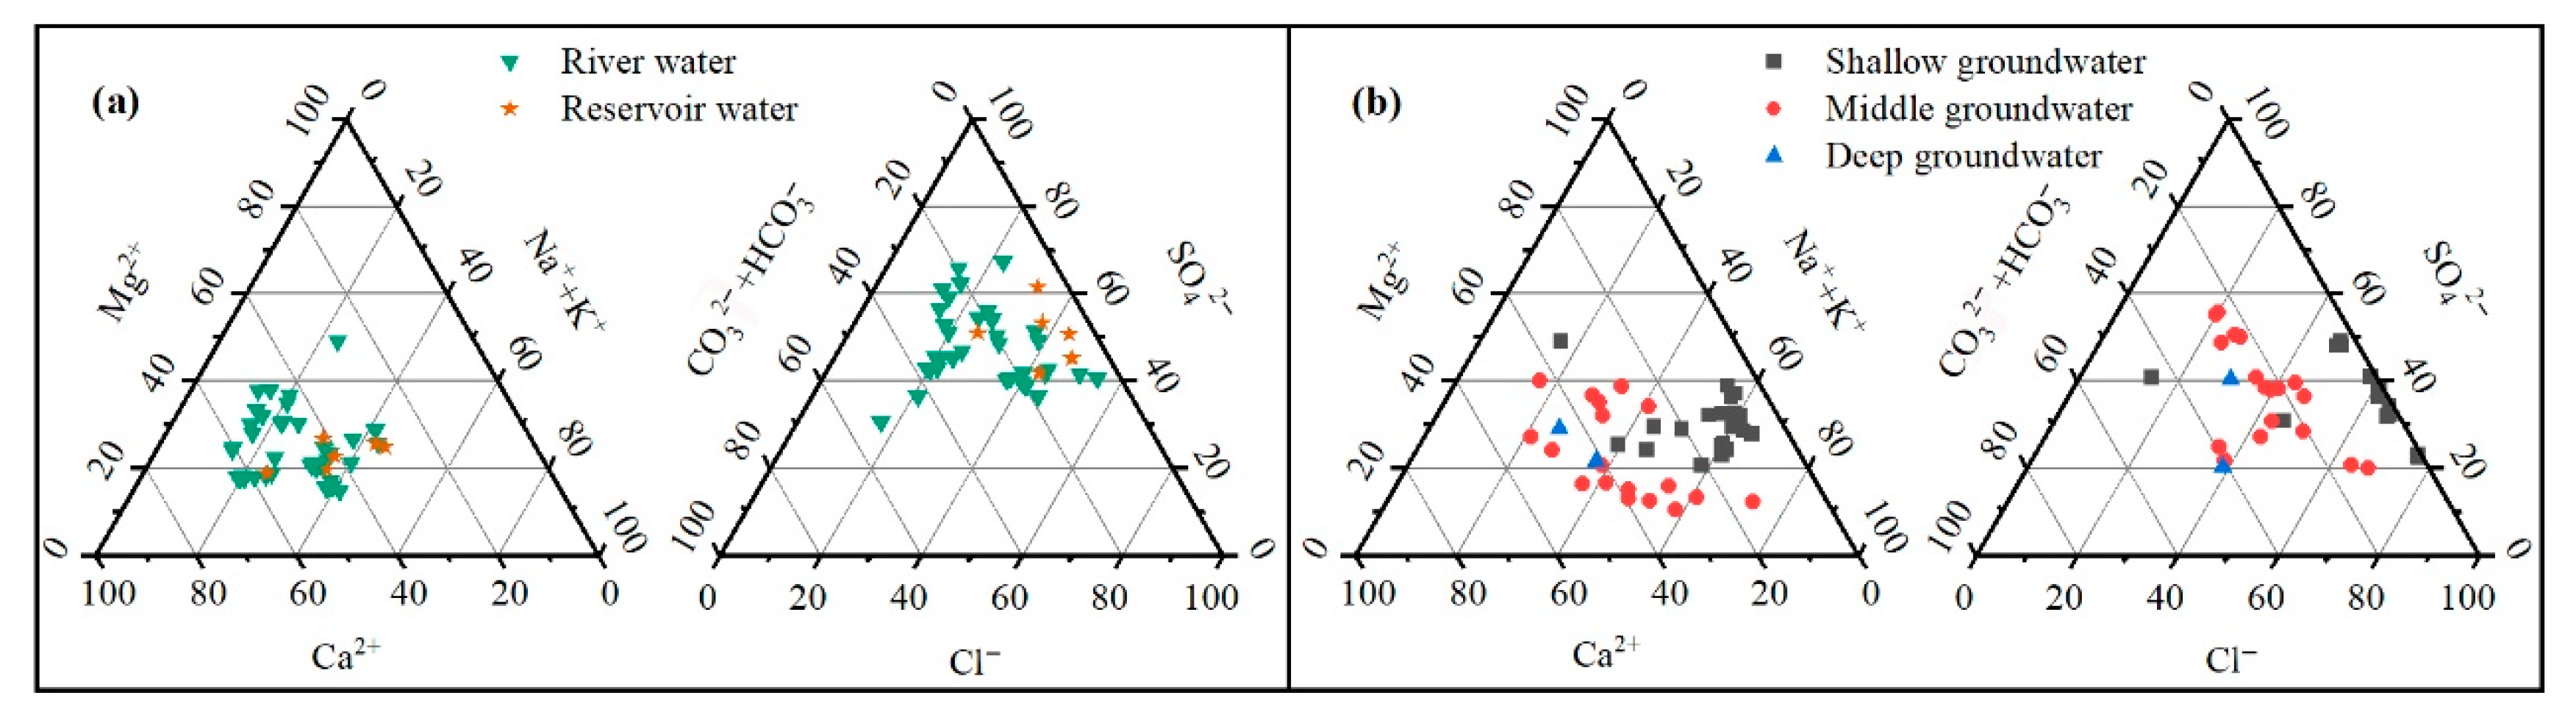
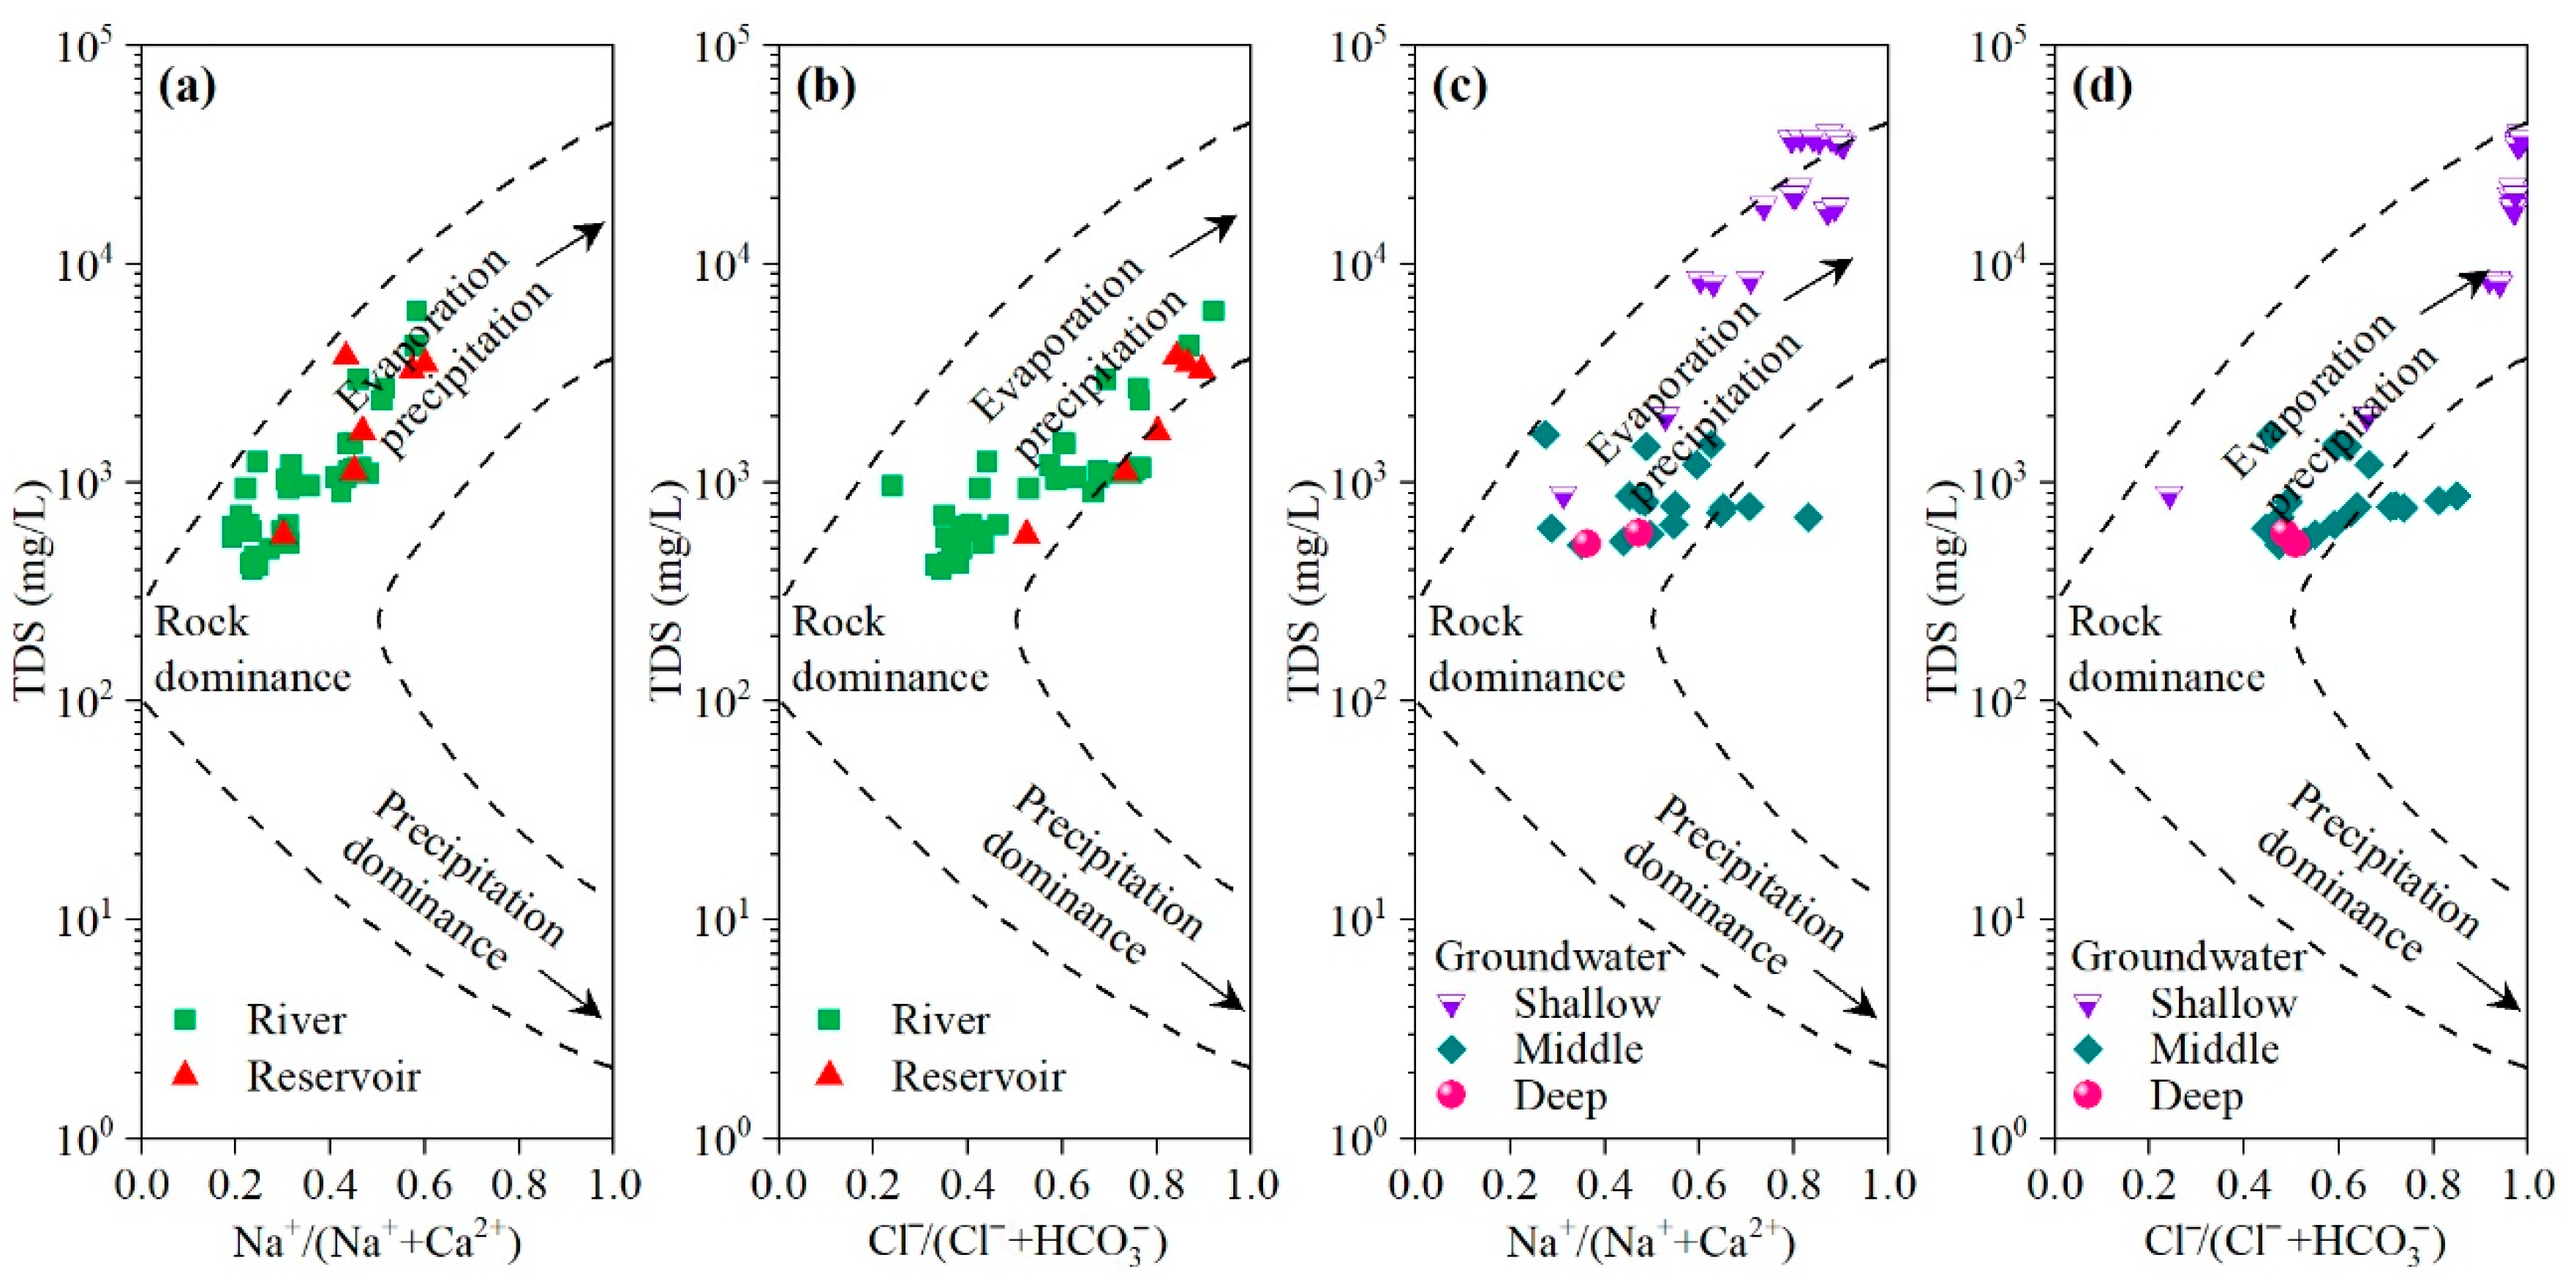
Figure 5 shows the relationship between δ18O and δ2H for groundwater and surface water. Stable isotopes of all water samples were characterized by a large range from −11.2‰ to −4.7‰ for δ18O and −73.2‰ to −33.1‰ for δ2H in our study region. Generally, δ2H and δ18O values differed noticeably among various water components and became more enriched successively from deep groundwater to shallow groundwater, river water, and reservoir water (Figure 5). Most surface water and groundwater samples were located above the global meteoric water line (GMWL: δ 2 H = 8 δ 18 O + 10 ) [36] and local meteoric water line in northwest China (LMWL: δ 2 H = 7.56 δ 18 O + 5.05 ) [37]. The isotopic data defined a line with the regression equation of δ 2 H = 4.85 δ 18 O 9.9 (R2 = 0.81, n = 41) from the surface water, and δ 2 H = 4.78 δ 18 O 15.1 (R2 = 0.61, n = 47) from the groundwater. The mean isotopic values of river water (δ18O = −7.8‰) were close to the values of precipitation for the Weigan-Kuqa river basin [16] but differed significantly from precipitation isotopes for the Hetian station (δ18O = −5.5‰) and Wulumuqi station (δ18O = −10.7‰) in Xingjiang province (data from the Global Network of Isotopes in Precipitation). This indicated that river discharge was dominated by precipitation during the wet season [38]. Stable isotopes of reservoir water (mean δ18O = −6.1‰) were higher than those of river water, due to strong evaporation in arid areas [33]. Furthermore, the mean isotopes of shallow groundwater (δ18O = −8.2‰) were lower than the values of river water but higher than those for the middle groundwater (mean δ18O = −9.1‰) and deep groundwater (mean δ18O = −9.3‰) in the study area. Obviously, the isotope values of shallow groundwater were closer to those of river water, indicating that phreatic aquifer was primarily supplied by river and channel seepage as well as the infiltration of irrigation return flow [17].
The spatial distribution of δ18O for groundwater and surface water in the oasis-desert region of Dina River Basin during the sampling period were shown in Figure 6. Isotopic signatures of streamflow and baseflow varied in time and space (Figure 6). Overall, the δ18O value of groundwater exhibited significant spatial heterogeneity, while the spatial difference of δ18O for surface water was relatively small. The δ18O of surface water varied from −9.5‰ to −4.6‰, and groundwater δ18O value varied from −11.2‰ to −5.2‰. The surface water δ18O value was lower in the upstream than in the midstream or downstream (Figure 6a). The isotopic composition of shallow groundwater also varied in space (Figure 6b). The desert area had a consistently higher δ18O value compared to the oasis area, which may be attributed to the higher air temperature and stronger evaporation in the desert region (Figure 6c).

3.3. Dissolved Ions

Table 2 exhibits the dissolved ion characteristics of water samples in the study area. Overall, the salinity of deep groundwater was the lowest, followed by river water and reservoir water, and the salinity of shallow groundwater was the highest (Table 2), which may be mainly attributed to the intense evaporation process and mineral dissolution process in arid inland areas [13]. River water had relatively low ion concentrations and salinity and was slightly alkaline (mean pH = 7.9), with SO4-Ca chemistry (Table 2 and Figure 7a). The TDS content of river water ranged from 404.3 to 3527.4 mg/L, the Cl concentration ranged from 33.1 to 244.4 mg/L, and the Ca2+ ranged from 74.5 to 237.7 mg/L. Moreover, reservoir water samples in this study region had higher salinity and ion concentrations (Cl range of 64.2 to 840.1 mg/L, and Ca2+ range of 118.2 to 574.2 mg/L) compared to river water, with SO4-Ca-Na chemistry, implying that reservoir water was from river water but experienced intense evaporation in such arid climate [16].
Furthermore, the dissolved ion concentrations of middle groundwater were intermediate between the ion concentrations of deep groundwater and shallow groundwater (Table 2 and Figure 7b), which provided further evidence for the interaction among various aquifers in the oasis-desert region of the Dina River Basin. The ion values of groundwater were characterized by a wide range, and the TDS varied from 522.5 to 39,770.0 mg/L, ranging from fresh to saline, which indicated a great variation in the groundwater environment and quality. The pH of groundwater ranged from 7.5 to 8.1, suggesting a slightly alkaline water. Generally, lowly saline groundwater was observed in the deep aquifer, while highly saline groundwater was found in the shallow aquifer (Table 2), which mainly resulted from the slow groundwater flow and extremely arid climate in the oasis-desert region [21]. Deep groundwater samples had low ion concentrations and salinity (mean TDS = 561.4 mg/L, and mean Cl = 95.6 mg/L), and were freshwater, with a hydrochemical type of HCO3-Cl-Ca-Na. Shallow groundwater samples had high ion concentration and salinity (mean Cl = 3473.8 mg/L, and mean TDS = 24,234.6 mg/L), with Cl-SO4-Na-Mg chemistry. Furthermore, middle groundwater was dominated by SO4 and Cl anions and Na and Ca cations (Figure 7b), with a mean TDS of 879.9 mg/L, indicating the direct recharge from the underlying deep aquifer and overlying shallow aquifer [28].
As shown in Figure 8, ion values of surface water and groundwater exhibited significant spatial heterogeneity in the study area, which may be attributed to different climatic conditions, lithology, land cover types, and anthropogenic activities. In generally, the salinity of shallow groundwater and surface water increased along the flow paths from upstream to downstream, indicating the occurrence of evaporation and mineral dissolution [33]. The TDS content of surface water ranged from 404.3 to 3527.4 mg/L. The high values of TDS and Cl- in surface water were distributed in the southwestern part, while the low values were observed in the northeastern part. Moreover, the spatial distribution patterns of Cl and TDS contents in shallow groundwater were consistent in the study region and were higher in the desert area than in the oasis area, which can be explained by evaporation intensity, groundwater level depth, rock, and agricultural activities in the oasis-desert area (Figure 1 and Figure 3) [22]. Furthermore, the spatial variation trends of TDS and Cl in middle groundwater were not obvious (Figure 8c,g), which may be attributed to the spatial heterogeneity of groundwater exploitation and lithologic in the oasis-desert area. The TDS content of middle groundwater varied from 522.5 to 1672.6 mg/L and was much higher in the eastern and several sporadic areas of southwestern compared to other areas.
Figure 9 shows the seasonal variations of dissolved ion concentrations in surface water and groundwater in the Luntai Oasis. Hydrochemical components of groundwater and surface water exhibited significant seasonal variation and fluctuated during the sampling period (Figure 9), probably due to the seasonal difference of water sources and evaporation intensity between water components. In general, the seasonal difference of TDS, Cl, SO42−, Mg2+, and Na+ concentration in water samples was significant, mainly due to the coupled effects of water recharge sources, evaporation, water–mineral interactions, and agricultural activities (e.g., irrigation, agricultural drainage, and fertilizers) [16]. Moreover, the seasonal variation of dissolved ions concentrations differed among various water components. Seasonal variation of ion concentrations in shallow groundwater was the largest, followed by reservoir water and river water, and was the smallest in middle groundwater (Figure 9). Except for K+, the seasonal variation pattern of hydrochemical components concentrations (TDS, Cl, SO42−, Na+, Mg2+, Ca2+) for water samples in the Luntai Oasis was consistent. The highest values of TDS, Cl, SO42−, Na+, Mg2+, and Ca2+ in river water and reservoir water were found in autumn, whereas the lowest values were observed in summer. Meanwhile, the highest value of TDS, Cl, SO42−, Na+, and Ca2+ in shallow groundwater was found in spring (TDS = 12,498.7 mg/L, Cl = 3996.8 mg/L, SO42− = 3815.7 mg/L, Na+ = 2763.1 mg/L, Ca2+ = 767.5 mg/L), whereas the lowest value was observed in autumn (TDS = 10,203.0 mg/L, Cl = 3277.9 mg/L, SO42− = 2762.5 mg/L, Na+ = 2337.6 mg/L, Ca2+ = 483.6 mg/L). Nonetheless, the lowest and highest values of reservoir water K+ were observed in summer (3.9 mg/L) and spring (6.5 mg/L), respectively, while the lowest and highest values of shallow groundwater K+ were observed in summer (8.6 mg/L) and autumn (9.4 mg/L), respectively (Figure 9e). The lowest and highest values of shallow groundwater Mg2+ were observed in spring (607.4 mg/L) and autumn (883.5 mg/L), respectively.

4. Discussion

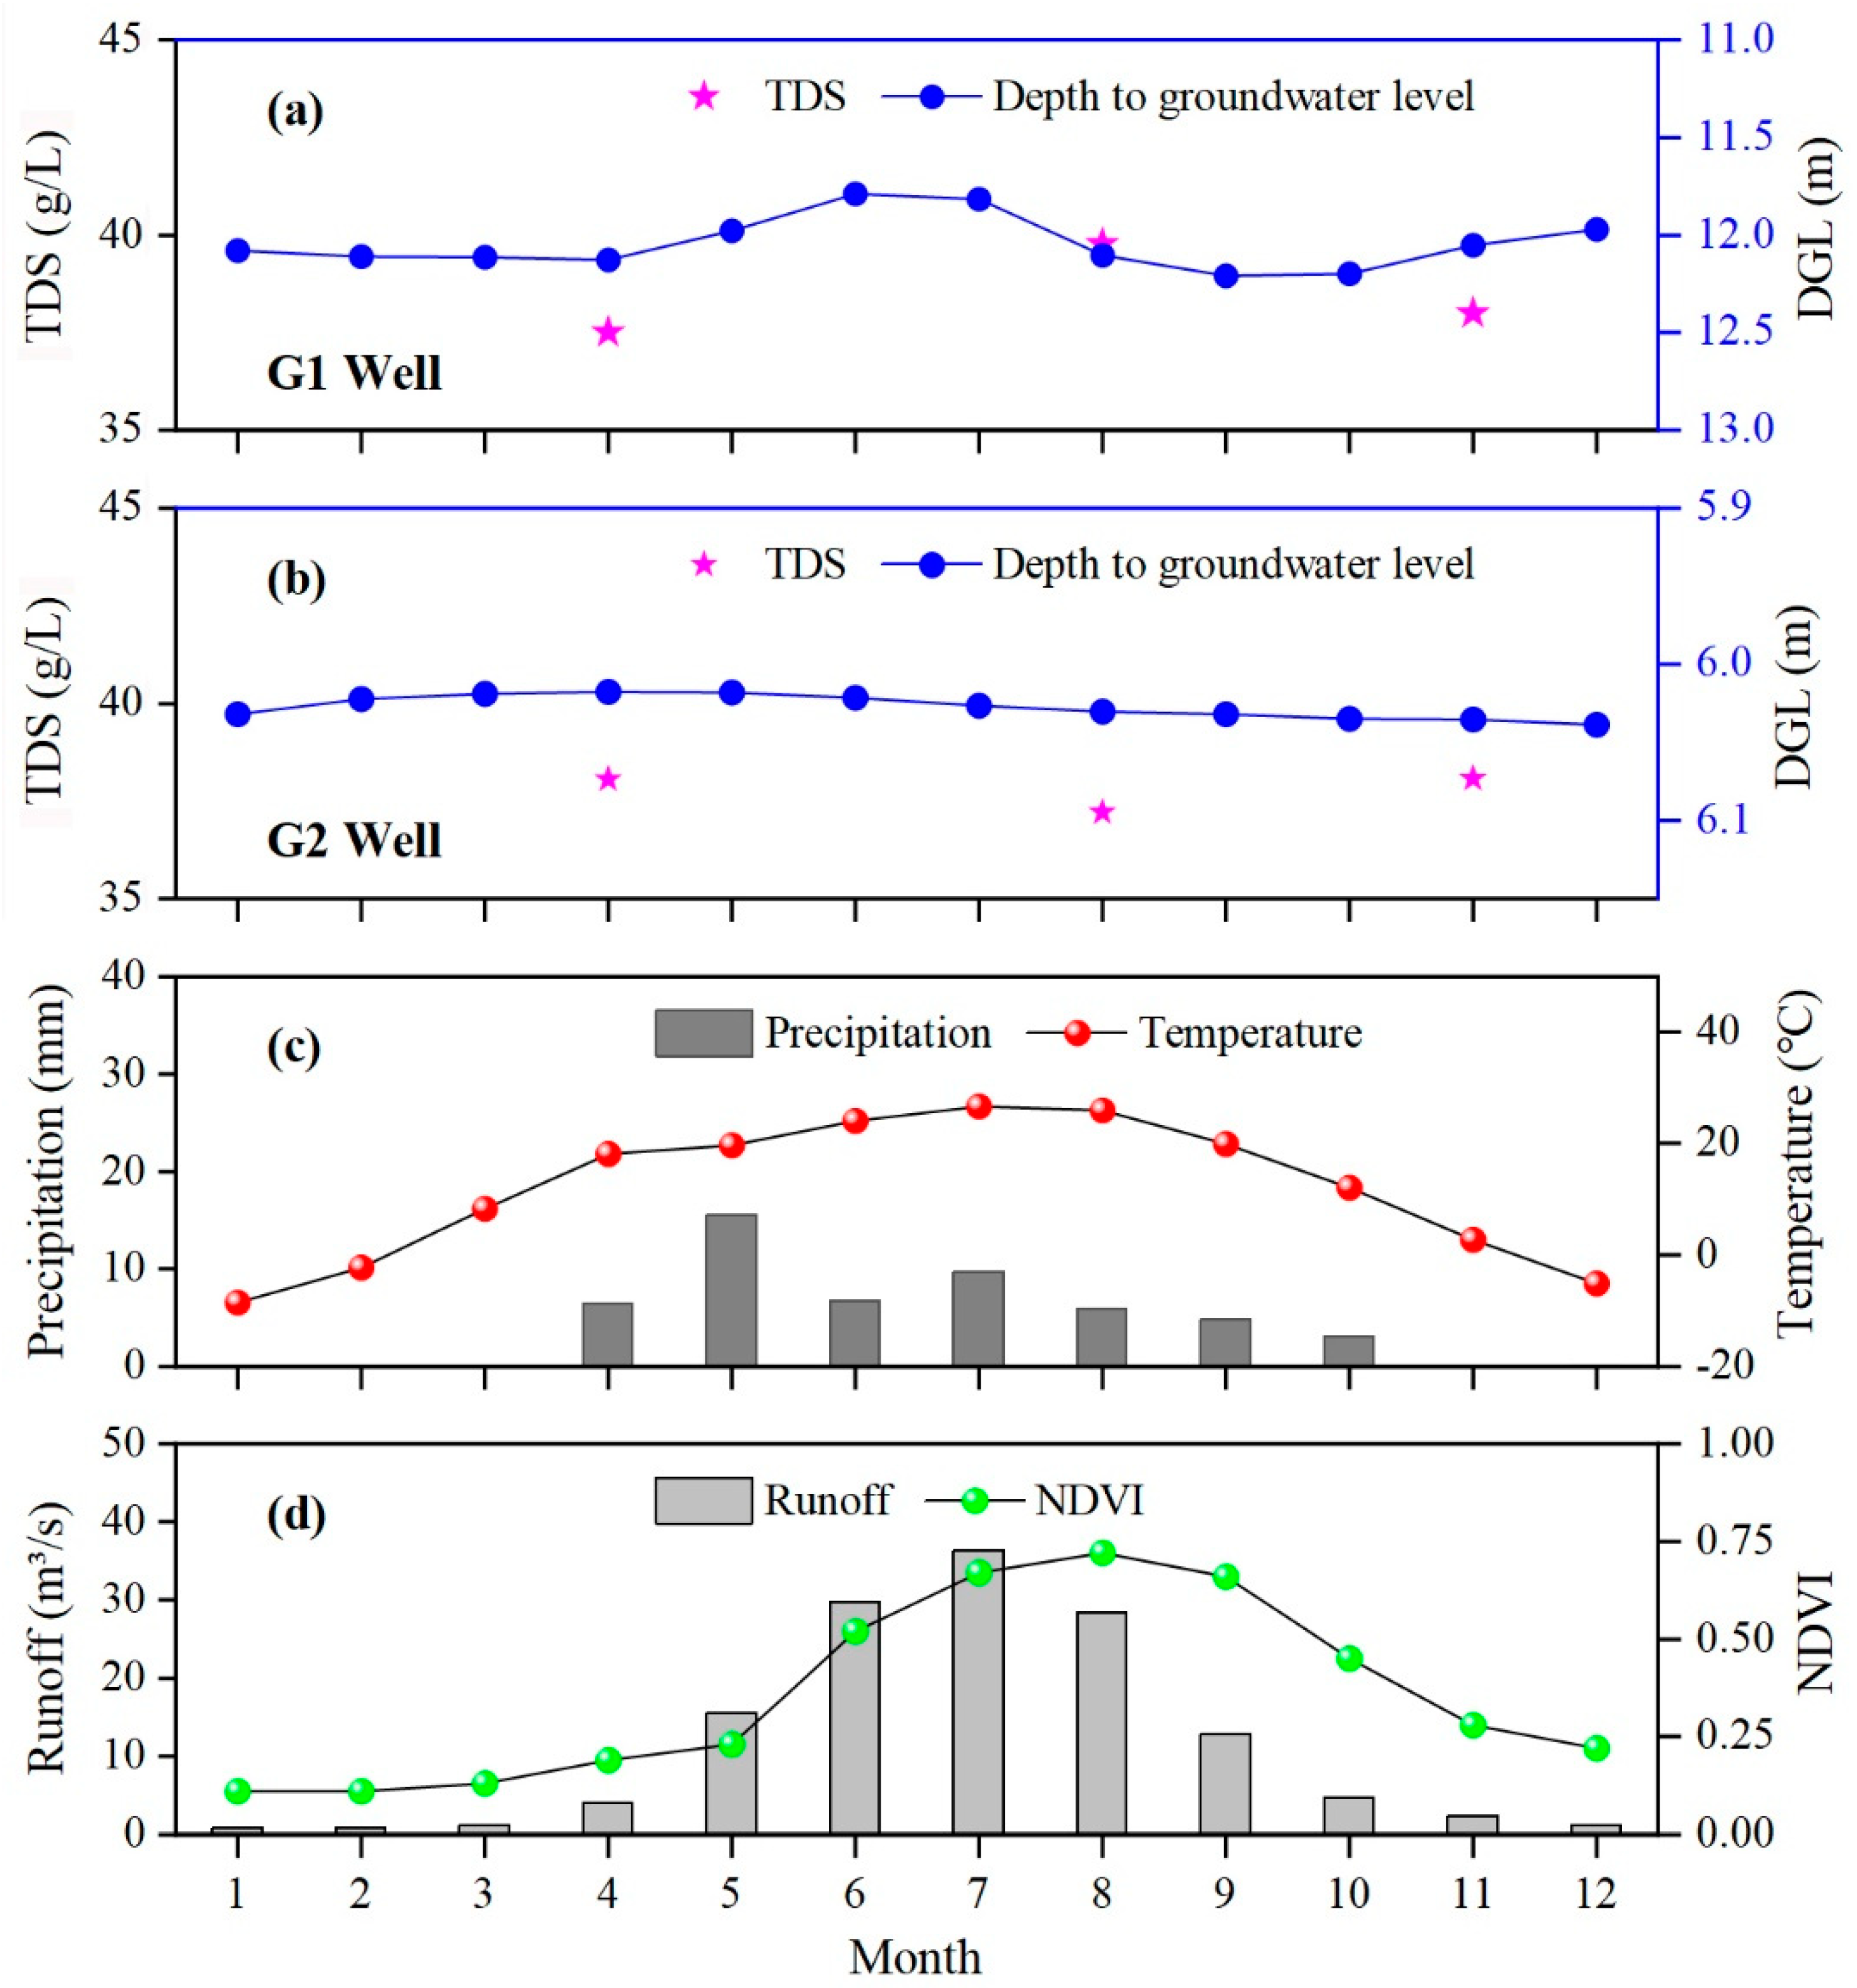
4.1. SPATIO-Temporal Variations of Groundwater Hydrochemistry

In the Luntai Oasis, the ion concentrations of surface water (river water and reservoir water) were much lower than those in shallow groundwater but higher than those in deep groundwater (Table 2). Evaporites and saline soils are widespread in this region due to strong evaporation [14]. Surface water infiltration promotes the processes of soluble mineral erosion, dissolution, and leaching within the soil profile, causing great salt migrations downward and accumulation into a shallow aquifer, thus resulting in much higher ion concentrations in the shallow groundwater [25]. On the other hand, the discharge of solid and liquid waste from human activities (settlements, farmland, and factories) has a significant contribution to the hydrochemical components of groundwater in the study area, especially agricultural activities [22]. Furthermore, the mean dissolved ion contents (Mg2+, Na+, K+, Cl, and SO42−) of river water in the study area were lower than the Tarim River, but much higher than the global average, Shule River, Heihe River, and Shiyang River in arid regions [39,40,41,42]. This may be attributed to different recharge sources and evaporation intensity of various rivers in arid regions, which also reflected the stronger evaporation and less precipitation in the Tarim Basin [22,33].
The stable isotopic and hydrochemical components of surface water and groundwater exhibited significant spatial heterogeneity in the oasis-desert region (Figure 6 and Figure 8), which may be attributed to the coupled effects of evaporation, soluble mineral dissolution, land cover types, and agricultural activities (Figure 1 and Figure 3) [19]. The salinity of river water and shallow groundwater in the Luntai Oasis increased along the flow paths from north to south, that is, the salinity of water in the desert region was much higher than that in the oasis region (Figure 8). The soluble salts in river water increase with the increase in flow, and the chemical composition and content of ions change gradually, causing an obvious increase in river water salinity [21]. The lower content of shallow groundwater salinity in the Luntai Oasis was observed in the oasis region with a large area of cultivated land (Figure 3) and was mainly affected by agricultural irrigation and drainage [43,44], probably due to the dilution by infiltrating irrigation water (mainly from river water with lower salinity) and the salt discharge by drainage canals [16]. The higher content of shallow groundwater salinity was found in the desert region with little river water recharge due to the dried-up river (Figure 1c), and was the outcome of strong evaporation, mineral dissolution, and agricultural drainage water recharge (much higher salinity) from the middle reaches [33]. Moreover, the spatial difference of stable isotopes and hydrochemical components in river water was relatively small within the oasis, which may be related to the relatively shorter evaporation time and less soluble mineral dissolution, because more than 90% of river water was diverted directly to the cropland for irrigation through artificial channels [5]. In addition, groundwater salinity significantly decreased with depth, the TDS content of middle groundwater was lower than shallow groundwater but higher than deep groundwater (Table 2). Evaporation and agricultural activities probably dominate the vertical distribution of shallow groundwater ions, while middle groundwater TDS is strongly influenced by groundwater overexploitation [28]. Wang et al. reported that groundwater level depth and evaporation were the key factors influencing the spatial distributions of shallow groundwater salinity [19].
Dissolved ions concentrations of groundwater and surface water varied significantly among seasons in the oasis-desert region (Figure 9), which reflected the seasonal variations of water sources, hydrogeochemical processes, and human activities effects [21,43]. The lower content of river water salinity was found in summer, but higher in autumn (Figure 9), which contradicted the seasonal variations of precipitation, air temperature, and runoff. During the flood season, runoff is emanated from the coupled effects of heavy rainfall and intense glacier/snow melting and is responsible for the lower salinity in river water, mainly due to the dilution effect by rainfall and meltwater (lower salinity) [33]. River water is mainly from groundwater in the non-flood season and has higher salinity due to mineral dissolution. Furthermore, seasonal variation of shallow groundwater salinity was the largest in the Luntai Oasis, the higher value was observed in spring but lower in autumn, probably due to the recharge from surface water in the flood season and from the lateral groundwater flow in the non-flood season [37]. Meanwhile, agricultural activities would also significantly affect the shallow groundwater environment, including the dumping of post-harvest residues, chemical fertilizers, and pesticides (flood irrigation in winter and spring) [16]. Additionally, the seasonal difference of middle groundwater salinity was not obvious, indicating the coupled effects of mineral dissolution and human activities (groundwater extraction and waste discharge) [22,45].

4.2. Impacts of Land Use Change on Groundwater Hydrochemistry

Figure 10 exhibits the weight ratios between TDS and Na+/(Na+ + Ca2+) in surface water and groundwater in the oasis-desert region, which showed the major mechanisms controlling nature water chemistry [46]. The weight ratio Na+/(Na+ + Ca2+) of surface water was less than 0.6, suggesting that surface water hydrochemistry was primarily controlled by rock dominance, while the evaporation-crystallization process also contributed to surface water chemistry in the arid region [21]. In addition, the natural mechanisms controlling groundwater chemistry were different among various aquifers across the Luntai Oasis (Figure 10). The hydrochemical composition of deep groundwater was primarily controlled by rock dominance [22]. Shallow groundwater hydrochemistry was majorly controlled by the evaporation-crystallization process, while the rock dominance mechanism also played a role in phreatic water chemistry. Moreover, the weight ratio Na+/(Na+ + Ca2+) of some middle groundwater samples was greater than 0.6, indicating that except for the rock dominance mechanism, human activities also contributed to middle groundwater chemistry in the oasis-desert region [28]. Additionally, dissolved species and their relations can unveil solute origin [47]. As shown in Figure 7, the hydrochemical composition for river water samples was mainly derived from sulfate dissolution, while the carbonate dissolution for the deep groundwater and middle groundwater samples, and the evaporite dissolution for the shallow groundwater samples in the oasis-desert region [22,27].
Land use change has significantly affected groundwater hydrochemistry in the Luntai Oasis in the past decades [5,26]. Compared with bare land, groundwater level and TDS in cultivated land exhibited greater seasonal variation (Figure 11). The cultivated land area has markedly expanded from 2000 to 2020 (increasing by 732.38 km2 (121.8%)) in the study region (Table 1 and Figure 4), and agricultural irrigation relies on stream water and pimped groundwater, thus leading to irrigation return flow as a dominant source of phreatic water [16]. That is, agricultural irrigation and groundwater extraction play an important role in the seasonal change of groundwater quantity and quality [15,27]. For the cultivated land, the vertical infiltration of irrigation water could cause the groundwater level to rise, but groundwater extraction leads to groundwater level decline in the growing season (Figure 11). Meanwhile, the vertical infiltration of agricultural irrigation water promotes the leaching and dissolution of mineral and soil salt, which could thus transfer the soluble salt downward into phreatic water, causing the higher salinity of groundwater in summer (Figure 11) [48]. Previous studies reported that evaporites and saline soil were widespread in the irrigated district of the Tarim Basin, due to the irrational irrigation, inefficient drainage, and violent surface evaporation [15,33]. Wang et al. found that groundwater salinity was significantly correlated to soil salinity in saline-alkaline land in an arid oasis [14].
Groundwater overexploitation could alter the vertical distribution of groundwater hydrochemical components within the aquifer system in an arid region [16]. The salinity of middle groundwater was lower than shallow groundwater but higher than deep groundwater (Table 2), indicating that middle groundwater was recharged and polluted by shallow groundwater [16]. This implied that phreatic water could leak downward into the confined aquifer; meanwhile, salt could also migrate into the confined aquifer along with the downward movement of groundwater from the upper aquifer, causing groundwater environment deterioration in the oasis [33]. This could be explained by groundwater overexploitation, since groundwater overexploitation from confined aquifers can alter the leaking direction between phreatic and confined aquifers, due to a decrease in the confined water level and the formation of regional groundwater drawdown funnels [28,33]. This in turn caused the mixing between higher salinity phreatic water and lower salinity confined water by a groundwater hydraulic gradient, which exacerbated the groundwater salinization process to some extent [19,21]. Compared with bare land, the depth to groundwater level in cultivated land was much larger (Figure 11), mainly due to river water deficiency and groundwater overexploitation for irrigation [28]. In the Dina River irrigation district, the amount of groundwater extraction has increased significantly in recent years (0.29 × 10⁸ m3 in 2008 and 0.85 × 10⁸ m3 in 2016) and is primarily used for agricultural irrigation (more than 80%).

4.3. Implications for Sustainable Groundwater Management

Large-scale farmland expansion and groundwater exploitation have noticeably interfered with groundwater water-salt circulation, and altered the recharge–discharge relationship between groundwater and river water in the oasis-desert region [3]. The patterns of soil moisture and salt in irrigated districts are reshaped by long-term agriculture irrigation [49]. As mentioned above, the spatiotemporal distribution of groundwater hydrochemistry in arid regions could provide an insight into the source and migration law of groundwater salt under the influence of anthropogenic activities [16]. Groundwater salt migration is impacted by several factors in the oasis-desert region, such as hydrogeological conditions, air temperature, runoff, land use types, groundwater exploitation, and agricultural activities [22,26,45]. In the oasis area dominated by cultivated land, river water is diverted to cropland for irrigation through anthropogenic canals and experiences intense evaporation before infiltration, while the salts in river water also migrate downward into soil layers. Then, during the growing season, soil moisture recharged from the infiltration of riverbank, reservoir, canal, and irrigation water migrates downward into the phreatic aquifer by a gravity gradient, while the salts in soil moisture also transfer and accumulate into phreatic water due to river water dilution, salt dissolution and leaching, evaporation and cation exchange [27,33]. Then, phreatic water recharged from surface water and lateral groundwater flow in the oasis leak downward into confined water driven by a water potential gradient due to long-term groundwater overextraction, while many salts in phreatic water transfer into a confined aquifer, causing the deterioration of groundwater quality due to the mixing and interaction of fresh water and saline water within the aquifer system [16,28]. Conversely, in the desert area dominated by bare land, phreatic water is mainly supplied from lateral groundwater flow due to the dried-up river, with stable groundwater level and salinity (slight seasonal fluctuation) dominated by evaporation and mineral dissolution [3].
Groundwater dynamics have been closely related to human activities, while the natural factors are secondary [5]. Cultivated area expansion easily causes greater groundwater extraction in the arid oasis-desert region due to limited surface water resources, and strengthens the coupling among river water, soil water, groundwater, and ecological environment [15]. This in turn threatens groundwater and downstream ecosystems, causing a series of hydrological and ecological problems [50]. To avoid further groundwater deterioration (quantity and quality) and maintain the oasis-desert ecosystems in the arid areas, it is necessary to provide some recommendations for optimized groundwater resources allocation and groundwater environment improvement, and alleviate the contradiction among irrigated agriculture development, groundwater resource utilization, and desert riparian forest protection. (a) Agricultural irrigation is strongly occupying ecological water (more than 90% of river water) due to the rapid expansion of the cultivated land area. Therefore, it is necessary to calculate and propose a suitable oasis area according to the ecological water demand and the available surface water resources. This in turn limits the amount of river water irrigation and farmland area to ensure the ecological water demand [5]. (b) Groundwater renewability is poor due to scarce rainfall, dried-up river, and limited surface water, so it is not suitable for long-term and large-scale groundwater overextraction. Hence, it is urgent to calculate the groundwater allowable withdrawal according to the regional groundwater renewal rate, and then determine the threshold of groundwater pumping each year to alleviate groundwater depletion [18,37]. (c) Soil salinization and groundwater environment deterioration are severe due to irrational irrigation, agricultural fertilizers, and pesticides. The agricultural drainage ditch network could decline the groundwater level, discharge a large amount of salts within the phreatic aquifer, and reduce the inefficient phreatic water evaporation [3,14]; however, it is not perfect in the irrigated district of arid inland basins. Therefore, it is urgent to improve the agricultural drainage ditch network according to the regional groundwater level and flow direction, including the depth, width, and location of ditches and regular repair.

5. Conclusions

In this study, the spatiotemporal distribution of groundwater hydrochemistry (stable isotopes and dissolved ions) and its responses to land use change were examined using data of 67 water samples obtained in an oasis-desert region of the Tarim Basin. The spatial heterogeneity and seasonal variability of groundwater hydrochemistry were significant. Compared with the desert area, the δ18O and TDS of river water and shallow groundwater in oasis cropland exhibited lower values but greater seasonal variation. Vertically, groundwater salinity decreased with depth along with aquifers. A higher TDS was observed in autumn for river water, while in spring for shallow groundwater. The chemical evolution of phreatic water was mainly controlled by the evaporation-crystallization process and rock dominance, with a chemical type of Cl-SO4-Na-Mg. Significant spatiotemporal heterogeneity of groundwater hydrochemistry demonstrated the influence of climatic, hydrogeological, land use, and anthropogenic conditions. The major mechanisms controlling nature hydrochemistry were rock dominance for river water and confined water, while were evaporation-crystallization process and rock dominance for phreatic water. The cultivated land area has markedly expanded in the Luntai Oasis over the last 20 years (increasing by 121.8%). Farmland expansion and groundwater exploitation caused the seasonality of groundwater quantity and quality changes. The recharge–discharge relationship between surface water and groundwater changed dramatically. Groundwater overexploitation would cause phreatic water leakage downward into the confined aquifer, promoting groundwater quality deterioration due to the mixing between fresh water and salt water. Our results suggested that the improvement of agricultural drainage ditches and the limiting of farmland expansion and groundwater extraction are critical in alleviating groundwater environment deterioration and maintaining oasis-desert ecosystems in the arid inland regions.

Author Contributions

Conceptualization, W.W. (Wanrui Wang) and Y.C.; data curation, Y.C. and W.W. (Weihua Wang); investigation, Y.Y., Y.H., S.Z. and Z.Z.; methodology, W.W. (Wanrui Wang); supervision, Y.C., W.W. (Weihua Wang) and Y.Y.; writing—review and editing, W.W. (Wanrui Wang). All authors have read and agreed to the published version of the manuscript.

Funding

This research was jointly supported by the National Natural Science Foundation of China (42001041, U1803101), the CAS ‘Light of West China’ Program (2018-XBQNXZ-B-015), China Postdoctoral Science Foundation (2020T130686, 2020M683614), and the Youth Innovation Promotion Association of CAS (2021440).

Institutional Review Board Statement

Not applicable.

Informed Consent Statement

Not applicable.

Data Availability Statement

Data cannot be made publicly available; readers should contact the corresponding author for details.

Acknowledgments

We would like to thank the Akesu National Station of Observation and Research for Oasis Agro-ecosystem. We also greatly appreciate the editor and three anonymous reviewers for their constructive suggestions on the manuscript.

Conflicts of Interest

The authors declare that they have no known competing financial interests or personal relationships that could have appeared to influence the work reported in this paper.

References

  1. Jasechko, S.; Seybold, H.; Perrone, D.; Fan, Y.; Kirchner, J.W. Widespread potential loss of streamflow into underlying aquifers across the USA. Nature 2021, 591, 391–395. [Google Scholar] [CrossRef]
  2. Zhao, M.; Geruo, A.; Zhang, J.; Velicogna, I.; Liang, C.; Li, Z. Ecological restoration impact on total terrestrial water storage. Nat. Sustain. 2021, 4, 56–62. [Google Scholar] [CrossRef]
  3. Yin, X.; Feng, Q.; Zheng, X.; Wu, X.; Zhu, M.; Sun, F.; Li, Y. Assessing the impacts of irrigated agriculture on hydrological regimes in an oasis-desert system. J. Hydrol. 2021, 594, 125976. [Google Scholar] [CrossRef]
  4. Gabiri, G.; Diekkrüger, B.; Leemhuis, C.; Burghof, S.; Naschen, K.; Asiimwe, I.; Bamutaze, Y. Determining hydrological regimes in an agriculturally used tropical inland valley wetland in central Uganda using soil moisture, groundwater, and digital elevation data. Hydrol. Process. 2018, 32, 349–362. [Google Scholar] [CrossRef]
  5. Chen, Y.; Hao, X.; Chen, Y.; Zhu, C. Study on water system connectivity and ecological protection countermeasures of Tarim River Basin in Xinjiang. Bull. Chin. Acad. Sci. 2019, 34, 1156–1164. (In Chinese) [Google Scholar]
  6. Erler, A.R.; Frey, S.K.; Khader, O.; D’Orgeville, M.; Park, Y.; Hwang, H.; Lapen, D.R.; Peltier, W.R.; Sudicky, E.A. Evaluating Climate Change Impacts on Soil Moisture and Groundwater Resources Within a Lake-Affected Region. Water Resour. Res. 2019, 55, 8142–8163. [Google Scholar] [CrossRef]
  7. Asoka, A.; Gleeson, T.; Wada, Y.; Mishra, V. Relative contribution of monsoon precipitation and pumping to changes in groundwater storage in India. Nat. Geosci. 2017, 10, 109–117. [Google Scholar] [CrossRef] [Green Version]
  8. Veldkamp, T.; Wada, Y.; Aerts, J.; Doll, P.; Gosling, S.; Liu, J.; Masaki, Y.; Oki, T.; Ostberg, S.; Pokhrel, Y.; et al. Water scarcity hotspots travel downstream due to human interventions in the 20th and 21st century. Nat. Commun. 2017, 8, 15697. [Google Scholar] [CrossRef]
  9. Kulmatov, R.; Mirzaev, J.; Abuduwaili, J.; Karimov, B. Challenges for the sustainable use of water and land resources under a changing climate and increasing salinization in the Jizzakh irrigation zone of Uzbekistan. J. Arid Land 2020, 12, 90–103. [Google Scholar] [CrossRef] [Green Version]
  10. Lapworth, D.; Krishan, G.; MacDonald, A.; Rao, M. Groundwater quality in the alluvial aquifer system of northwest India: New evidence of the extent of anthropogenic and geogenic contamination. Sci. Total Environ. 2017, 599–600, 1433–1444. [Google Scholar] [CrossRef] [Green Version]
  11. Krishan, G.; Rao, M.S.; Vashisht, R.; Chaudhary, A.; Singh, J.; Kumar, A. Isotopic Assessment of Groundwater Salinity: A Case Study of the Southwest (SW) Region of Punjab, India. Water 2022, 14, 133. [Google Scholar] [CrossRef]
  12. De Graaf, I.E.M.; Gleeson, T.; Van Beek, L.P.H.; Sutanudjaja, E.H.; Bierkens, M.F.P. Environmental flow limits to global groundwater pumping. Nature 2019, 574, 90–94. [Google Scholar] [CrossRef]
  13. Jia, H.; Qian, H.; Zheng, L.; Feng, W.; Wang, H.; Gao, Y. Alterations to groundwater chemistry due to modern water transfer for irrigation over decades. Sci. Total Environ. 2020, 717, 137170. [Google Scholar] [CrossRef]
  14. Wang, D.; Zhao, C.; Zheng, J.; Zhu, J.; Gui, Z.; Yu, Z. Evolution of soil salinity and the critical ratio of drainage to irrigation (CRDI) in the Weigan Oasis in the Tarim Basin. Catena 2021, 201, 105210. [Google Scholar] [CrossRef]
  15. Cai, Z.; Wang, W.; Zhao, M.; Ma, Z.; Lu, C.; Li, Y. Interaction between Surface Water and Groundwater in Yinchuan Plain. Water 2020, 12, 2635. [Google Scholar] [CrossRef]
  16. Wang, W.; Chen, Y.; Wang, W.; Xia, Z.; Li, X.; Kayumba, P.M. Hydrochemical characteristics and evolution of groundwater in the dried-up river oasis of the Tarim Basin, Central Asia. J. Arid Land 2021, 13, 977–994. [Google Scholar] [CrossRef]
  17. Lapworth, D.; Dochartaigh, B.; Nair, T.; O’Keeffe, J.; Krishan, G.; MacDonald, A.; Khan, M.; Kelkar, N.; Choudhary, S.; Krishnaswamy, J.; et al. Characterising groundwater-surface water connectivity in the lower Gandak catchment, a barrage regulated biodiversity hotspot in the mid-Gangetic basin. J. Hydrol. 2021, 594, 125923. [Google Scholar] [CrossRef]
  18. Zhang, Z.; Hu, H.; Tian, F.; Yao, X.; Sivapalan, M. Groundwater dynamics under water-saving irrigation and implications for sustainable water management in an oasis: Tarim River basin of western China. Hydrol. Earth Syst. Sci. 2014, 18, 3951–3967. [Google Scholar] [CrossRef] [Green Version]
  19. Wang, W.; Chen, Y.; Wang, W.; Jiang, J.; Cai, M.; Xu, Y. Evolution characteristics of groundwater and its response to climate and land-cover changes in the oasis of dried-up river in Tarim Basin. J. Hydrol. 2021, 594, 125644. [Google Scholar] [CrossRef]
  20. Wang, W.; Chen, Y.; Wang, W. Groundwater recharge in the oasis-desert areas of northern Tarim Basin, northwest China. Hydrol. Res. 2020, 51, 1506–1520. [Google Scholar] [CrossRef]
  21. Wang, P.; Yu, J.; Zhang, Y.; Liu, C. Groundwater recharge and hydrogeochemical evolution in the Ejina Basin, northwest China. J. Hydrol. 2013, 476, 72–86. [Google Scholar] [CrossRef]
  22. Pant, R.R.; Zhang, F.; Rehman, F.U.; Wang, G.; Ye, M.; Zeng, C.; Tang, H. Spatiotemporal variations of hydrogeochemistry and its controlling factors in the Gandaki River Basin, Central Himalaya Nepal. Sci. Total Environ. 2018, 622–623, 770–782. [Google Scholar] [CrossRef] [PubMed]
  23. Ma, J.; He, J.; Qi, S.; Zhu, G.; Zhao, W.; Edmunds, W.M.; Zhao, Y. Groundwater recharge and evolution in the Dunhuang Basin, northwestern China. Appl. Geochem. 2013, 28, 19–31. [Google Scholar] [CrossRef]
  24. Cary, L.; Petelet-Giraud, E.; Bertrand, G.; Kloppmann, W.; Aquilina, L.; Martins, V.; Hirata, R.; Montenegro, S.; Pauwels, H.; Chatton, E.; et al. Origins and processes of groundwater salinization in the urban coastal aquifers of Recife (Pernambuco, Brazil): A multi-isotope approach. Sci. Total Environ. 2015, 530–531, 411–429. [Google Scholar] [CrossRef] [Green Version]
  25. Huang, T.; Pang, Z.; Liu, J.; Yin, L.; Edmunds, W.M. Groundwater recharge in an arid grassland as indicated by soil chloride profile and multiple tracers. Hydrol. Process. 2017, 31, 1047–1057. [Google Scholar] [CrossRef]
  26. Li, Z.; Yang, Q.; Yang, Y.; Ma, H.; Wang, H.; Luo, J.; Bian, J.; Martin, J.D. Isotopic and geochemical interpretation of groundwater under the influences of anthropogenic activities. J. Hydrol. 2019, 576, 685–697. [Google Scholar] [CrossRef]
  27. Xiao, J.; Jin, Z.; Wang, J.; Zhang, F. Hydrochemical characteristics, controlling factors and solute sources of groundwater within the Tarim River Basin in the extreme arid region, NW Tibetan Plateau. Quat. Int. 2015, 380–381, 237–246. [Google Scholar] [CrossRef]
  28. Zeng, Y.; Zhou, J.; Nai, W.; Li, L.; Tan, P. Hydrogeochemical processes of groundwater formation in the Kashgar River Basin, Xinjiang. Arid Zone Res. 2020, 37, 541–550. (In Chinese) [Google Scholar]
  29. Krishan, G.; Kumar, B.; Sudarsan, N.; Rao, M.S.; Ghosh, N.C.; Taloor, A.K.; Bhattacharya, P.; Singh, S.; Kumar, C.P.; Sharma, A.; et al. Isotopes (δ18O, δD and 3H) variations in groundwater with emphasis on salinization in the state of Punjab, India. Sci. Total Environ. 2021, 789, 148051. [Google Scholar] [CrossRef]
  30. Riley, D.; Mieno, T.; Schoengold, K.; Brozović, N. The impact of land cover on groundwater recharge in the High Plains: An application to the Conservation Reserve Program. Sci. Total Environ. 2019, 696, 133871. [Google Scholar] [CrossRef]
  31. Krishan, G.; Sejwal, P.; Bhagwat, A.; Prasad, G.; Yadav, B.; Kumar, C.; Kansal, M.; Singh, S.; Sudarsan, N.; Bradley, A.; et al. Role of Ion Chemistry and Hydro-Geochemical Processes in Aquifer Salinization—A Case Study from a Semi-Arid Region of Haryana, India. Water 2021, 13, 617. [Google Scholar] [CrossRef]
  32. Shuai, G.; Shao, J.; Cui, Y.; Zhang, Q.; Guo, Y. Hydrochemical Characteristics and Quality Assessment of Shallow Groundwater in the Xinzhou Basin, Shanxi, North China. Water 2021, 13, 1993. [Google Scholar] [CrossRef]
  33. Liu, Y.; Jin, M.; Wang, J. Insights into groundwater salinization from hydrogeochemical and isotopic evidence in an arid inland basin. Hydrol. Process. 2018, 32, 3108–3127. [Google Scholar] [CrossRef]
  34. Fuchs, E.H.; King, J.P.; Carroll, K.C. Quantifying Disconnection of Groundwater from Managed-Ephemeral Surface Water During Drought and Conjunctive Agricultural Use. Water Resour. Res. 2019, 55, 5871–5890. [Google Scholar] [CrossRef] [Green Version]
  35. Shen, B.; Wu, J.; Zhan, S.; Jin, M.; Saparov, A.; Abuduwaili, J. Spatial variations and controls on the hydrochemistry of surface waters across the Ili-Balkhash Basin, arid Central Asia. J. Hydrol. 2021, 600, 126565. [Google Scholar] [CrossRef]
  36. Craig, H. Isotopic Variations in Meteoric Waters. Science 1961, 133, 1702–1703. [Google Scholar] [CrossRef]
  37. Guo, X.; Feng, Q.; Si, J.; Wei, Y.; Bao, T.; Xi, H.; Li, Z. Identifying the origin of groundwater for water resources sustainable management in an arid oasis, China. Hydrol. Sci. J. 2019, 64, 1253–1264. [Google Scholar] [CrossRef]
  38. Chen, H.; Chen, Y.; Li, W.; Li, Z. Quantifying the contributions of snow/glacier meltwater to river runoff in the Tianshan Mountains, Central Asia. Glob. Planet. Chang. 2019, 174, 47–57. [Google Scholar] [CrossRef]
  39. Meybeck, M. Global Occurrence of Major Elements in Rivers. Treatise Geochem. 2003, 5, 207–223. [Google Scholar] [CrossRef]
  40. Nie, Z.; Chen, Z.; Cheng, X.; Hao, M.; Zhang, G. The chemical information of the interaction of unconfined groundwater and surface water along the Heihe River, Northwestern China. J. Jilin Univ. (Earth Sci. Ed.) 2005, 35, 48–53. (In Chinese) [Google Scholar]
  41. Gao, Y.; Wang, G.; Liu, H. Analysis the interaction between the unconfined groundwater and surface water based on the chemical information along the Shiyang River, northwestern China. J. Arid Land Res. Environ. 2006, 20, 84–88. (In Chinese) [Google Scholar]
  42. Zhou, J. Hydrograph Separation in the Headwater Area of Shule River Basin: Combining Water Chemistry and Stable Isotopes. Master’s Thesis, University of Chinese Academy of Sciences, Beijing, China, 2015. (In Chinese). [Google Scholar]
  43. Beal, L.; Wong, C.; Bautista, K.; Jenson, J.; Banner, J.; Lander, M.; Gingerich, S.; Partin, J.; Hardt, B.; van Oort, N. Isotopic and geochemical assessment of the sensitivity of groundwater resources of Guam, Mariana Islands, to intra- and inter-annual variations in hydroclimate. J. Hydrol. 2019, 568, 174–183. [Google Scholar] [CrossRef]
  44. Thomas, J.; Joseph, S.; Thrivikramji, K. Hydrochemical variations of a tropical mountain river system in a rain shadow region of the southern Western Ghats, Kerala, India. Appl. Geochem. 2015, 63, 456–471. [Google Scholar] [CrossRef]
  45. Castellano, M.J.; Archontoulis, S.V.; Helmers, M.J.; Poffenbarger, H.J.; Six, J. Sustainable intensification of agricultural drainage. Nat. Sustain. 2019, 2, 914–921. [Google Scholar] [CrossRef]
  46. Gibbs, R.J. Mechanisms Controlling World Water Chemistry. Science 1970, 170, 1088–1090. [Google Scholar] [CrossRef]
  47. Fisher, R.; Mullican, W.F., III. Hydrochemical evolution of sodium–sulfate and sodium–chloride groundwater beneath the northern Chihuahuan Desert, Trans–Pecos, Texas, USA. Hydrogeol. J. 1997, 5, 4–16. [Google Scholar] [CrossRef]
  48. Han, D.; Song, X.; Currell, M.J.; Cao, G.; Zhang, Y.; Kang, Y. A survey of groundwater levels and hydrogeochemistry in irrigated fields in the Karamay Agricultural Development Area, northwest China: Implications for soil and groundwater salinity resulting from surface water transfer for irrigation. J. Hydrol. 2011, 405, 217–234. [Google Scholar] [CrossRef]
  49. Xu, Q.; Zhao, K.; Liu, F.; Peng, D.; Chen, W. Effects of land use on groundwater recharge of a loess terrace under long-term irrigation. Sci. Total Environ. 2021, 751, 142340. [Google Scholar] [CrossRef]
  50. Yang, Z.; Zhou, Y.; Wenninger, J.; Uhlenbrook, S.; Wang, X.; Wan, L. Groundwater and surface-water interactions and impacts of human activities in the Hailiutu catchment, northwest China. Appl. Hydrogeol. 2017, 25, 1341–1355. [Google Scholar] [CrossRef]
Figure 1. Locations of (a) study area and (c) water sampling sites in the oasis-desert region of Dina River Basin, and (b) hydrogeologic condition of the Dina River Basin. A: fine sandstone (thickness = 40–60 m), moderate water abundance; B: pebbly gravel (thickness > 100 m), very strong water-abundance; C: fine sandstone (thickness = 20–50 m), moderate water abundance; D: pebbly sandstone (thickness > 50 m), very strong water abundance; E: silty fine sandstone (thickness = 10–50 m), weak water abundance.
Water 14 00651 g001
Figure 2. A geological cross-section of the Luntai Oasis (b), and its location in the oasis-desert region of Dina River Basin (a).
Water 14 00651 g002
Figure 3. Spatial distributions of annual averaged LULC in the Dina River Basin for 2000 (a), 2010 (b), and 2020 (c), respectively. LULC: land use and land cover.
Water 14 00651 g003
Figure 4. Area coverage (%) by various land cover types (a) and the percentage change (b) from 2000 to 2020 in the middle and lower reaches of Dina River Basin. CL, cultivated land; FL, forest land; GL, grassland; WL, wetland; WB, water bodies; AS, artificial surfaces; BL, bare land.
Water 14 00651 g004
Figure 5. Relationship between δ18O and δ2H for surface water, groundwater, and precipitation in the Luntai Oasis. GMWL: global meteoric water line [36]; LMWL in NW China: local meteoric water line in northwest China [37]. Precipitation isotopic data were from Wang et al. for the Weigan-Kuqa river basin (WK) [16], and the GNIP (Global Network of Isotopes in Precipitation) for the Hetian (HT) and Wulumuqi stations.
Water 14 00651 g005
Figure 6. Spatial distributions of water stable isotope values, air temperature and precipitation in the Luntai Oasis: (a) the δ18O of surface water, (b) the δ18O of groundwater, (c) mean annual air temperature in 2019, and (d) annual precipitation in 2019.
Water 14 00651 g006
Figure 7. Ternary diagrams for anions and cations in surface water (a) and groundwater (b) in the Luntai Oasis.
Water 14 00651 g007
Figure 8. Spatial distributions and box plot of TDS (ad) and Cl (eh) in surface water (SW; a,e), shallow groundwater (SG; b,f), and middle groundwater (MG; c,g). TDS: the total dissolved solids.
Water 14 00651 g008
Figure 9. Seasonal variations of different hydrochemical components in groundwater and surface water in the Luntai Oasis: (a) TDS (the total dissolved solids), (b) Cl, (c) SO42−, (d) Na+, (e) K+, (f) Ca2+, and (g) Mg2+.
Water 14 00651 g009
Figure 10. Plots of TDS vs. Na+/(Na+ + Ca2+) and Cl/(Cl + HCO3) in surface water (a,b) and groundwater (c,d) in the Luntai Oasis.
Water 14 00651 g010
Figure 11. TDS of groundwater and groundwater level depth (DGL) in the oasis area (G1 well; a) and desert area (G2 well; b), and their relationships with precipitation, air temperature (c), runoff, and NDVI (d) in 2019 in the Dina River Basin. NDVI: normalized difference vegetation index.
Water 14 00651 g011
Table 1. Land use area transfer matrix from 2000 to 2020 in the Luntai Oasis (km2).
CLFLGLWLWBASBL2000Transfers
2000–2010CL592.030.005.800.021.423.4852.47655.2253.99
FL0.000.090.070.000.000.000.060.22−0.05
GL3.680.001728.520.221.040.0244.731778.2212.29
WL0.030.000.398.220.210.001.5310.391.72
WB0.140.010.690.209.780.001.9912.82−1.26
AS5.150.000.080.000.0017.320.6923.232.25
BL0.210.1630.380.011.620.155250.905283.43−68.95
2010601.230.271765.938.6714.0720.985352.377763.53
CLFLGLWLWBASBL2010Transfers
2010–2020CL617.400.00509.910.831.745.28198.451333.61678.39
FL0.000.131.420.000.020.000.101.671.44
GL16.100.001131.395.024.940.03305.401462.88−315.34
WL1.080.007.524.230.200.316.3319.669.27
WB0.470.007.920.254.200.015.2718.125.31
AS15.190.004.180.000.0017.3111.3748.0624.83
BL4.990.08115.880.061.710.294756.524879.53−403.90
2020655.220.221778.2210.3912.8223.235283.437763.53
CLFLGLWLWBASBL2000Transfers
2000–2020CL569.520.00507.690.803.186.07246.361333.61732.38
FL0.000.111.490.000.010.000.071.671.40
GL8.710.001120.544.875.100.01323.631462.88−303.05
WL0.510.007.762.800.060.318.2319.6610.99
WB0.420.018.040.203.550.015.8918.124.05
AS17.610.004.200.000.0014.3111.9448.0627.08
BL4.460.15116.210.012.170.274756.264879.53−472.85
2020601.230.271765.938.6714.0720.985352.377763.53
Note: CL, cultivated land; FL, forest land; GL, grassland; WL, wetland; WB, water bodies; AS, artificial surfaces; BL, bare land.
Table 2. Hydrochemical characteristics of surface water and groundwater samples in the Luntai Oasis.
ClSO42−HCO3Na+K+Mg2+Ca2+Hydrochemical Type
(mg/L)
River water (n = 20)
Max244.4550.0255.0200.06.191.9237.7SO4-Ca
Min33.198.2108.629.10.514.274.5
Mean119.9265.9154.685.02.341.9136.3
Reservoir water (n = 6)
Max840.11563.2224.7514.711.5226.5574.2SO4-Ca-Na
Min64.2172.5100.058.31.624.1118.2
Mean461.0808.2156.3314.05.7110.1274.0
Shallow groundwater (well depth < 20 m) (n = 21)
Max16016.311354.2456.310817.464.73619.21998.1Cl-SO4-Na-Mg
Min68.3260.0224.255.90.090.4107.2
Mean3473.83093.5330.22564.57.6769.6615.9
Middle groundwater (well depth = 20–100 m) (n = 18)
Max249.0677.4369.9240.42.7139.4248.8SO4-Cl-Na-Ca
Min60.889.076.753.60.012.630.5
Mean147.3202.1155.9119.71.642.895.9
Deep groundwater (well depth > 100 m) (n = 2)
Max121.8125.4221.1119.72.337.2116.8HCO3-Cl-Ca-Na
Min69.587.1115.157.1134.887.8
Mean95.6106.3168.188.41.636102.3
Note: n, number of water samples; Max, maximum value; Min, minimum value; Mean, mean value.
Publisher’s Note: MDPI stays neutral with regard to jurisdictional claims in published maps and institutional affiliations.

