Article

Using the Diversity, Taxonomic and Functional Attributes of a Zooplankton Community to Determine Lake Environmental Typology in the Natural Southern Boreal Lakes (Québec, Canada)

1
GRIL, Groupe de Recherche Interuniversitaire en Limnologie, Département de Sciences Biologiques, Université de Montréal, C.P. 6128, Succ. Centre-Ville, Montreal, QC H3C 3J7, Canada
2
ECCC, Environnement et Changement Climatique Canada, 105 Rue McGill, Montreal, QC H2Y 2E7, Canada
3
GRIL, Groupe de Recherche Interuniversitaire en Limnologie, Département des Sciences de L’environnement, Université du Québec à Trois-Rivières, C.P. 500, Trois-Rivières, QC G9H 5H7, Canada
*
Author to whom correspondence should be addressed.
Water 2022, 14(4), 578; https://doi.org/10.3390/w14040578
Submission received: 3 January 2022 / Revised: 31 January 2022 / Accepted: 8 February 2022 / Published: 14 February 2022
(This article belongs to the Special Issue Zooplankton Diversity in Water Bodies)

Abstract

:
Herein, we used zooplankton as a study model for determining how biodiversity components as well as taxonomic and functional attributes reflect lake typology in the natural southern boreal lakes. We estimated the regional and local variation in zooplankton diversity and the community structure across a set of fourteen lakes within a national park. Regional diversity (γ diversity) accounted for 40 species including 20 rotifers, 10 cladocerans and 8 copepods. Local diversity (α diversity) averaged 15 species per lake. Spatial variation in β diversity was inversely related to spatial variation in α diversity. Inter-lake variation in zooplankton communities based on taxonomy, functional traits and biotic indices was explained by two major limnological gradients: namely lake trophic status and fish community. The community structure reflected a gradient of rotifer to calanoid copepod dominance in response to trophic status. Several key species of rotifers (Kellicottia longispina and Conochilus unicornis) and of small (Bosmina and Diaphanosoma birgei) or large (Daphnia catawba and Holopedium gibberum cf glacialis) cladocerans were good indicators of lake zooplankton typology, as in other boreal lakes. We distinguished two main groups of lakes: (1) oligotrophic lakes inhabited by brook trout and dominated by the calanoid copepods and (2) mesotrophic lakes inhabited by northern pike and dominated by rotifers. Overall, our study can help managers better define monitoring and conservation strategies for lake ecosystems in natural parks.

1. Introduction

Canada has extensive experience in the management of national parks and protected areas, an essential element for the conservation of biodiversity [1]. Indeed, national parks constitute biodiversity reserves and natural environments sheltered from major anthropogenic disturbances; their ecological integrity must thus be preserved for future generations [2]. To ensure greater scientific rigor and better decision-oriented management of these pristine ecosystems, the management of natural parks should rely on research assessing the response of biodiversity to natural environmental heterogeneity. However, there are still many gaps in the knowledge of biodiversity in national park ecosystems [2]. Most aquatic biodiversity monitoring targets large species such as amphibians and fish [3] but it very rarely examines microorganisms such as algae and zooplankton, which form the basis of the pelagic food web of lakes [4].
Herein, we chose zooplankton as a study model because it is recognized as a good indicator of water quality, trophic status and the level of disturbance of temperate lakes in both North America [5] and Europe [6]. Indeed, the structure of a zooplankton community changes accordingly to lake trophic status [7,8,9,10,11,12], lake acidification [13,14,15,16,17] and water transparency [18,19]. Zooplankton communities also respond to watershed disturbance by logging and forest fires [20,21,22] and residential or urban development [23,24,25]. As a result, several biotic indices based on zooplankton attributes, such as species richness, the abundance and biomass of taxonomic groups and key species assemblages have been proposed as tools for the management and environmental monitoring of the ecological integrity of impacted lakes in Europe [6,12,26], USA [5] and Canada [13,27,28,29,30]. In comparison, the use of zooplankton as a bioindicator of the ecological integrity of lakes in national parks is still under evaluated.
Our research thus aimed to describe the biodiversity as well as the taxonomic and functional structure of zooplankton communities in 14 lakes of the Mont-Tremblant National Park (MTNP) to improve our understanding of how these pristine ecosystems are currently responding to natural environmental gradients and ultimately, to determine the typologies of lakes present in regions with high ecological integrity such as protected areas. To do so, we evaluated the response of several attributes of community structure: the components of diversity (γ, α and β), the abundance of major taxonomic groups (Rotifera, Cladocera, Copepoda Calanoida and Cyclopoida) and that of 12 functional groups based on body size and trophic guilds. A secondary goal was to evaluate if spatial monitoring limited to a single sampling period during the summer would be sufficient to develop zooplankton monitoring in the MTNP lakes.
We hypothesized that (1) certain attributes of zooplankton communities (specific composition, taxonomic and functional groups, biotic indices) vary according to limnological gradients (morphometry, water quality, trophic status, ichthyofauna), (2) certain key species and biotic indices can serve as indicators of the trophic state and ecological integrity of these reference lakes and (3) spatial variation in species composition between lakes would be more pronounced than the temporal variation between sampling dates.
This research represents the first major study on zooplankton in the Mont-Tremblant National Park including all taxonomic and functional groups as well as all components of biodiversity. Only one earlier study described the rotifer communities in nine lakes of the MTNP [31]. Our research will serve as a reference for future lake monitoring and management studies in the Mont-Tremblant National Park and could be applied to other national parks in temperate ecozones.

2. Material and Methods

2.1. Study Sites and Limnological Characteristics

The study was carried out in the Mont-Tremblant National Park (MTNP), the largest (area = 1510 km2) and one of the oldest (1981) protected parks in Québec (Canada). The MTNP covers the natural regions of the Southern and Boreal Laurentians (46.33°–46.52° N; 74.35°–74.57° W). Its territory is divided into three watersheds corresponding to the Red River, the Assumption River and the Matawin River (Figure 1). It includes 400 lakes (>1 hectare) distributed over an area of 82 km2 (www.sepaq.com accessed on 3 January 2022). Sampling was carried out in 14 lakes distributed in the three hydrographic basins. The lakes were selected to reflect the range of variation in the limnological conditions of oligo-mesotrophic lakes in southern Québec [32,33].
To evaluate environmental heterogeneity among the lakes, we used the morphometric characteristics of the lakes and watersheds, water residence time, surface water quality and trophic status indices. The limnological conditions of MTNP lakes were described by Carignan, 2010 [32].
The MTNP lakes were located at different altitudes in the park (344–533 m; mean: 457 m) and showed relatively large variations in terms of morphology and hydrology (Table 1, for details see Table S1). The lake areas (SL) ranged from 0.03 to 3.35 km2 (mean: 0.77 km2). The maximum depth of the lakes (Zmax) ranged from 4 to 27 m (mean: 15 m), while mean depth (Zm) ranged from 1.6 to 11 m (mean: 5 m). The volume of the lakes (VL) ranged from 0.06 to 23 km3 (mean: 5 km3). The watershed area (SW) was also highly variable, ranging from 0.82 to 432 km2 (mean: 42 km2) and the drainage ratio (SW/SL) varied from 7 to 346 (mean: 42). Four lakes (Desjardins, Brochet, Buri and Trap) were very small (≤0.2 km2) and had very small watersheds (≤2 km2). Six other lakes (Ariel, Oberon, Ernie, Herman, Houdet and Allen) were of medium size (0.1–0.6 km2) with generally larger watersheds (2–12 km2). Only 4 lakes (Sables, Rossi, Savane and Monroe) were larger than 1 km2 and had very large watersheds (>29 km2). Lake Monroe showed the largest watershed (432 km2) and the largest drainage ratio (346). Due to the large variation in lake and watershed areas, water residence time (WRT) ranged from 11 days (0.03 years) in Lake Monroe to 2.68 years in Lake Ernie and was on average less than one year (0.6 years). The thermal regime and water column stratification also differed among lakes. Shallow lakes (Zmax ≤6 m: Oberon, Trap, Buri and Brochet) had a polymictic regime and were not thermally stratified. Deeper lakes (Zmax: >6 m to 27 m) had a dimictic regime and were stratified.
All water sampling was carried out during the same sampling periods as for the zooplankton; chemical analyses were performed in triplicate. Water transparency was measured with a 20 cm diameter Secchi disk. The light attenuation coefficient was estimated with surface and submersible LI-Cor probes (Li-190 and Li-192A). Water quality was assessed by measuring the concentrations of total phosphorus (TP), total nitrogen (TN), dissolved organic carbon (DOC) and chlorophyll-a (Chla). Bathymetry variables were obtained from the ministry’s map banks (MRN-MDDEP) and surveys made by echo sounding for certain lakes (Ariel, Oberon, Rossi).
Water quality showed important variation among lakes (Table 1, for details see Table S2). The lakes were generally clear with a mean transparency (Secchi disk depth; Sec) of 4.5 m, ranging from a minimum of 2.9 m in Lake Oberon to a maximum of 8.3 m in Lake Ernie. Conversely, the light attenuation coefficient (Kpar) ranged from 0.33 m−1 in Lake Ernie to 1.09 m−1 in Lake Desjardins (mean: 0.73 m−1). Dissolved organic carbon (DOC) concentrations varied from 2.4 mg/L in Lake Brochet to 4.8 mg/L in Lake Houdet (mean: 3.6 mg/L). The lakes were poorly mineralized with a mean conductivity (Cond) of 17.2 μS/cm (range: 13–21 μS/cm). Total phosphorus concentrations (TP) varied from 2.7 μg/L in Lake Ernie to 16.6 μg/L in Lake Desjardins (mean: 7.5 μg/L), while the total nitrogen (TN) ranged from 138 μg/L in Lake Ernie to 389 μg/L in Lake Desjardins (mean: 225 μg/L). Finally, chlorophyll-a (Chla) ranged from 0.8 μg/L in Lake Herman to 9.4 μg/L in Lake Desjardins (mean: 2.6 μg/L).
Lake trophic status was estimated using a Trophic State Index (TSI) [34] based on the Secchi depth (Sd), chlorophyll-a biomass (Chla) and total phosphorus (TP) according to the following equations:
TSI-Sd = 10 (6 − (ln Sd/ln 2))
TSI-Chla = 10 (6 − (2.04 − 0.68 ln Chla)/ln 2))
TSI-TP = 10 (6 − (ln (48/TP)/ln 2)
Overall, the MTNP lakes were oligo-mesotrophic with mean trophic indices (TSI) <40 (based on the Carlson Index, Table 1, for details see Table S3). According to the three TSI indices (Sd, Chla, TP), Lakes Desjardins, Houdet, Savane, Ariel, Oberon and Monroe were mesotrophic with at least one of the trophic indices >40. Lakes Ernie, Herman, Allen and Trap were the most oligotrophic with at least one of the trophic indices <30. Lakes Brochet, Buri, Sables and Rossi were oligo-mesotrophic with TSI between 30 and 40.
The MTNP lakes also differed in terms of fish communities. Seventeen species of fish were recorded in the lakes under study by biologists from the MTNP (Table S4). The typology of the ichthyofauna was described using canonical analysis (Figure S1); it differentiated two groups of lakes based on the exclusive presence of the brook trout (SAFO) (5 lakes: Allen, Oberon, Herman, Trap and Brochet) or of the northern pike (ESLU) (9 lakes: Ernie, Rossi, Savane, Ariel, Buri, Houdet, Desjardins, Monroe and Sables). The SAFO lakes were small in size and oligotrophic; the fish community also included the rainbow trout and cyprinids. The ESLU lakes were large in size and mesotrophic; the fish community was more diverse including the yellow perch, the common carp and several cyprinid species. In Lake Monroe at a lower altitude, we found a singular fish community, including the pumpkinseed, the lake trout, the brown catfish and small cyprinids. Several small species of chaoborids (Chaoborus flavicans, C. punctipennis, C. crystallina, C. trivittatus) were recorded in 10 lakes; the large species C. americanus was only found in Lake Ernie (Tables S4 and S6).

2.2. Sampling and Analysis of Zooplankton

Zooplankton samples were collected in the center (pelagic zone) of each lake in July 2009 and in June and July 2010. This summer sampling period corresponds to the maximum diversity in zooplankton communities according to the PEG (Plankton Ecology Group) model [35,36]. Zooplankton samples were collected during the daytime by vertical hauls over the entire water column (surface to 1 m above the lake bottom) using a counter-lever plankton net of 53 μm mesh size with an opening area of 0.04 m2 [37]. Zooplankton organisms were anesthetized with carbonated water for 5 min, then fixed in formaldehyde solution (4%) and finally stained with rose of Bengal to facilitate taxonomic analyses. Zooplankton organisms were counted in 10–12 mL (July 2009 and June 2010) or 24 mL (July 2010) subsamples using a Ward rotating cell [38] under a binocular magnifying glass (Leica Wild M3B) at 20× or 40× magnifications. Predator invertebrates such as the cladoceran Leptodora kindtii and Chaoborus larvae were counted in all samples. However, as sampling could not be performed at night, Chaoborus abundances were likely underestimated.
To reach our study goals, we first determined the local diversity (species richness: α diversity) in each lake, the variation in diversity among lakes (β diversity) and the regional diversity for all lakes (γ diversity). Then, we evaluated the variation in the zooplankton communities based on the major taxonomic and functional groups between the lakes and sampling dates. Finally, to select biotic indices (i.e., abundance of key species and ratio of taxonomic groups) that can serve as indicators of the ecological integrity, we then created lake typologies based on the inter-lake variation in taxonomic and functional community composition and examined their relationships with limnological variables (i.e., lake and watershed morphometry, hydrology, lake trophic status and fish communities).
To estimate the components of diversity (α, β and γ) and community composition, zooplankton identification and analysis were performed at two levels of taxonomic resolution, species and genus, on the samples collected in July 2009. Organisms were enumerated using identification keys for rotifers [39,40,41,42,43], cladocerans [44,45,46,47,48,49], copepods [50,51,52,53] and Chaoborus [54]. Local alpha diversity (α) corresponds to the number of zooplankton species in each lake; regional gamma diversity (γ) represents the total number of species recorded in the 14 MTNP lakes and beta diversity (β) is the variation in species assemblages between lakes. Beta diversity (β) was calculated as the ratio of gamma diversity (γ) to average alpha diversity (α) per lake and indicated the average contribution of each lake to total zooplankton diversity (local contribution of sites to beta diversity; LCBD) [55,56]. In addition, the contribution of taxonomic groups and species to β diversity (species contribution to beta diversity; SCBD) was calculated using the method of Legendre and De Cáceres, 2013 [57]. These metrics allowed us to assess (i) which lakes exhibited a particular community that set them apart from others (LCBD) and (ii) which groups and species contributed the most to the variation in biodiversity between the lakes (SCBD).
To determine the functional structure of zooplankton communities, species counts were lumped into 12 functional groups: (1)—small herbivorous rotifers (RH: Keratella, Kellicottia, Polyarthra, Trichocerca, etc.), (2)—omnivorous and carnivorous rotifers (RC: Asplanchna, Synchaeta), (3)—small cladocerans <1 mm (SC: Bosmina, Ceriodaphnia, Diaphanosoma, etc.), (4)—large cladocerans >1 mm (LC: Daphnia, Holopedium), (5)—predatory cladocerans (PC: Leptodora), (6)—copepod nauplii (NAU), (7)—calanoid copepodites (CCA), (8)—cyclopoid copepodites (CCY), (9)—adults of herbivorous calanoids (CCA-DIA: Diaptomus), (10)—adults of carnivorous calanoids (CCA-EPI: Epischura), (11)—adults of omnivorous cyclopoids (CCY-CYC: Cyclops, Mesocyclops) and (12)—larvae of chaoborids (CHAO: Chaoborus).
The abundances of the main taxonomic groups (Rotifera, Cladocera, Copepoda Calanoida and Cyclopoida) and of the 12 functional groups were estimated for each lake and for the three sampling dates according to the methods established by Pinel-Alloul et al., 1990 [13]. The densities of species and of the taxonomic and functional groups were estimated using the number of individuals per liter (Ind. L−1) according to the following formula:
Density (Ind. L−1) = number of organisms in the sub-sample × concentrated volume of sample (250 mL or 500 mL)/analyzed volume of sub-sample (10–12 mL or 24 mL) × volume of water filtered in the lake (liters).
To describe the typology of the zooplankton communities in relation to the ecological integrity of lakes, we used the biotic indices already established for zooplankton [6,12], in particular those based on species richness and the abundances of taxonomic groups and certain key species. These biotic indices based on the coarse identification process are known to be related to different types of limnological conditions or anthropogenic disturbances and could be applied more easily by biologists and managers in natural parks.

2.3. Statistical Analyses

All limnological variables were standardized (i.e., subtracted the mean and divided by the variance). The Hellinger transformation was applied to zooplankton variables, including species abundances, taxonomic and functional composition data, as well as biotic indices [58,59].
To assess the importance of the spatial variation in zooplankton communities among lakes (space) relative to the temporal variation among summer sampling dates (time), we applied a space–time interaction test (STI: Space–Time Interaction) on the species abundance data using 9999 permutations [60].
To select the most discriminant variables representing the environmental heterogeneity of the MTNP lakes, a principal component analysis (PCAs) was performed to visualize the limnological variation in the morphometry of lakes and watersheds, water residence time, water quality, trophic status (TSI indices) and in the fish community based on the presence of key predator species (brook trout vs. northern pike). To establish the environmental typology, we identified groups of lakes using Complete Linkage Agglomerative Clustering (function hclust, with the argument method = “complete”, of the stats package in R). A graph of the fusion level values of the dendrogram was then used to identify the group cutting number. The PCA biplot with ellipses around groups of lakes was made with the ggbiplot function of the vggbiplot package.
PCAs were also applied to zooplankton variables (taxonomic and functional groups, as well as biotic indices) to visualize the similarities or differences between lakes in the community structure and to determine the most discriminating zooplankton attributes to be selected for the biotic indices.
To examine the relationships between zooplankton community variables and the environmental conditions of lakes and to identify the limnological variables that best explained the spatial variation in zooplankton communities and biotic indices, we performed a redundancy analysis (RDA) with a stepwise selection [59]. The models were established after 9999 permutations with a progressive selection of limnological variables and using a constrained eigen value [61]. For each canonical axis, the proportion of explained variance, as opposed to the proportion of total variance, is shown (i.e., by multiplying the accumulated constrained eigenvalues of each axis by the model’s adjusted R2).
Finally, to assess the relationships between zooplankton composition (taxonomic groups) and biotic indices on the one hand and lake trophic status on the other, we applied linear regression models between zooplankton variables and trophic indices.
All analyses were carried out with the R open source software [62], using the [vegan], [BiodiversityR] and [STI] packages according to the methodology presented by Legendre and Legendre, 2012 [63].

3. Results

3.1. Environmental Typology of the Lakes

The principal component analysis (PCA) based on the limnological characteristics of the MTNP lakes revealed two significant environmental gradients (according to the broken stick model). Clustering analysis enabled us to distinguish three groups of lakes based on trophic state, size and fish predators (Figure 2). The first two PCA axes represented 69% of the total environmental variability. They were related to the size of the lakes and watersheds, their trophic status as well as to the typology of the fish communities (Figure 2). Axis 1 (49%) reflected the trophic state of the lakes (TSI indices) associated with an increase in nutrients (TP, TN), algal biomass (Chla), dissolved organic content (DOC) and water color (Kpar), in parallel with a decrease in water transparency (Sec), lake depth (Zm and Zmax) and water residence time (WRT). Axis 1 distinguished the most oligotrophic and clear lakes (Ernie, Herman and Allen) with a longer water residence time in general (TP ≤ 5 μg/L; Sec > 5 m: WRT > 0.5 yr; TSI-TP < 27) from the mesotrophic lakes (in blue: Trap, Buri, Ariel, Houdet, Oberon and Desjardins) which generally had higher nutrient concentrations (TP > 7 μg/L) and chlorophyll a biomass (Chla > 2.5 μg/L), in relation to a higher trophic status (TSI-TP > 30). Axis 2 (20%) reflected the increasing gradient in lake size (SL, VL), depth (Zmax, Zm) and drainage ratio (SW/SL) associated with higher conductivity. Axis 2 also clearly showed the contrast between brook trout lakes (SAFO) and northern pike lakes (ESLU). Small and shallow lakes with a small drainage ratio, the most isolated in altitude, were inhabited by brook trout (Trap, Herman, Allen, Oberon and Brochet) while the larger, deeper lakes with a large watershed and a high drainage ratio were inhabited by the northern pike (Rossi, Savane and Monroe).
Limnological variables: Altitude (m), SW/SL (drainage ratio), SW (watershed area), SL (Lake surface area), VL (Lake volume), Zmax (maximum depth), Zm (mean depth), WRT (water residence time), Cond. (conductivity), Sec (Secchi depth), TP (total phosphorus), TN (total nitrogen), Chla (chlorophyll a), DOC (dissolved organic carbon), Kpar (light attenuation coefficient) TSI-TP (TSI index based on total phosphorus), TSI-Chla (TSI index based on chlorophyll a), TSI-Sd (TSI index based on Secchi transparency), ESLU (Esox lucius), SAFO (Salvelinus fontinalis).

3.2. Spatio-Temporal Variation in the Zooplankton Community

The Space–Time Interaction (STI) test showed that the zooplankton composition based on taxonomic groups differed significantly between the lakes (p < 0.001) and between sampling dates (p < 0.001) but that the space–time interaction was not significant (p = 0.18) (Table S5). This means that the composition of the zooplankton varied between the lakes and also between the sampling months but independently, i.e., the spatial variation between the lakes did not change according to the sampling dates and vice versa. It was therefore justified to analyze the average data of the three sampling periods to characterize the spatial variation in 2009–2010 of the zooplankton communities of the 14 lakes of the MTNP.

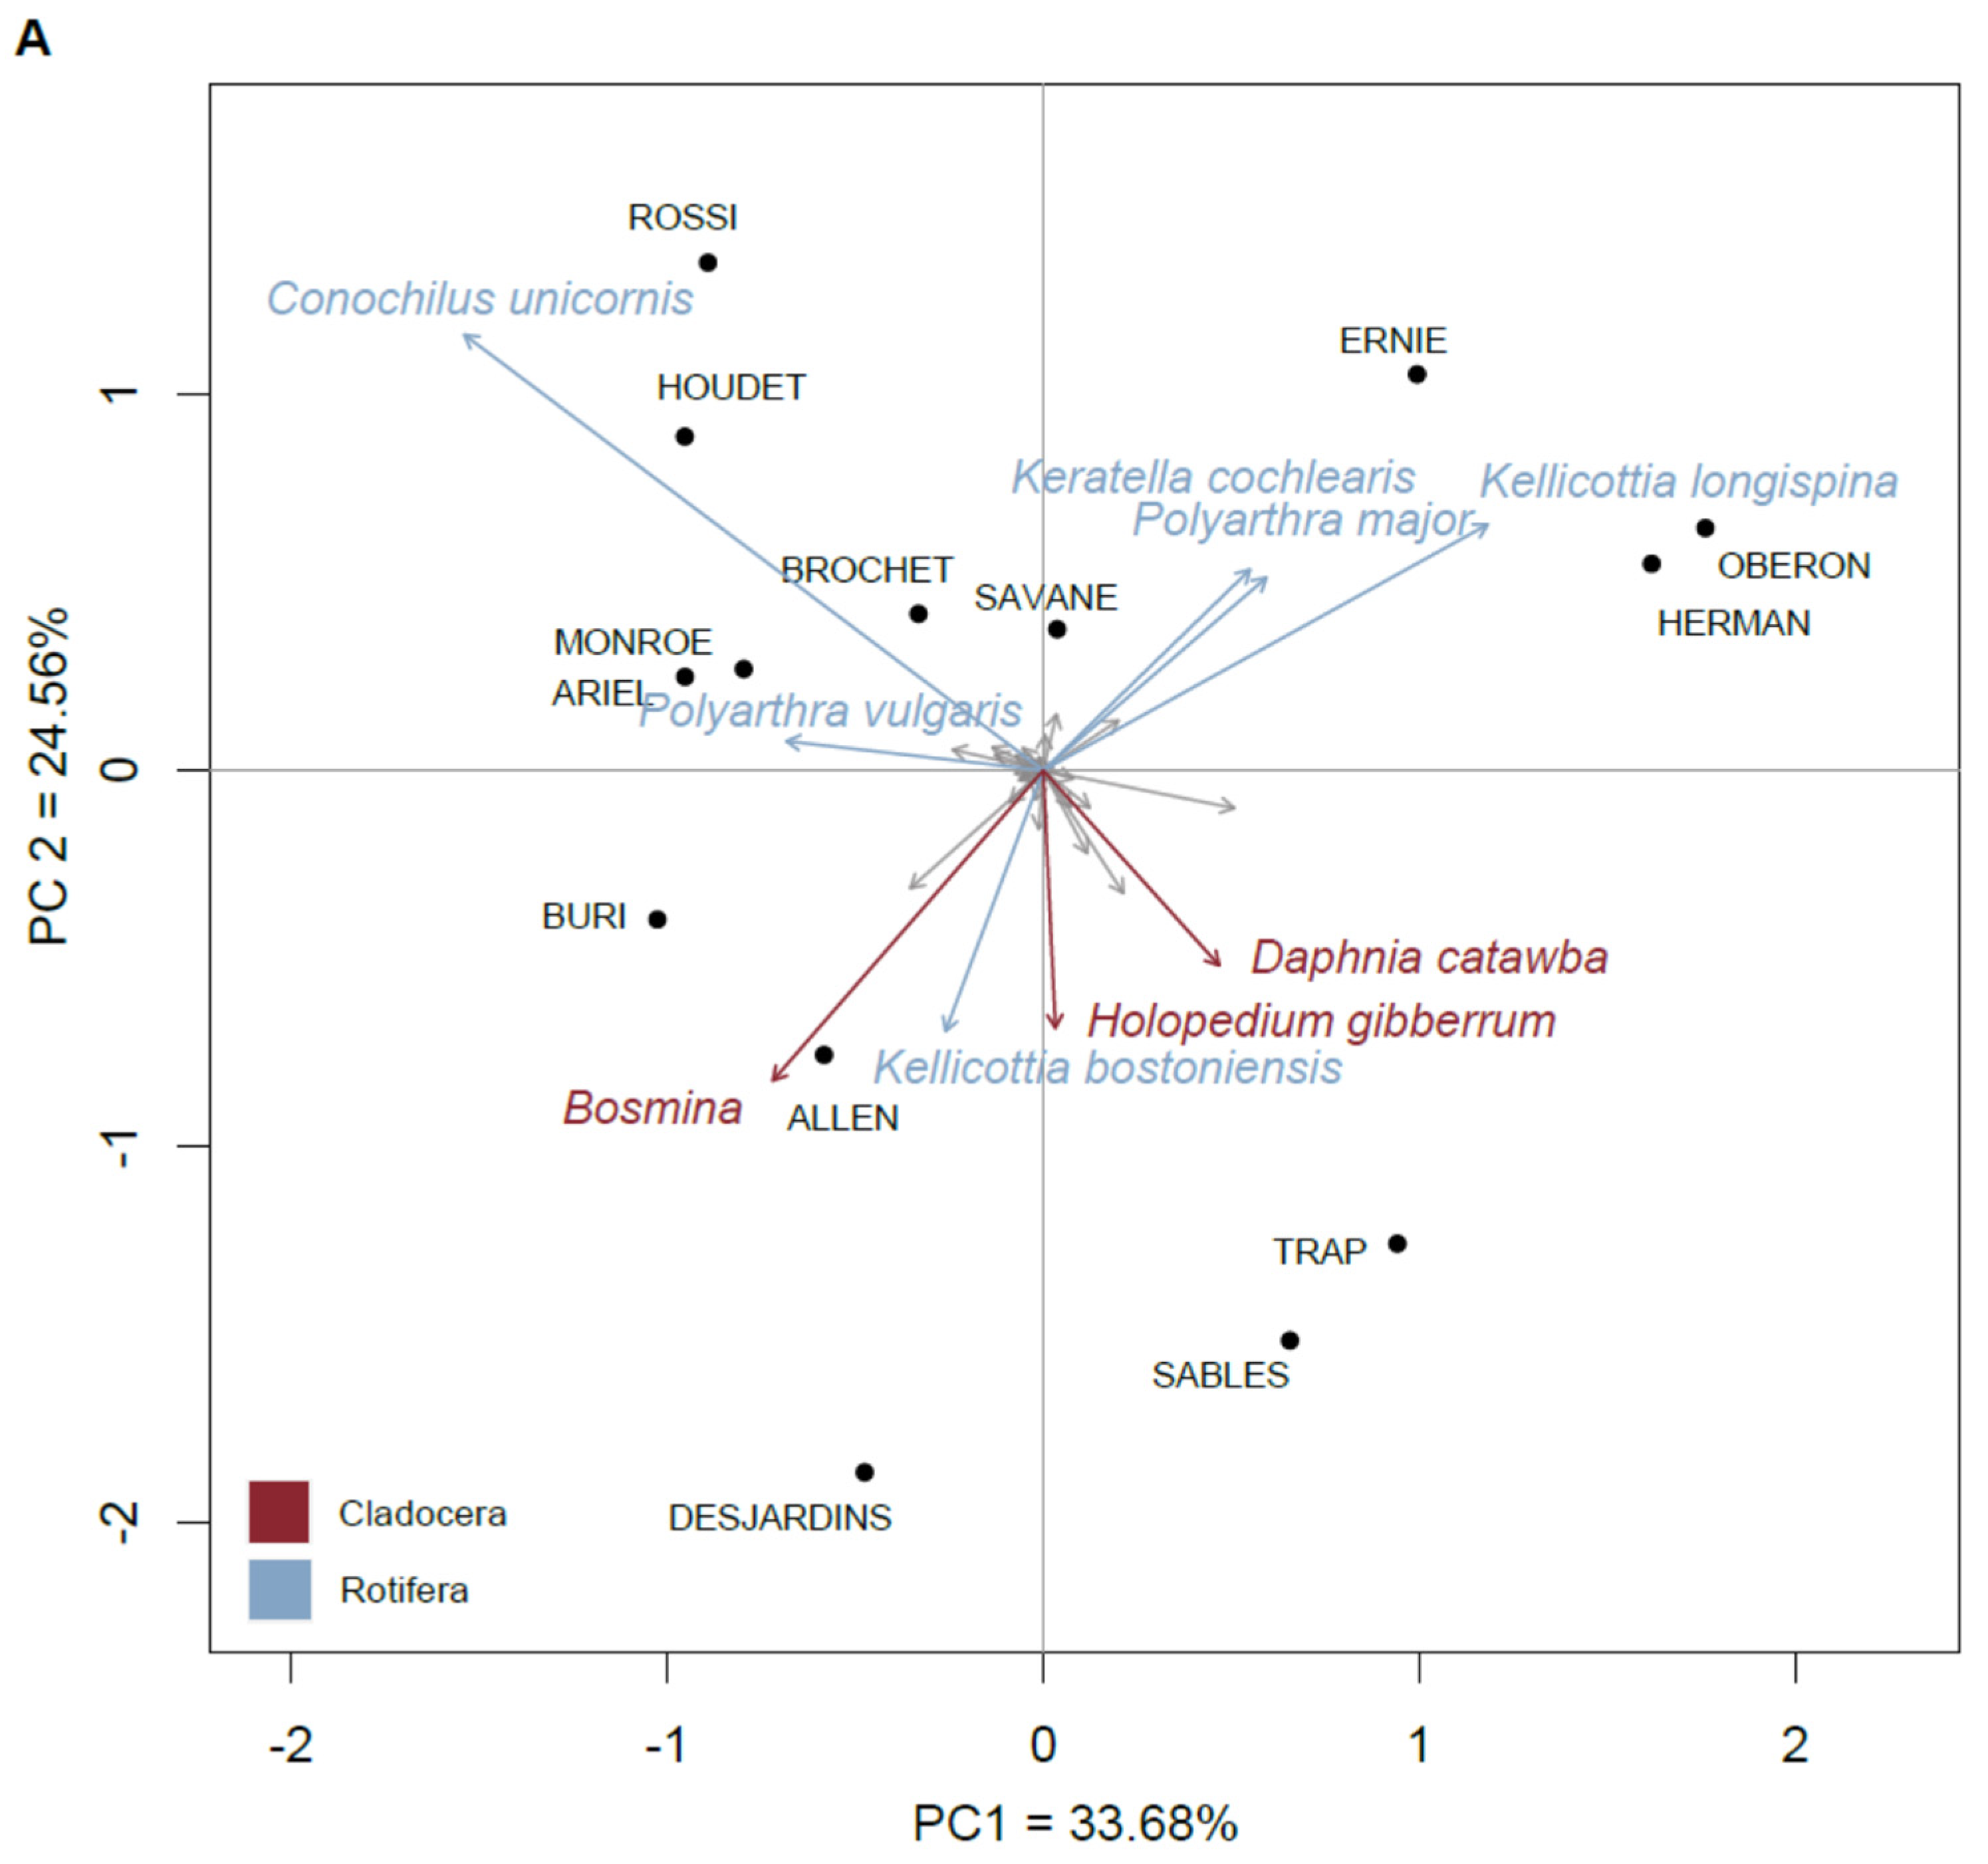
3.3. Species Contribution to Zooplankton Diversity and Abundance

We recorded a total of 40 species, including 22 rotifers, 10 cladocerans and 8 copepods (4 cyclopoids + 4 calanoids) in July 2009 (Table 2, for details see Table S6). In terms of occurrence, the most frequent species (found in at least 10 lakes) belonged to rotifers (Kellicottia longispina, Keratella taurocephala and K. cochlearis) and cladocerans (Bosmina, Holopedium gibberum cf glacialis and Daphnia catawba) (Figure S2). Ten species were found in at least half of the lakes and 13 species were found in two lakes or less. In terms of abundance, the dominant species were also rotifers (Kellicottia longispina and K. bostoniensis, Conochilus unicornis, Keratella taurocephala and K. cochlearis, Polyarthra vulgaris) and small (Bosmina) or large (Holopedium gibberum cf glacialis) cladocerans (Figure S2).
The contribution of species to β diversity (SCBD) varied from a minimum of 0.005% for the predatory cladoceran Leptodora kindtii to a maximum of 21% for the colonial rotifer Conochilus unicornis (Table 2). The 13 species that showed a higher-than-average contribution to species turnover (avg SCBD = 2.32%) were rotifers (Conochilus unicornis, Kellicottia longispina and K. bostoniensis, Keratella cochlearis and K. taurocephala, Pompholyx sulcata, Polyarthra major and P. vulgaris) and cladocerans (Bosmina, Daphnia catawba, Holopedium gibberum cf glacialis, Diaphanosoma birgei and D. brachyurum).

3.4. Site Contribution to Beta Diversity and the Species That Defined Lake Typologies

Inter-lake variation in species richness (α diversity) and species assemblages (β diversity) was important. At the local lake scale, zooplankton diversity (α) averaged 15 species per lake and varied between 8 and 21 species (Table 3). Lakes Houdet, Allen and Ariel showed the greatest diversity (≥19 species) and Lakes Oberon, Trap, Desjardins, Rossi and Herman showed the lowest diversity (≤12 species). Lakes Buri, Sables, Monroe, Savane, Brochet and Ernie showed intermediate diversity (14–17 species). Rotifers (8 species on average, 2–13 species) accounted for 50% of the local diversity while cladocerans (5 species on average, 2–9 species) and copepods (2 species on average, 0–4 species) were less important (37.5 and 12.5%, respectively). At the regional scale, β diversity (ratio of total γ diversity to the average α diversity) was equal to 2.67, which means that on average we found 37% of the species’ regional pool in each of the lakes (2.67/7.14, Table 3). The local contribution of lakes to β diversity (LCBD) averaged 7% and ranged from 3 to 4% in Lakes Savane, Ariel and Brochet to 10–12% in Lakes Trap and Desjardins (Table 3). Overall, when considering the contributions of taxonomic groups to β diversity (LCBD), rotifers had the highest contribution (71%) followed by cladocerans (26%) while copepods contributed very little (3%) (Table 3).
Zooplankton typology of the MTNP lakes discriminated keynote species (Figure 3). The first two PCA axes represented 58% of the total variation in zooplankton species assemblages in July 2009 (Figure 3A). On axis 1 (34%), we distinguished the lakes dominated by small rotifers Kellicottia longispina, Keratella cochlearis and Polyarthra major (Ernie, Oberon and Herman) from those dominated by the large colonial rotifer Conochilus unicornis (Rossi, Houdet). Axis 2 (24%) was driven by the dominance of the small cladoceran Bosmina, the rotifer Kellicottia bostoniensis (Allen, Buri and Desjardins) and the large cladocerans Holopedium gibberum cf glacialis and Daphnia catawba (Trap and Sables). On the basis of the crustaceans only (Figure 3B), we could distinguish lakes with different cladoceran species. On axis 1 (41%), lakes dominated by the small cladoceran Bosmina (Monroe and Allen) contrasted with those dominated by the large daphnid Daphnia catawba (Sables, Herman and Trap). On axis 2 (26%), we distinguished the lakes dominated by the small cladoceran Diaphanosoma birgei in the presence of the predatory calanoid Epischura lacustris (Oberon and Rossi) from those dominated by the large gelatinous cladoceran Holopedium gibberum cf glacialis (Brochet, Houdet).

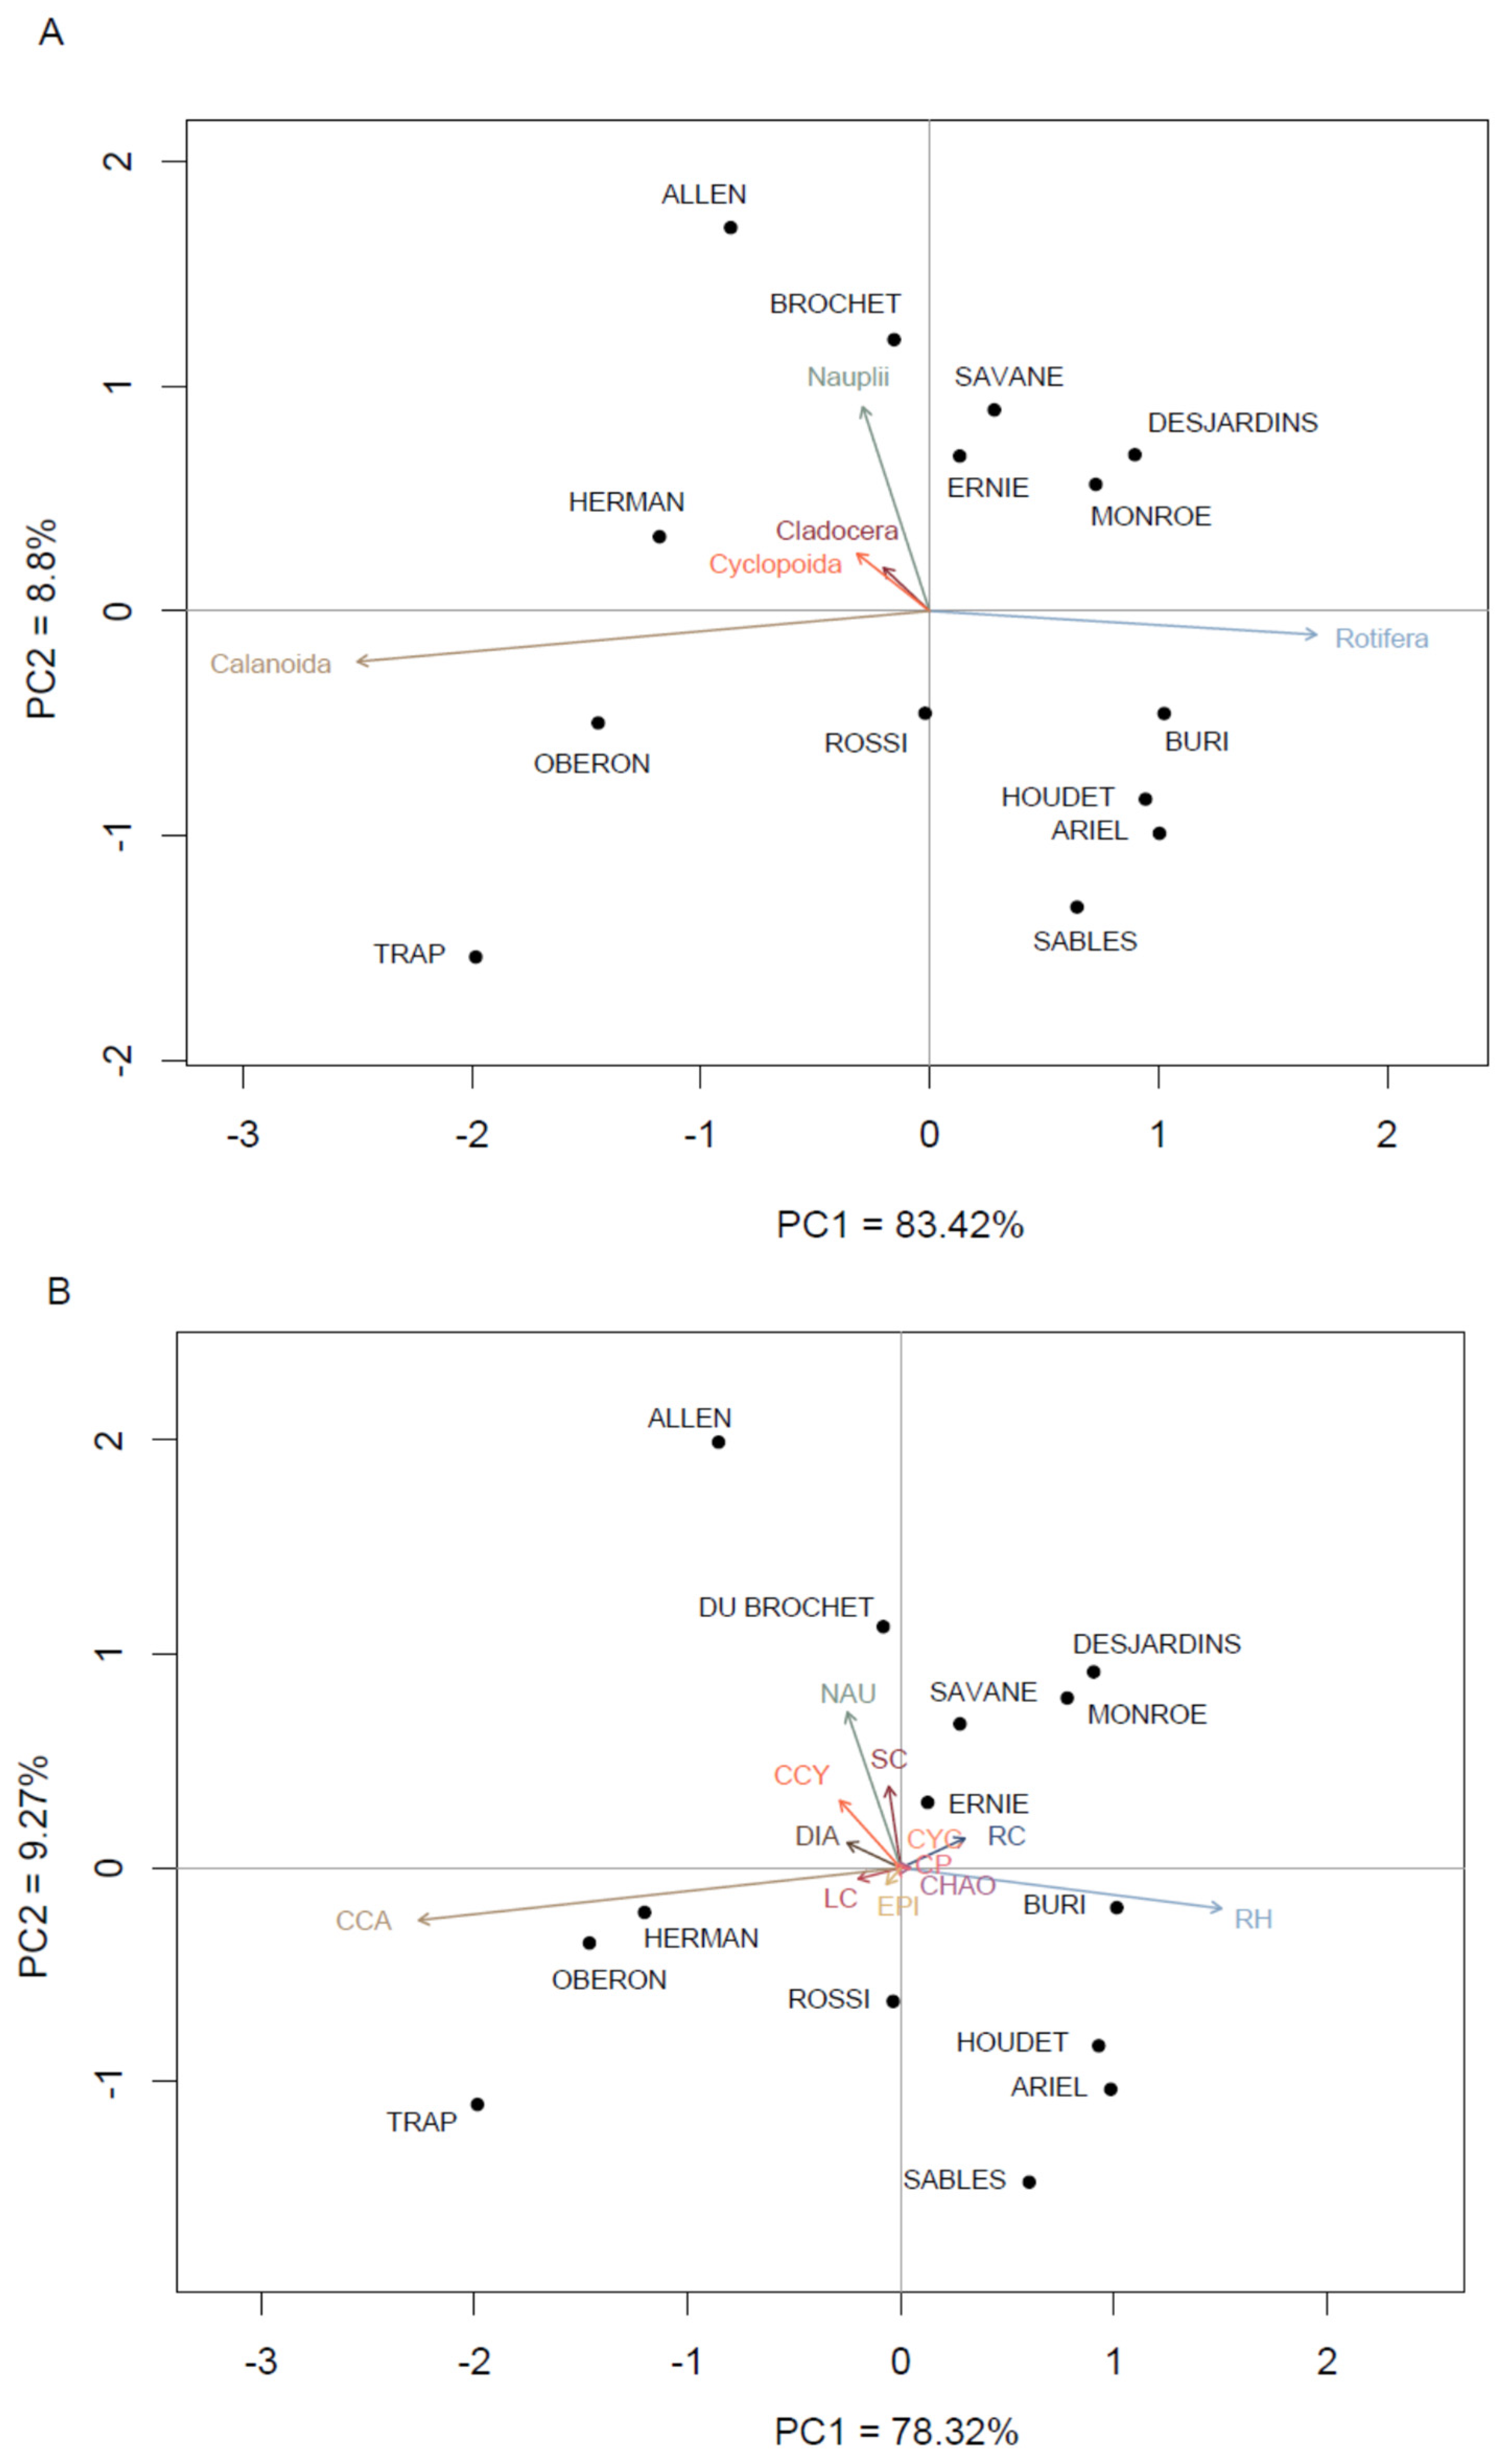
3.5. Changes in the Taxonomic and Functional Groups of Zooplankton through Space

Our analysis of the relative abundances (%) of 4 taxonomic and 12 functional groups averaged over the three sampling dates showed that MTNP lakes could be classified in order of the decreasing relative abundance of the dominant group of rotifers (i.e., herbivorous rotifers: RH) (Figure 4). The typology of zooplankton reflected an inverse gradient in the relative abundance of rotifers and calanoid copepods (Figure 4A). Herbivorous rotifers (RH) represented the dominant group (>50%) in a large majority of lakes (10/14 lakes) while four lakes were characterized by a dominance of calanoid copepods (CCA) and small (SC) and large (LC) cladocerans (Herman, Allen, Oberon and Trap) (Figure 4B).
The PCA analysis of the taxonomic groups of zooplankton reflected these dominance patterns (Figure 5A), with axis 1 (83%) representing the dominance of rotifers (right side of the ordination) vs. calanoid copepods (left). Axis 2 (9%) was less important but distinguished lakes that supported a higher abundance of nauplii, cladocerans and copepod cyclopoids (Allen, Brochet, Savane and Ernie). The PCA analysis based on the functional groups also reflected the dominance of herbivorous rotifers (RH) vs. calanoid copepods (CCA) (Figure 5B). Axis 1 (78%) corresponded to an increase in herbivorous rotifers (RH) (Ariel, Buri, Houdet and Sables) vs. a dominance of calanoid copepodites (CCA) (Trap, Oberon and Herman). Axis 2 (9%) was also associated with an increase in the abundances of nauplii (NA), small cladocerans (SC) and cyclopoids (CCY) in Lakes Allen, Brochet and Savane.

3.6. Zooplankton Biotic Indices

The range of variation in the biotic indices was important in particular for the abundance of rotifers (ARO) and crustaceans (ACR), mainly composed of calanoid copepods, for several key species of small Bosmina (ABo) or large cladocerans (Holopedium: AHo, Daphnia: ADa) and for the ratios between cladocerans and calanoid copepods (CL/CA) (Table 4, Table S7). The PCA analysis based on the zooplankton biotic indices captured 61% of the inter-lake variation on the first two axes (Figure 6). On axis 1 (38%), we distinguished two groups of lakes: (i) lakes with higher richness (RRO), abundance (ARO) and dominance (RO/CR) of rotifers (Houdet, Rossi, Ernie, Brochet, Savane on the left side) vs. (ii) lakes with higher abundance of crustaceans, mainly calanoids (ACR) (Herman, Trap, Oberon, on the right side). Axis 2 was associated with a higher dominance of cladocerans comparatively to copepods (CL/CA, CL/CO), especially small cladocerans such as Bosmina (ABo). It distinguished Lakes Monroe, Desjardins, Sables and Buri (higher Cladocera) from lakes Oberon, Herman and Brochet (Lower Cladocera).

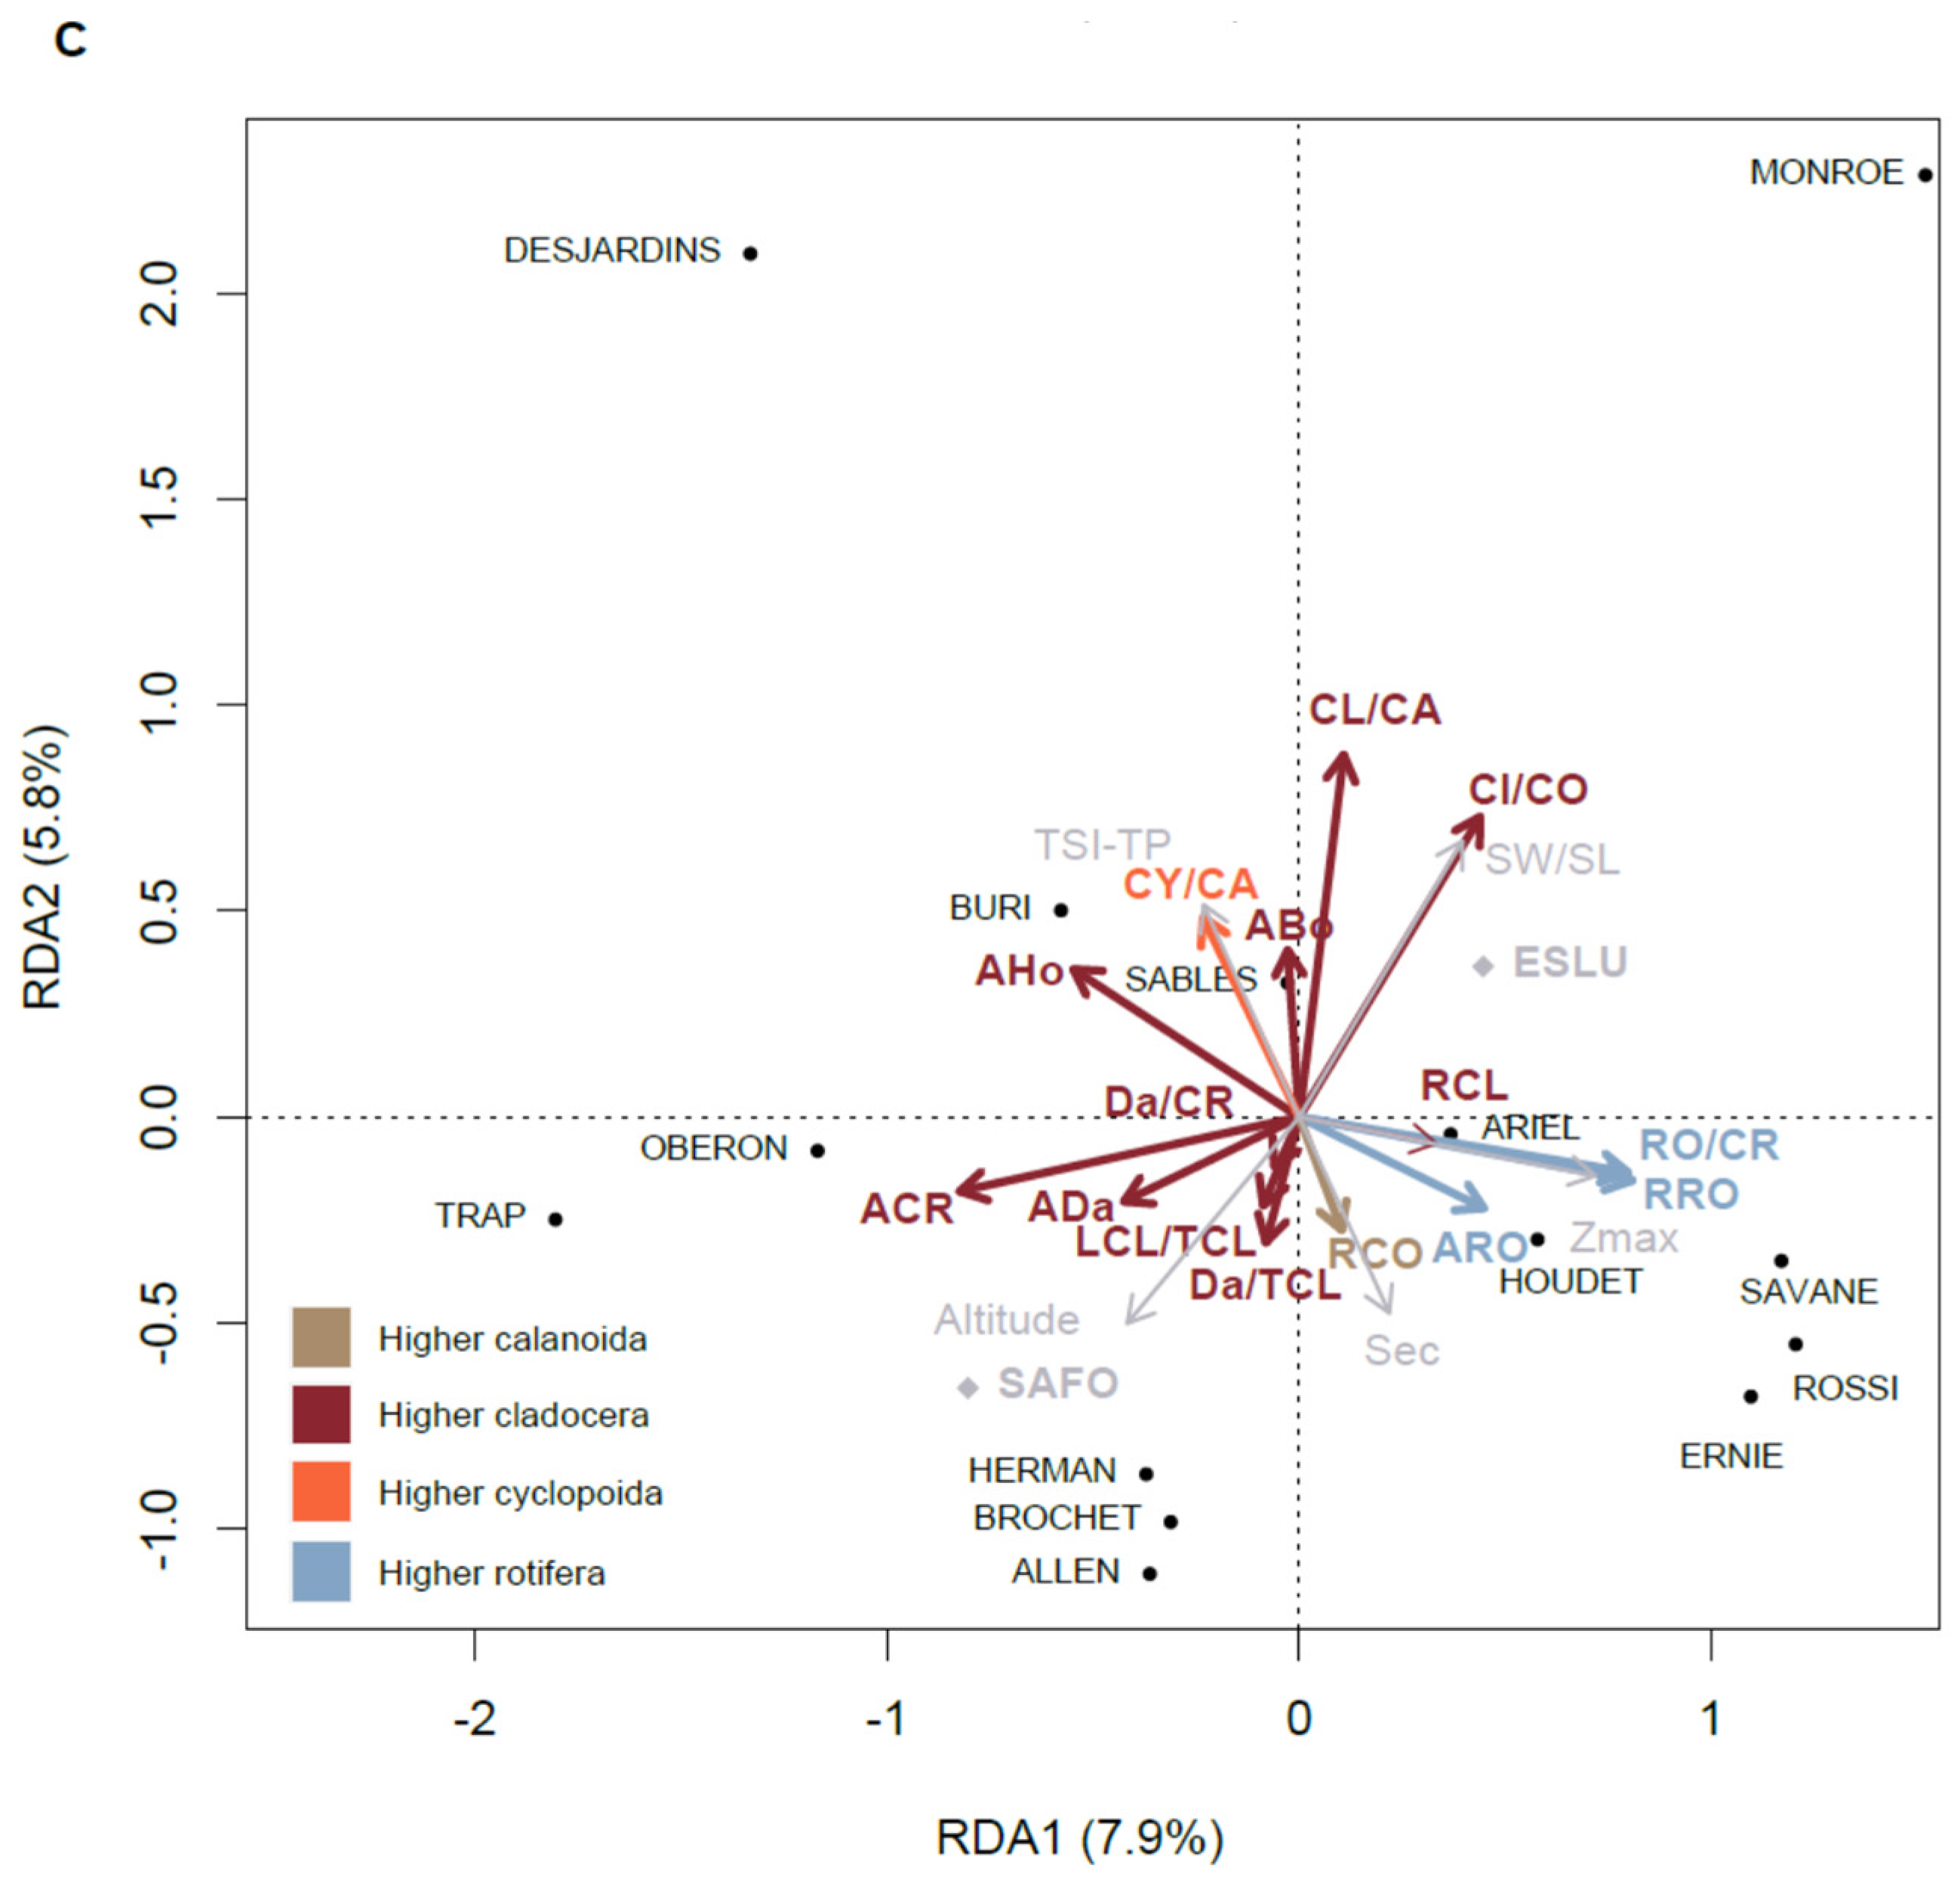
3.7. Relationships of the Zooplankton Community with Environmental Variables

To examine the relationships between the structure of zooplankton communities and the environmental gradients in the MTNP lakes, we used three types of attributes: the taxonomic groups, the functional groups and the biotic indices (Figure 7). The RDA highlighted two major environmental gradients: (i) a gradient in altitude which is associated with the contrast between lakes with two types of predatory fish (brook trout vs. northern pike); (ii) a gradient in nutrients (TP) and lake trophic status from oligotrophy to mesotrophy (TSI indices), associated with a decrease in lake depth (Zmax), water transparency (Sec) and water residence time (WRT) (Figure 7A).
Zooplankton dominance patterns were related to the elevation and trophic status gradients. The dominance of calanoid copepods (especially copepodite stages: CCA) in high elevation, oligotrophic lakes shifted towards the dominance of rotifers (especially herbivorous rotifers: RH) in mesotrophic lakes located at an altitude lower than 500 m (Figure 7B). This shift in the dominance patterns also reflected a change in predatory fish. Indeed, calanoid dominance was the most important in the five lakes located at higher altitude and was characterized by the presence of brook trout (SAFO) (Allen, Herman, Obéron, Trap and Brochet). In contrast, rotifer dominance was the most important in lakes located at lower altitude and characterized by the presence of northern pike (ESLU).
The depth and water transparency gradient distinguished two additional lake types: (i) deeper (Zmax > 20 m), stably stratified lakes with northern pike (ESLU) and Chaoborus (CHAO) that had a greater richness, abundance and dominance of rotifers (RC, RH) (Figure 7B) as indicated by the increase in the biotic indices of rotifers (RRO, ARO, RO/CR) (Figure 7C) vs. (ii) shallow (Zmax < 6 m), polymictic lakes (Trap, Oberon) that were richer in large cladocerans (LCL, ADa, AHo) and crustaceans (ACR, especially calanoid copepods), where we found the brook trout (SAFO). Some lakes (Sables and Buri) were characterized by a higher abundance of copepod cyclopoids (CY/CA), small (ABo) and gelatinous (AHo) cladocerans (Figure 7C).
To better highlight the links between the structure of zooplankton communities and lake trophic status, we ran linear regressions between the abundance of rotifers and calanoid copepods (log transformed) and the three trophic indices (TSI-Sd, TSI-TP and TSI-Chla) (Figure S3). The strongest responses were observed when TSI-Chla was used as the predictor variable: the abundance of rotifers increased significantly with TSI-Chla (R2 = 0.27; p = 0.05) whereas relationships were weaker and non-significant with TSI-TP and TSI-Sd (R2 = 0.22 and 0.17, respectively; p > 0.05) (Figure S3A). The abundance of calanoid copepods was not related to the TSI indices (R2 = 0.01–0.08; p > 0.05) (Figure S3B). To identify the relationships between biotic indices and the trophic state of lakes, we regressed zooplankton biotic indices as a function of the TSI-Chla (Figure S3C). Only three indices were positively related to the trophic state of the lakes: the cladocerans/copepods (CL/CO), cladocerans/calanoids (CL/CA) and cyclopoids/calanoids (CY/CA) ratios increased with TSI-Chla (R2: 0.26–0.39; p < 0.05).
Finally, we compared the mean values of the biotic indices among two lake types: those where brook trout occurred vs. those where northern pike occurred (Figure S4). Differences were noted for several indices: (i) the abundance of Daphnia (ADa) and crustaceans (ACR: especially calanoid copepods) was 2 to 3.5 times greater in the brook trout lakes (Figure S4A), while (ii) the cladocerans/copepods (CL/CO), cladocerans/calanoids (CL/CA), cyclopoids/calanoids (CY/CA) and rotifers/crustaceans (RO/CR) ratios were higher in the northern pike lakes (Figure S4B). Differences in species richness between brook trout and northern pike lakes were minor but still significant (Figure S4C), indicating slightly more species richness in rotifers and cladocerans in northern pike lakes.

4. Discussion

4.1. Environmental Typology

The MTNP lakes are a reference for the limnological conditions of natural, pristine lakes of oligo-mesotrophic status in the upper Laurentians of Quebec [32]. Their limnological characteristics are similar to those of the Québec lakes located on the Canadian Boreal Shield [13]. The trophic state index of the MTNP lakes is representative of good ecological integrity for the Laurentians and eastern Quebec lakes [33]. The environmental typology is comprised of a range of small to large lakes (SL: 3 ha to 3 km2), of variable depth (Zmax: 4–27 m) and transparency (Secchi: 3–8 m) and with low concentrations of dissolved organic carbon (DOC: 2–5 mg/L), nutrients (TP: 3–17 µg/L) and algae (Chla: 1–9 µg/L). Fish communities in MTNP lakes are typical of those in Canadian Shield lakes [64]. They represent a dual typology for the piscivorous fish with exclusive presence of northern pike or brook trout, in association with planktivorous cyprinid fish and the invertebrate predator Chaoborus.

4.2. Zooplankton Species Assemblages and Typology

Species richness and dominance patterns of zooplankton assemblages in the MTNP are typical of oligo-mesotrophic lakes of the Canadian Shield in the Boreal ecozone [13,21,22] and northern temperate lakes in Canada and the USA [65,66,67]. Rotifers represented more than half of the zooplankton abundance and richness, followed by cladocerans and copepods. It is difficult to compare our estimates in the MTNP lakes with other parks in Québec, due to lack of studies. However, a recent survey of meso-eutrophic lakes in Gatineau Park [68,69,70,71], located in the sedimentary plain of southern Québec, showed a higher relative abundance of rotifers and cyclopoid copepods than in the oligo-mesotrophic lakes of MTNP, located in mountain regions of Québec.
The dominant rotifers (Kellicottia longispina or Conochilus unicornis) are indicators of oligo-mesotrophic lakes with clear water [26,72] or of colored dystrophic lakes with acidic water [73]. Dominance patterns differed among MTNP lakes; some lakes were dominated by small cladocerans (Bosmina and Diaphanosoma birgei) while others by large cladocerans (Daphnia catawba and Holopedium gibberum cf glacialis). The small cladocerans (Bosmina and Diaphanosoma birgei) have been shown to withstand a wide range of pH and trophic conditions [12]. However, while Bosmina is typically the dominant cladoceran in acid lakes of Eastern Canada [13,16], Diaphanosoma birgei is more sensitive to acidity, generally absent in lakes of pH < 6 [15]. Large cladocerans (Daphnia catawba) are found in oligotrophic and poorly mineralized lakes because they are not sensitive to low calcium concentrations [10]. In contrast, Holopedium, which is covered with a gelatinous mantle and does not have a calcified shell, is characteristic of humic, acidic and calcium-poor lakes of the Canadian Shield where it can replace Daphnia [74].

4.3. Identification of Lakes and Species with the Greatest Spatial Turnover

Zooplankton diversity estimates of the Canadian Shield lakes based on snap-shot sampling, as is the case of the MTNP, are expected to be underestimated by at least 50% and should be seen as indices rather than absolute estimates [75]. Nevertheless, although our study is limited to the pelagic zone of a small number of lakes and to three sampling dates, the diversity (γ) of pelagic zooplankton across all 14 MTNP lakes was comparable to that reported in other oligo-mesotrophic Canadian lakes (e.g., 53 species identified in 54 natural lakes and 62 species in 38 natural or logging/forest impacted lakes in Québec [13,21]; 41 species in 30 subarctic and alpine lakes in the Northwest Territories and Yukon [65]). In contrast, the γ diversity of zooplankton in the MTNP lakes was lower than those reported in other parks, likely because our sampling was limited to the pelagic zone. In Gatineau Park, a park more anthropized than the MTNP, 52 to 86 species (across four lakes) were recorded when both the pelagic and littoral zones were sampled [68,69,70,71]. In large-scale surveys (>100 lakes), the richness of zooplankton in lakes in Canada’s national parks was found to be on the order of one hundred species [67,76]. In the Mount Rainer national park (WA, USA), 103 high-elevation lakes (900–2000 m) sampled several times supported 43 rotifers and 44 crustacean taxa [67].
At the local scale, each lake in the MTNP supported on average one third of the regional species pool, i.e., 15 species per lake, which is comparable to the species richness (SR = α diversity) of oligo-mesotrophic lakes of eastern Quebec (14–17 species per lake) [13,22]. Local diversity was lower, however, than that estimated from more intensive sampling of oligotrophic lakes in northern Ontario (27 species per lake; 10-year follow-up; [77]) and Québec (46 species per lake; monitoring of 38 lakes; [21]) and in Gatineau Park (27 species per lake; littoral and pelagic sampling; [68,69,70,71]). When considering only the crustaceans, mean species richness (7 species per lake) was comparable to the crustacean species richness reported at the continental scale in Canadian ecoprovinces (3–10 species per lake; [78]).
At the regional scale, diversity variation among MTNP lakes (β diversity: calculated as the ratio of the total γ diversity to the average α diversity) was equal to 2.67, indicating that on average 37% of the species regional pool was found in each lake. This value is comparable to what has been observed in other Canadian Shield lakes [75]. The contribution of lakes to β diversity was estimated using the LCBD, which reflects the degree of uniqueness of a lake in terms of zooplankton composition [57]. LCBD coefficients enabled us to distinguish lakes where one finds mainly common species (weak LCBDs) from lakes which shelter particular groups and species (strong LCBDs). For instance, the two lakes that showed the highest contributions to β diversity where Lake Trap (very rich in large calanoid and cyclopoid rarely found in other lakes, such as Aglaodiaptomus spatulocrenatus and Eucyclops speratus, respectively) and Lake Desjardins (characterized by high abundances of the rotifer Kellicottia bostoniensis, the cladoceran Holopedium gibberum cf glacialis and the cyclopoid copepod Mesocyclops edax, but completely lacking calanoid copepods).
We found an inverse relationship between α diversity (species richness per lake: RS) and the contribution of lakes to β diversity (LCBD) (RS = 14–0.47 LCBD; R2 = 0.50). The most species-rich lakes were inhabited mostly by common species (low LCBD: lakes Brochet, Savane, Allen and Houdet). Conversely, lakes that had a small number of less frequent or rare species contributed most to β diversity (high LCBD: Oberon, Trap, Desjardins and Herman). These lakes therefore represent unique conditions which give them a higher priority in terms of conservation and protection.
The most discriminating species in terms of occurrence, abundance and contribution to β diversity (SCBD) were those that differentiate zooplankton communities. Several lakes were distinguished on the basis of two rotifers (Kellicottia longispina or Conochilus unicornis) and of four cladocerans of different sizes: the small cladocerans Bosmina and Diaphanosoma birgei and the large cladocerans Daphnia catawba and Holopedium gibberum cf glacialis. The typology of zooplankton based on taxonomic and functional groups reflected the same patterns (dominance of rotifers (mostly herbivorous rotifers) vs. calanoid copepods (mostly herbivorous copepodite stages)). Our study thus makes it possible to distinguish three zooplankton-lake types: lakes that were very rich in rotifers (>100 ind./L; Buri, Desjardins, Ariel and Houdet), lakes rich in cladocerans (Buri and Desjardins) and lakes rich in calanoid copepods (Trap and Oberon).
Calanoid copepods and rotifers offer good potential as indicators of the trophic state of lakes and the level of ecological integrity [72]. The richness and abundance of rotifers increases very rapidly with the trophic enrichment of lakes [79,80,81] while calanoid copepods are more abundant in clear and oligotrophic lakes in boreal environments [7,21]. For crustaceans, our study indicates that the abundance of cyclopoid copepods and small cladocerans (Bosmina) increased in mesotrophic lakes, whereas calanoid copepods were more abundant in oligotrophic lakes. This suggests that brook trout lakes support a zooplankton community with indicator species (Calanoida and Daphnia) of oligotrophic lakes with low planktivory. In contrast, northern pike lakes support a zooplankton community, richer in small cladocerans and cyclopoids, which are indicators of mesotrophic lakes with greater presence of planktivorous fish (such as cyprinids).
Biotic indices likewise highlight the rotifer to calanoid copepod gradient, as well as the gradient of small (Bosmina) to large (Daphnia, Holopedium) cladocerans. Biotic indices that offered the best potential for monitoring the ecological integrity of the MTNP lakes were the abundance of rotifers (ARO) and crustaceans (ACR). ARO was associated with an increase in lake trophic status and a decline in the ecological integrity of the mesotrophic lakes, especially those at low elevations with large watersheds. ACR was typical of small lakes (Trap and Oberon) where brook trout occurred and in general, zooplankton communities of brook trout lakes were characterized by large cladocerans. For instance, we found the highest abundances of Daphnia (ADa) in Lakes Trap and Oberon and the highest ratios of large cladocerans/total cladocerans (LCL/TCL) or of Daphnia/total cladocerans (Da/TCL) in lakes Herman and Brochet, all of which were brook trout lakes. This can be explained by the diet of this intermediate piscivorous species which mainly selects predatory invertebrates (Leptodora and Chaoborus) and zoobenthos [82] and consequently decreases the predation pressure on large cladocerans [83]. This effect might be reflected by the absence of chaoborid larvae in lakes with brook trout. In most lakes of the national parks of the Rocky Mountains of Alberta and British Columbia, changes in zooplankton community assemblages were attributed to differences in fish stocking history and the introduction of salmonids [84].

4.4. Relationship of Zooplankton Communities with Environmental Typology

Analysis of the relationship of zooplankton communities with limnological gradients enabled us to explain the groups of lakes identified above: (1) oligotrophic lakes with brook trout (Salvelinus fontinalis) rich in calanoid copepods and large daphnids, represented mainly by Allen, Herman, Pike, Oberon, Trap; and (2) mesotrophic lakes with northern pike (Esox lucius), richer in nutrients and rotifers, mainly represented by Desjardins, Savane, Houdet, Monroe and Rossi. At one end of this trophic classification, we noted that the more oligotrophic lakes were located above 500 m of altitude (Allen, Herman and Trap) or were lakes with very small watersheds (Buri, Ernie, Brochet); in these lakes, the low drainage ratio may have limited the supply of nutrients and the proliferation of phytoplankton. These lakes had the lowest chlorophyll biomass (Chla < 1.5 μg/L). These conditions are favorable for calanoid copepods which are bioindicators of lakes with good ecological integrity [9,12,21]. In addition, the decline in the abundance of rotifers could also be partly attributed to brook trout whose diet targets mainly predatory invertebrates at the adult stage (Leptodora and Chaoborus), thus indirectly promoting the proliferation of large cladocerans [82]. At the other end were the mesotrophic lakes located at lower altitudes (in particular Desjardins, Houdet, Monroe, Savane and Oberon), with larger watersheds and drainage ratios, that received more nutrients and were richer in phytoplankton (Chla: 2–9 μg/L). These lakes were generally richer in rotifers, small cladocerans (Bosmina) or large gelatinous cladocerans (Holopedium). This type of community is mainly linked to the trophic enrichment because it is found in both types of lakes with brook trout and northern pike.

4.5. Conclusions and Implications for Lake Monitoring in National Parks

In conclusion, our study highlighted the important role of zooplankton as bioindicators of the ecological integrity of lake ecosystems in the MTNP lakes. Therefore, we support limnologists who advocate integrating zooplankton as key biological components in monitoring aquatic environments, both in Europe and North America [5,6,12,13,85]. Although our study has certain limitations due to the sampling restricted to the pelagic zone of only a few lakes at three sampling dates, we selected bioindicators based on zooplankton attributes to be included in monitoring program assessing the ecological integrity of lakes in national parks. Bioindicators based on zooplankton would be easier to apply because they do not require certificates for collection and do not present the same ethical problems as those related to fish communities.
In addition, we could suggest certain recommendations concerning the management and monitoring of MTNP lakes. As spatial variation in zooplankton communities was greater than temporal variation between the summer sampling dates, it would therefore be relevant to adopt a sampling strategy focused on spatial monitoring of several lakes than on a temporal monitoring of a few lakes. The MTNP lakes have an overall good ecological integrity and the potential to serve as reference environments (or conditions) for the Laurentian region and eastern Québec. Oligotrophic lakes of high ecological integrity were isolated headwater lakes with low levels of planktivory. They must therefore be considered as a priority in lake management plans and be protected from any introduction of higher fish piscivores or species such as the beaver that could adversely affect the survival of brook trout [86]. Lakes located at lower altitude, larger in size and oligo-mesotrophic and colonized by northern pike had a lower level of ecological integrity (rotifers and small cladocerans indicators of trophic enrichment). For these lakes, management plans should limit anthropogenic disturbances on their watersheds and their shores to protect them from accelerated eutrophication.
We hope that this study will provide new knowledge on the biodiversity and the taxonomic and functional structure of the zooplankton communities of the MTNP lakes in relation to their trophic state and their ecological integrity and that it will help managers to define the priorities of the monitoring programs and conservation of aquatic environments of the MTNP.

Supplementary Materials

The following supporting information can be downloaded at: https://www.mdpi.com/article/10.3390/w14040578/s1, Table S1: Morphological characteristics and water residence time of the MTNP study lakes (from Carignan 2010), Table S2: Water quality characteristics (mean 2009–2010 ± Sd) of the MTNP study lakes (from Carignan 2010), Table S3: Trophic index (TSI-Sd, TSI-Chla, TSI-TP) of the MTNP study lakes (2009–2010),Table S4: Occurrence (presence 1 /absence 0) of fish species and Chaoborus in the MTNP lakes. Fish data from Hugues Tennier, biologist (MTNP), Table S5: Results of the space-time interaction test (Test STI) based on zooplankton taxonomic composition, Table S6: Abundances of species, taxonomic and functional groups, and invertebrate predators (Chaoborus, Leptodora kindtii) in the 14 MTNP lakes in July 2009, Table S7: Zooplankton biotic indices based on the abundances and ratio of taxonomic groups and key species (Daphnia, Bosmina, Holopedium) in July 2009, Figure S1: Canonical analysis based on fish species and Chaoborus larvae found in the MTNP 14 studied lakes. CA1 = 27%; CA2 = 19%. Environmental variables were introduced passively. See Tables S1–S3 for environmental variables and Table S4 for fish species names, Figure S2: Zooplankton species ranks according to their occurrence (A), their mean abundance (B), and their contribution to β diversity (SCBD) (C), Figure S3: Regression models (log-transformed response data) describing the variation in the abundances of the Rotifera (A), Copepoda Calanoida (B), and zooplankton biotic indices (C) with the trophic status indices (TSI), Figure S4: Comparison of zooplankton biotic indices in the lakes with brook trout (SAFO) and the lakes with northern pike (ESLU).

Author Contributions

Conceptualisation: B.P.-A.; methodology: B.P.-A., Z.E.T., A.C. and A.B.; supervision: B.P.-A. and A.B.; validation: B.P.-A. and Z.E.T.; writing—M.Sc thesis: A.B.; writing article and editing: B.P.-A. and Z.E.T. All authors have read and agreed to the published version of the manuscript.

Funding

We acknowledge the financial support of the research funding agencies in Canada (NSERC, grant number RGPIN/04875-2015 to B.P.-A.) and of the GRIL (cooperation programs scholarship to A.C.).

Institutional Review Board Statement

Not applicable.

Informed Consent Statement

Not applicable.

Data Availability Statement

Not applicable.

Acknowledgments

This research program was conducted in collaboration between the laboratory of B. Pinel-Alloul at the “Université de Montréal” (UdeM) and the Laboratory of A. Bertolo at the Université du Québec à Trois Rivières (UQTR). We are thankful for the field support offered by Jennifer Boisvert, for the water quality data provided by the laboratory of Richard Carignan and for the assistance of Ginette Méthot, Yéléna Bika-Bika, Audrey Lafrenaye and El-Amine Mimouni for taxonomical and statistical analyses. We also thank the assistance of Henri Tennier, in charge of the conservation and education program at the MTNP, who provided the fish data and the map of the location of lakes.

Conflicts of Interest

The authors declare no conflict of interest.

References

  1. Héritier, S.; Moumaneix, C. Protection et gestion dans les parcs canadiens et états-uniens. Quelques enjeux actuels. Cahiers De Géographie Du Québec 2007, 51, 155–176. [Google Scholar] [CrossRef] [Green Version]
  2. Agence Parcs Canada—Ministère des Travaux Publics et Services Gouvernementaux. 2013. Chapitre 7—L’intégrité Ecologique Dans les Parcs Nationaux. Rapport du Commissaire à L’environnement et au Développement Durable. N° de Catalogue FA1-2/2013-1-7F-PDF, ISBN 978-0-660-21225-8, ISSN 1495-0790. Available online: www.oag-bvg.gc.ca (accessed on 1 October 2021).
  3. PSIE. Programme de Suivi de L’intégrité Ecologique. Rapport 2003–2012. Réseau Parcs Québec—SÉPAQ. 2014. Available online: www.parcsquebec.com/intégriteecologique (accessed on 1 October 2021).
  4. McQueen, D.J.; Post, J.R.; Mills, E.L. Trophic relationships in freshwater pelagic ecosystems. Can. J. Fish. Aquat. Sci. 1986, 43, 1571–1581. [Google Scholar] [CrossRef]
  5. Stemberger, R.S.; Larsen, D.P.; Kincaid, T.M. Sensitivity of zooplankton for regional lake monitoring. Can. J. Fish. Aquat. Sci. 2001, 58, 2222–2232. [Google Scholar] [CrossRef]
  6. Jeppesen, E.; Nõges, P.; Davidson, T.A.; Haberman, J.; Nõges, T.; Blank, K.; Lauridsen, T.; Søndergaard, M.; Sayer, C.; Laugaste, R.; et al. Zooplankton as indicators in lakes: A scientific-based plea for including zooplankton in the ecological quality assessment of lakes according to the European Water Framework Directive (WFD). Hydrobiologia 2011, 676, 279–297. [Google Scholar] [CrossRef]
  7. Hessen, D.O.; Faafeng, B.A.; Andersen, T. Replacement of herbivore zooplankton species along gradients of ecosystem productivity and fish predation pressure. Can. J. Fish. Aquat. Sci. 1995, 52, 433–742. [Google Scholar] [CrossRef]
  8. Jeppesen, E.; Jensen, J.P.; Søndergaard, M.; Lauridsen, T.; Landkildehus, F. Trophic structure, species richness biodiversity in Danish lakes: Changes along phosphorus gradient. Freshw. Biol. 2000, 45, 201–218. [Google Scholar] [CrossRef]
  9. Pinto-Coelho, R.; Pinel-Alloul, B.; Méthot, G.; Havens, K. Relationships of crustacean zooplankton with latitude and trophic gradients in lakes and reservoirs of temperate and tropical regions. Can. J. Fish. Aquat. Sci. 2005, 62, 348–361. [Google Scholar] [CrossRef] [Green Version]
  10. Haberman, J.; Laugaste, R.; Noges, T. The role of cladocerans reflecting the trophic status of two large and shallow Estonian lakes. Hydrobiologia 2007, 584, 157–166. [Google Scholar] [CrossRef]
  11. Ejsmont-Karabin, J. The usefulness of zooplankton as lake ecosystem indicators: Rotifer trophic state index Pol. J. Ecol. 2012, 60, 339–350. [Google Scholar]
  12. Ejsmont-Karabin, J.; Karabin, A. The suitability of zooplankton as lake ecosystem indicators: Crustacean trophic state index. Pol. J. Ecol. 2013, 61, 561–573. [Google Scholar]
  13. Pinel-Alloul, B.; Méthot, G.; Verreault, G.; Vigneault, Y. Zooplankton species associations in Quebec lakes: Variation with abiotic factors, including natural and anthropogenic acidification. Can. J. Fish. Aquat. Sci. 1990, 47, 110–121. [Google Scholar] [CrossRef]
  14. Locke, A. Factors influencing community structure along stress gradients: Zooplankton responses to acidification. Ecology 1992, 73, 903–909. [Google Scholar] [CrossRef]
  15. Havens, K.E.; Yan, N.D.; Keller, W. Lake acidification: Effects on crustacean zooplankton populations. Environ. Sci. Technol. 1993, 27, 1621–1624. [Google Scholar] [CrossRef]
  16. Yan, N.D.; Strus, R. Crustacean zooplankton communities of acidic, metal contaminated lakes near Sudbury, Ontario. Can. J. Fish. Aquat. Sci. 1980, 37, 2282–2293. [Google Scholar] [CrossRef]
  17. Yan, N.D.; KSomers, M.; Girard, R.E.; Paterson, A.M.; Keller, W.; Ramcharan, C.W.; Rusak, J.A.; Ingram, R.; Morgan, G.E.; Gunn, J.M. Long-term trends on zooplankton of Dorset, Ontario lakes: The probable interactive effects of change in pH, total phosphorus, dissolved organic carbon, and predators. Can. J. Fish. Aquat. Sci. 2008, 65, 862–877. [Google Scholar] [CrossRef]
  18. Wissel, B.; Boeing, W.J.; Ramcharan, C.W. Effects of water color on predation regimes and zooplankton assemblages in freshwater lakes. Limnol. Oceanogr. 2003, 48, 1965–1976. [Google Scholar] [CrossRef]
  19. Stemberger, R.S.; Miller, E.K. Cladoceran body length and Secchi disk transparency in northeastern U.S. lakes. Can. J. Fish. Aquat. Sci. 2003, 60, 1477–1486. [Google Scholar] [CrossRef]
  20. Patoine, A.; Pinel-Alloul, B.; Prepas, E.E.; Carignan, R. Do logging and forest fires influence zooplankton biomass in Canadian Shield lakes? Can. J. Fish. Aquat. Sci. 2000, 57 (Suppl. S2), 155–164. [Google Scholar] [CrossRef]
  21. Patoine, A.; Pinel-Alloul, B.; Prepas, E.E. Effects of catchment perturbations by logging and wildfires on zooplankton species richness and composition in Boreal Shield lakes. Freshw. Biol. 2002, 47, 1996–2014. [Google Scholar] [CrossRef]
  22. Winkler, G.; Leclerc, V.; Sirois, P.; Archambault, P.; Bérubé, P. Short-term impact of forest harvesting on water quality and zooplankton communities in oligotrophic lakes of the eastern Canadian Boreal Shield. Boreal Environ. Res. 2009, 14, 323–337. [Google Scholar]
  23. Gélinas, M.; Pinel-Alloul, B. Relating crustacean zooplankton community structure to residential development and land-cover disturbance near Canadian Shield lakes. Can. J. Fish. Aquat. Sci. 2008, 65, 2689–2702. [Google Scholar] [CrossRef]
  24. Pinel-Alloul, B.; Mimouni, E.A. Are cladoceran diversity and community structure linked to spatial heterogeneity in urban landscapes and pond environments? Hydrobiologia 2013, 715, 195–212. [Google Scholar] [CrossRef]
  25. Mimouni, E.A.; Pinel-Alloul, B.; Beisner, B. Assessing aquatic biodiversity of zooplankton communities in an urban landscape. Urban Ecosyst. 2015, 18, 1353–1372. [Google Scholar] [CrossRef]
  26. Haberman, J.; Haldna, M. Indices of zooplankton community as valuable tools in assessing the trophic state and water quality of eutrophic lakes: Long-term study of Lake Võrtsjärv. J. Limnol. 2014, 73, 263–273. [Google Scholar] [CrossRef] [Green Version]
  27. Anas, M.U.M.; Scott, K.A.; Wissel, B. Suitability of presence vs absence indicator species to characterize stress gradients: Lessons from zooplankton species of boreal lakes. Ecol. Ind. 2013, 30, 90–99. [Google Scholar] [CrossRef]
  28. Anas, M.U.M.; Scott, K.A.; Cooper, R.N.; Wissel, B. Zooplankton communities are good indicators of potential impacts of Athabasca oil sands operations on downwind boreal lakes. Can. J. Fish. Aquat. Sci. 2014, 71, 719–732. [Google Scholar] [CrossRef]
  29. Couture, S.; Hudon, C.; Gagnon, P.; Taranu, Z.; Pinel-Alloul, B.; Houle, D.; Aldamman, L.; Beauvais, C.; Lachapelle, M. Zooplankton communities in Precambrian Shield lakes (Québec, Canada): Responses to spatial and temporal gradients in water chemistry and climate. Can. J. Fish. Aquat. Sci. 2021, 78, 567–579. [Google Scholar] [CrossRef]
  30. Pinel-Alloul, B.; Patoine, A.; Marty, J. Multi-scale and multi-system perspectives of zooplankton structure and function in Canadian freshwaters. Can. J. Fish. Aquat. Sci. 2021, 78, 1543–1562. [Google Scholar] [CrossRef]
  31. Nogrady, T. Canadian rotifers II. Parc du Mont-Tremblant, Québec. Hydrobiologia 1980, 71, 35–46. [Google Scholar] [CrossRef]
  32. Carignan, R. Rapport d’activités au Parc National du Mont-Tremblant Durant la Saison 2009; Université de Montréal: Montréal, QC, Canada, 2010; 20p. [Google Scholar]
  33. Tremblay, R.; Pienitz, R. Caractéristiques limnologiques de 56 lacs du Québec méridional en lien avec l’état trophique. Rev. Des Sci. De L’eau 2015, 28, 139–162. [Google Scholar]
  34. Carlson, R.E. A trophic state index for lakes. Limnol. Oceanogr. 1977, 22, 361–369. [Google Scholar] [CrossRef] [Green Version]
  35. Sommer, U.; Gliwicz, Z.M.; Lampert, W.; Duncan, A. The PEG-model of seasonal succession of planktonic events in fresh waters. Arch. Hydrobiol. 1986, 106, 432–471. [Google Scholar]
  36. Sommer, U.; Adrian, R.; Domis, L.D.; Elser, J.L.; Gaedke, U.; Ibelings, B.; Lürling, E.J.M.; Molinero, J.C.; Mooij, W.M.; van Donk, E.; et al. Beyond the Plankton Ecology Group (PEG) model: Mechanisms driving plankton succession. Annu. Rev. Ecol. Evol. Syst. 2012, 43, 429–448. [Google Scholar] [CrossRef]
  37. Filion, J.M.; Chain, P.; Futter, M. Cantilevering vertical tow nets to reduce tow-line induced zooplankton avoidance. J. Plankton Res. 1993, 15, 581–587. [Google Scholar] [CrossRef] [Green Version]
  38. Ward, J. A description of new zooplankton counter. Quaterly J. Microsc. Sci. 1955, 96, 371–373. [Google Scholar] [CrossRef]
  39. Edmondson, W.T. Rotifera. In Freshwater Biology; Ward, H.B., Whipple, G.C., Eds.; John Wiley and Sons: New York, NY, USA, 1959; pp. 420–494. [Google Scholar]
  40. Stemberger, R.S. A Guide to Rotifers of the Laurentian Great Lakes; EPA-600/4-79-021; United States Environmental Protection Agency, Environmental Monitoring and Support Laboratory: Cincinnati, OH, USA, 1979. [Google Scholar]
  41. Chengalath, R.; Koste, W. Rotifera from northeastern Quebec, Newfoundland and Labrador, Canada. Hydrobiologia 1983, 104, 49–56. [Google Scholar] [CrossRef]
  42. Chengalath, R.; Koste, W. Rotifera from Northwestern Canada. Hydrobiologia 1987, 147, 49–56. [Google Scholar] [CrossRef]
  43. Nogrady, T.; Pourriot, R.; Segers, H. Guides to the Identification of the Microinvertebrates of the Continental Waters of the World. In 8. Rotifera Volume 3: Notommatidae and Scaridiidae; Nogrady, T., Dumont, H.J., Eds.; SPB Academic Publishing, BV: Amsterdam, The Netherlands, 1995. [Google Scholar]
  44. Brooks, J.L. The systematics of North American Daphnia. Mem. Conn. Acad. Arts Sci. 1957, 13, 1–180. [Google Scholar]
  45. Brooks, J.L. Cladocera. Freshwater Biology; Ward, H.B., Whipple, G.C., Eds.; John Wiley and Sons: New York, NY, USA, 1959; pp. 587–656. [Google Scholar]
  46. Brandlova, J.; Brandl, Z.; Fernando, C.H. The Cladocera of Ontario with remarks on some species and distribution. Can. J. Zool. 1972, 50, 1373–1403. [Google Scholar] [CrossRef]
  47. Chengalath, R. A faunistic and ecological survey of the littoral Cladocera of Canada. Can. J. Zool. 1982, 60, 2668–2682. [Google Scholar] [CrossRef]
  48. De Melo, R.; Hebert, P.D.N. A taxonomic reevaluation of North American Bosminidae. Can. J. Zool. 1994, 72, 1808–1825. [Google Scholar] [CrossRef]
  49. Hebert, P.D.N. The Daphnia of North America: An Illustrated Fauna; CD-ROM; University of Guelph: Guelph, ON, Canada, 1995. [Google Scholar]
  50. Smith, K.; Fernando, C.H. A Guide to Freshwater Calanoid and Cyclopoid Copepod Crustacea of Ontario; Department of Biology, University of Waterloo: Waterloo, ON, Canada, 1978. [Google Scholar]
  51. Dussart, B. Crustacés Copépodes de l’Ontario; Document Inédit Photocopié, Université de Waterloo: Waterloo, ON, Canada, 2000; p. 107. [Google Scholar]
  52. Hudson, P.L.; Lesko, L.T. Free-Living and Parasitic Copepods of the Laurentian Great Lakes: Keys and Details on Individual Species; Great Lakes Science Center Home Page: Ann Arbor, MI, USA, 2003. Available online: http://www.glsc.usgs.gov/greatlakescopepods/ (accessed on 5 December 2021).
  53. Haney, J.F.; Aliberti, M.A.; Allan, E.; Allard, S.; Bauer, D.J.; Beagen, W.; Bradt, S.R.; Carlson, B.; Carlson, S.C.; Doan, U.M.; et al. An Image-Based Key to the Zooplankton of the Northeast, USA Version 4.0 Released 2010; University of New Hampshire Center for Freshwater Biology: Durham, NH, USA, 2010; Available online: http://cfb.unh.edu/cfbkey/html/ (accessed on 5 December 2021).
  54. Saether, O.A. Chaoboridae. In Das Zooplankton der Binnengewasser; Binnengewasser, I., Ed.; Schweizerbart’sche: Stuttgart, Germany, 1972; Volume 26, pp. 257–280. [Google Scholar]
  55. Gaston, K.J.; Spicer, J.I. Biodiversity: An Introduction, 2nd ed.; Blackwell Publishing: Oxford, UK, 2004. [Google Scholar]
  56. Soininen, J.; Lennon, J.J.; Hillerand, H. A multivariate analysis of beta diversity across organisms and environments. Ecology 2007, 88, 2830–2838. [Google Scholar] [CrossRef] [PubMed]
  57. Legendre, P.; de Càceres, M. Beta diversity as the variance of community data: Dissimilarity coefficients and partitioning. Ecol. Lett. 2013, 16, 951–953. [Google Scholar] [CrossRef] [PubMed]
  58. Legendre, P.; Gallagher, E.D. Ecologically meaningful transformations for ordination of species data. Oecologia 2001, 129, 271–280. [Google Scholar] [CrossRef]
  59. Borcard, D.; Gillet, F.; Legendre, P. Numerical Ecology with R; Springer: New York, NY, USA, 2011. [Google Scholar]
  60. Legendre, P.; Cáceres, M.D.; Borcard, D. Community surveys through space and time: Testing the space-time interaction in the absence of replication. Ecology 2010, 91, 262–272. [Google Scholar] [CrossRef]
  61. Blanchet, F.G.; Legendre, P.; Borcard, D. Forward selection of explanatory variables. Ecology 2008, 89, 2623–2632. [Google Scholar] [CrossRef]
  62. R Development Core Team. R: A Language and Environment for Statistical Computing; R Foundation for Statistical Computing: Vienna, Austria, 2012; ISBN 3-900051-07-0. [Google Scholar]
  63. Legendre, P.; Legendre, L. Numerical Ecology; Elsevier Science Ltd.: Amsterdam, The Netherlands, 2012. [Google Scholar]
  64. Bertolo, A.; Magnan, P. Spatial and environmental correlates of fish community structure in Canadian Shield lakes. Can. J. Fish. Aquat. Sci. 2006, 63, 2780–2792. [Google Scholar] [CrossRef]
  65. Swadling, K.M.; Pienitz, R.; Nogrady, T. Zooplankton community composition of lakes in the Yukon and Northwest Territories (Canada): Relationship to physical and chemical limnology. Hydrobiologia 2000, 431, 211–224. [Google Scholar] [CrossRef]
  66. Rusak, J.A.; Yan, N.D.; Sommers, K.M.; Cottingham, K.L.; Micheli, F.; Carpenter, S.R.; Frost, T.M.; Paterson, M.J.; McQueen, D.J. Temporal, spatial, and taxonomic patterns of crustacean zooplankton variability in unmanipulated north-temperate lakes. Limnol. Oceanogr. 2002, 47, 613–625. [Google Scholar] [CrossRef] [Green Version]
  67. Larson, G.L.; Hoffman, R.; McIntire, C.D.; Lienkaemper, G.; Samora, B. Zooplankton assemblages in montane lakes and ponds of Mount Rainier National parks, Washington State, USA. J. Plankton Res. 2009, 31, 273–285. [Google Scholar] [CrossRef]
  68. Méthot, G.; Pinel-Alloul, B. Composition taxonomique du zooplancton des stations pélagiques et littorales du lac La Pêche dans le Parc de la Gatineau. In Rapport Présenté à la Commission de la Capitale Nationale; Ottawa, ON, Canada, 2008; 13p, Available online: https://papyrus.bib.umontreal.ca/xmlui/bitstream/handle/1866/19129/Chemli_Abir_2017_memoire.pdf?sequence=2&isAllowed=y (accessed on 20 December 2021).
  69. Méthot, G.; Pinel-Alloul, B. Composition taxonomique du zooplancton des stations pélagiques et littorales du lac Philippe dans le Parc de la Gatineau. In Rapport Présenté à la Commission de la Capitale Nationale; Ottawa, ON, Canada, 2009; 28p, Available online: https://papyrus.bib.umontreal.ca/xmlui/bitstream/handle/1866/19129/Chemli_Abir_2017_memoire.pdf?sequence=2 (accessed on 20 December 2021).
  70. Méthot, G.; Pinel-Alloul, B. Composition taxonomique du zooplancton des stations pélagiques et littorales du lac Meech situé dans le Parc de la Gatineau. In Rapport Présenté à la Commission de la Capitale Nationale; Ottawa, ON, Canada, 2010; p. 40. Available online: https://ccn-ncc.gc.ca/endroits/conservation-au-parc-de-la-gatineau (accessed on 20 December 2021).
  71. Méthot, G.; Pinel-Alloul, B. Composition taxonomique du zooplancton des stations pélagiques et littorales du lac Pink situé dans le Parc de la Gatineau. In Rapport Présenté à la Commission de la Capitale Nationale; Ottawa, ON, Canada, 2012; p. 42. Available online: https://oraprdnt.uqtr.uquebec.ca/pls/public/docs/GSC543/F_2146344899_RA_10_14_GRIL_protege_interactif_144ppi.pdf (accessed on 20 December 2021).
  72. Gannon, J.E.; Stemberger, R.S. Zooplankton (especially crustaceans and rotifers) as indicators of water quality. Trans. Am. Microsc. Soc. 1978, 97, 16–35. [Google Scholar] [CrossRef]
  73. Pejler, B. Taxonomical and ecological studies on planktonic Rotatoria from Central Sweden. K. Sven. Vetensk. Akad. Handl. 1957, 6, 52. [Google Scholar]
  74. Jeziorski, A.; Tanentzap, A.J.; Yan, N.D.; Paterson, A.M.; Palmer, M.E.; Korosi, J.B.; Rusak, J.A.; Arts, M.T.; Keller, W.; Ingram, R.; et al. The jellification of north temperate lakes. Proc. Biol. Sci. 2015, 282, 2014–2449. [Google Scholar] [CrossRef] [PubMed]
  75. Arnott, S.E.; Magnuson, J.J.; Yan, N.D. Crustacean zooplankton species richness: Single and multiple-years estimates. Can. J. Fish. Aquat. Sci. 1998, 55, 1573–1582. [Google Scholar] [CrossRef]
  76. Anderson, S. Crustacean plankton communities of 340 lakes and ponds in and near the National Parks of the Canadian Rocky Mountains. J. Fish. Res. Board Can. 1974, 31, 855–869. [Google Scholar] [CrossRef]
  77. Lévesque, D.; Pinel-Alloul, B.; Méthot, G.; Steedman, R. Effects of climate, limnological features and watershed clearcut logging on long-term variation in zooplankton communities of Boreal Shield lakes. Water 2017, 9, 733. [Google Scholar] [CrossRef] [Green Version]
  78. Pinel-Alloul, B.; André, A.; Legendre, P.; Cardille, J.; Patalas, K.; Salki, A. Large-scale geographic patterns of diversity and community structure of pelagic crustacean zooplankton in Canadian lakes. Glob. Ecol. Biogeogr. 2013, 22, 784–795. [Google Scholar] [CrossRef]
  79. Walz, N.; Elster, H.-J.; Mezger, M. The development of the rotifer community structure in Lake Constance during its eutrophication. Arch. Hydrobiol. 1987, 74, 452–487. [Google Scholar]
  80. Berzins, B.; Pejler, B. Rotifer occurrence and trophic degree. Hydrobiologia 1989, 182, 171–180. [Google Scholar] [CrossRef]
  81. May, L.; O’Hare, M. Changes in rotifer species composition and abundance along a trophic gradient in Loch Lomond, Scotland, UK. Hydrobiologia 2005, 546, 397–404. [Google Scholar] [CrossRef]
  82. Drouin, A.; Sirois, P.; Archambault, P. Discriminating zooplankton communities in lakes with brook trout (Salvelinus fontinalis) and in fishless lakes. Ecoscience 2008, 16, 271–281. [Google Scholar] [CrossRef]
  83. Bertolo, A.; Carignan, R.; Magnan, P.; Pinel-Alloul, B.; Planas, D.; Garcia, E. Decoupling of pelagic and littoral food webs in oligotrophic Canadian Shield lakes. Oikos 2005, 111, 534–546. [Google Scholar] [CrossRef]
  84. Donald, D.B.; Vinebrooke, R.D.; Anderson, R.S.; Syrgiannis, J.; Graham, M.D. Recovery of zooplankton assemblages in mountain lakes from the effects of introduced sport fish. Can. J. Fish. Aquat. Sci. 2001, 58, 1822–1830. [Google Scholar] [CrossRef]
  85. Muñoz-Colmenares, M.E.; Sendra, M.D.; Sòria-Perpinya, X.; Vicente, J.M.S. The use of zooplankton metrics to determine the trophic status and ecological potential: An approach in a large Mediterranean watershed. Water 2021, 13, 2382. [Google Scholar] [CrossRef]
  86. Bertolo, A.; Magnan, P.; Plante, M. Linking the occurrence of brook trout with isolation and extinction in small Boreal Shield lakes. Freshw. Biol. 2008, 53, 304–321. [Google Scholar] [CrossRef]
Figure 1. The Mont-Tremblant National Park and the location of the study lakes.
Water 14 00578 g001
Figure 2. Principal component analysis (PCA) based on the limnological variables (morphometry, hydrology, water quality, trophic indices and fish typology). Groups were identified by ellipses in the PCA biplot.
Water 14 00578 g002
Figure 3. Principal component analyses based on all zooplankton species (A) and on crustacean species (B). July 2009.
Water 14 00578 g003aWater 14 00578 g003b
Figure 4. The community structure of zooplankton in the 14 lakes of the PNMT based on relative abundance of taxonomic (A) and functional (B) groups. Lakes are ranked according to relative abundances of total rotifers (A) or herbivorous rotifers (B).
Water 14 00578 g004
Figure 5. Principal component analysis of the zooplankton community structure based on the relative abundance of taxonomic (A) and functional (B) groups in each lake (averaged for the three sampling periods). Zooplankton functional groups: RH (Herbivorous Rotifers), RC (Carnivorous Rotifers), SC (Small Cladocerans), LC (Large Cladocerans), NA (Nauplii), CCA (Calanoid Copepodites), CCY (Cyclopoid Copepodites), DIA (Herbivorous Calanoids), CYC (Omnivorous Cyclopoids), CP (Predatory Cladocerans), EPI (Carnivorous Calanoids).
Water 14 00578 g005
Figure 6. Principal component analysis (PCA) based on zooplankton biotic indices of the 14 lakes of the PNMT. Code of biotic indices: RRo (Richness Rotifera); RO/CR (Rotifera/Crustacea); LCL/TCL (Large Cladocera/Total Cladocera); Da/TCL (Daphnia/Total Cladocera); CL/CO (Cladocera/Copepoda); Da/CR (Daphnia/Crustacea); ABo (Abundance Bosmina); ADa (Abundance Daphnia); AHo (Abundance Holopedium); CL/CA (Cladocera/Calanoida); ACR (Abundance Crustacea); CY/CA (Cyclopoida/Calanoida); RO/CR (Rotifera/Crustacea); ARO (Abundance Rotifera); RCL (Richness Cladocera); RCO (Richness Copepoda).
Water 14 00578 g006
Figure 7. Redundancy analysis (RDA) regressing the zooplankton taxonomic groups (A), functional groups (B) and biotic indices (C) as a function of the environmental variables (stepwise selection). For each canonical axis, the proportion of explained variance, as opposed to the proportion of total variance, is shown (i.e., by multiplying the accumulated constrained eigenvalues of each axis by the model’s adjusted R2).
Water 14 00578 g007aWater 14 00578 g007b
Table 1. Mean (±standard error), minimum and maximum values of limnological variables (morphometry, water quality, water retention time) and TSI trophic indices of MTNP lakes.
Limnological VariablesMean ± s.d.MinimumMaximum
Lake morphometry
ALT (Altitude m)457 ± 52344533
SL (Lake Area km2)0.77 ± 0.950.033.35
SW (Watershed Area km2)41.9 ± 113.10.82432
SW/SL (Watershed area/Lake area)42.4 ± 87.97.4346.2
Zmax (Maximum depth m)14.7 ± 8.8427
Zm (Mean depth m)5.0 ± 2.91.611.3
VL (Lake volume km3)5.13 ± 7.070.0623.42
Hydrology
WRT (Water residence time yr)0.64 ± 0.700.032.68
Water quality *
TP (Total phosphorus μg/L)7.5 ± 3.42.716.6
TN (Total nitrogen μg/L)224.6 ± 63.3138.3389
DOC (Dissolved organic carbon mg/L)3.6 ± 0.82.44.8
Chla (Chlorophyll-a μg/L)2.6 ± 2.10.89.4
Cond (Conductivity μS/cm)17.2 ± 2.913.221.4
Sec (Secchi transparency m)4.5 ± 1.52.98.3
Kpar (Light attenuation m−1)0.73 ± 0.250.331.09
Trophic state indices (TSI)
TSI-Sd39.2 ± 4.829.046.6
TSI-Chla37.3 ± 5.727.447.7
TSI-TP32.6 ± 6.918.646.8
* mean (2009–2010) Reprinted with permission from Carignan, 2010 [32].
Table 2. Taxonomic groups, species and functional groups of the zooplankton communities. SCBD represent species contributions to β diversity (score values and percentage contribution).
Taxonomic GroupsSpeciesFunctional GroupsSCBDSCBD (%)
ROTIFERA
AsplanchnidaeAsplanchna herrickiRC0.0150.228
Asplanchna brightwelliRC0.0130.200
Asplanchna priodontaRC0.0400.627
BrachionidaeKellicottia longispinaRH0.78612.103
Kellicottia bostoniensisRH0.4837.434
Keratella taurocephalaRH0.2984.593
Keratella cochlearisRH0.3755.774
Keratella hiemalisRH0.0190.289
ConochilidaeConochilus unicornisRH1.35520.862
Conochiloides sp.RH0.0060.091
GastropidaeGastropus styliferRH0.0070.105
Ascomorpha saltansRH0.0290.444
Ascomorpha ecaudisRH0.0110.167
SynchaetidaePolyarthra vulgarisRH0.2784.282
Polyarthra majorRH0.3685.662
Ploesoma hudsoniRH0.0050.072
Synchaeta sp.RC0.0230.351
TrichocercidaeTrichocerca mucosaRH0.0530.821
Trichocerca elongataRH0.0330.515
Trichocerca cylindricaRH0.0250.387
Trichocerca multicrenisRH0.0070.110
TestudinellidePompholyx sulcataRH0.3685.664
Undertermined RotiferaRH0.0050.079
CLADOCERA
BosminidaeBosmina sp.SC0.5568.552
DaphiniidaeCeriodaphnia quadrangulaSC0.0140.212
Ceriodaphnia affinisSC0.0050.071
Ceriodaphnia sp.SC0.0080.118
Daphnia catawbaLC0.3715.713
Daphnia ambiguaLC0.0630.971
Daphnia longiremisLC0.0370.575
Daphnia sp.LC0.0030.049
HolopediidaeHolopedium gibberum (glacialis)LC0.2273.491
LeptodoridaeLeptodora kindtiiPC0.0010.005
SididaeDiaphanosoma birgeiSC0.2133.281
Diaphanosoma brachyurumSC0.1932.975
COPEPODA CYCLOPOIDA
CyclopidaeEucyclops speratusCCY—CYC0.0250.383
Orthocyclops modestusCCY—CYC0.0030.042
Cyclops scutiferCCY—CYC0.0210.319
Mesocyclops edaxCCY—CYC0.0340.522
COPEPODA CALANOIDA
DiaptomidaeLeptodiaptomus minutusCCA—DIA0.0350.543
Leptodiaptomus siciloidesCCA—DIA0.0030.053
TemoridaeAglaodiaptomus spatulocrenatusCCA—DIA0.0490.757
Epischura lacustrisCCA—EPI0.0330.507
Holopedium gibberum cf glacialis: Rowe, C.L., S.J. Adamowicz and P.D. Hebert. 2007. Three new cryptic species of the freshwater zooplankton genus Holopedium (Crustacea: Branchiopoda: Ctenopoda), revealed by genetic methods. Zootaxa: 1–50. 1656: 1–50.) RH (Rotifera Herbivore), RC (Rotifera Carnivore), SC (Small Cladocera), LC (Large Cladocera), NA (Nauplii), CCA (Copepodite Calanoida), CCY (Copepodite Cyclopoida), CCA-DIA (Calanoïda Herbivore), CCY-CYC (Cyclopoida Omnivore), PC (Cladocera Predator), CCA-EPI (Calanoida Carnivore), SCBD (Species contribution to β diversity: value and percentage).
Table 3. Species richness (α diversity) and local contributions of lakes and taxonomic groups to β diversity (LCBD).
LakesSpecies Richness (α)Contribution to β Diversity (LCBD)
Rot.Clad.Cop.Zoo.Rot.Clad.Cop.Zoo.
Allen1352203.701.920.105.73
Oberon52187.192.700.089.97
Ernie1331176.961.170.058.18
Herman660127.201.440.068.70
Rossi731116.171.400.087.65
Savane862163.360.320.243.92
Trap253103.315.760.9910.06
Ariel1054193.420.510.104.03
Buri851143.831.600.165.60
Brochet1042162.300.580.383.26
Houdet1092214.341.260.115.71
Desjardins551119.632.200.0911.93
Monroe1140156.391.340.067.79
Sables473143.063.790.627.47
%5037.512.510070.8626.013.13100.00
Mean852155.061.860.227.14
Table 4. Mean (± Sd), minimum and maximum values of the biotic indices based on zooplankton attributes of PNMT lakes (abundances, ratios, specific richness).
Biotic Indices-2009CodesFactorsMean ± SdMin.Max.
Large Cladocera/Total CladoceraLCL/TCLE-, T+, P-0.43 ± 0.280.000.85
Daphnia/Total CladoceraDa/TCLE-, T+, P-0.25 ± 0.210.000.59
Cladocera/CopepodaCL/COE+0.97 ± 1.590.086.30
Daphnia/CrustaceaDa/CRE-, T+, A-, P-0.06 ± 0.060.000.21
Abundance BosminaAboE+, A+, P+2.81 ± 3.830.0012.34
Abundance HolopediumAhoE-, A+1.44 ± 3.040.0011.56
Abundance DaphniaAdaE-, T+, A-, P-1.23 ± 1.140.003.57
Cladocera/CalanoidaCL/CAE+3.07 ± 6.440.0824.38
Abundance CrustaceaACRE+28.33 ± 30.562.8398.75
Cyclopoida/CalanoidaCY/CAE+1.12 ± 2.650.0210.00
Rotifera/CrustaceaRO/CRE+1.39 ± 1.600.046.25
Abundance RotiferaAROE+20.81 ± 17.080.9149.64
Richness RotiferaRROE+8 ± 3213
Richness CladoceraRCLE-, P-, T+5 ± 2210
Richness CopepodaRCOE+2 ± 105
E: Eutrophisation, T: Transparency, A: Acidification, P: Predation; + positive effect, - negative effect.
Publisher’s Note: MDPI stays neutral with regard to jurisdictional claims in published maps and institutional affiliations.

