Article

Reliability of the ERA5 in Replicating Mean and Extreme Temperatures across Europe

by
Kondylia Velikou
1,*,
Georgia Lazoglou
2,
Konstantia Tolika
1 and
Christina Anagnostopoulou
1
1
Department of Meteorology and Climatology, School of Geology, Faculty of Sciences, Aristotle University of Thessaloniki, 54124 Thessaloniki, Greece
2
Climate and Atmosphere Research Center (CARE-C), The Cyprus Institute, Aglantzia 2121, Cyprus
*
Author to whom correspondence should be addressed.
Water 2022, 14(4), 543; https://doi.org/10.3390/w14040543
Submission received: 25 November 2021 / Revised: 28 January 2022 / Accepted: 7 February 2022 / Published: 11 February 2022

Abstract

:
ERA5 is widely considered as a valid proxy of observation at region scales. Surface air temperature from the E-OBS database and 196 meteorological stations across Europe are being applied for evaluation of the fifth-generation ECMWF reanalysis ERA5 temperature data in the period of 1981–2010. In general, ERA5 captures the mean and extreme temperatures very well and ERA5 is reliable for climate investigation over Europe. High correlations ranging from 0.995 to 1.000 indicate that ERA5 could capture the annual cycle very well. However, the high mean biases and high Root Mean Square Error (RMSE) for some European sub-regions (e.g., the Alps, the Mediterranean) reveal that ERA5 underestimates temperatures. The biases can be mainly attributed to the altitude differences between ERA5 grid points and stations. Comparing ERA5 with the other two datasets, ERA5 temperature presents more extreme temperature and small outliers for regions southern of 40° latitude and less extreme temperatures in areas over the Black Sea. In Scandinavia, ERA5 temperatures are more frequently extreme than the observational ones.

1. Introduction

One of the main issues that are addressed in the largest percentage of climatological studies, and also one of the main challenges that climate scientists face to conduct their research is to have accurate and long-term datasets. Such data that lead to robust results and conclusions and can provide critical information on the monitoring of the trends of the climatic parameters, need to have a homogenous spatial resolution over each domain of interest, and should be long-term, and have no gaps. Moreover, accurate datasets are an essential aspect for the climate model evaluation, hydrological and agrometeorological model simulations, impact studies, and determination of adaptation and mitigation strategies [1,2]. Even though countries all over the world have a sufficient network of observational and/or gauge stations, in several cases, their datasets do not fulfill the aforementioned criteria.
Thus, in order to fill this “data gap”, acknowledging the need for coarse data networks, several high-resolution gridded datasets have been developed over the past few years, providing a more consistent climatic archive both from the temporal and spatial scale point of view [3]. The importance of the reanalysis datasets lies mainly in the fact that they are a contemporary and effective information source for numerous decadal time-scale climatological studies [4]. However, it should be highlighted that these reanalysis data are not used indiscriminately [5], since they may be affected by the potential inhomogeneities of the observational data, errors in satellite radiance, incomplete model physics, and insufficient representation of topography [6]. Their evaluation is fundamental to assess the potential uncertainty due to the interpolation (mainly dependent on the observation network density used) and to the data assimilation and forecast models [5,7]. Rapaić et al. [6] also mentioned that satellite radiance processing errors may also result in discontinuities and/or artificial trends in reanalysis data series underlining the importance of their evaluation, especially when they are used for long-term trend analysis [8]. It should also be taken into consideration that each dataset could have inconsistencies in its performance (in some regions it could provide very satisfactory results, and in others, its skill could be low); thus, no general and universal conclusion can be derived for the whole planet on their ability to capture the climatic characteristics of the global. Furthermore, the results of an evaluation strongly depend on the parameter that is being evaluated (e.g., temperature or precipitation), along with whether its mean or extreme values are tested. Reanalysis data are often characterized by systematic changes due to alterations in satellite/remote sensing data in terms of adjustment, sensitivity, and data network density [9]. Additionally, reanalysis data can lead to unreliable climate signals as the changes that may occur in the observational data interact with the assimilating model [10].
Recently, the European Center for Medium-Range Weather Forecasts (ECMWF) released their newest reanalysis database (ERA5 reanalysis) [11] to replace the ERA-Interim one. As the authors mention, the most important upgrade of ERA5 has been its finer spatial, as well as temporal resolution (31 km vs. 79 km and hourly vs. 3-hourly, respectively). Additionally, they highlight the fact that a much larger amount of data and a higher number of vertical levels were utilized. In comparison to its predecessor, ERA5 presents improvements both on the data assimilation system and the model physics. Nowadays, several studies have been published worldwide, aiming at the evaluation of this updated database. For example, there is increased accuracy in simulating the parameter of precipitation in different regions of the planet [2,12,13,14] by underlining the strengths and weaknesses of ERA5 over each domain of interest. Other studies focused on more specialized parameters, such as solar radiation, irradiance, land surface temperature, wind power production, sea surface temperature, thermal climate index, and others [15,16,17,18,19]. Nevertheless, regarding air temperature (T-2m), until now (to the authors’ knowledge), no studies have been conducted regarding the evaluation of this main climatic parameter over Europe. Thus, aiming to fill this literature gap and provide a useful “guide” to future researchers that may want to use ERA5 temperature data, we decided to conduct this evaluation.
Overall, our study’s main goal was to detect and examine the strengths and weaknesses of this updated reanalysis dataset (ERA5) all over the European domain. The comparisons were made not only by using previous gridded datasets, such as the European daily high-resolution gridded observational dataset (E-OBS), but also using data from 196 stations that cover the region of interest produced by the European Climate Assessment and Dataset (ECA&D). The evaluation focuses on the main climatic parameter, temperature, expanding the analysis both on its mean annual and seasonal values, but also on its extremes (95th and 5th percentile) for the assessment of the ERA5 performance and sensitivity on the temperature’s minimum and maximum values.

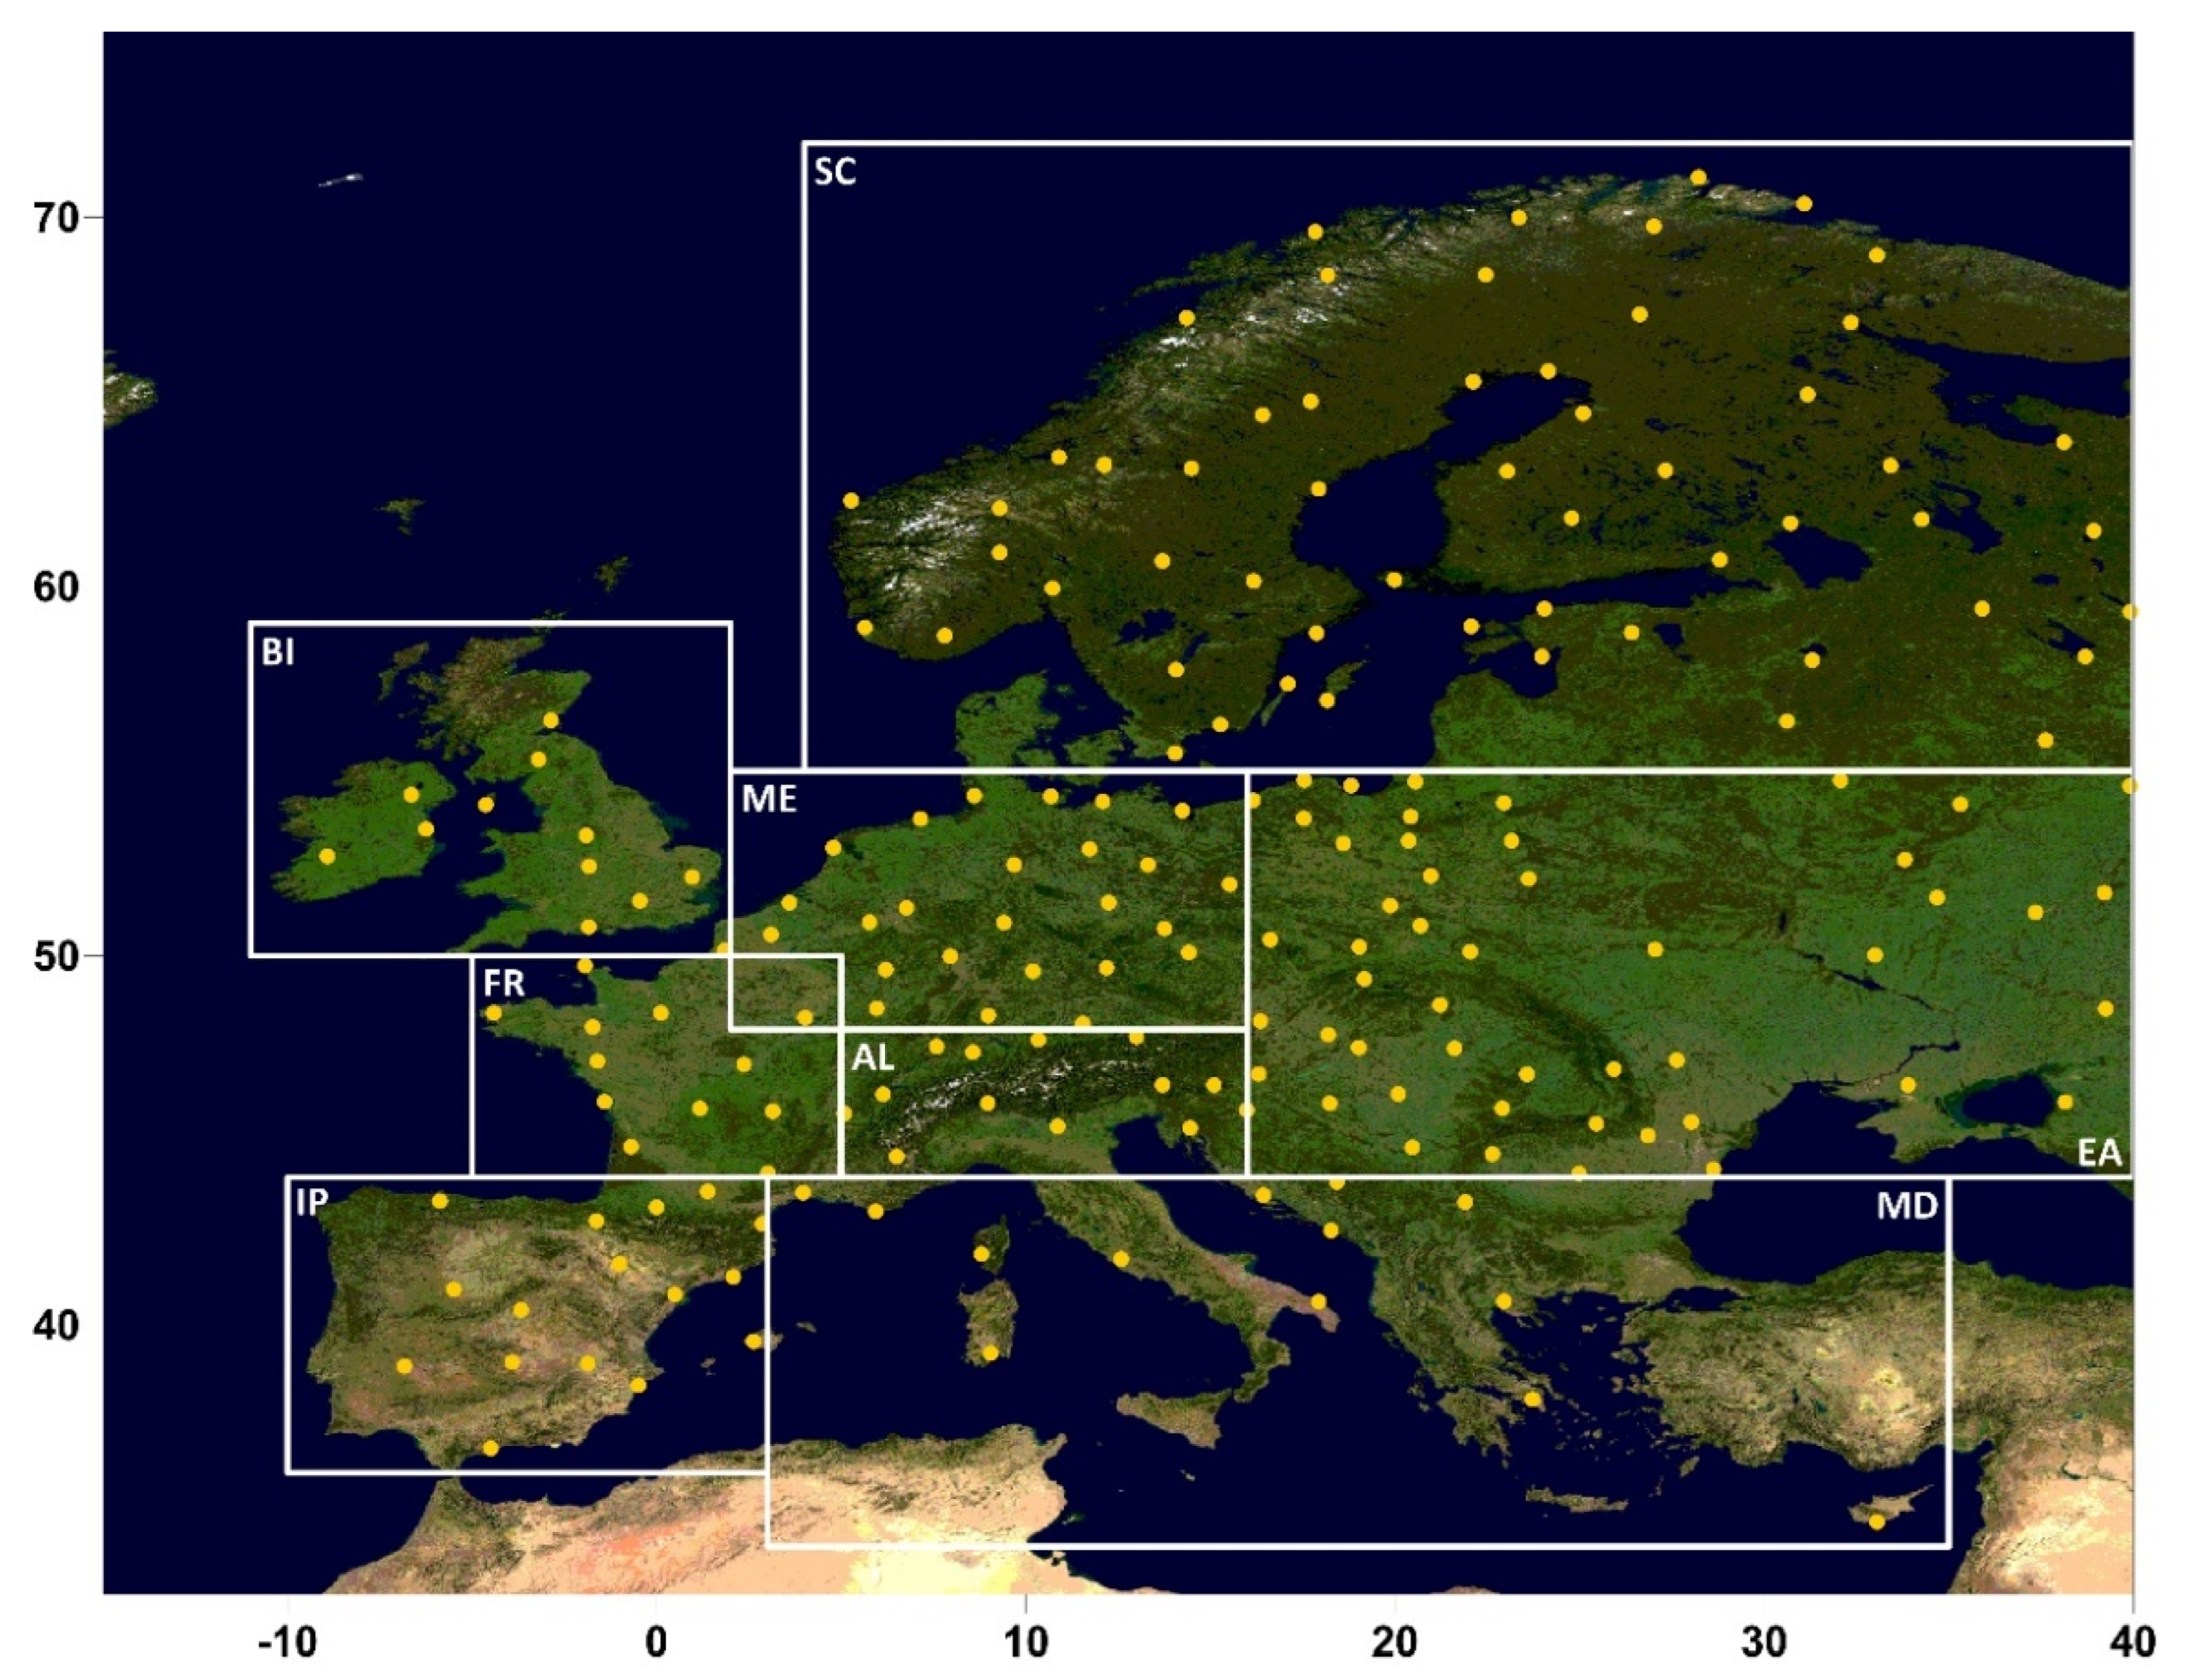
2. Materials and Methods

As mentioned in the previous paragraph, we utilized daily mean temperature data provided by three sources (ERA5, ECA&D, E-OBS). The evaluated dataset ERA5 is the most updated recent reanalysis data, produced by the European Centre for Medium-Range Weather Forecasts (ECMWF) [20], with a high spatial resolution of 0.25°. The main advantage of the ERA5, in comparison with the previous versions of ECMWF reanalysis data, is that it takes into account the uncertainty of the initial data [21]. For the evaluation of the ERA5 data, daily mean temperature values derived from 196 European stations (Figure 1) produced by ECA&D are utilized [22]. The station selection was made according to their location (uniform coverage of the studied area) and data availability. Except for the station data, the E-OBS daily gridded dataset with a 0.25 × 0.25 spatial resolution [23] was used to evaluate ERA5. The E-OBS dataset derives from the European Climate Assessment and Dataset (ECA&D) after the application of the Kriging interpolation [23]. The research area is Europe, and all used datasets cover a 30-year time period starting from 1981 to 2010. Additionally, for a more thorough and detailed evaluation of the results, we divided the domain of study into eight (8) subregions (Figure 1) according to the common EURO-CORDEX analysis domain [24].
The evaluation of the ERA5 data was made both annually and seasonally. Apart from the mean daily temperature, an additional analysis was made for extreme maximum and minimum temperatures. The 95th and the 5th percentiles were selected as a threshold for extreme maximum and minimum temperature, respectively [25,26,27]. The analysis was performed in two parts. Firstly, for each station, the closest ERA5 grid point (over land) was selected. The ERA5 mean, extreme maximum (95th percentile), and minimum (5th percentile) temperatures were compared with the respective station data. Secondly, to compare ERA5 data with E-OBS data, a bilinear remapping of E-OBS data to the ERA5 data was performed. In both cases, the annual and seasonal differences between the ERA5 mean, extreme maximum and minimum temperatures, as well as the respective data from ECA&D stations and the E-OBS dataset were calculated, mapped, and compared.

3. Results

The comparison between ERA5 with the E-OBS data and daily observations of ECA&D stations is summarized in Table 1. ERA5 temperatures correlate with E-OBS, and daily observation temperatures exceed 0.995 at the annual base. The statistics for the comparison between ERA5 and E-OBS are much better than the one with ECA&D, small RMSE (<0.75 °C), small mean biases (<0.36 °C), and standard deviation biases (<0.66 °C). For the ECA&D database, RMSE values range between 0.34 and 1.84 and the mean biases are not higher than −2.0 °C. The mean standard deviation is close to 0.5 °C.
British Isles (BI) present the lowest correlation (0.995), while the relationship between the two databases for Scandinavia (SC) and Eastern Europe (EA) is very strong (cor = 1.000). ERA5 underestimates Annual mean Temperatures (AmT) compared to ECA&D data, but ERA5 slightly overestimates AmT related to E-OBS. Alps (AL), the Mediterranean region (MD), and the Iberian Peninsula (IP) show the highest RMSE values and biases. For example, for the Alps region, the RMSE value of ECA&D is three times higher compared to the E-OBS one, and the mean bias (ECA&D) is almost nine times greater than the corresponding E-OBS bias. Only for the EA region, the ERA5 temperatures are overestimated for both comparisons. The statistical differences in temperature between the models could be explained due to the different altitudes between the regions and the sparse observations per region. Regions with high altitudes and complex terrain present the highest biases. In order to identify which of these two characteristics have the greatest effect on the temperature differences, a correction of ERA5 temperature in terms of the average lapse rate was performed according to the following equation:
T = T 0 + γ Δ z ,
where γ = −0.65 °C/100 m. For example, the elevation of ERA5 in the Alps region differs by about 200 m to 400 m higher or lower compared to E-OBS or the station’s one (Figure 2a,b). However, it appears to not have an important role in the temperature differences (Figure 2c,d). Additionally, in the northern coastal regions in Scandinavia and the Mediterranean coast, there are significant differences in altitudes. In this case, the correction of elevation reduces the temperature differences (Figure 2e,f), meaning that complex terrain accommodates the temperature biases of ERA5.

3.1. Spatial Resolution of Mean Temperature

ERA5 mean temperatures follow Europe’s climatology with the lowest temperatures appearing in northern regions and higher temperatures in the more southern ones (Figure 3a and Figure 4a,b). Additionally, low temperatures occur in mountainous areas due to high elevation. However, ERA5 data do not show uniform behavior throughout Europe. Additionally, the areas with low or negative temperatures present the highest standard deviation values (Figure 3b and Figure 4c,d). ERA5 data are very similar or even identical to E-OBS in many regions in Europe, but there are other regions where ERA5 datasets differ considerably (Figure 3c). Notably, for regions of latitude greater than 55° N, ERA5 data differ. Specifically, in the northern coastal zone of Scandinavia, the ERA5 is underestimated compared to E-OBS, while on the inner side of the Scandinavian peninsula there is a statistically significant temperature overestimation. In the southern part of Europe and the Mediterranean, it seems that the complex terrain is affecting data performance. Areas with high altitudes, such as the Alpine region and the Mediterranean mountain windward regions, show a statistically significant underestimation of temperatures. The Alps are characterized by the greatest underestimation. In contrast, the highest positive differences occur in the southeast of Europe, southern Turkey, and North Africa, areas where the initial station temperature data of the E-OBS dataset are quite sparse. The distribution of temperature differences for winter and summer gives the overall picture in the annual results (Figure 4e,f). The lowest temperatures of ERA5 in the coastal zone of Scandinavia are recorded in all seasons except summer, while the very high temperatures in the North African region and South-East Turkey occur in summer, and with less intensity in spring (not shown). Additionally, in all seasons, the western Iberian Peninsula, the Italian peninsula, and the south-western Balkan Peninsula show lower temperatures than the E-OBS.
At the same time, ERA5 data were also compared with station data from the ECA&D database (Figure 3d). The spatial representation of the differences between the two databases shows a similar pattern for central Europe with small non-statistical differences between ERA5 and station data. Accordingly, for Scandinavia, the Norwegian stations’ temperatures are underestimated, while daily temperatures in Sweden and Finland are overestimated. The pattern in southern Europe is different. For numerous stations, temperature is underestimated. Specifically, for about 40% of the stations, ERA5 show statistically significant lower temperatures than the observed ones, and only 20% showed statistically significant positive differences. It should be noted that for three stations in Romania and one station in the Czech Republic, ERA5 overestimates mean temperatures of more than 5 °C for all seasons (Figure 4g,h, spring and autumn not shown).

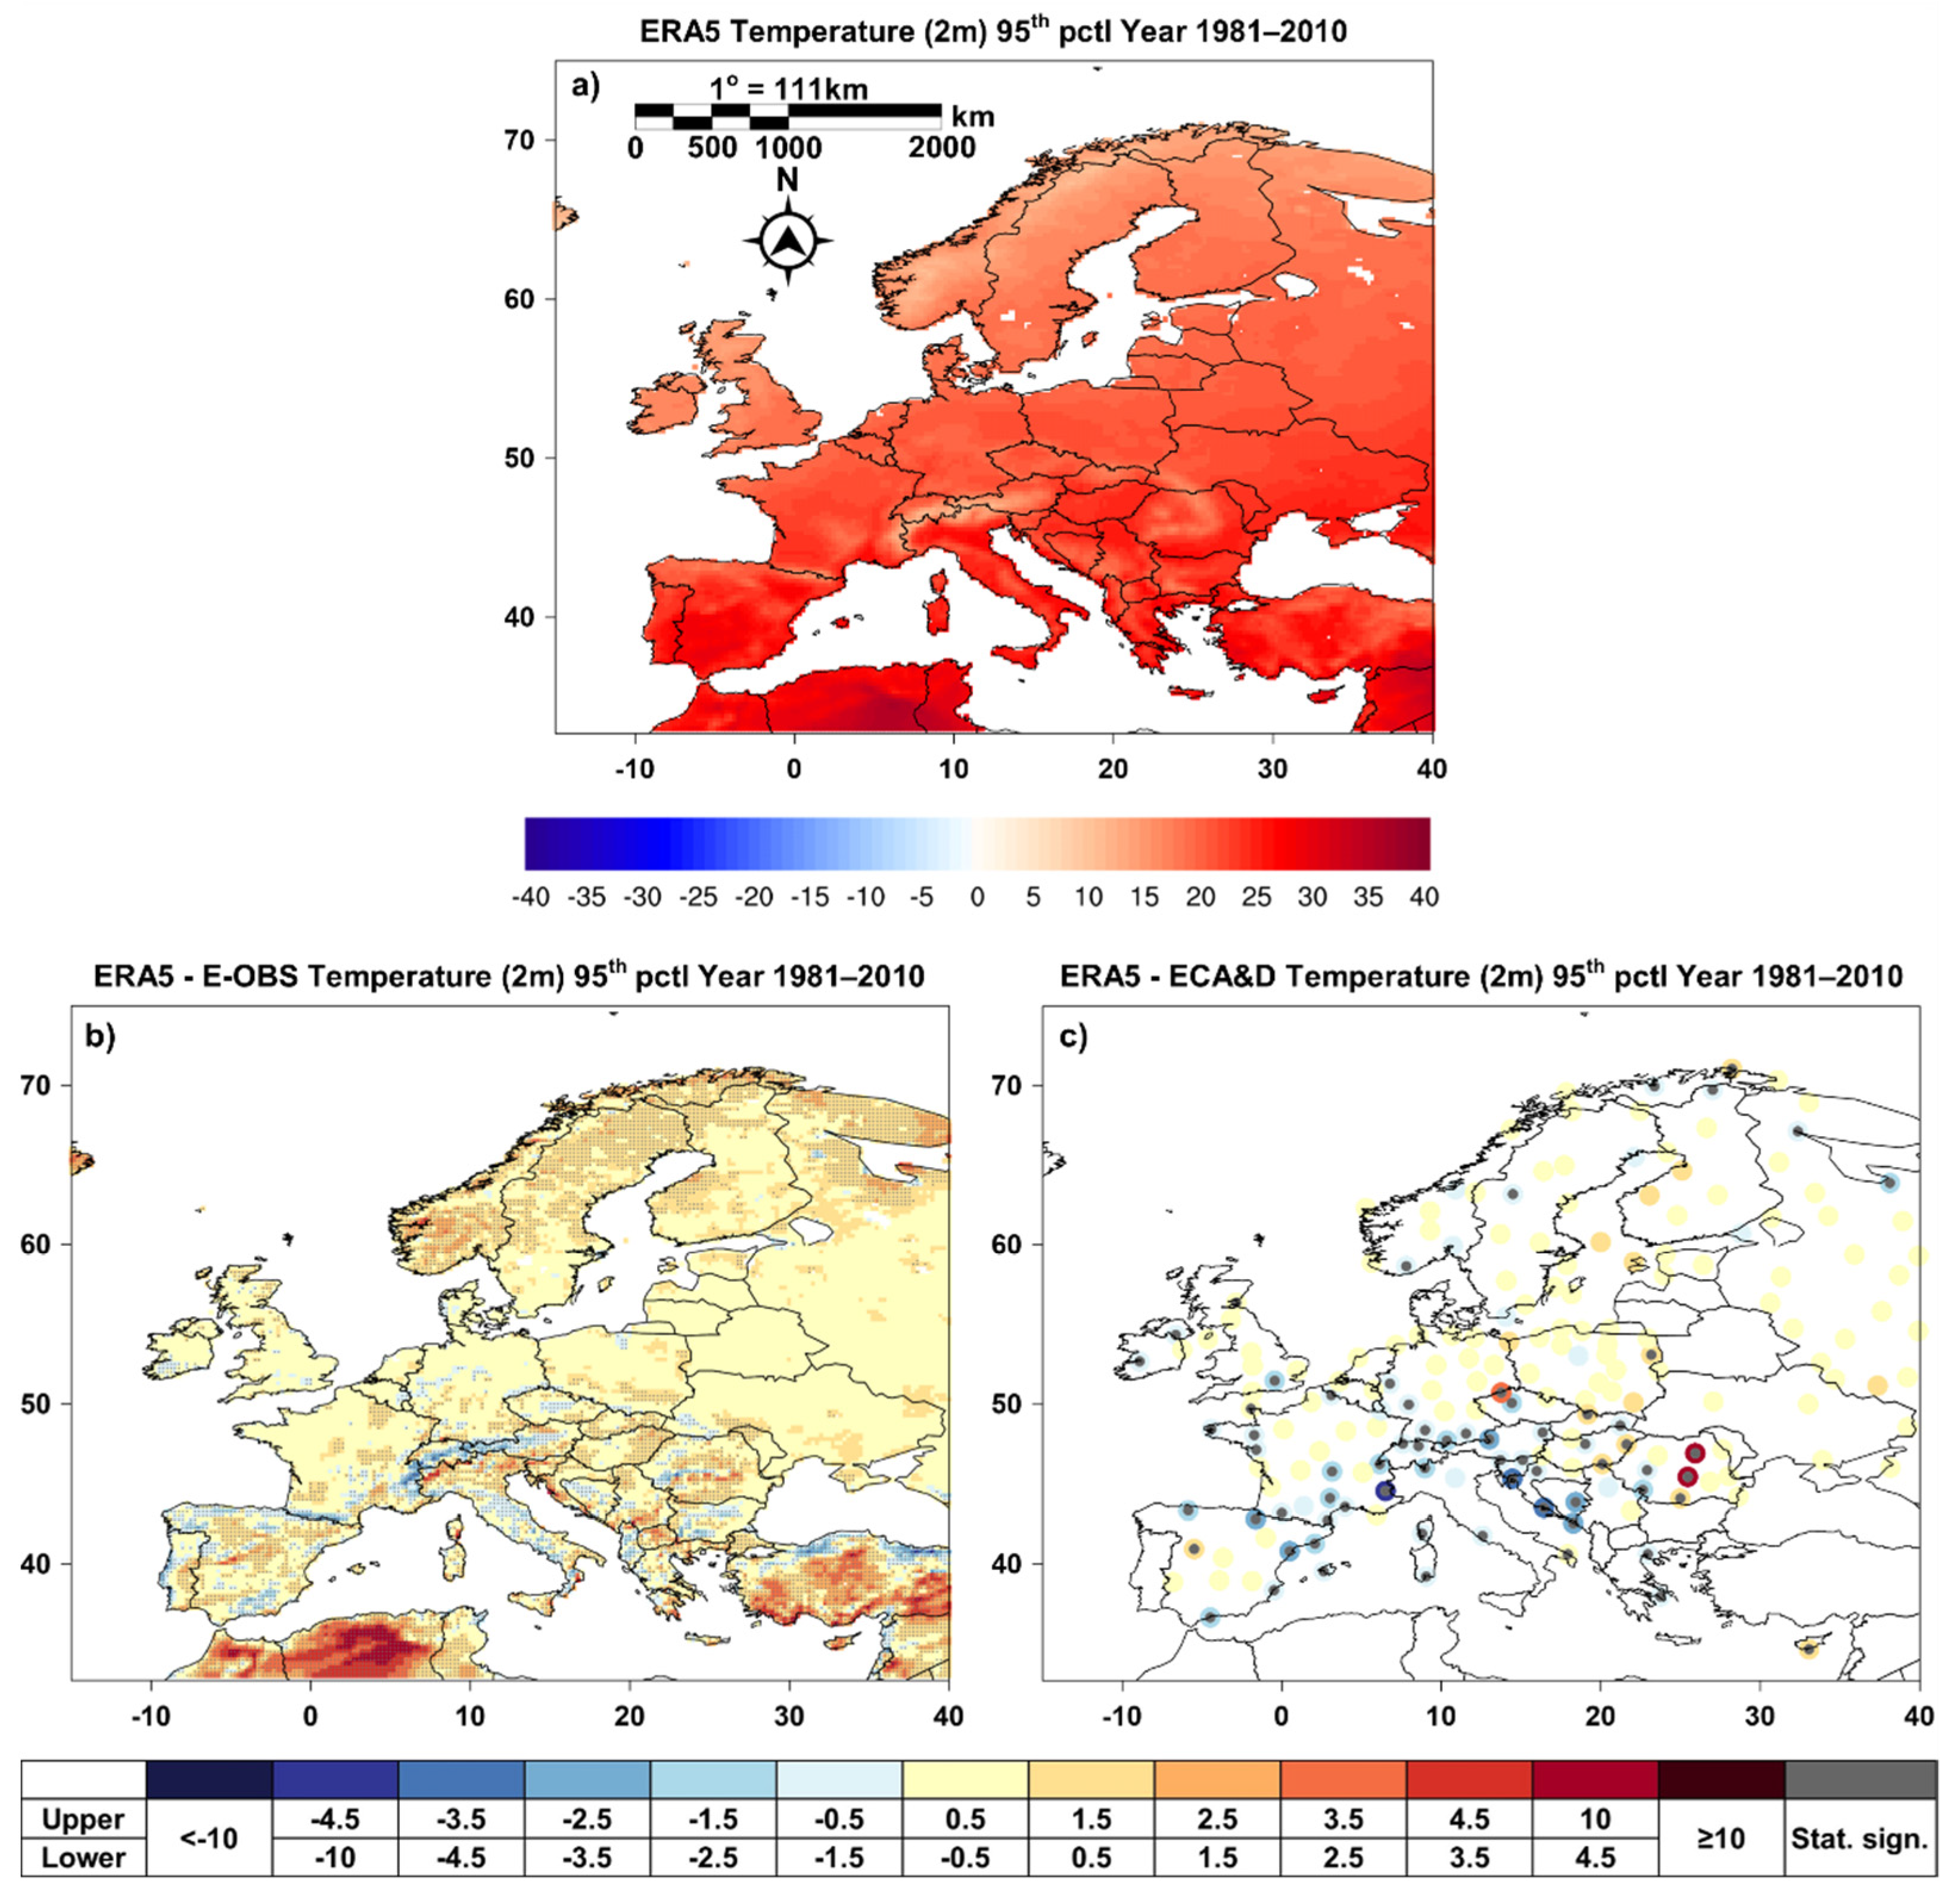
3.2. Spatial Resolution of Extreme Temperature

A corresponding analysis was also carried out for extreme temperatures. Figure 5 shows the results for the minimum extreme mean temperature defined as the 5% percentile of the mean temperature. It was found that the northern and southern regions of Europe present the greatest differences (Figure 5b). Scandinavia is once again significantly distinguished; the extreme low mean temperatures of Norway are underestimated, while throughout the rest of Scandinavia, there is a significant overestimation of extreme low mean temperatures by ERA5. A very significant underestimation of extreme low mean temperatures is also observed over the Alpine region. The windward slopes of the mountains in the Mediterranean peninsula, a great part of Turkey, and North Africa are characterized by a statistically significant underestimation of extreme low mean temperatures. This pattern is the same in all seasons except summer, where it seems that generally, in most of Europe, ERA5 overestimates extreme low mean temperatures (not shown). A significant variation occurs in the Alps, with the northern slopes showing lower extreme mean temperatures than the E-OBS and the southern slopes showing higher extreme low mean temperatures.
For extreme low mean temperatures, a comparison was also made with the data of the ECA&D stations (Figure 5c). The general pattern of differences in extreme low mean temperatures does not differ significantly from the above results, but the spatial and temporal peculiarities presented are important. In particular, on an annual basis, only 17 stations show a statistically significant positive difference in extreme low mean temperatures. In winter (not shown), positive statistically significant results are limited to eight (8) within the Scandinavian Peninsula, three (3) in Romania, two (2) in Italy, and two (2) in Great Britain. Statistically significant differences in extreme low mean temperatures occur mainly in Norway, and in countries around the Mediterranean Basin. In summer (not shown), most of the statistically significant differences were presented in the North Balkan and the Alps.
The equivalent pattern of extreme high mean temperatures (95% percentile) is different from that of low mean temperatures (Figure 6). ERA5 seems to overestimate the extreme high mean temperatures compared to E-OBS dataset, while the majority of the biases are non-statistically significant (Figure 6b). The highest differences are not in Europe but in Southern Turkey and North Africa. For winter, the general pattern changes by underestimating extreme high mean temperatures both in the northern Scandinavian region and in the Alpine region (not shown). This difference is not capable of changing the overall pattern of extreme high mean temperatures, as presented in the other seasons’ maps. Autumn and spring show the least statistically significant differences (not shown).
Comparing extreme high mean temperatures of ERA5 with the database of ECA&D stations, the pattern is a little different (Figure 6c). The southern European stations around the Mediterranean Basin continue to show statistically significant negative differences, meaning that the ERA5 model underestimates the extreme high mean temperatures in the Mediterranean and the Northern Balkans. The exception is two stations in Romania and one station on the Czech–German border showing statistically significant positive differences.

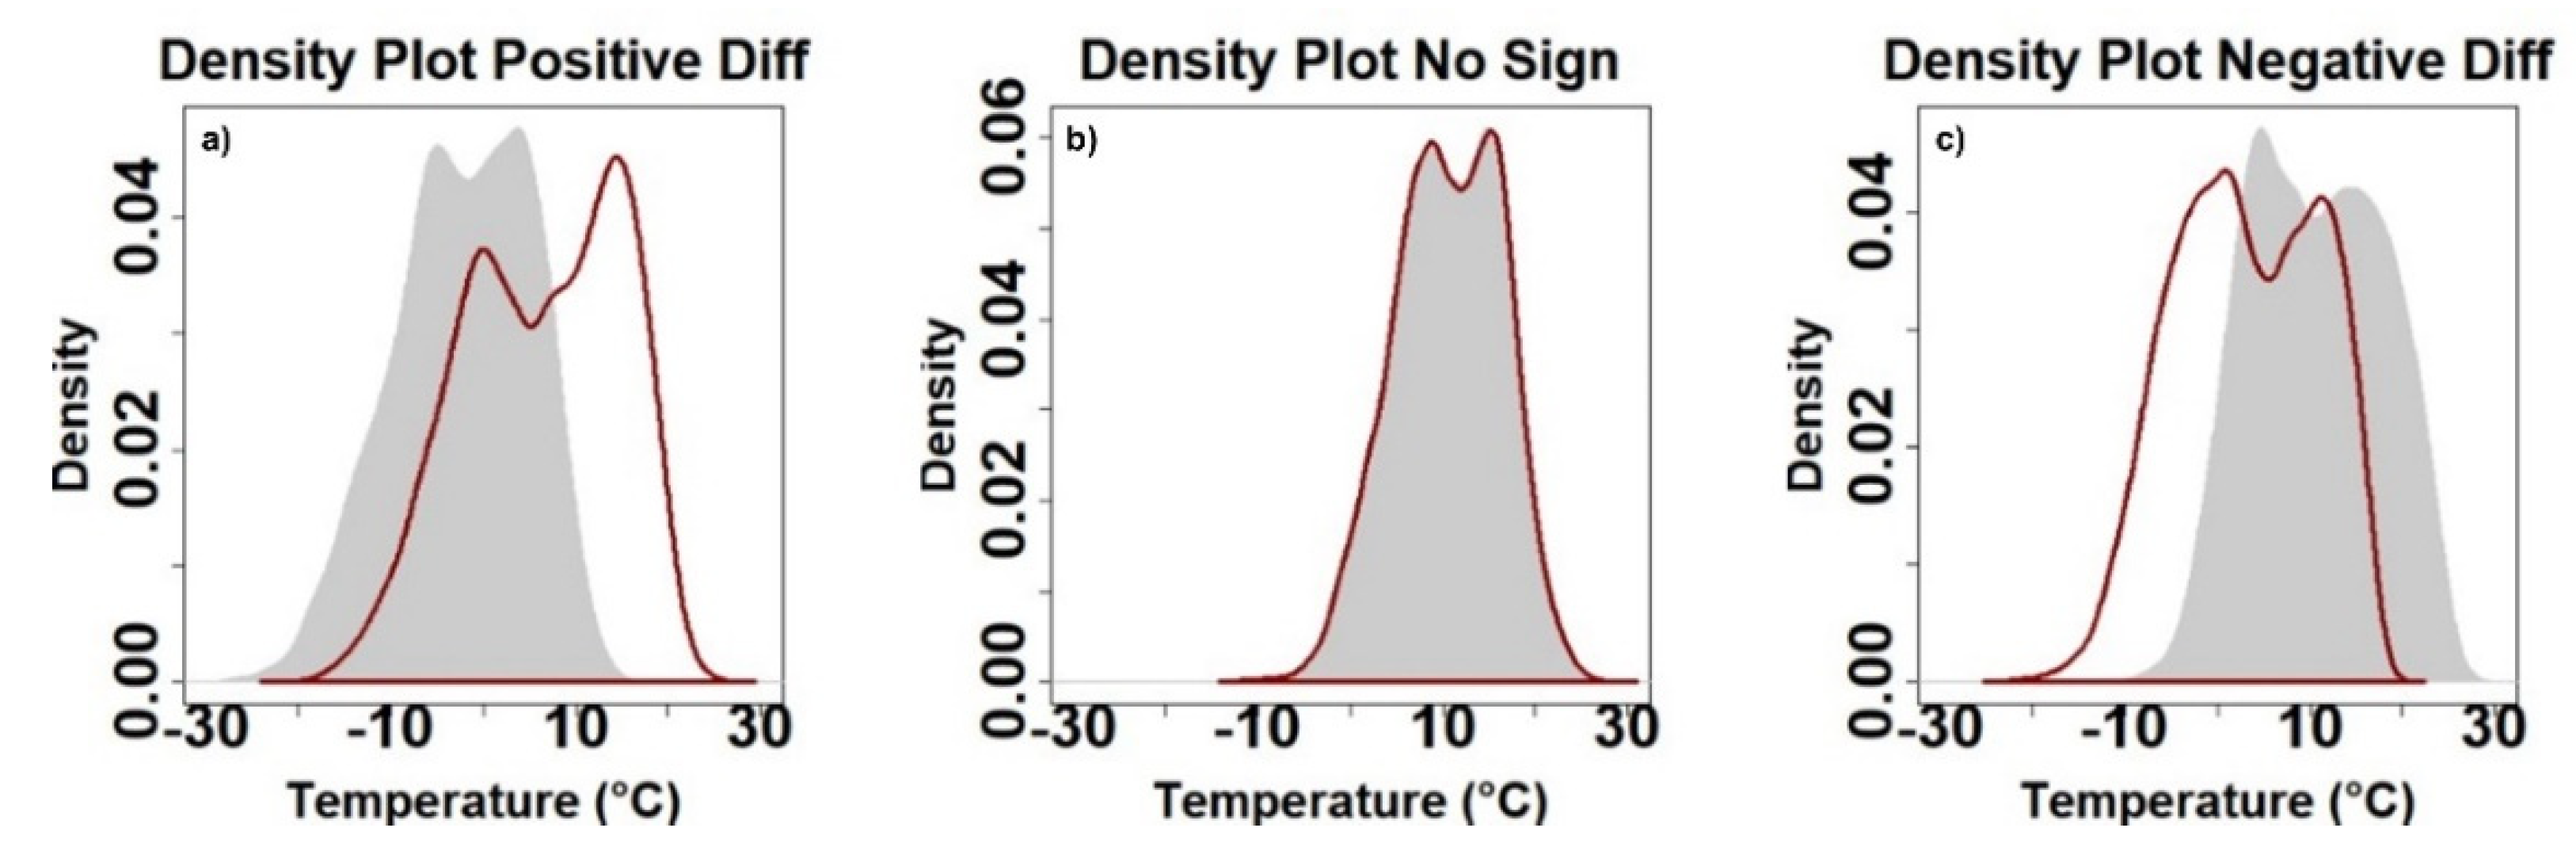
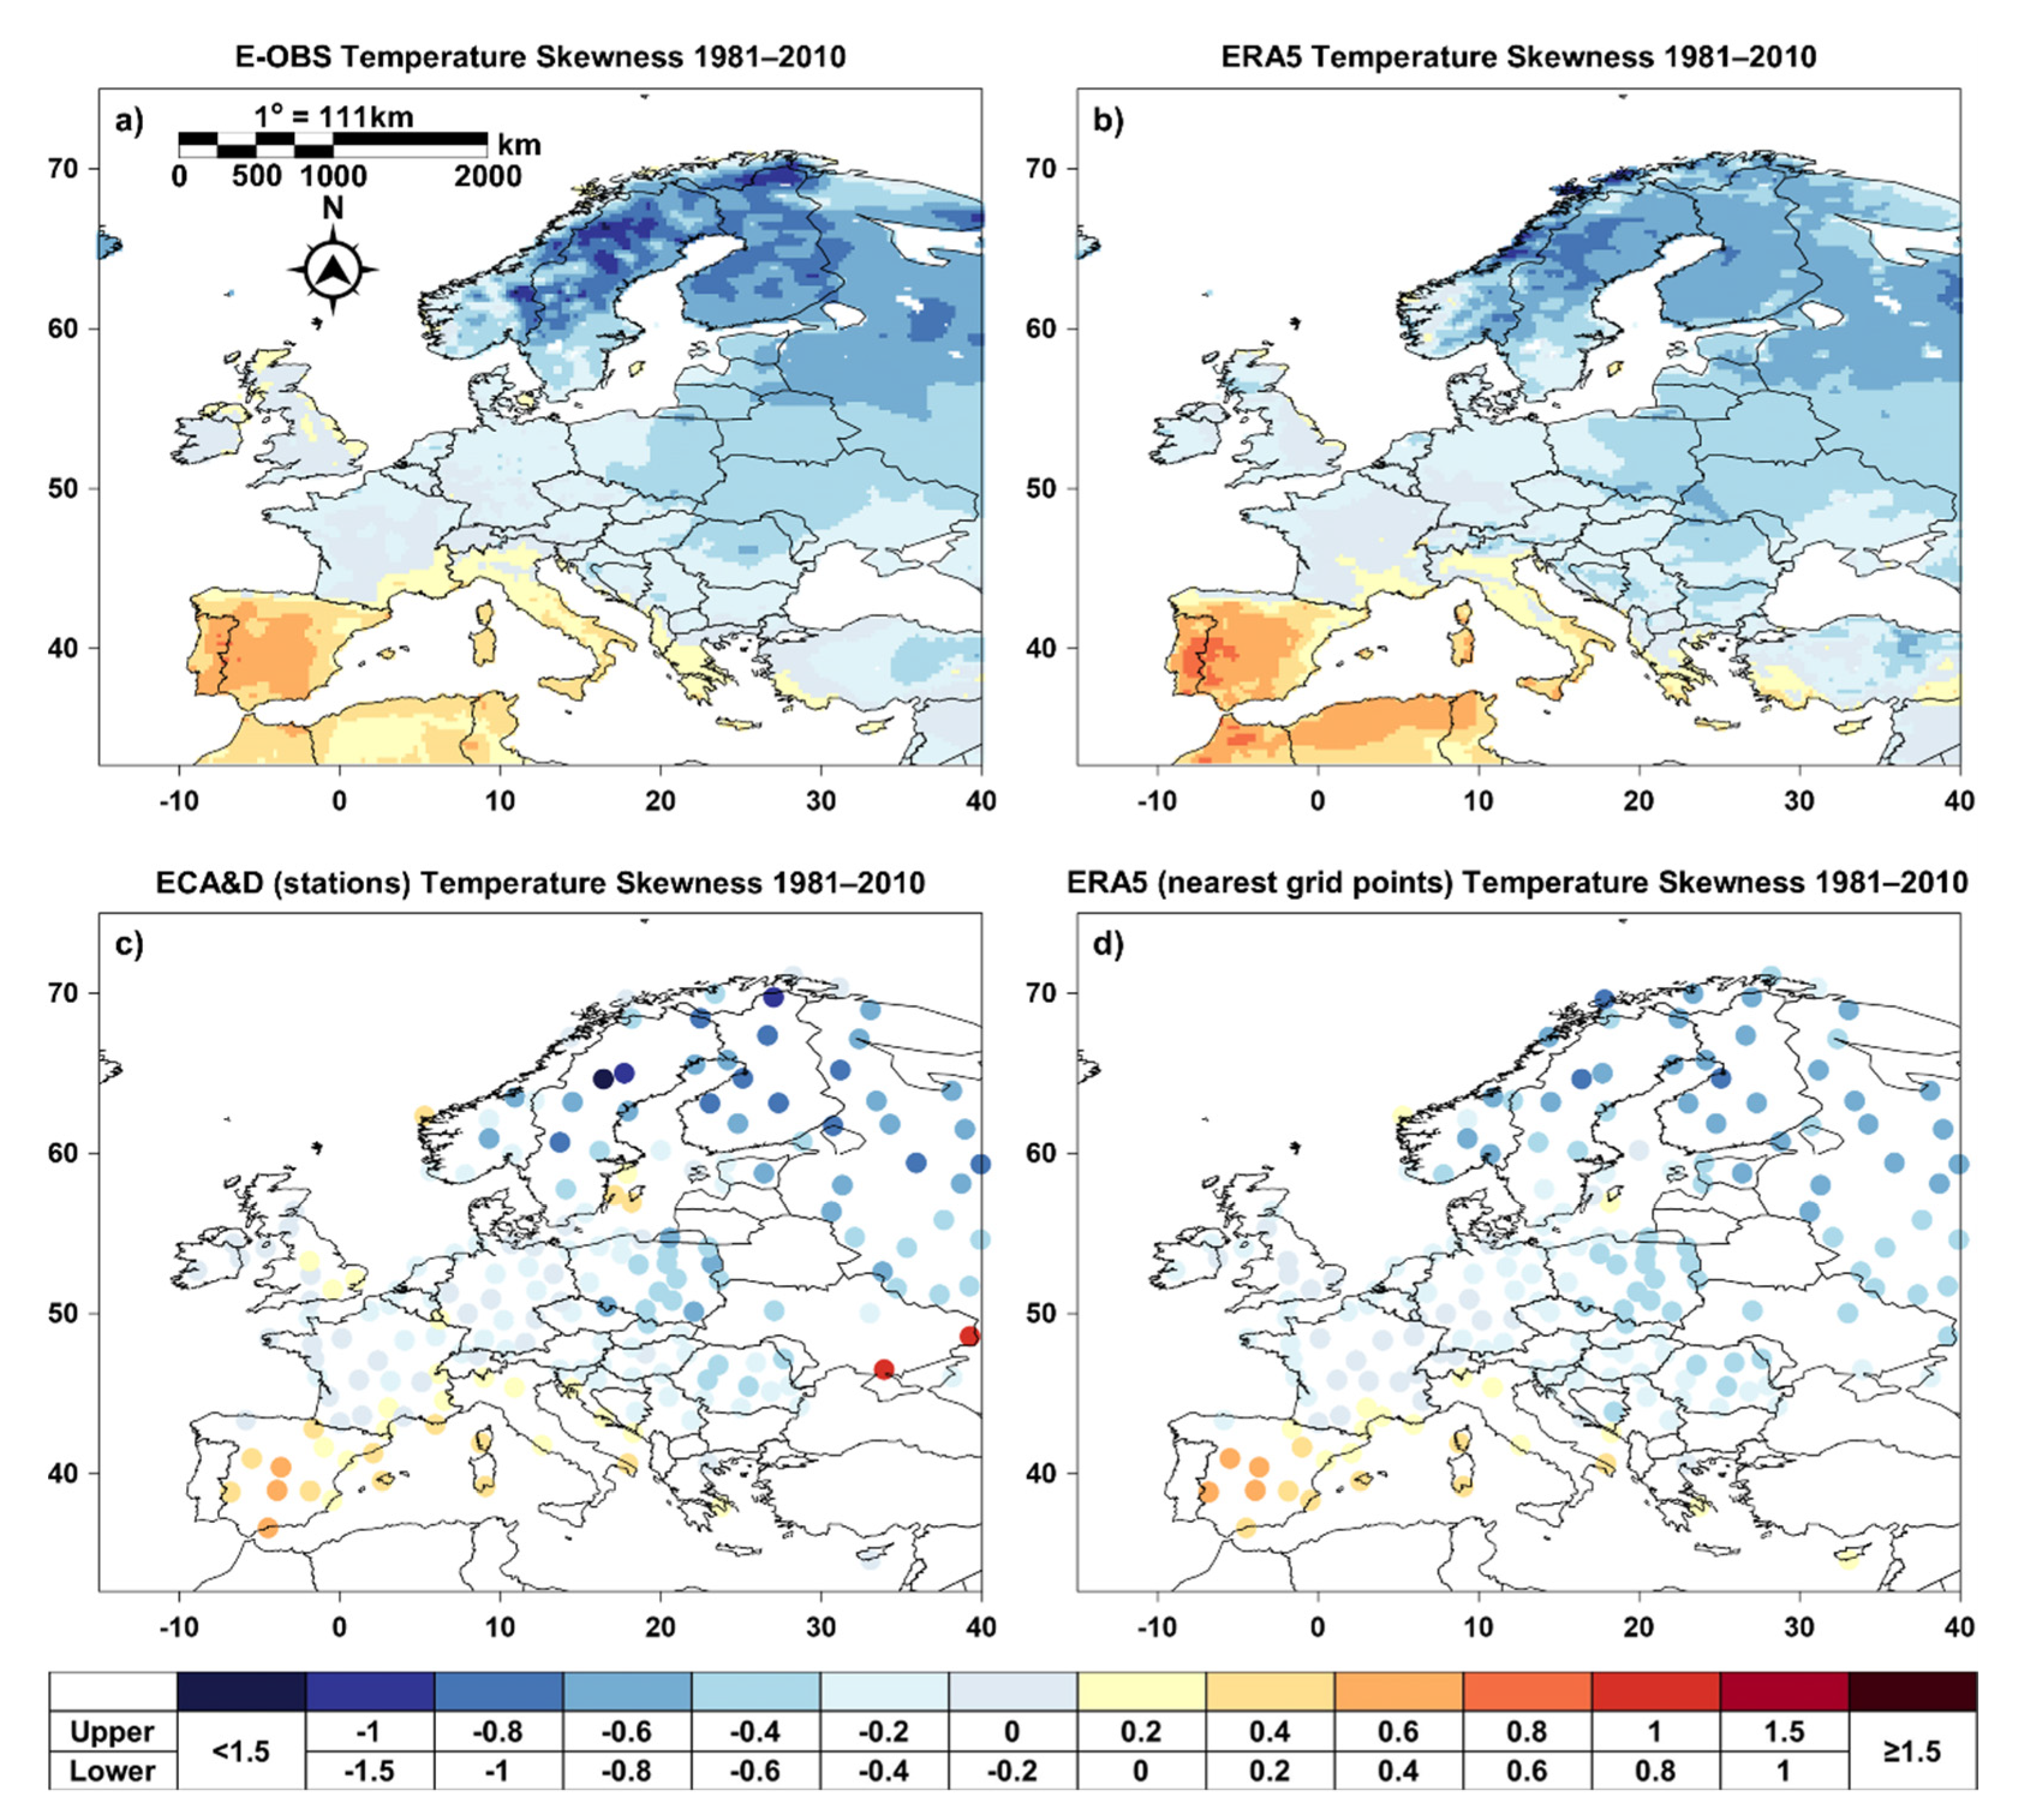
3.3. Statistical Analysis of Extreme Temperature

The previous analysis showed that the mean spatial ERA5 temperatures compared to the two databases (E-OBS and ECA&D) are quite similar. However, when the comparison is more thorough, discrepancies are revealed.
These differences are likely related to the different distributions that ERA5 temperatures seem to have. The density plots of the stations with the highest positive (Omu Peak station in Romania) and negative (Embrun station in France) difference, as well as a station with no difference are presented in Figure 7. The plots show that the mean temperature of the selected stations presents a bimodal distribution, meaning that there is a large group of days characterized by positive temperatures and a group of days characterized with negative temperatures. In the case of the Romanian station, ERA5 data show almost the same frequency of positive values but with higher temperatures, and the peak of positive values moves from about 8 °C to 18 °C (Figure 7a). In contrast, the frequency of negative temperatures decreases, and the peak of negative temperatures move from −8 °C to −3 °C (Figure 7c). For negative temperatures, there is a move towards negative values, with a lower frequency and lower temperatures. However, there is an absolute match between the station data and ERA5, as shown in Figure 7b.
For a better description of the temperatures’ distribution, the statistical measures of skewness and kurtosis are used. Distributions with positive kurtosis excess exhibit tail data exceeding the tails of the normal distribution, while with negative kurtosis excess, the tail data are less extreme than the normal distribution tails. Skewness measures extreme values in one versus the other tail. Negative skew refers to a longer or fatter tail on the left side of the distribution, while positive skew refers to a longer or fatter tail on the right.
Figure 8 presents the kurtosis of the three datasets. Central and northern Europe, except for Scandinavia, appear to have negative kurtosis excess values, meaning that the extreme temperatures will be less extreme than usual. In southern European regions, the kurtosis has high negative values, implying that the regions will experience occasional extreme temperatures. Scandinavia is the only region presenting positive kurtosis with large temperature outliers. The higher the negative kurtosis, the flatter the tails. Comparing ERA5 with the other two datasets, regions south of 40° latitude present higher negative kurtosis values, meaning that ERA5 temperature presents more extreme values and small outliers. On the other hand, regions above the Black Sea present lower negative values, implying less extreme temperature. The most interesting aspect of the kurtosis results is in Scandinavia. ERA5 fails to represent the positive kurtosis values. ERA5 temperatures are more often extreme than normal, while the large temperature outliers are not detected.
The results of the skewness can be compared in Figure 9. A large part of Europe has distributions with almost zero skew (−0.2 to 0.2). The northern European regions have negative skewness that refers to a longer or fatter tail in low temperatures. However, the southern regions show a positive skew, meaning that their distributions have a longer or fatter tail in high temperatures. It should be pointed out that there are some differences between the ERA5 temperature and the two datasets. Scandinavian stations, for which ERA5 data show even lower negative skewness values, give lower extreme negative temperatures. For stations in Europe that change the signal of skewness, that is, from positive to negative, the pattern is more complex. According to ERA5 temperature, some stations show more low temperatures (e.g., part of Great Britain). However, there are stations, for example, Rijeka of Croatia (45.33 N–14.45 E), where there is a completely different distribution with more high temperatures than the observed data, but also more extreme low temperatures.

4. Discussion

From our analysis on the simulation of daily air temperature (T-2m) over Europe of the latest version of ERA datasets (ERA5), it is obvious that, in general, their performance is quite satisfactory, and they have been substantially improved in comparison to their previous versions. Analogous results were found in the recent study of Bandhauer et al. [28], in which daily precipitation was evaluated over several parts of the European region. The authors mention, as their concluding remark, that even though ERA5 data are undoubtfully useful and can capture the mesoscale precipitation patterns over Northern and Central Europe, they present some limitations and weaknesses that should be taken under serious consideration. Even though the analysis of Mahto and Mishra [29] took place in a very different region (India) than in our case, especially regarding its climatic characteristics (as well as topography, geographical positions but also data availability), an interesting result was found for maximum and minimum temperatures. It is mentioned that during the monsoon season, ERA5 overestimates the Tmin positive trends and outperforms for maximum temperature. Additionally, they point out that even though ERA5 can reproduce most of the hydrological variables over their domain of interest, they should be used cautiously, since they were not able to reproduce temperature and precipitation trends [29].
Moreover, remarkably enough, Gleixner et al. [21], while assessing the performance of ERA5 for the temperature simulation over East Africa, concluded that the correlation of the database with station data is very high, a result that agrees with our findings over Europe. However, the authors mention that while ERA5 data are clearly improved, in comparison to predecessor datasets, they were not able to capture the observed long-term trends, both for temperature and precipitation values. Exploring the ERA5 performance on the reproduction of temperature from another point of view (mean diurnal temperature cycle), over the Canadian Prairies, the reanalysis dataset was found to be significantly improved, and is recommended to be used for agricultural modeling over the domain of study. In comparison to observational data, ERA5 mean monthly temperature biases are small and do not exceed ±0.3 °C [30]. Nonetheless, it is pointed out that the assessment of precipitation is much more challenging with different biases depending on the seasonal scale of the analysis. Comparing the examined reanalysis dataset with its previous version, as well as with buoy data over the Arctic Sea near-surface air temperature, Wang et al. [31] found positive (warm) biases with the larger ones in winter, spring and autumn, and smaller ones during summer which, according to the authors, could be attributed to the difference in height with the observations. This is a common finding in our study, since ERA5 performs differently for the summer months over the European domain. The evaluation and intercomparison of different reanalysis datasets from Keller and Wahl [32] led to the conclusion that ERA5 performs quite satisfactorily for most examined climate indices in the European region. Finally, the higher resolution of ERA5 seems to be a major improving factor in the representation of temperature in mountain zones and valleys according to Rakhmatova et al. [33] over the Uzbekistan region. It is also concluded that the temperature characteristics of the examined area are in good agreement with the observations of ground stations, and the authors suggest that ERA5 can also be used for the computation of drought indices.
Overall, regarding the evaluation of ERA5 in different regions from a climatological point of view, and for different meteorological parameters, all authors agree that this updated reanalysis dataset has been substantially improved to its previous versions. However, aside from the strengths, detailed analysis of ERA5 revealed some limitations as well, mainly over areas with sharp orography, a complex terrain, and sparse observational network. Additionally, several studies concluded that the time scale (e.g., annual, seasonal, monthly) with which each analysis is conducted plays an important role in the performance of ERA5.

5. Conclusions

The main concluding remarks of the present study are the following:
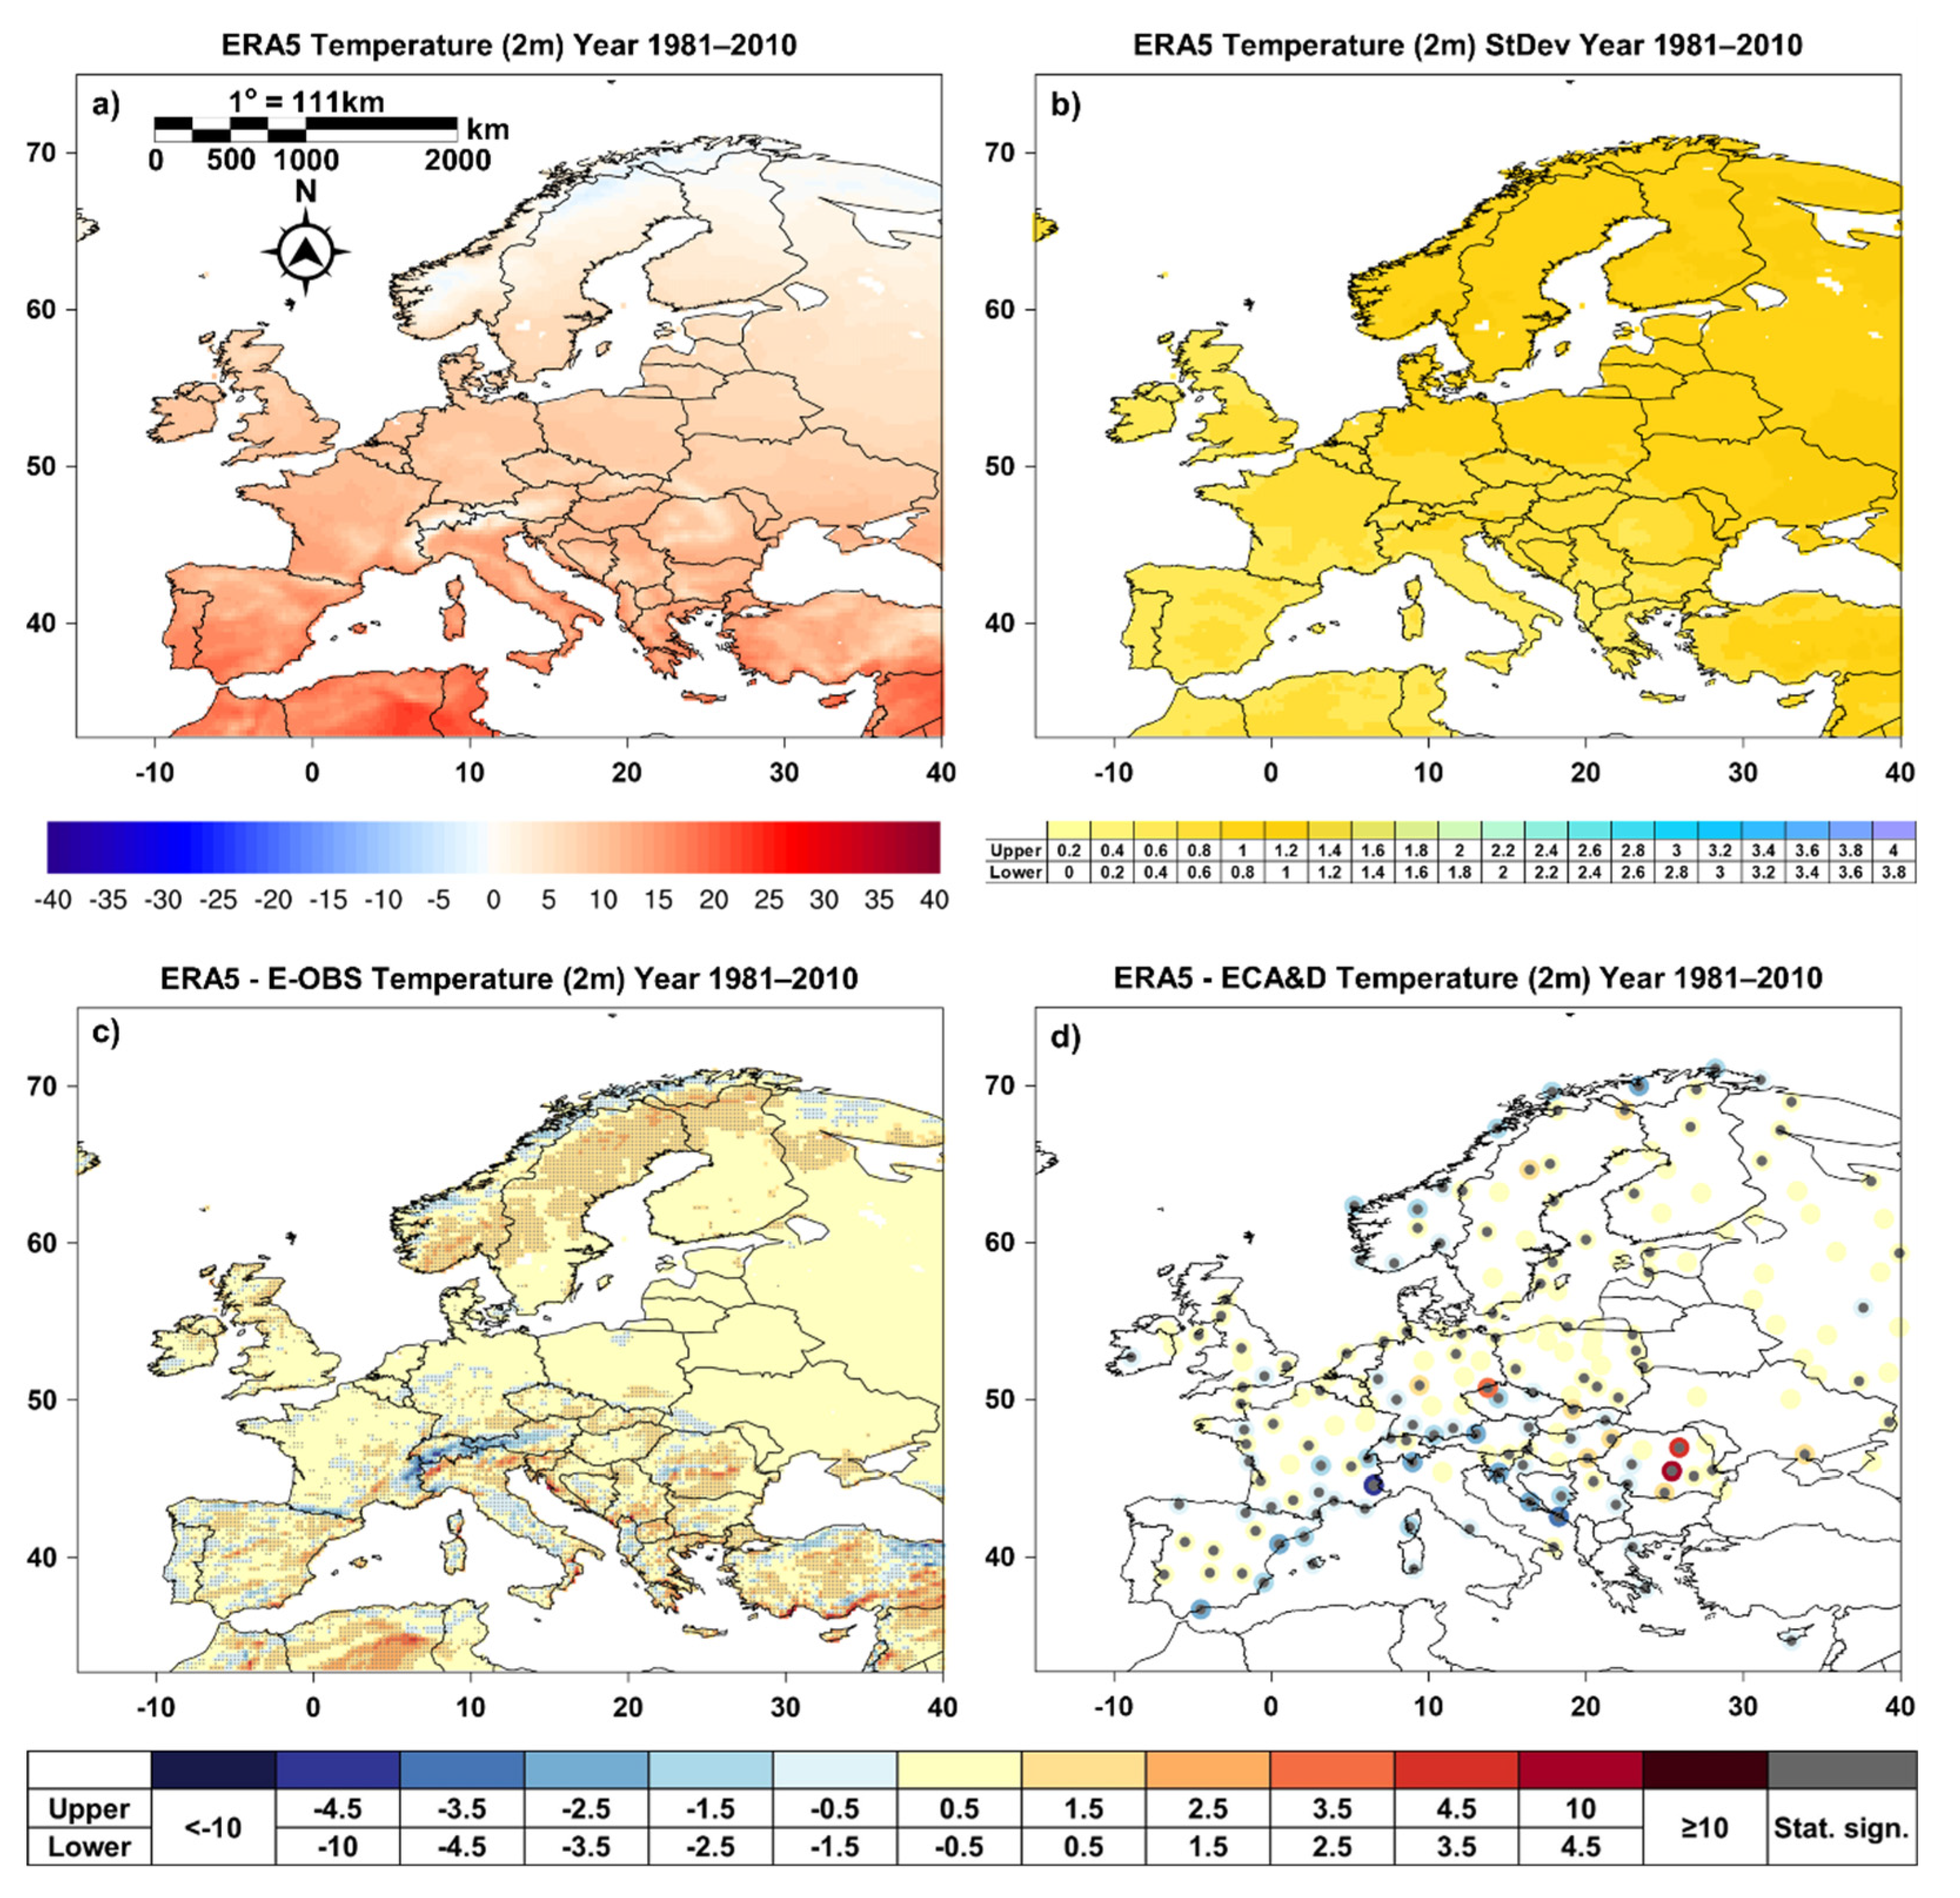
  • In general, ERA5 captures the spatial distribution of mean temperature over Europe, however in latitudes higher than 55° N, ERA5 presents some weaknesses in simulating the temperature values (especially over the Scandinavian region).
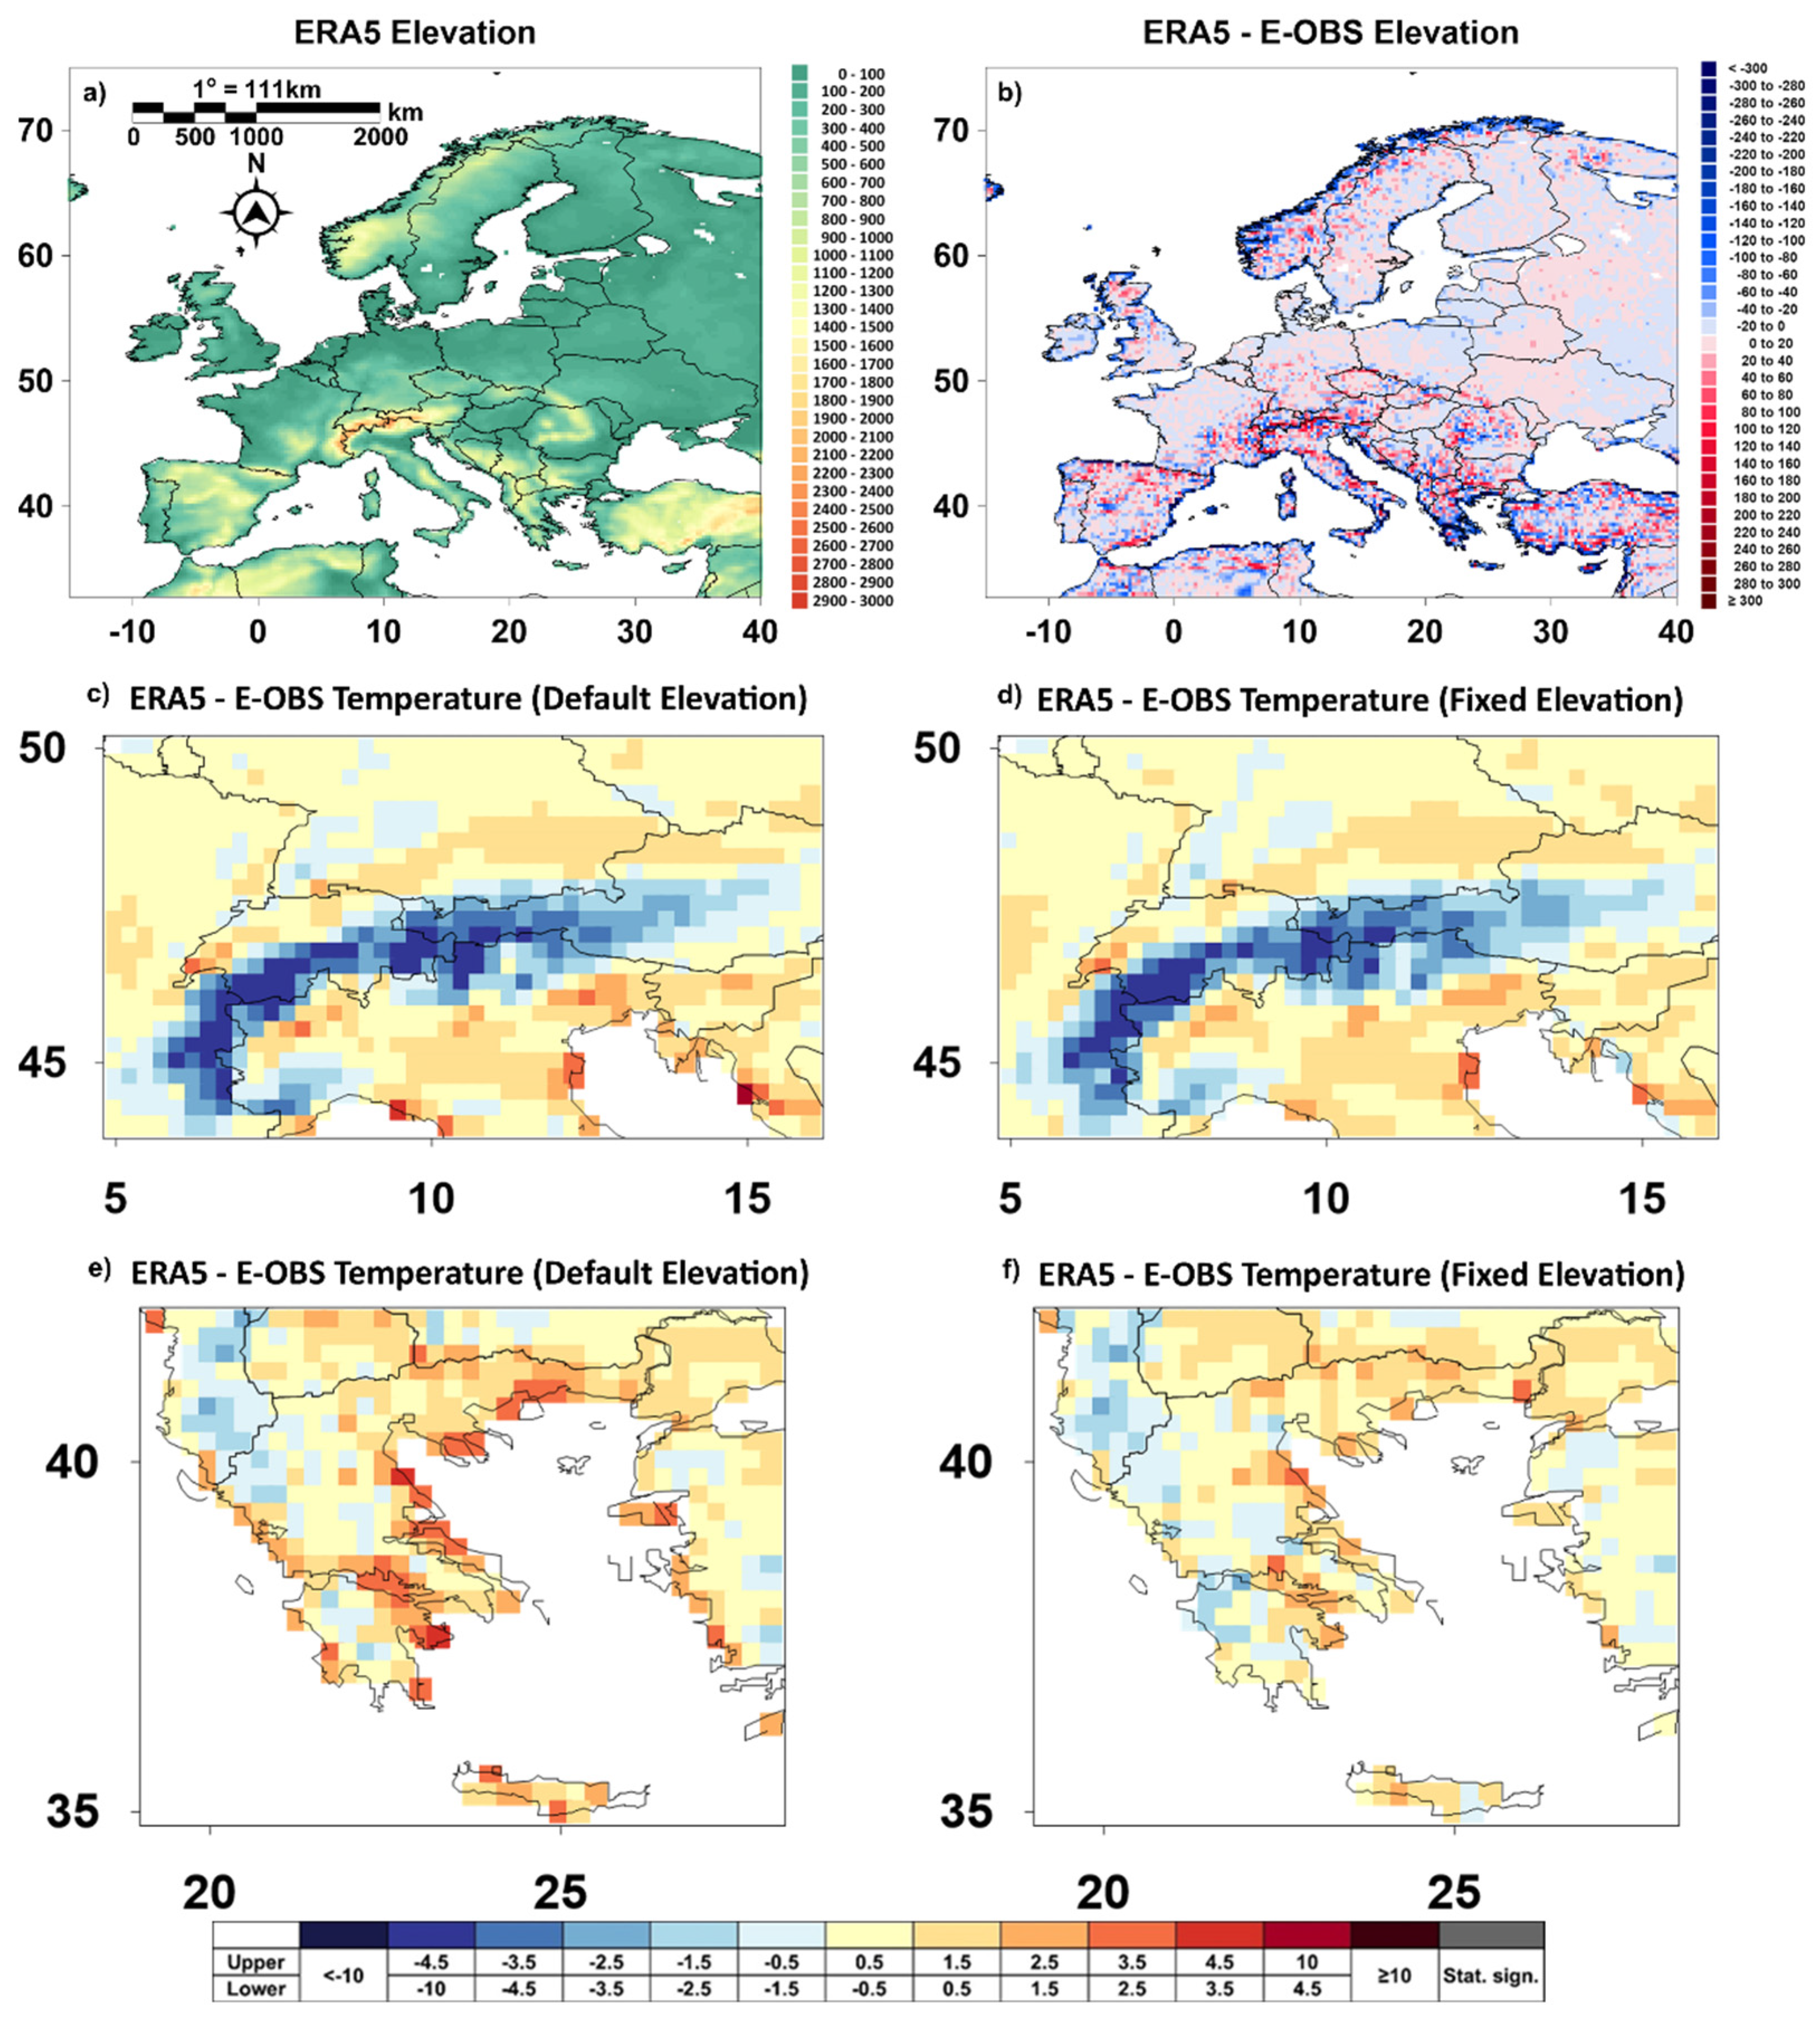
  • Moreover, the complex topography of certain areas affects the performance of ERA5 (e.g., the Alps and Mediterranean). The results must be interpreted with caution in areas with complex terrain, since the alternation between land and sea plays an important role in the observed differences between ERA5 and E-OBS. In case there is a need to correct these temperature datasets, and especially extreme temperatures, statistics of extremes should be utilized [34,35,36].
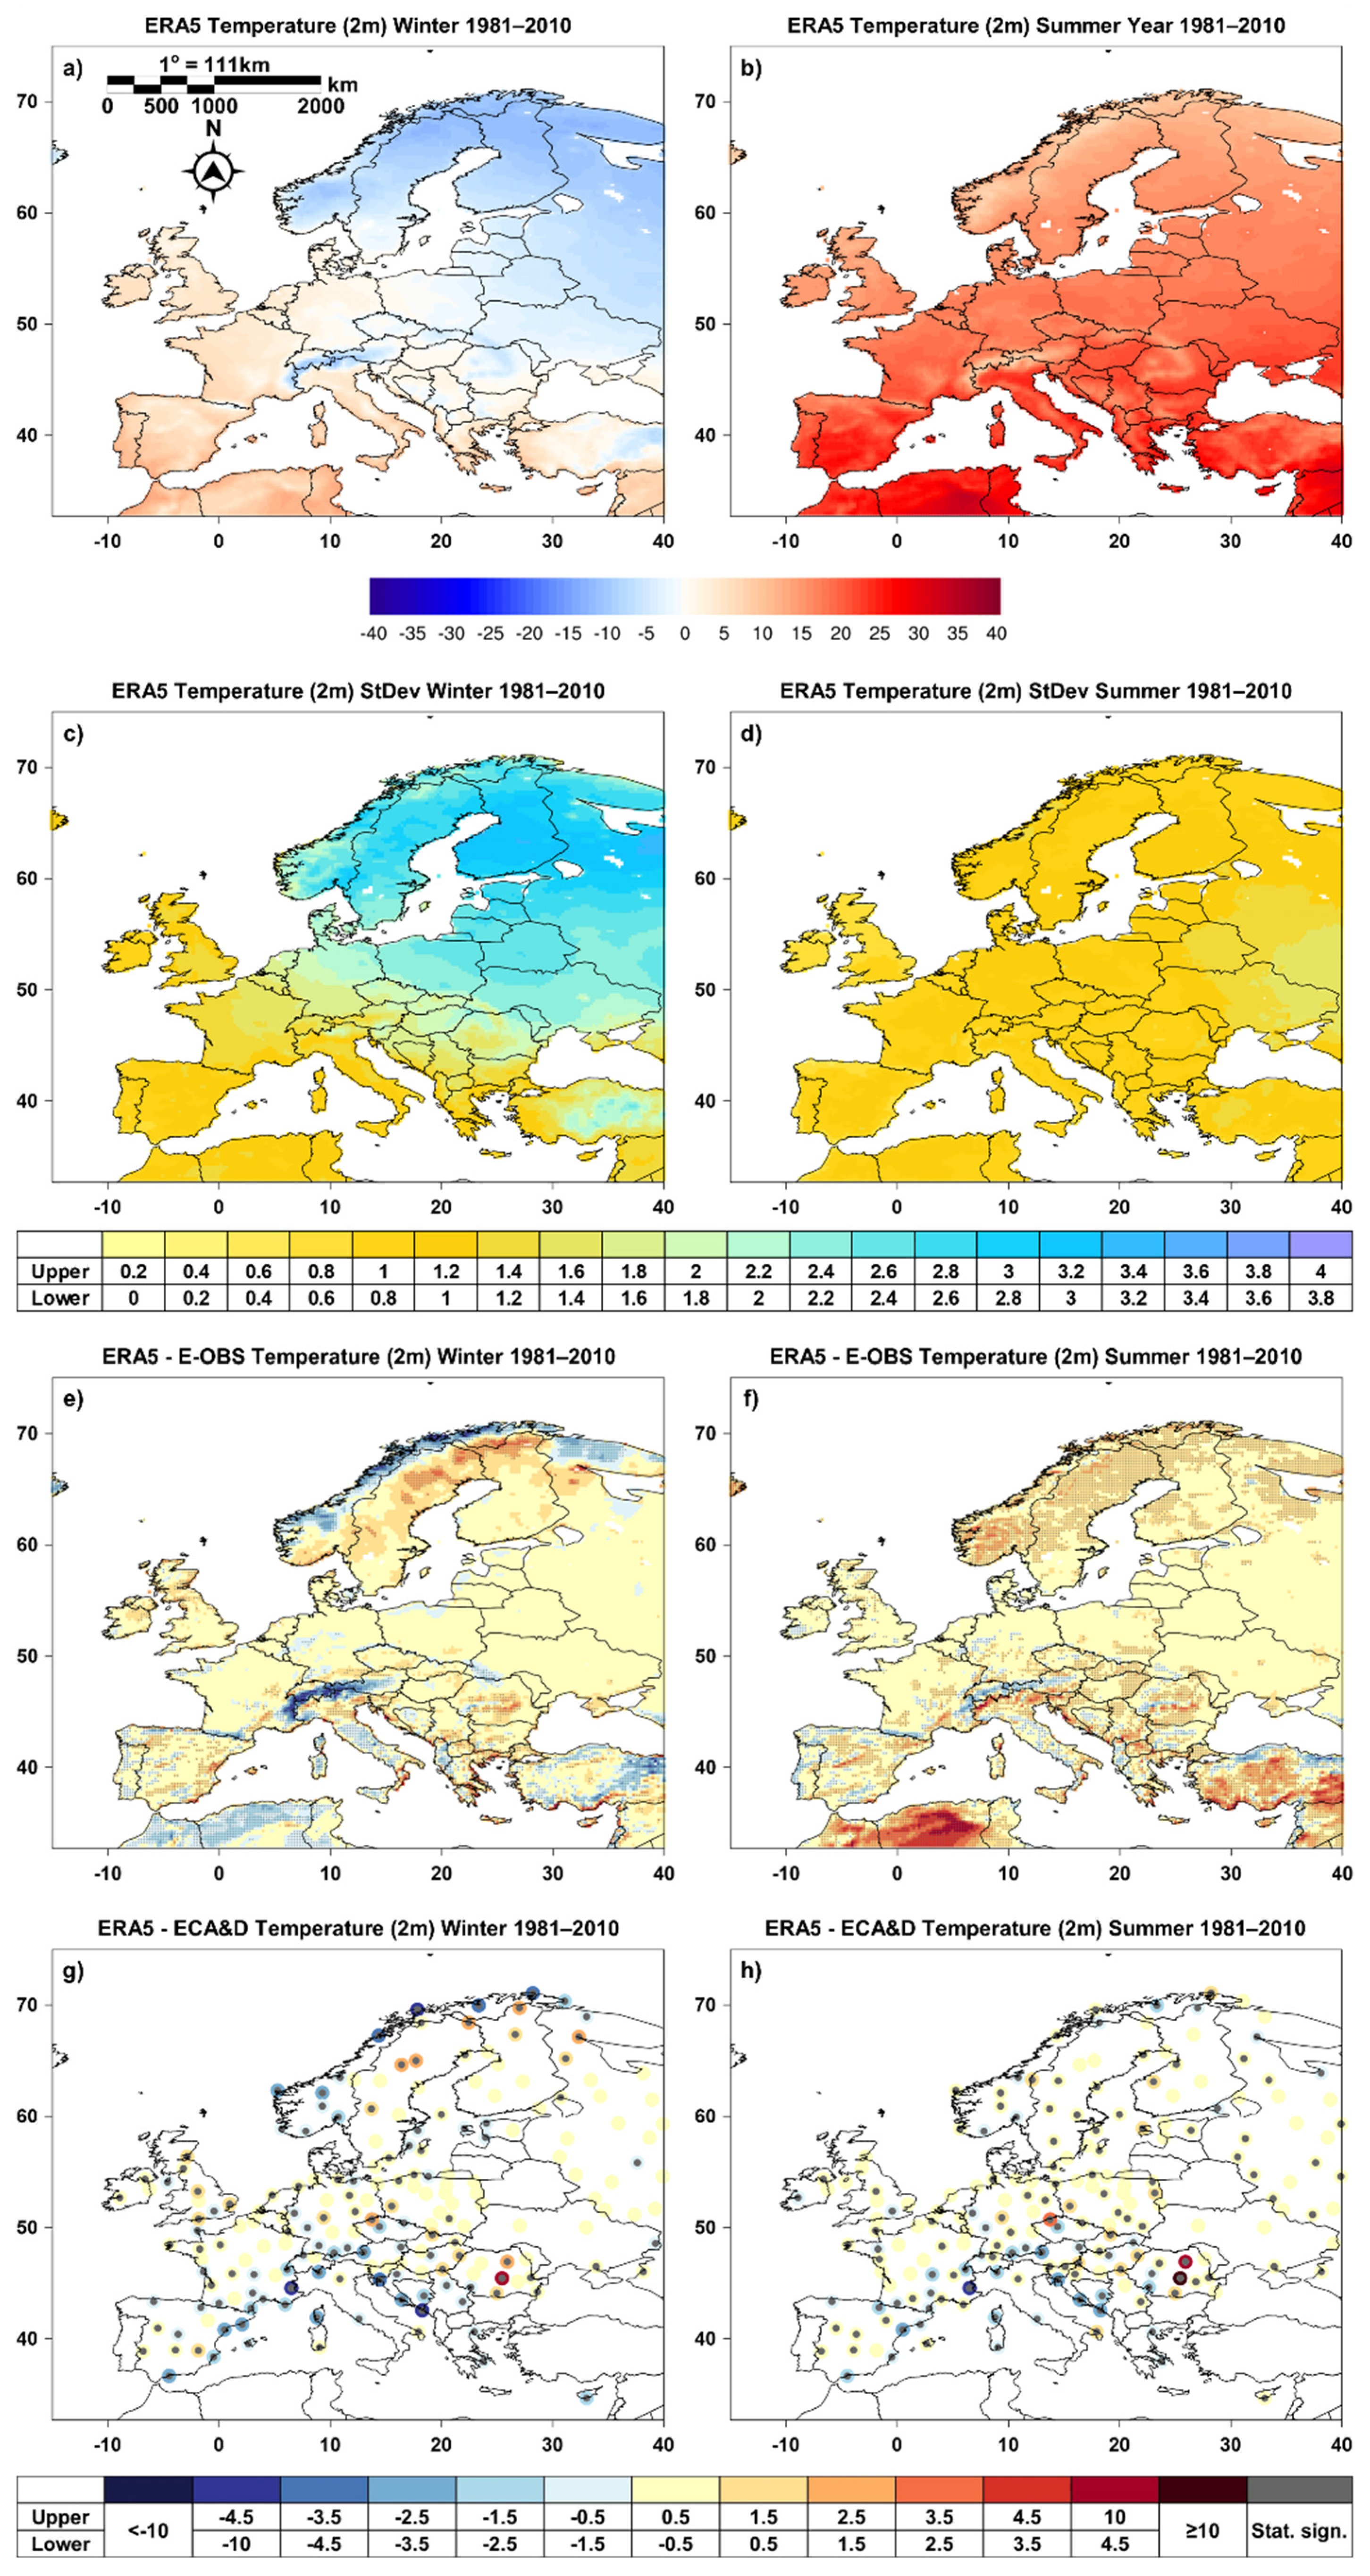
  • Analogous to the annual ones were the results when the analysis was conducted on a seasonal scale.
  • The comparison with the station network revealed that in southern Europe, the examined parameter is in many cases underestimated.
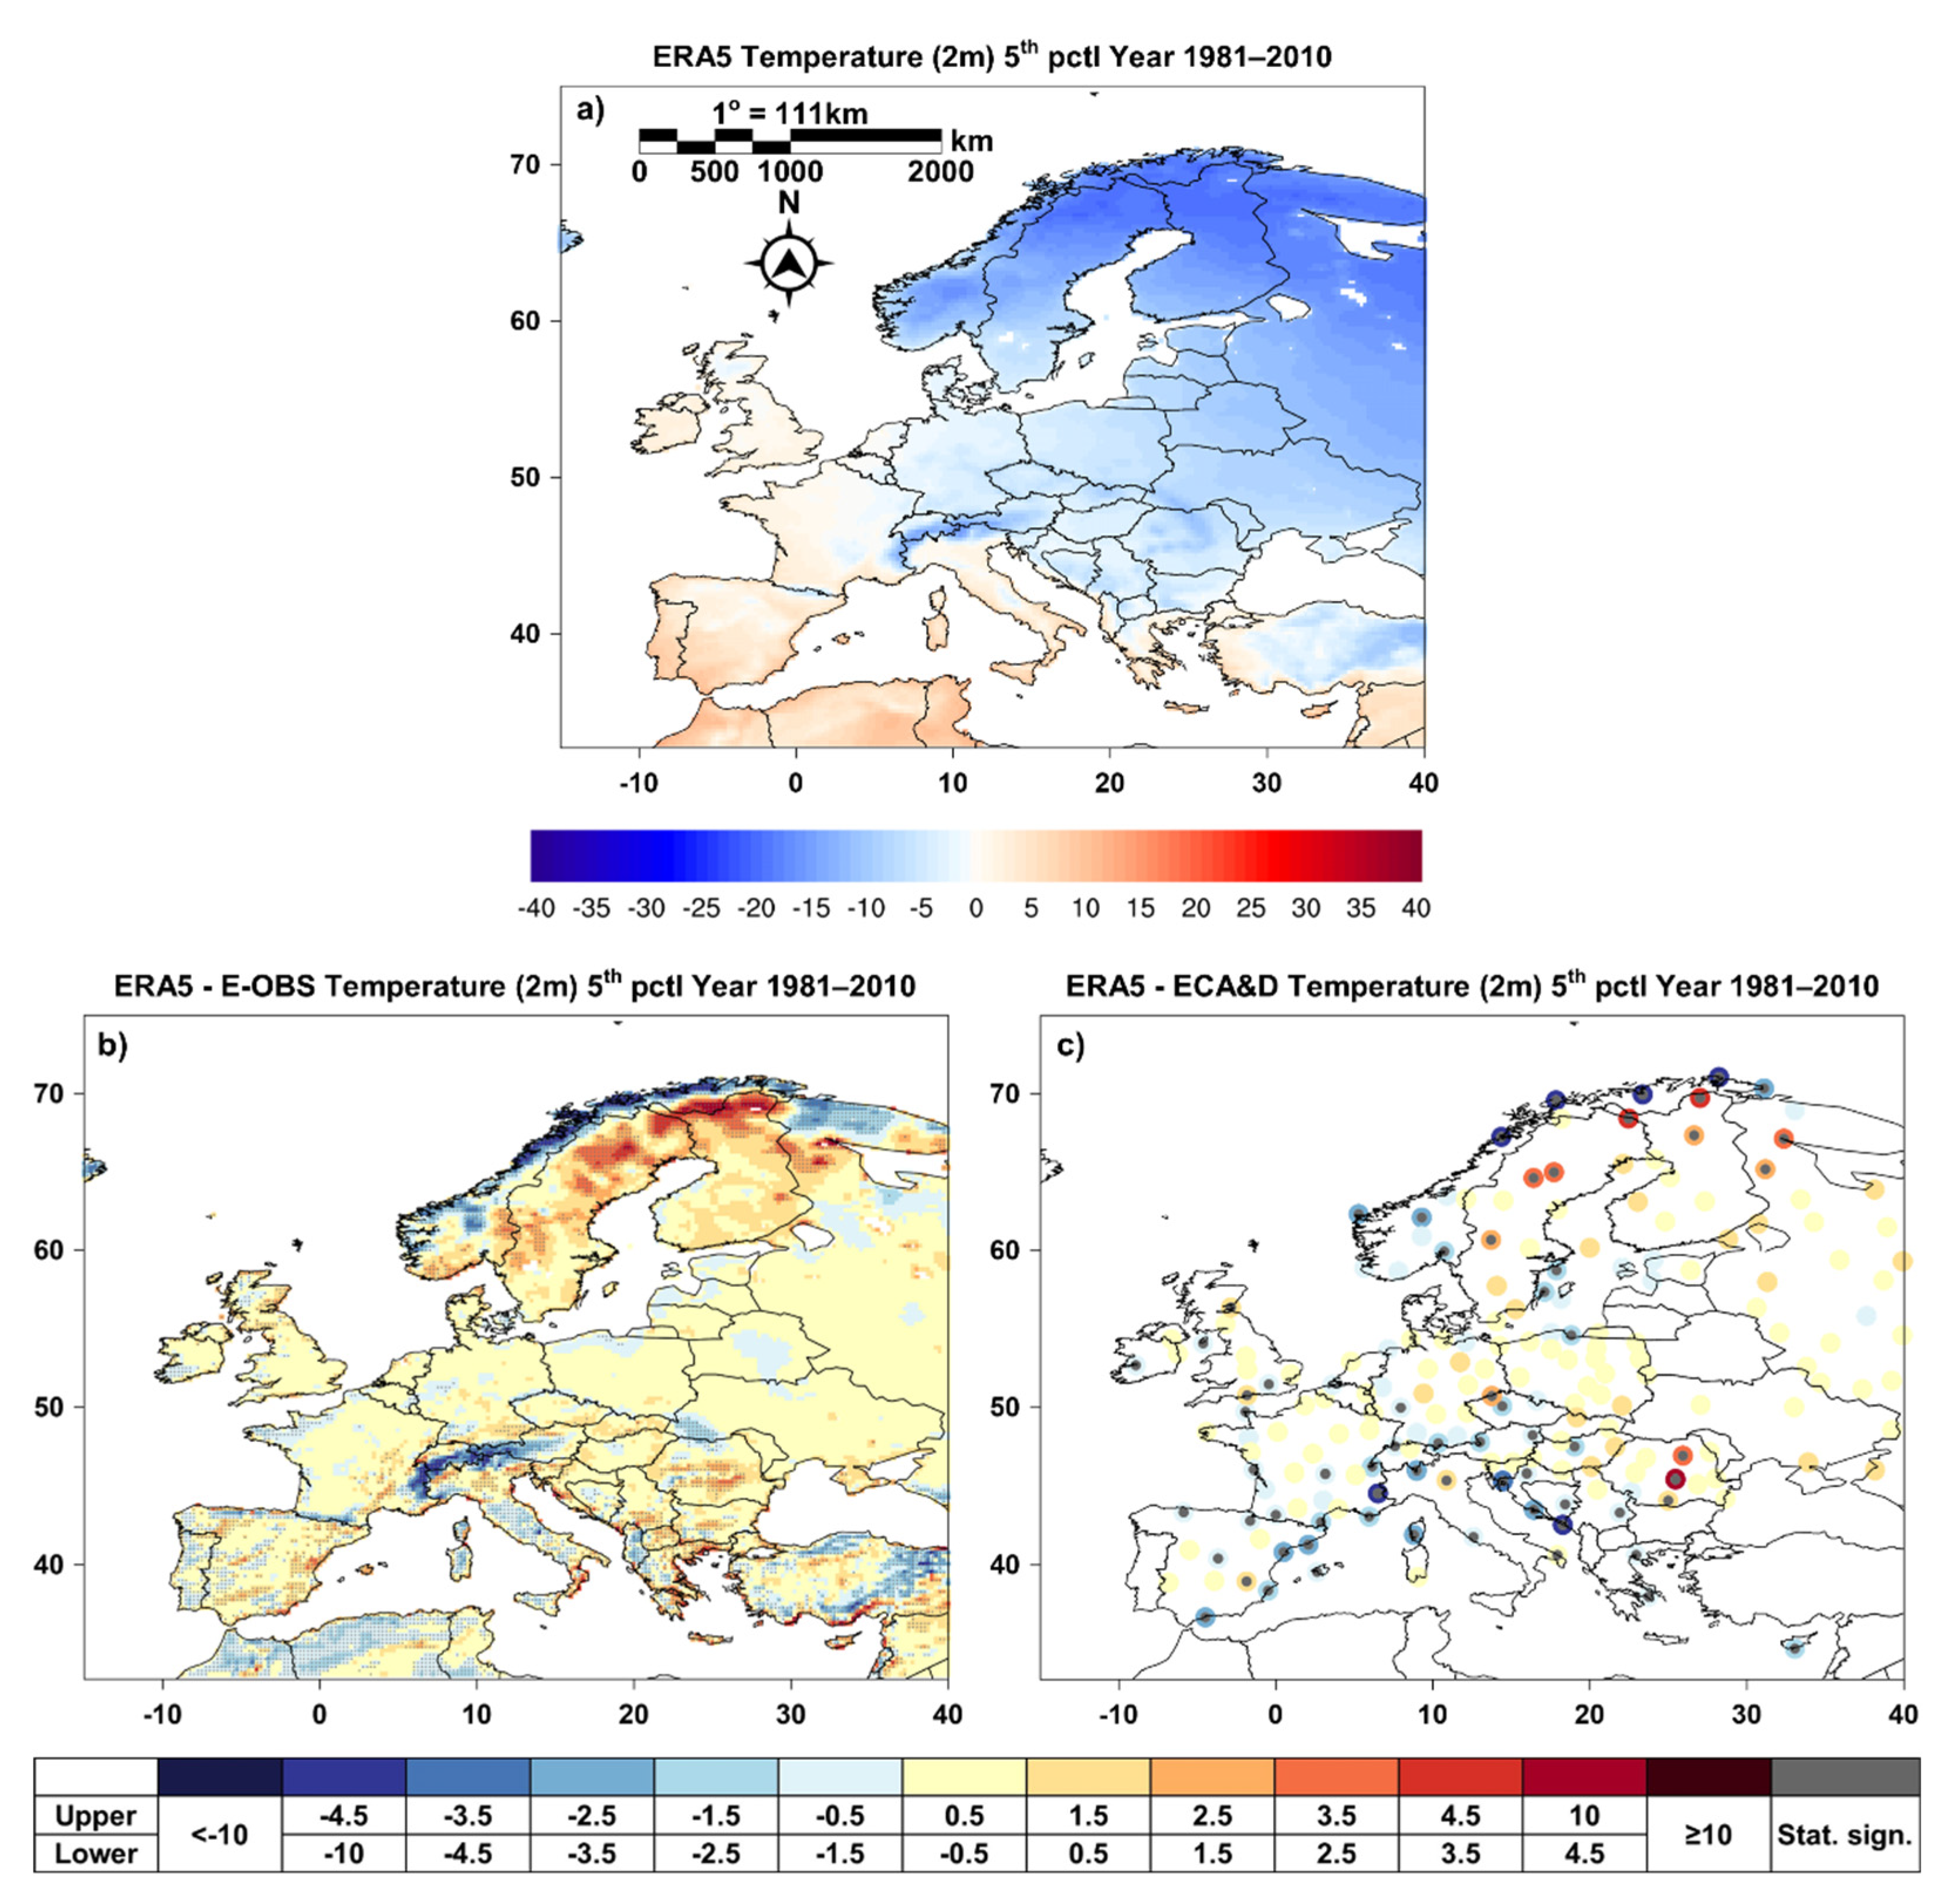
  • Regarding extreme low temperatures, the weakest performance of ERA5 was noted over the northern and southern regions of Europe.
  • The results of the 95th percentile are different, and ERA5 generally overestimates the high mean temperatures (not statistically significant differences).
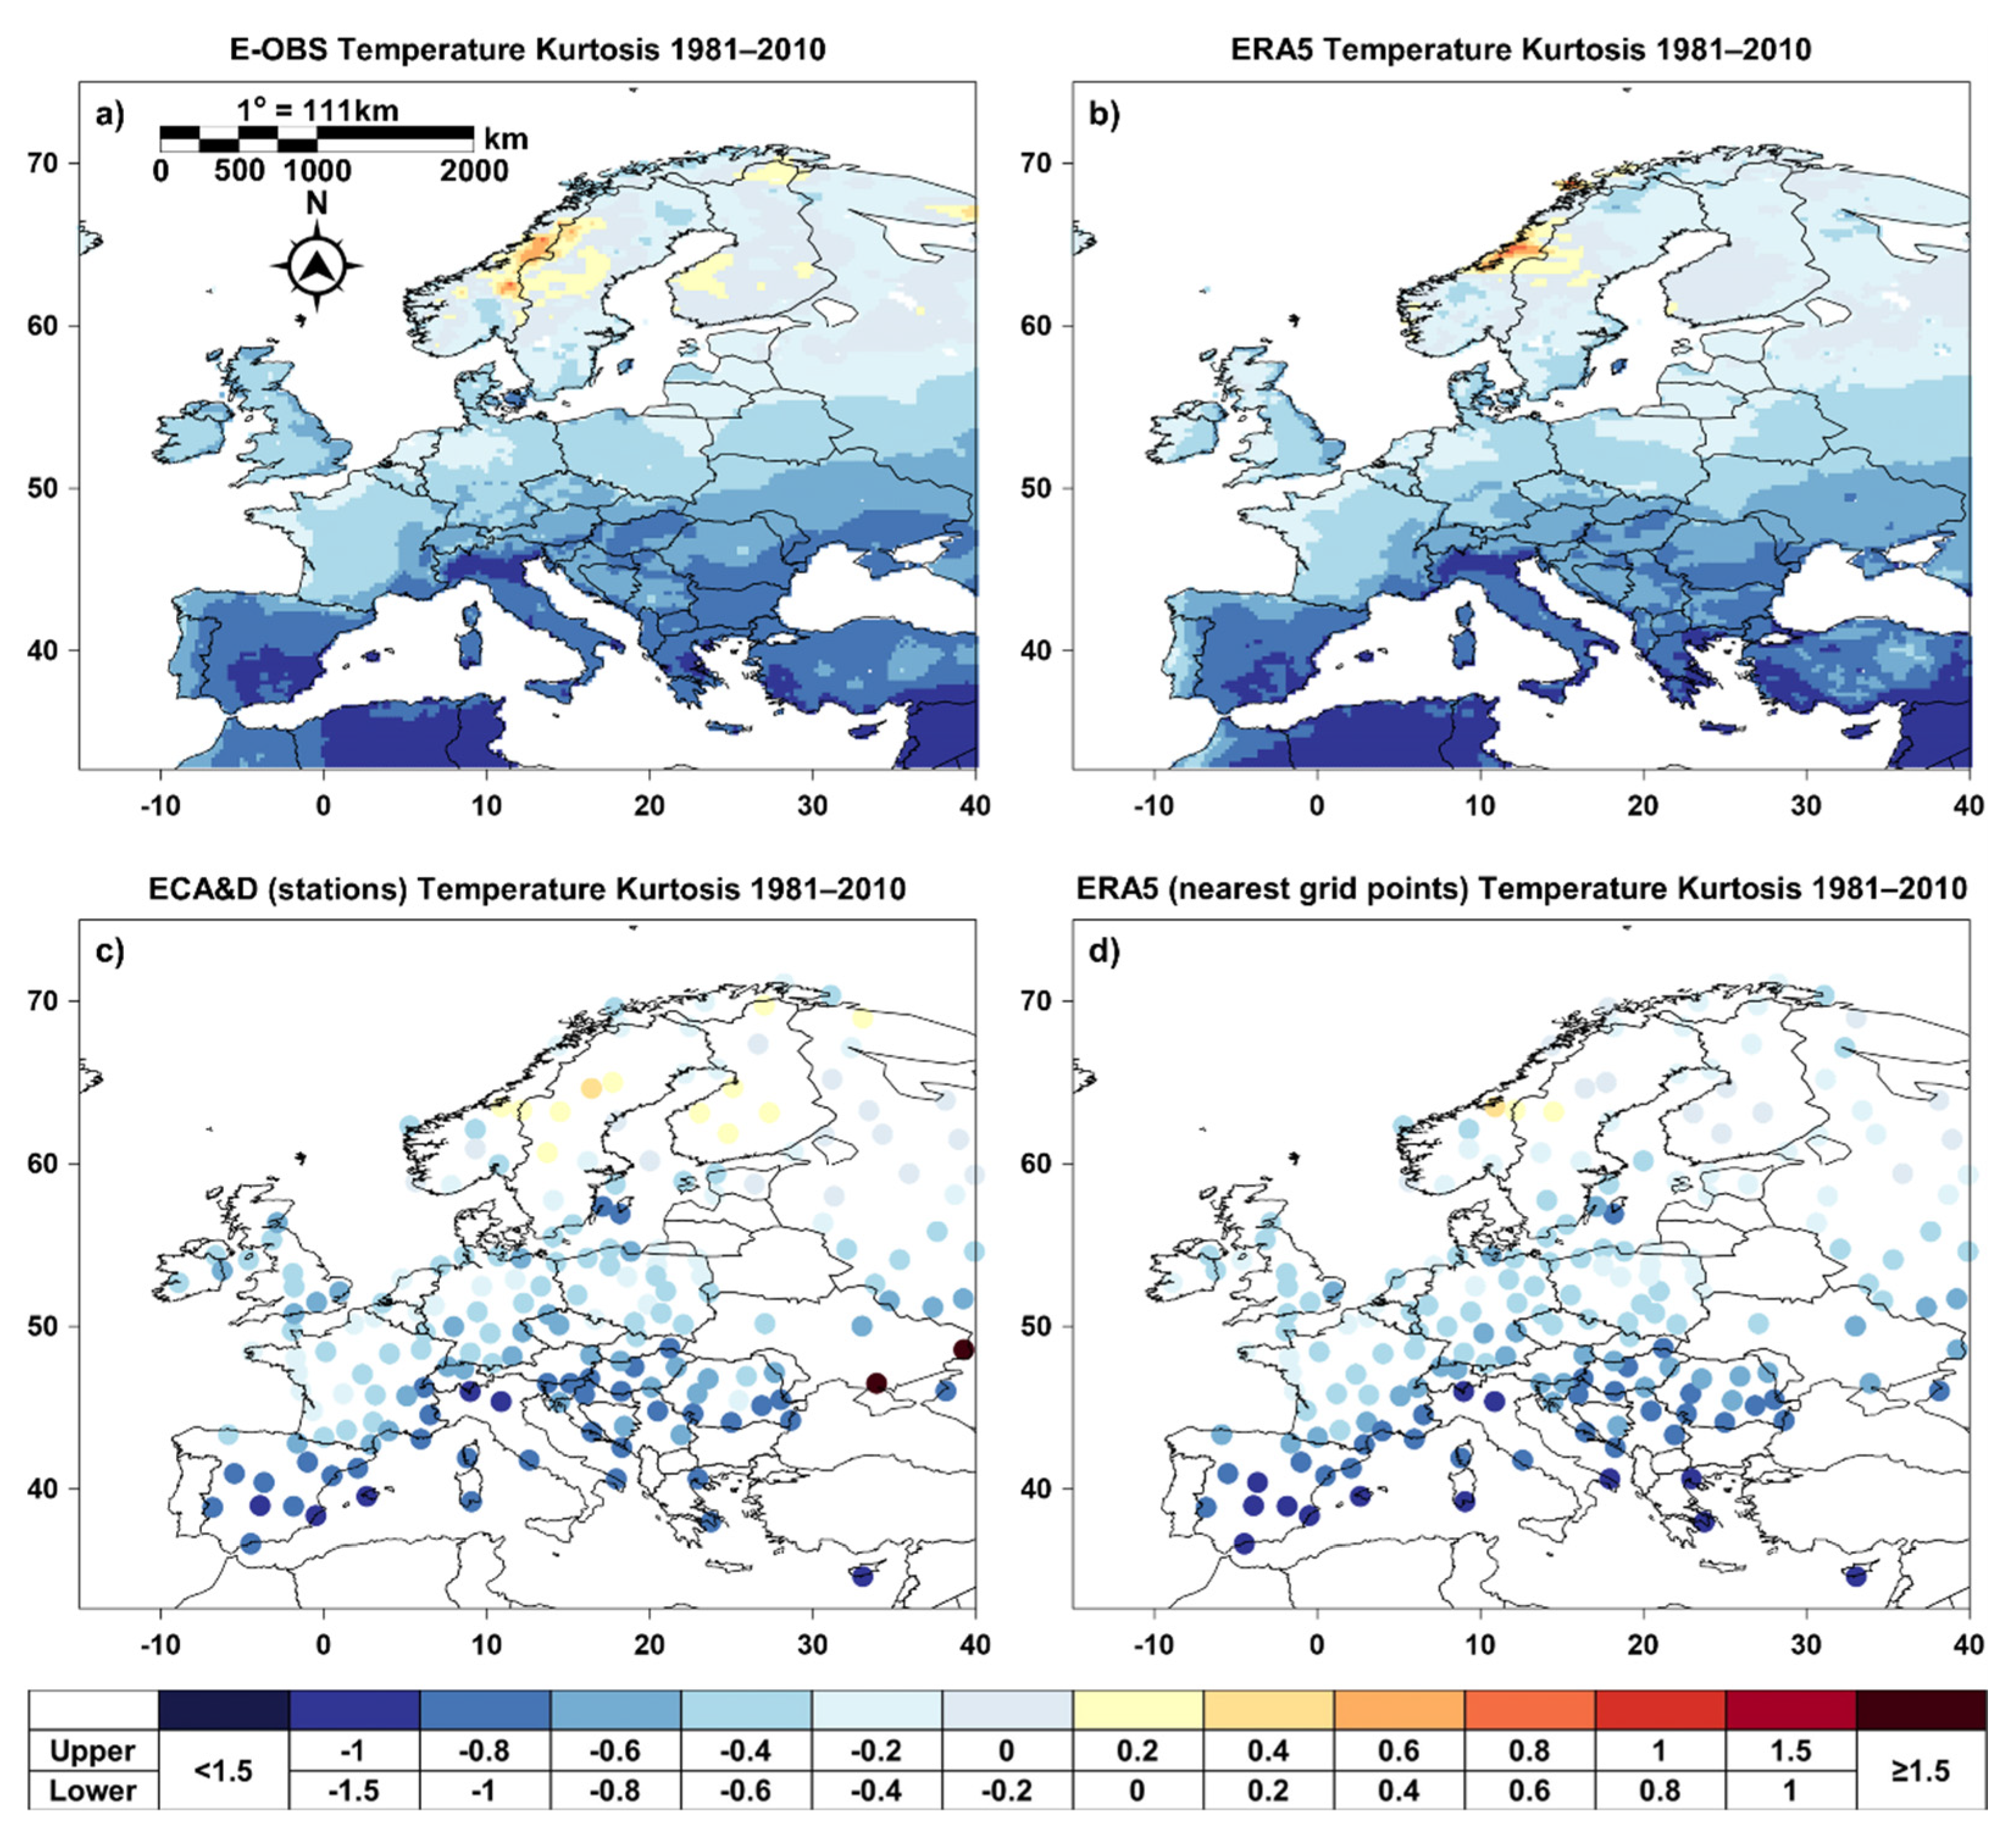
  • The examination of the temperature statistics among the compared datasets showed that ERA5 presents more extreme values (southern to 40° latitude) and less extreme temperatures in areas over the Black Sea.
  • In Scandinavia, ERA5 temperatures are often more extreme than the observational ones.

Author Contributions

Conceptualization, K.T. and C.A.; Data curation, K.V. and G.L.; Supervision, K.T. and C.A.; Validation, K.V. and G.L.; Visualization, K.V. and G.L.; Writing–original draft, K.V. and G.L.; Writing–review & editing, K.T. and C.A. All authors have read and agreed to the published version of the manuscript.

Funding

This research received no external funding.

Institutional Review Board Statement

Not applicable.

Informed Consent Statement

Not applicable.

Data Availability Statement

Publicly available datasets were analyzed in this study. The ERA5 dataset is available online at https://cds.climate.copernicus.eu/cdsapp#!/dataset/reanalysis-era5-single-levels?tab=form (1 February 2021). The E-OBS dataset is available online at https://www.ecad.eu/download/ensembles/download.php (1 February 2021). The ECA&D dataset is available online at https://www.ecad.eu/dailydata/predefinedseries.php (1 February 2021).

Acknowledgments

Part of the results presented in this work have been produced using the Aristotle University of Thessaloniki (AUTh) High Performance Computing Infrastructure and Resources.

Conflicts of Interest

The authors declare no conflict of interest.

References

  1. Acharya, S.C.; Nathan, R.; Wang, Q.J.; Su, C.-H.; Eizenberg, N. An evaluation of daily precipitation from a regional atmospheric reanalysis over Australia. Hydrol. Earth Syst. Sci. 2019, 23, 3387–3403. [Google Scholar] [CrossRef] [Green Version]
  2. Jiang, Q.; Li, W.; Fan, Z.; He, X.; Sun, W.; Chen, S.; Wen, J.; Gao, J.; Wang, J. Evaluation of the ERA5 reanalysis precipitation dataset over Chinese Mainland. J. Hydrol. 2021, 595, 125660:1–125660:15. [Google Scholar] [CrossRef]
  3. Tarek, M.; Brissette, F.P.; Arsenault, R. Evaluation of the ERA5 reanalysis as a potential reference dataset for hydrological modelling over North America. Hydrol. Earth Syst. Sci. 2020, 24, 2527–2544. [Google Scholar] [CrossRef]
  4. Isotta, F.A.; Vogel, R.; Frei, C. Evaluation of European regional reanalyses and downscalings for precipitation in the Alpine region. Meteorol. Z. 2015, 24, 15–37. [Google Scholar] [CrossRef]
  5. Yang, K.; Zhang, J. Evaluation of reanalysis datasets against observational soil temperature data over China. Clim. Dyn. 2018, 50, 317–337. [Google Scholar] [CrossRef]
  6. Rapaić, M.; Brown, R.; Markovic, M.; Chaumont, D. An evaluation of temperature and precipitation surface-based and reanalysis datasets for the Canadian Arctic, 1950–2010. Atmos.-Ocean 2015, 53, 283–303. [Google Scholar] [CrossRef]
  7. Shah, R.; Mishra, V. Evaluation of the reanalysis products for the monsoon season droughts in India. J. Hydrometeorol. 2014, 15, 1575–1591. [Google Scholar] [CrossRef]
  8. Hagemann, S.; Arpe, K.; Bengtsson, L. Validation of the Hydrological Cycle of ERA40. Reports on Earth System Science; Max Planck Institute for Meteorology: Hamburg, Germany, 2005; ISBN 1614-1199. [Google Scholar]
  9. Bosilovich, M.G.; Robertson, F.R.; Chen, J. Global energy and water budgets in MERRA. J. Clim. 2011, 24, 5721–5739. [Google Scholar] [CrossRef]
  10. Zhang, L.; Kumar, A.; Wang, W. Influence of changes in observations on precipitation: A case study for the Climate Forecast System Reanalysis (CFSR). J. Geophys. Res. 2012, 117, D08105:1–D08105:14. [Google Scholar] [CrossRef] [Green Version]
  11. Hersbach, H.; Dee, D. ERA5 reanalysis is in production. In ECMWF Newsletter No. 147; Lentze, G., Ed.; European Centre for Medium-Range Weather Forecasts (ECMWF): Reading, UK, 2016; p. 7. [Google Scholar]
  12. Xu, X.; Frey, S.K.; Boluwade, A.; Erler, A.R.; Khader, O.; Lapen, D.R.; Sudicky, E. Evaluation of variability among different precipitation products in Northern Great Plains. J. Hydrol. Reg. Stud. 2019, 24, 100608:1–100608:18. [Google Scholar] [CrossRef]
  13. Amjad, M.; Yilmaz, M.T.; Yucel, I.; Yilmaz, K.K. Performance evaluation of satellite- and model- based precipitation products over varying climate and complex topography. J. Hydrol. 2020, 584, 124707:1–124707:17. [Google Scholar] [CrossRef]
  14. Nogueira, M. Inter-comparison of ERA-5, ERA-interim and GPCP rainfall over the last 40 years: Process-based analysis of systematic and random differences. J. Hydrol. 2020, 583, 124632:1–124632:17. [Google Scholar] [CrossRef]
  15. Urraca, R.; Huld, T.; Gracia-Amillo, A.; Martinez-de-Pison, F.J.; Kaspar, F.; Sanz-Garcia, A. Evaluation of global horizontal irradiance estimates from ERA5 and COSMO-REA6 reanalyses using ground and satellite-based data. Sol. Energy 2018, 164, 339–354. [Google Scholar] [CrossRef]
  16. Johannsen, F.; Ermida, S.; Martins, J.P.A.; Trigo, I.F.; Nogueira, M.; Dutra, E. Cold bias of ERA5 summertime daily maximum land surface temperature over Iberian Peninsula. Remote Sens. 2019, 11, 2570. [Google Scholar] [CrossRef] [Green Version]
  17. Jourdier, B. Evaluation of ERA5, MERRA-2, COSMO-REA6, NEWA and AROME to simulate wind power production over France. Adv. Sci. Res. 2020, 17, 63–77. [Google Scholar] [CrossRef]
  18. Luo, B.; Minnett, P.J. Evaluation of the ERA5 sea surface skin temperature with remotely-sensed shipborne marine-atmospheric emitted radiance interferometer data. Remote Sens. 2020, 12, 1873. [Google Scholar] [CrossRef]
  19. Urban, A.; Di Napoli, C.; Cloke, H.L.; Kyselý, J.; Pappenberger, F.; Sera, F.; Schneider, R.; Vicedo-Cabrera, A.M.; Acquaotta, F.; Ragettli, M.S.; et al. Evaluation of the ERA5 reanalysis-based Universal Thermal Climate Index on mortality data in Europe. Environ. Res. 2021, 198, 111227:1–111227:12. [Google Scholar] [CrossRef]
  20. Hersbach, H.; Bell, B.; Berrisford, P.; Horányi, A.; Sabater, J.M.; Nicolas, J.; Radu, R.; Schepers, D.; Simmons, A.; Soci, C.; et al. Global reanalysis: Goodbye ERA-Interim, hello ERA5. In ECMWF Newsletter No. 159; Lentze, G., Ed.; European Centre for Medium-Range Weather Forecasts (ECMWF): Reading, UK, 2019; pp. 17–24. [Google Scholar] [CrossRef]
  21. Gleixner, S.; Demissie, T.; Diro, G.T. Did ERA5 improve temperature and precipitaqtion reanalysis over East Africa? Atmosphere 2020, 11, 996. [Google Scholar] [CrossRef]
  22. Klein Tank, A.M.G.; Wijngaard, J.B.; Können, G.P.; Böhm, R.; Demarée, G.; Gocheva, A.; Mileta, M.; Pashiardis, S.; Hejkrlik, L.; Kern-Hansen, C.; et al. Daily dataset of 20th-century surface air temperature and precipitation series for the European Climate Assessment. Int. J. Climatol. 2002, 22, 1441–1453. [Google Scholar] [CrossRef]
  23. Haylock, M.R.; Hofstra, N.; Klein Tank, A.M.G.; Klok, E.J.; Jones, P.D.; New, M. A European daily high-resolution gridded data set of surface temperature and precipitation for 1950–2006. J. Geophys. Res. Atmos. 2008, 113, D20119:1–D20119:12. [Google Scholar] [CrossRef] [Green Version]
  24. Kotlarski, S.; Keuler, K.; Christensen, O.B.; Colette, A.; Déqué, M.; Gobiet, A.; Goergen, K.; Jacob, D.; Lüthi, D.; van Meijgaard, E.; et al. Regional climate modeling on European scales: A joint standard evaluation of the EURO-CORDEX RCM ensemble. Geosci. Model Dev. 2014, 7, 1297–1333. [Google Scholar] [CrossRef] [Green Version]
  25. Karl, T.R.; Meehl, G.A.; Miller, C.D.; Hassol, S.J.; Waple, A.M.; Murray, W.L. Weather and Climate Extremes in a Changing Climate. Regions of Focus: North America, Hawaii, Caribbean and U.S. Pacific Islands. A Report by the U.S. Climate Change Science Program and the Subcommittee on Global Change Research; Department of Commerce, NOAA’s National Climatic Data Center: Washington, DC, USA, 2008.
  26. Coelho, C.A.S.; Ferro, C.A.T.; Stephenson, D.B.; Steinskog, D.J. Methods for exploring spatial and temporal variability of extreme events in climate data. J. Clim. 2008, 21, 2072–2092. [Google Scholar] [CrossRef] [Green Version]
  27. Heikkilä, U.; Sandvik, A.; Sorteberg, A. Dynamical downscaling of ERA-40 in complex terrain using the WRF regional climate model. Clim. Dyn. 2011, 37, 1551–1564. [Google Scholar] [CrossRef] [Green Version]
  28. Bandhauer, M.; Isotta, F.; Lakatos, M.; Lussana, C.; Båserud, L.; Izsák, B.; Szentes, O.; Tveito, O.E.; Frei, C. Evaluation of daily precipitation analyses in E-OBS (v19.0e) and ERA5 by comparison to regional high-resolution datasets in European regions. Int. J. Climatol. 2022, 42, 727–747. [Google Scholar] [CrossRef]
  29. Mahto, S.S.; Mishra, V. Does ERA-5 outperform other reanalysis products for hydrologic applications in India? J. Geophys. Res. Atmos. 2019, 124, 9423–9441. [Google Scholar] [CrossRef]
  30. Betts, A.K.; Chan, D.Z.; Desjardins, R.L. Near-surface biases in ERA5 over the Canadian Prairies. Front. Environ. Sci. 2019, 7, 129:1–129:17. [Google Scholar] [CrossRef]
  31. Wang, C.; Graham, R.M.; Wang, K.; Gerland, S.; Granskog, M.A. Comparison of ERA5 and ERA-Interim near-surface air temperature, snowfall and precipitation over Arctic sea ice: Effects on sea ice thermodynamics and evolution. Cryosphere 2019, 13, 1661–1679. [Google Scholar] [CrossRef] [Green Version]
  32. Keller, J.D.; Wahl, S. Representation od climate in reanalyses: An intercomparison for Europe and North America. J. Clim. 2021, 34, 1667–1684. [Google Scholar] [CrossRef]
  33. Rakhmatova, N.; Arushanov, M.; Shardakova, L.; Nishonov, B.; Taryannikova, R.; Rakhmatova, V.; Belikov, D.A. Evaluation of the perspective of ERA-Interim and ERA5 reanalyses for calculation of drought indicators for Uzbekistan. Atmosphere 2021, 12, 527. [Google Scholar] [CrossRef]
  34. Lazoglou, G.; Anagnostopoulou, C.; Tolika, K.; Kolyva-Machera, F. A review of statistical methods to analyze extreme precipitation and temperature events in the Mediterranean region. Theor. Appl. Climatol. 2019, 136, 99–117. [Google Scholar] [CrossRef]
  35. Lazoglou, G.; Gräler, B.; Anagnostopoulou, C. Simulation of extreme temperatures using a new method: TIN-copula. Int. J. Climatol. 2019, 39, 5201–5214. [Google Scholar] [CrossRef]
  36. Lazoglou, G.; Anagnostopoulou, C.; Tolika, K.; Gräler, B. Evaluation of a new statistical method–TIN-Copula–for the bias correction of climate models’ extreme parameters. Atmosphere 2020, 11, 243. [Google Scholar] [CrossRef] [Green Version]
Figure 1. The 196 ECA&D stations used (yellow dots) and the division of the domain into eight smaller subregions (white lines). The subregions are: the Alps (AL), the British Isles (BI), Eastern Europe (EA), France (FR), the Iberian Peninsula (IP), the Mediterranean (MD), Mid-Europe (ME), and Scandinavia (SC) [24].
Water 14 00543 g001
Figure 2. (a) The elevation of ERA5 and (b) the differences between ERA5 and E-OBS. Differences between ERA5 and E-OBS in the Alps region (c) with the default elevation and (d) with fixed elevation. Differences between ERA5 and E-OBS in the Mediterranean coast (Greece) (e) with the default elevation and (f) with fixed elevation.
Water 14 00543 g002
Figure 3. (a) Mean temperature (°C) and (b) standard deviation for ERA5, and the differences between (c) ERA5 and E-OBS, and (d) ERA5 and ECA&D stations.
Water 14 00543 g003
Figure 4. (a,b) Mean temperature (°C) and (c,d) standard deviation for ERA5, and the differences between (e,f) ERA5 and E-OBS, and (g,h) ERA5 and ECA&D stations during winter (left) and summer (right).
Water 14 00543 g004
Figure 5. Extreme low mean temperature (°C) (fifth percentile) for (a) ERA5, and the differences between (b) ERA5 and E-OBS, and (c) ERA5 and ECA&D stations.
Water 14 00543 g005
Figure 6. Extreme high mean temperature (°C) (95th percentile) for (a) ERA5, and the differences between (b) ERA5 and E-OBS, and (c) ERA5 and ECA&D stations.
Water 14 00543 g006
Figure 7. Density plot for temperature of (a) the highest positive difference, (b) no difference and (c) the highest negative difference between stations and ERA5. The grey area refers to the stations’ data and the red line refers to the corresponding ERA5 data.
Water 14 00543 g007
Figure 8. Temperature kurtosis excess for (a) E-OBS, (b) ERA5, (c) ECA&D stations and (d) the nearest to the stations grid points from the ERA5.
Water 14 00543 g008
Figure 9. Temperature skewness for (a) E-OBS, (b) ERA5, (c) ECA&D stations, and (d) those nearest to the stations’ grid points from the ERA5.
Water 14 00543 g009
Table 1. Correlation RMSE, mean bias, and Standard Deviation Bias (StDB) between the ERA5 dataset and E-OBS, and daily observation of ECA&D stations. Annual statistics are given for mean temperature for the eight European subregions.
ERA5–E-OBS
SubregionCorrelationRMSEMean BiasStDB
AL0.9970.66−0.190.63
BI0.9950.520.230.47
EA1.0000.220.110.20
FR0.9980.38−0.010.38
IP0.9980.370.040.37
MD0.9970.750.360.66
ME0.9990.370.020.37
SC1.0000.380.250.30
ERA5–ECA&D
SubregionCorrelationRMSEMean BiasStDB
AL0.9991.84−1.800.40
BI0.9950.51−0.060.51
EA1.0000.340.260.22
FR0.9980.61−0.450.41
IP0.9991.10−1.040.36
MD0.9981.39−1.320.43
ME0.9980.40−0.060.40
SC1.0000.37−0.250.27
Publisher’s Note: MDPI stays neutral with regard to jurisdictional claims in published maps and institutional affiliations.

