
Chemometric Evaluation of WWTPs’ Wastewaters and Receiving Surface Waters in Bulgaria


 ,
,  and
and 
Abstract
1. Introduction
2. Materials and Methods
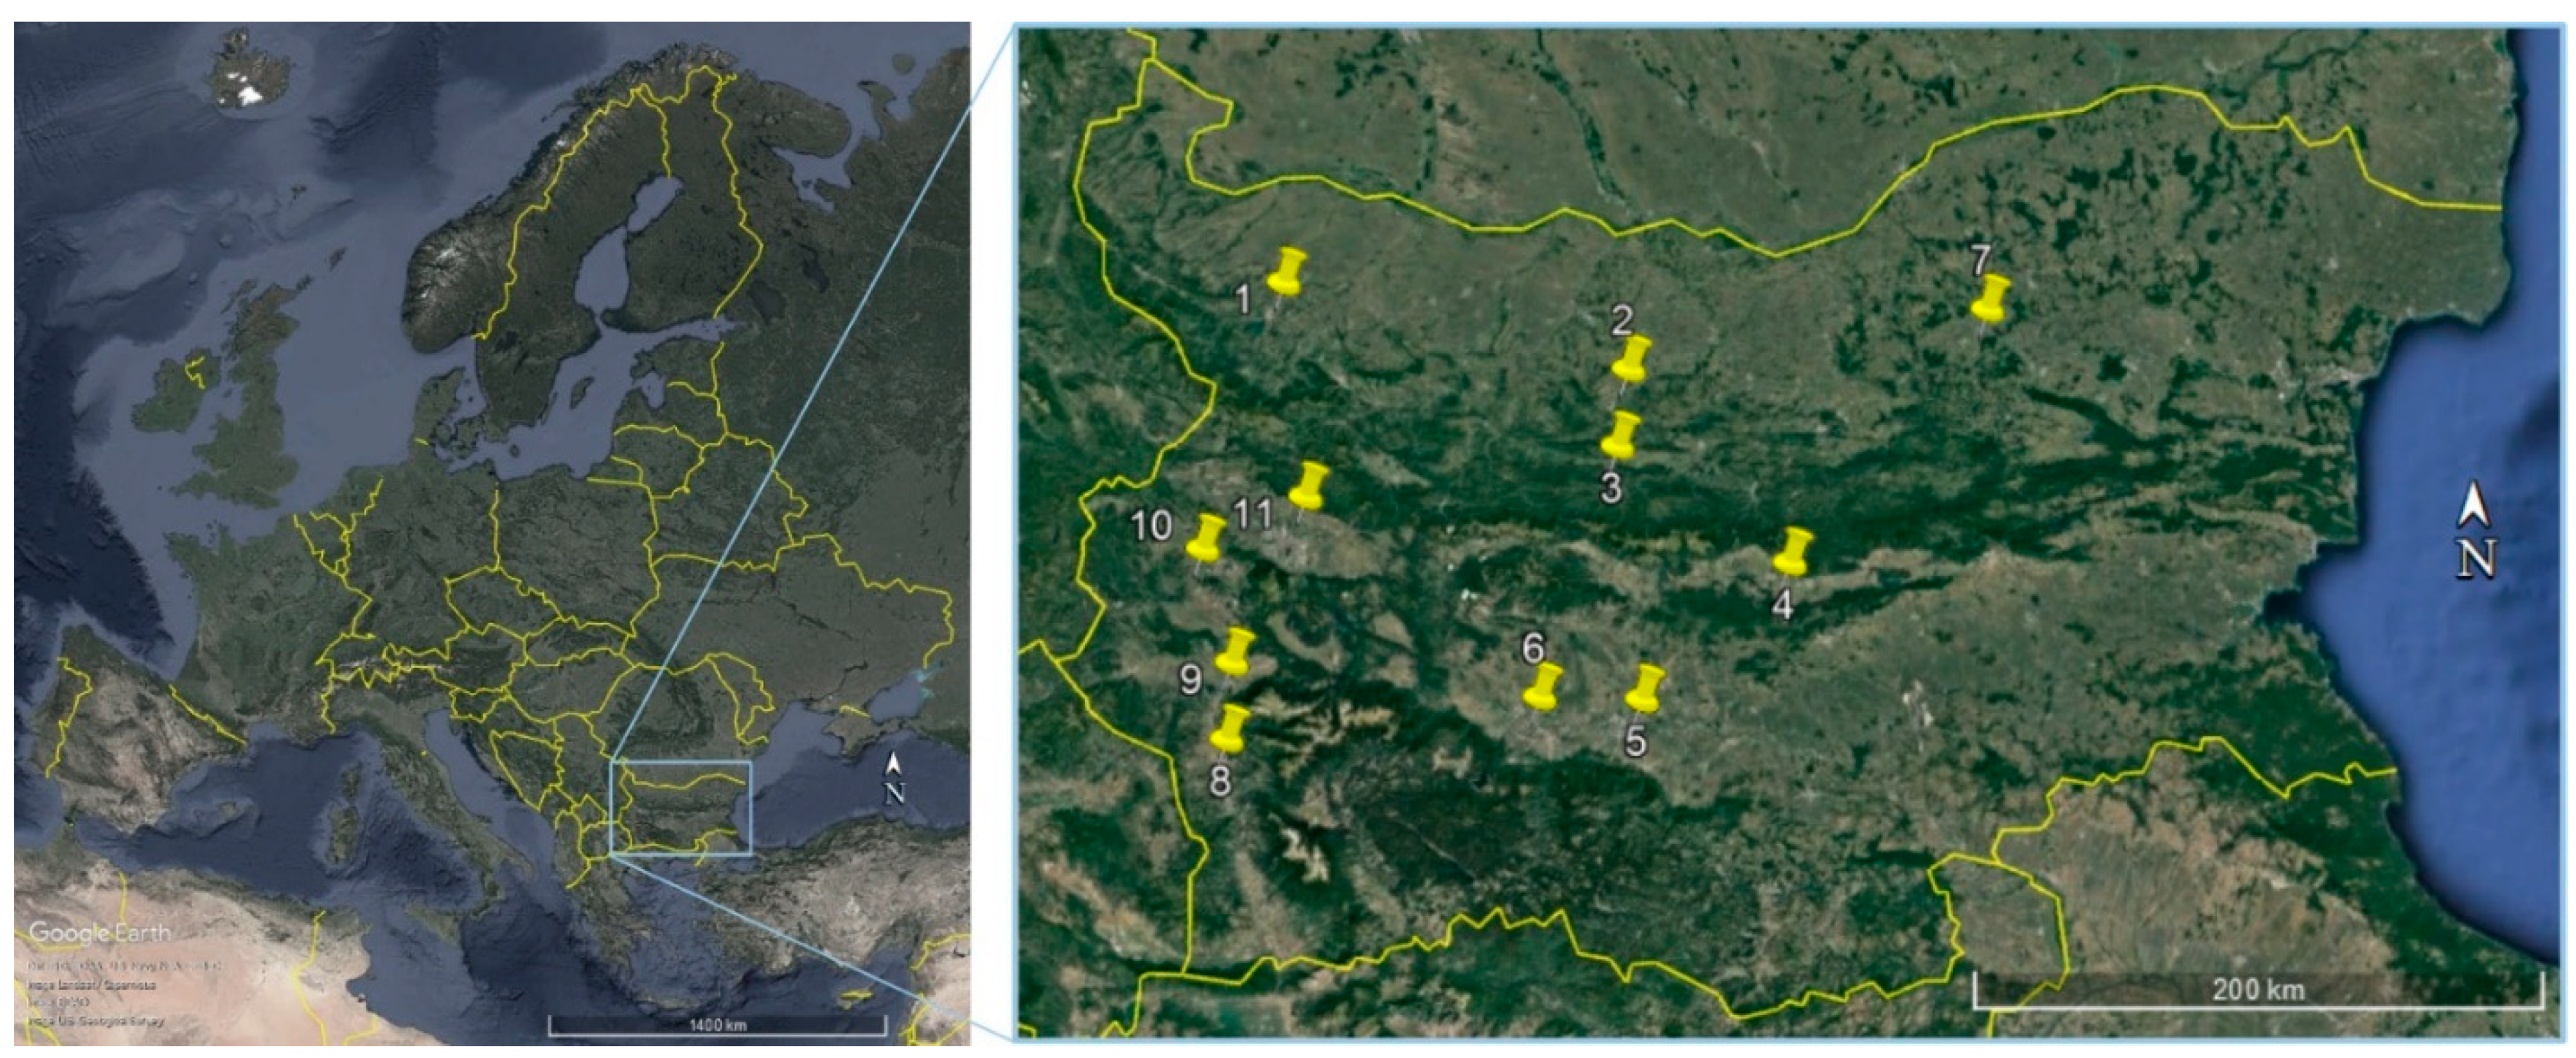
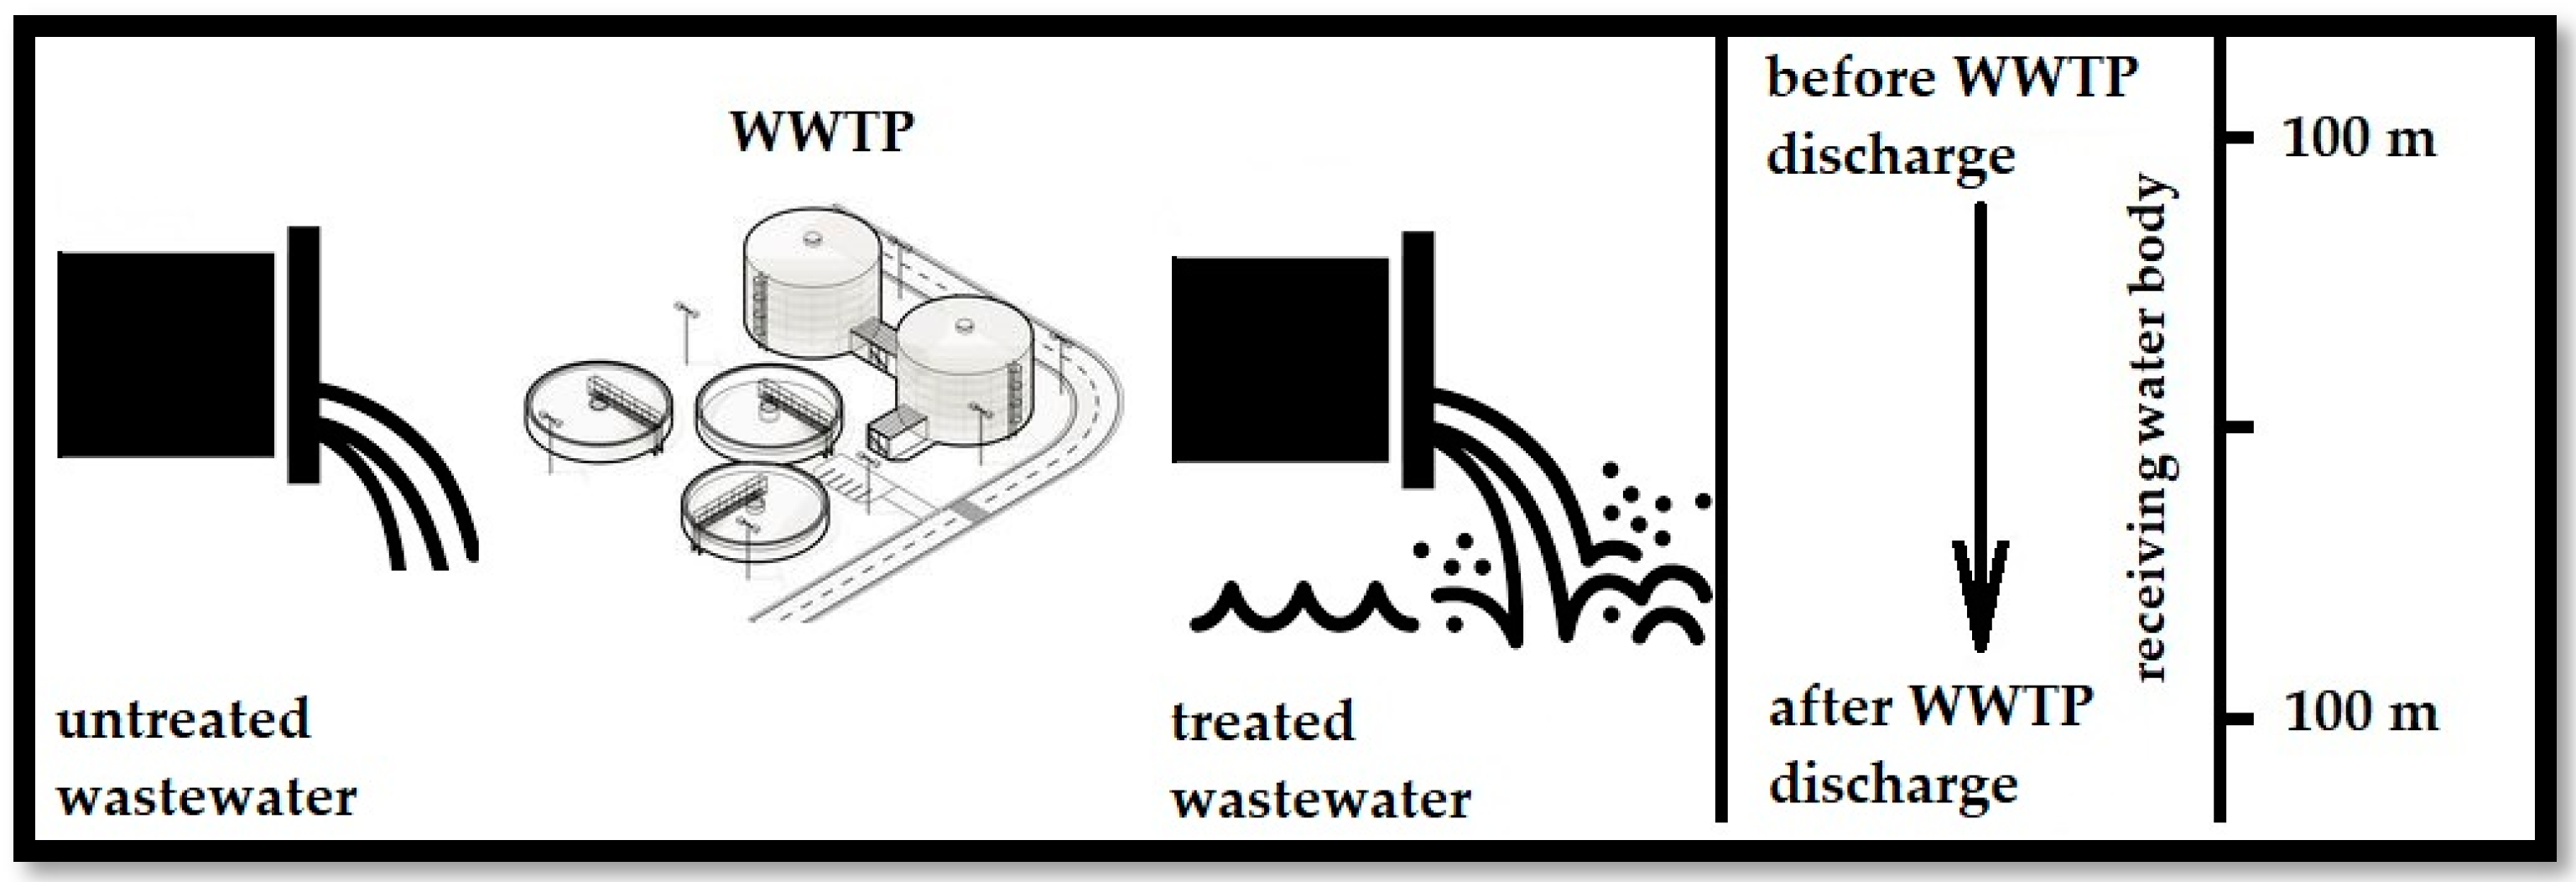
2.1. Sampling and Sample Preparation
2.2. Physicochemical Analysis
2.3. ICP-MS Method of Analysis
2.4. Ostracodtoxkit F™
- Ltest.end—mean length of organisms exposed to the tested sample [µm],
- Lcontrol.end—mean length of organisms exposed to the control sample [µm],
- L0—mean length of organisms at the beginning of the experiment [µm],
- Ntest—number of living organisms exposed to the tested sample after the experiment,
- Ncontrol—number of living organisms in the control after the experiment.
2.5. Phytotoxkit F™
- A—mean root length in the control sample [mm],
- B—mean root length in the tested sample [mm].
2.6. Multivariate Statistical Analysis
3. Results
3.1. Basic Statistics and Comparison with Environmental Quality Guidelines
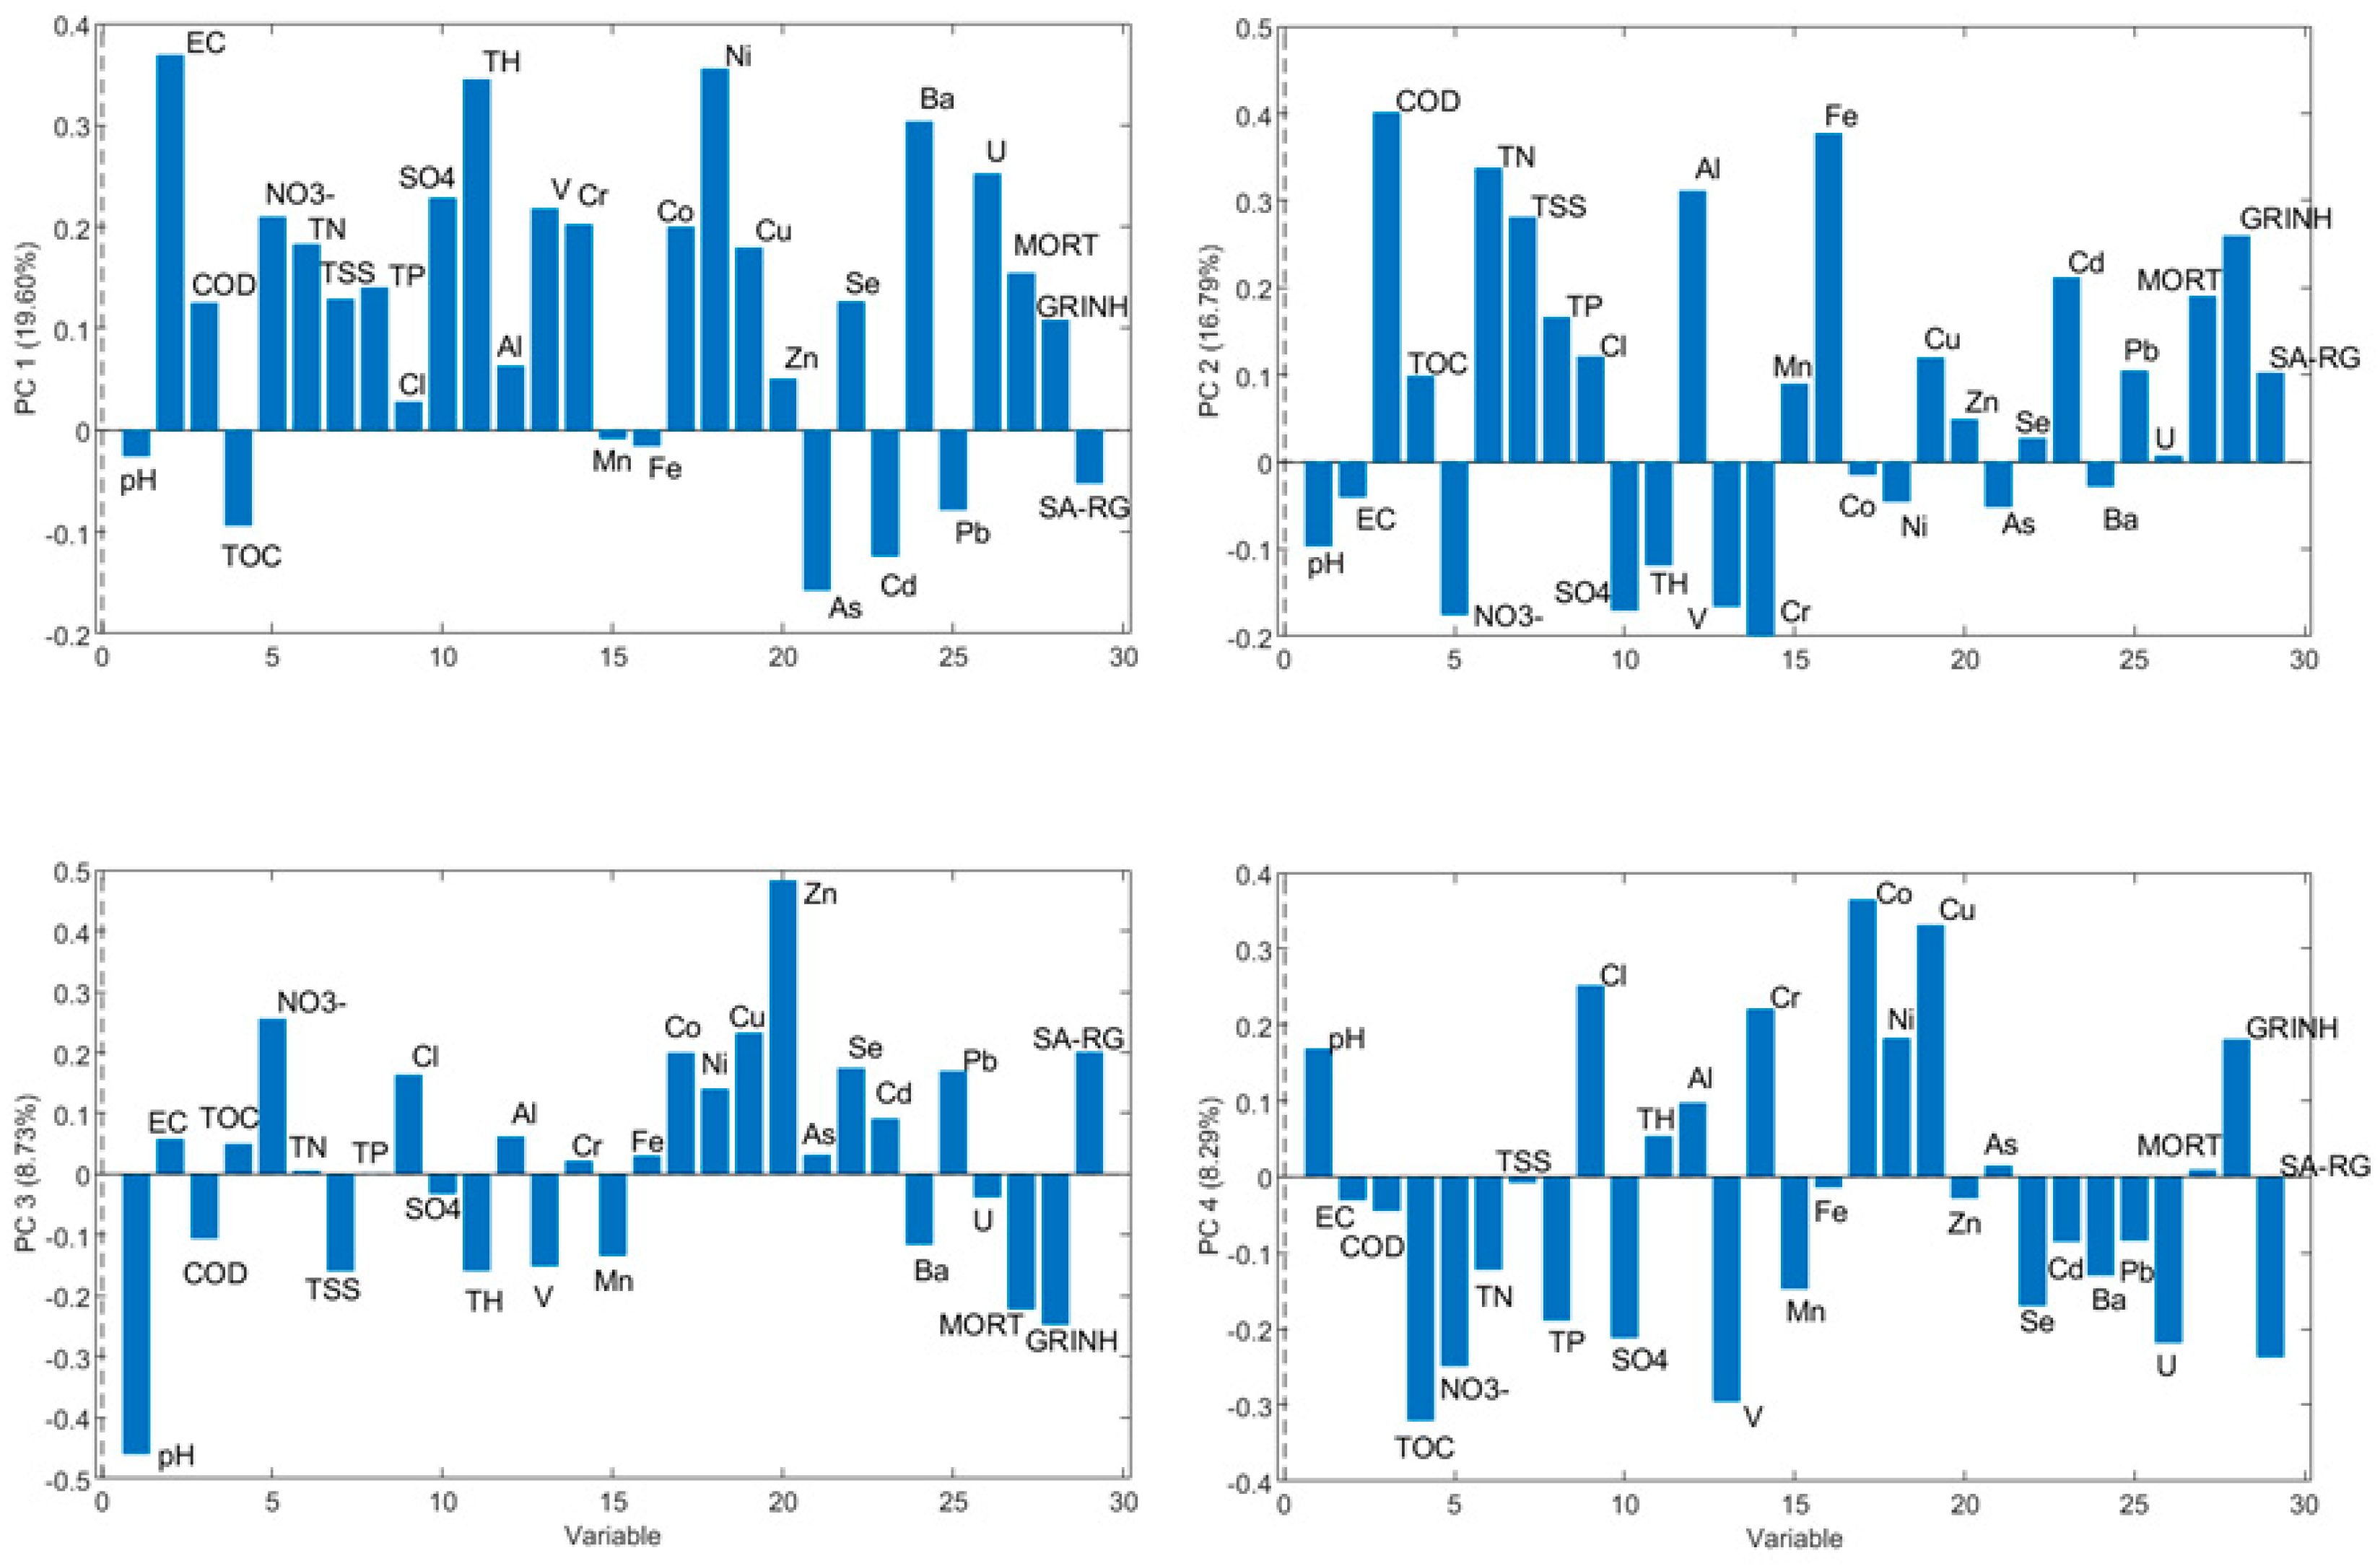
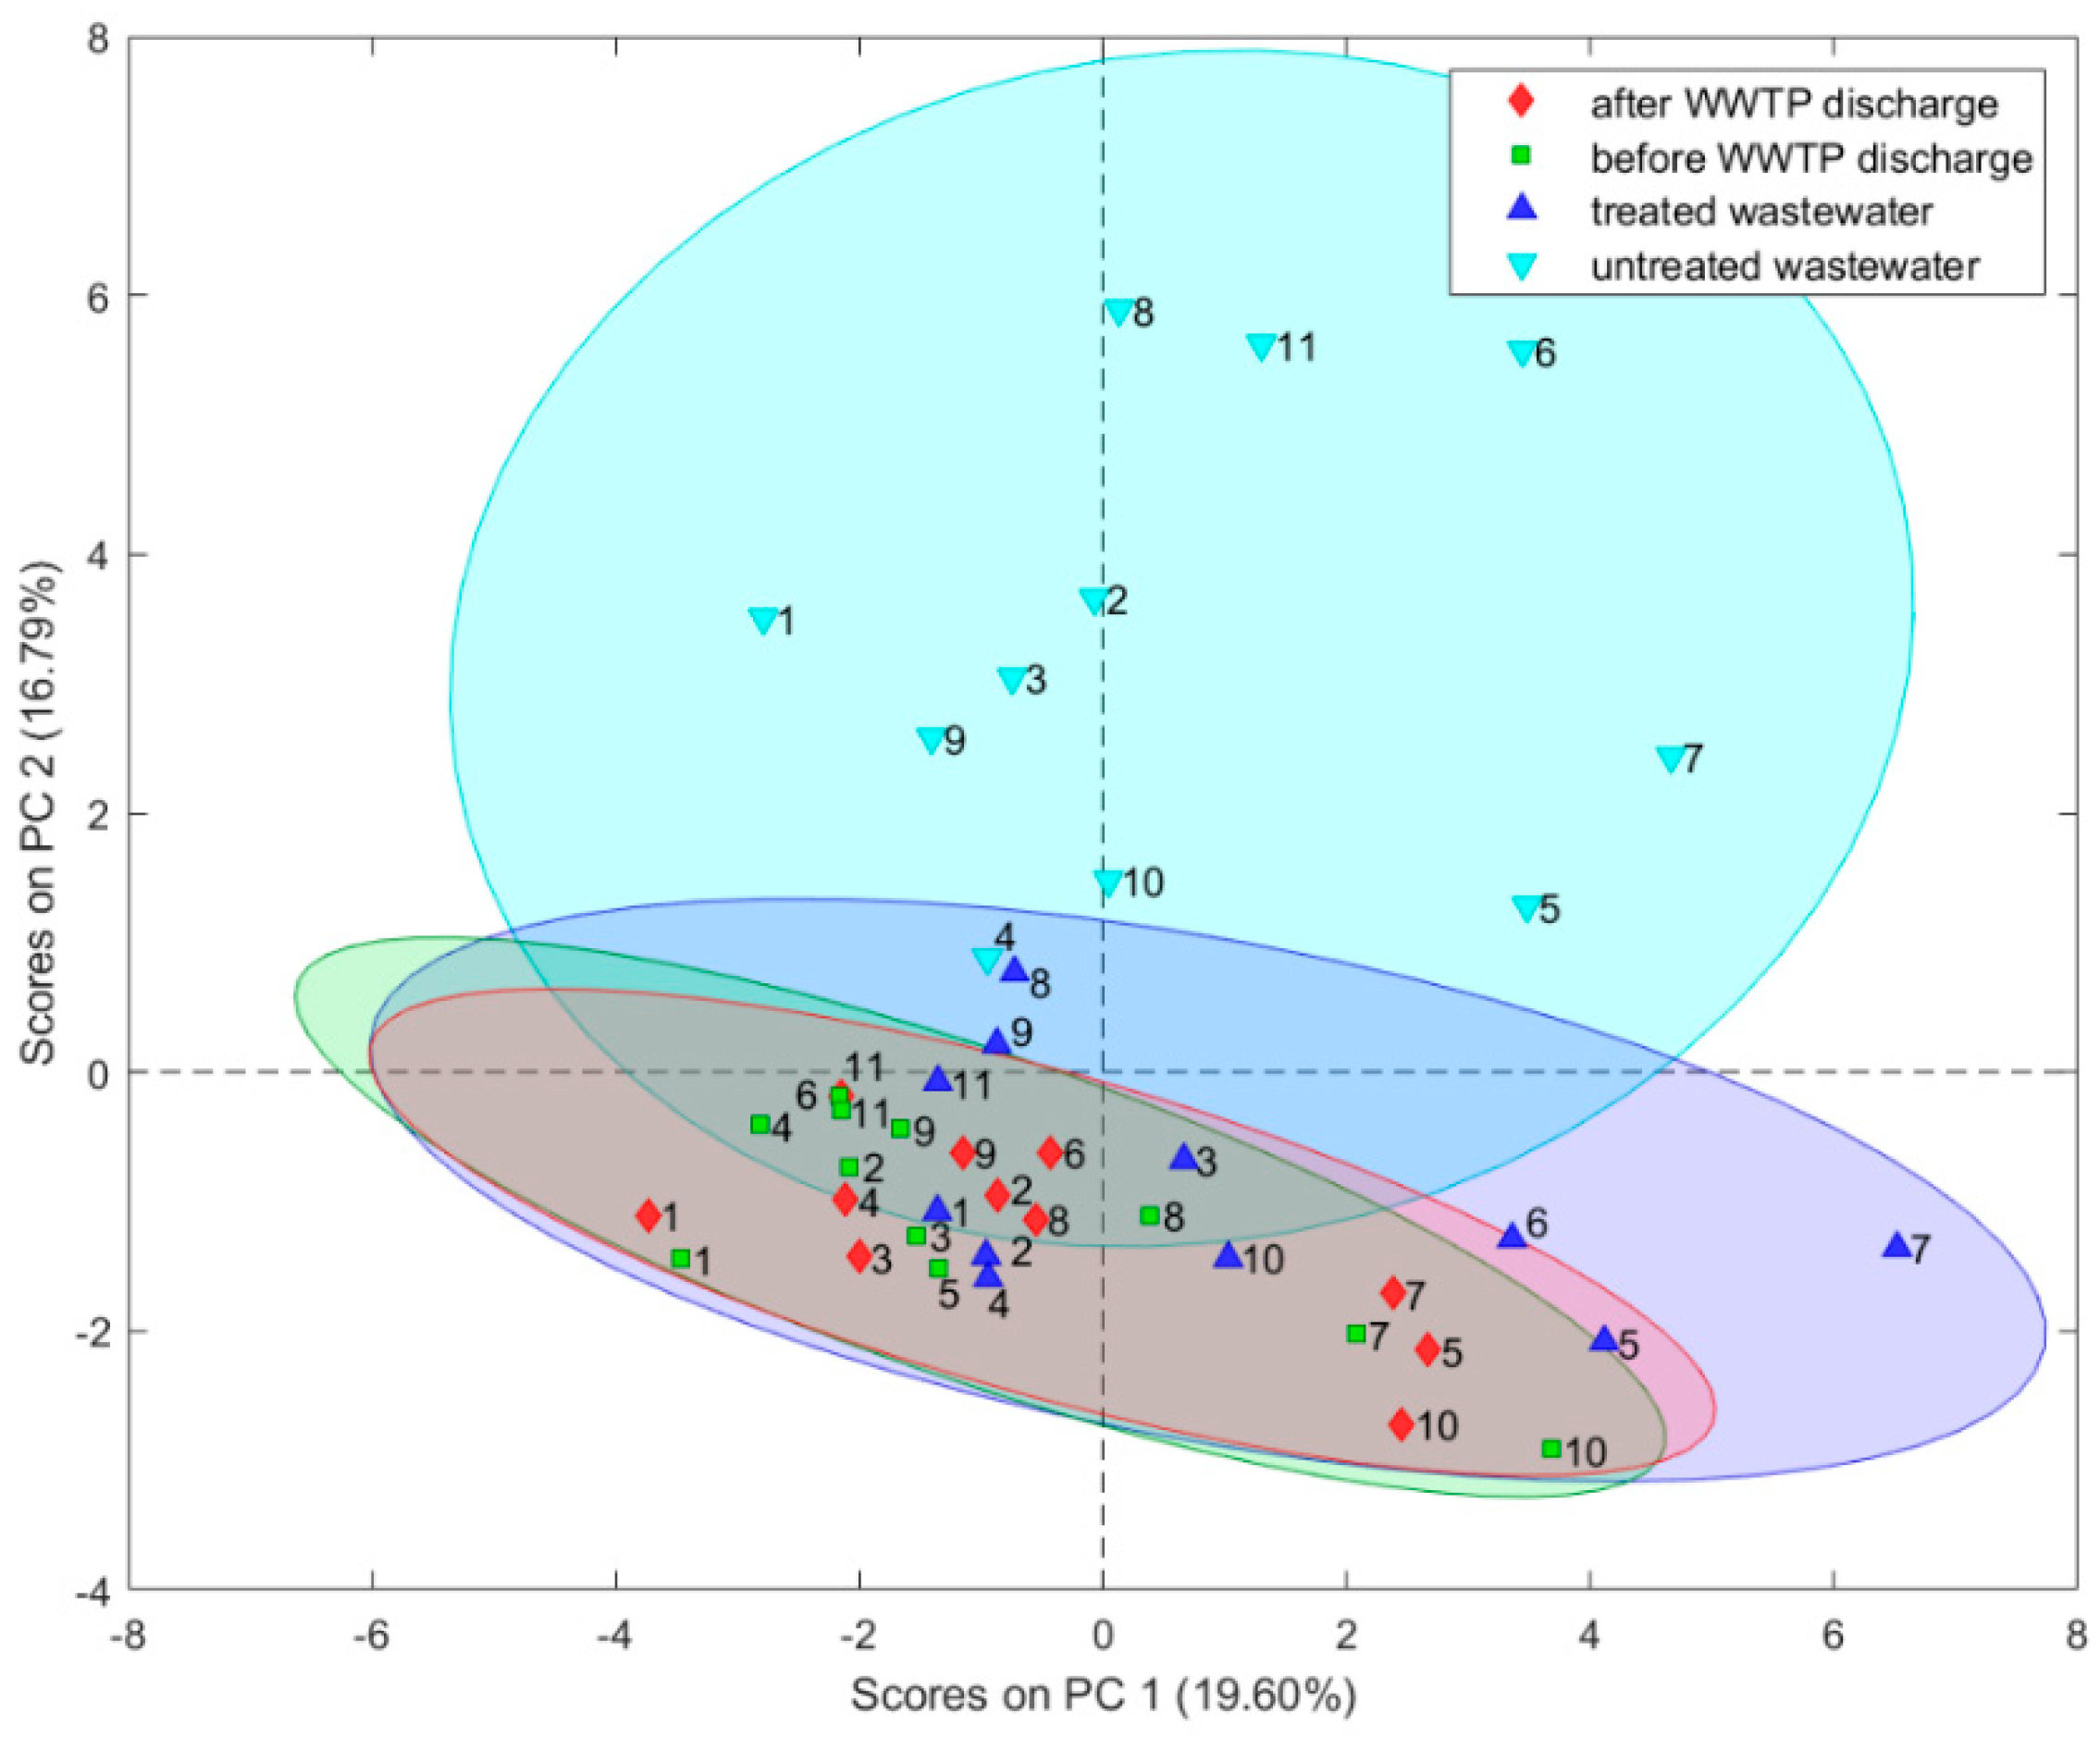
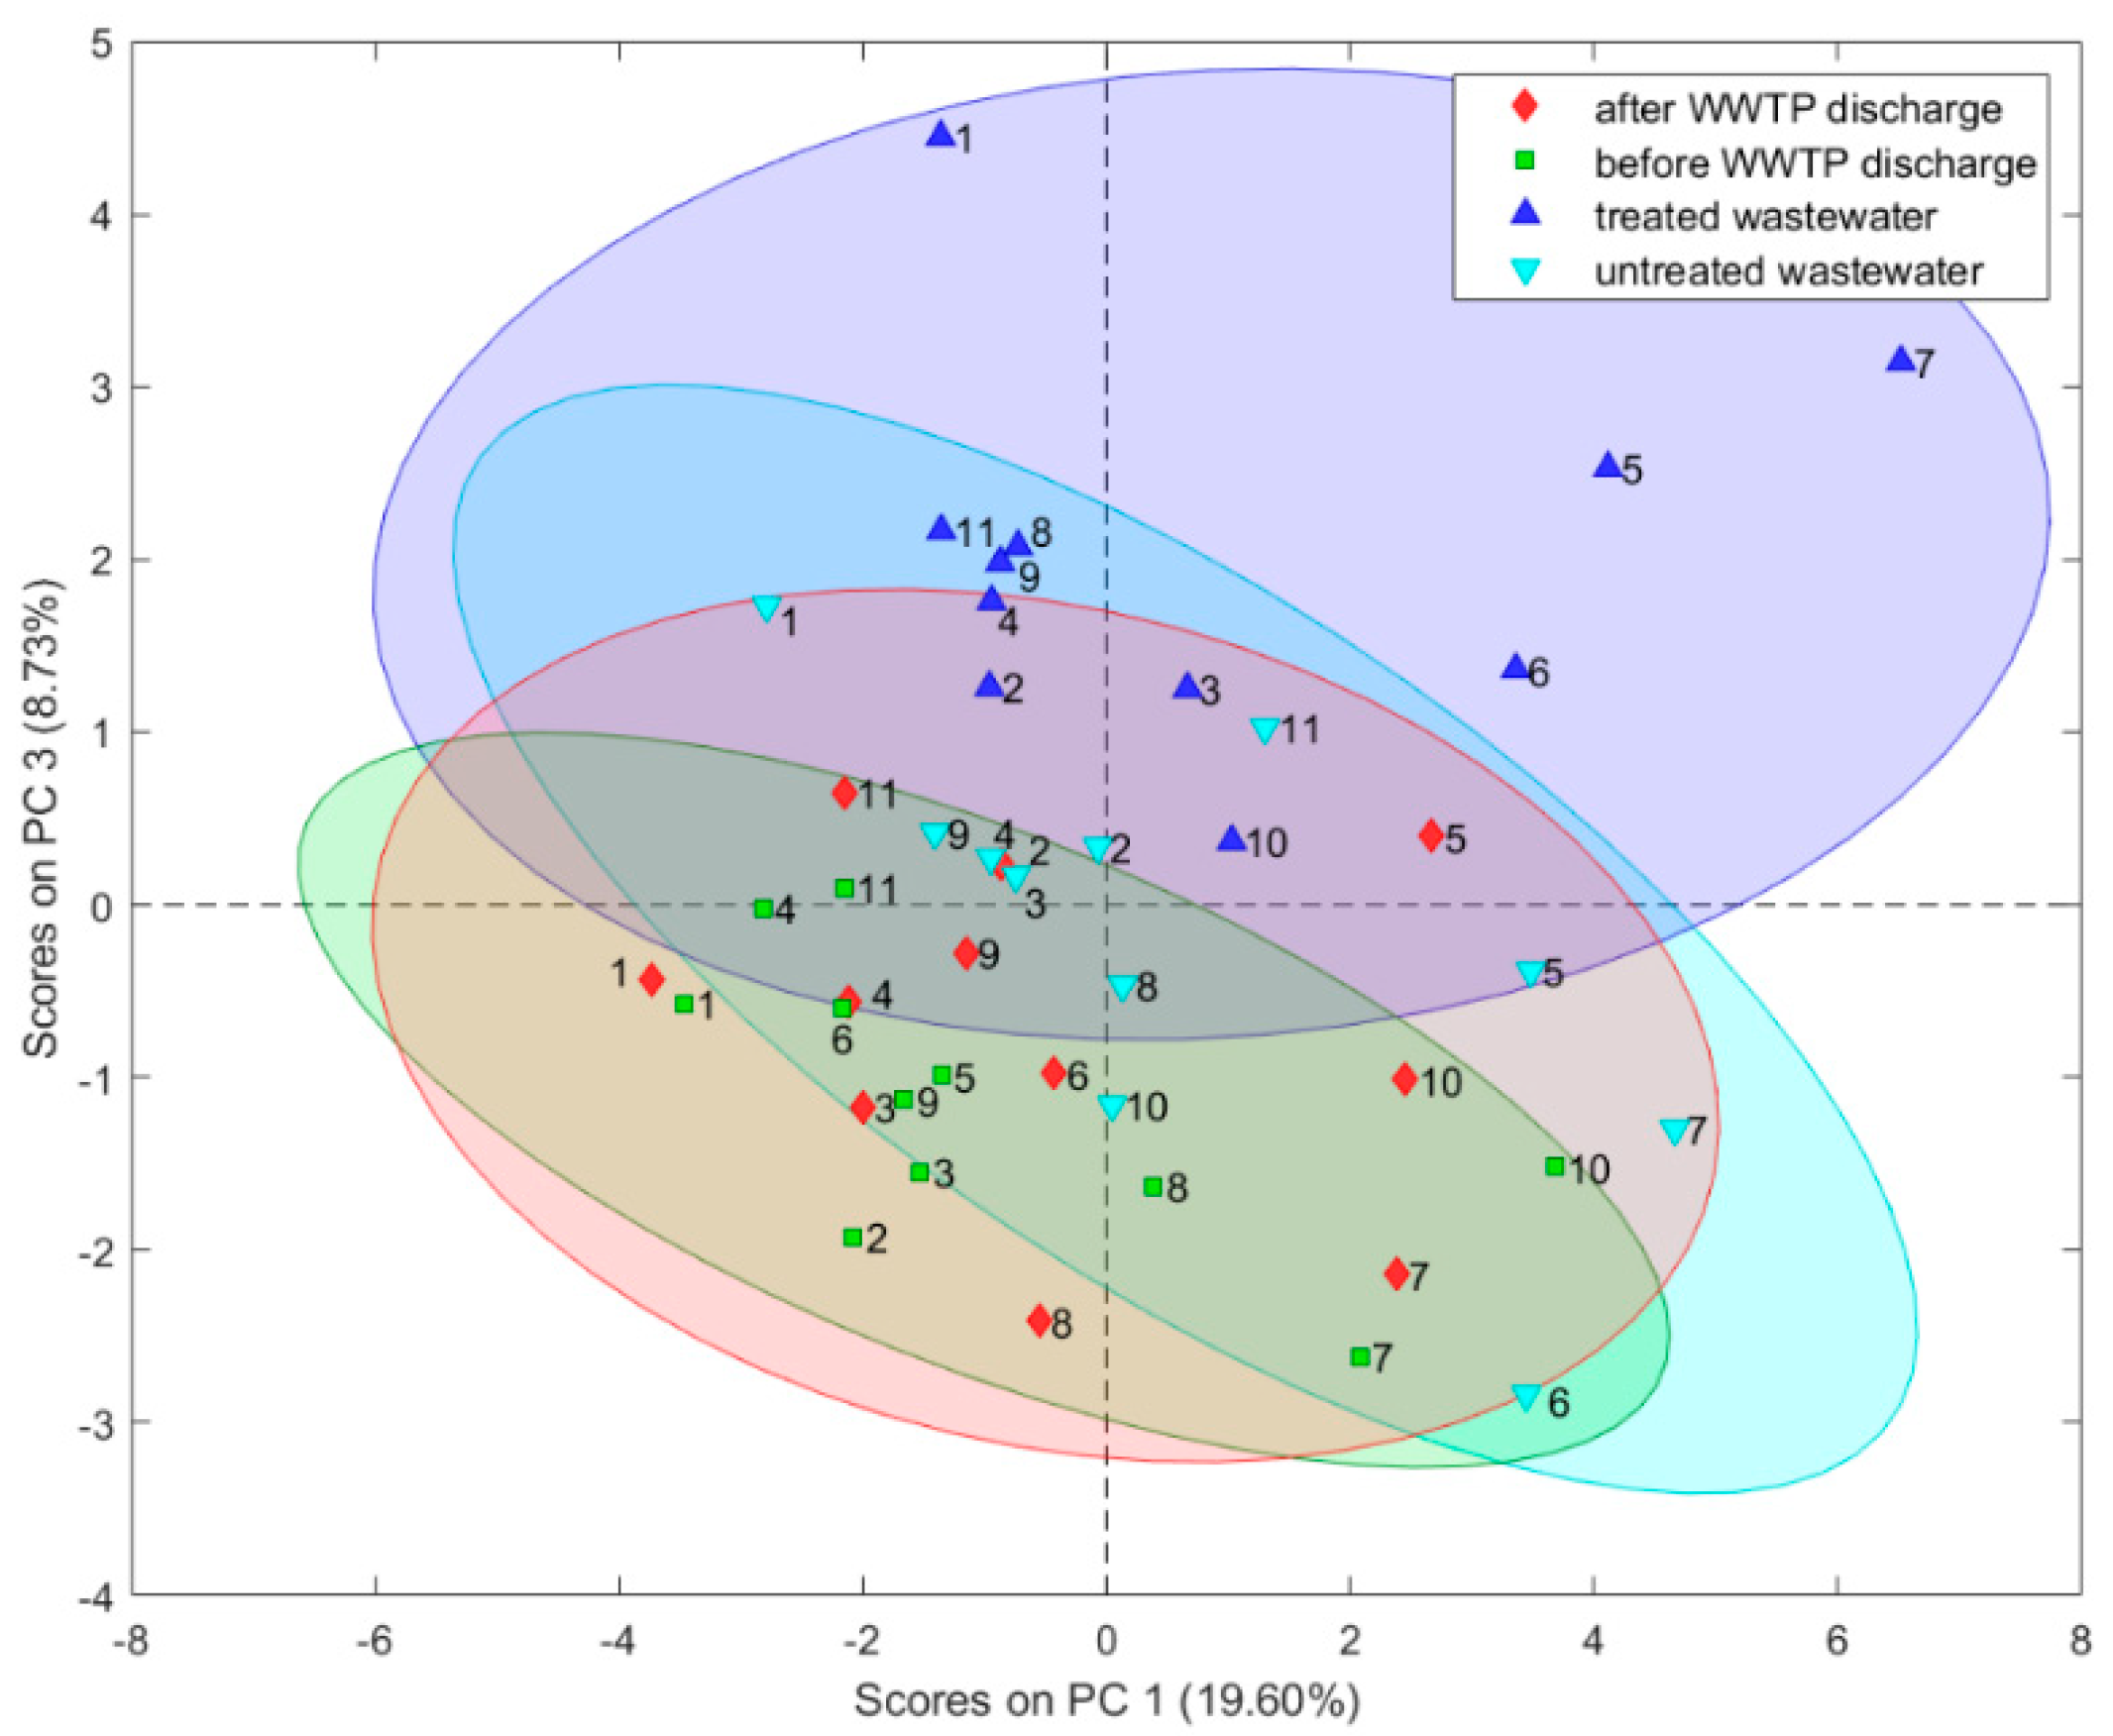
3.2. PCA Results
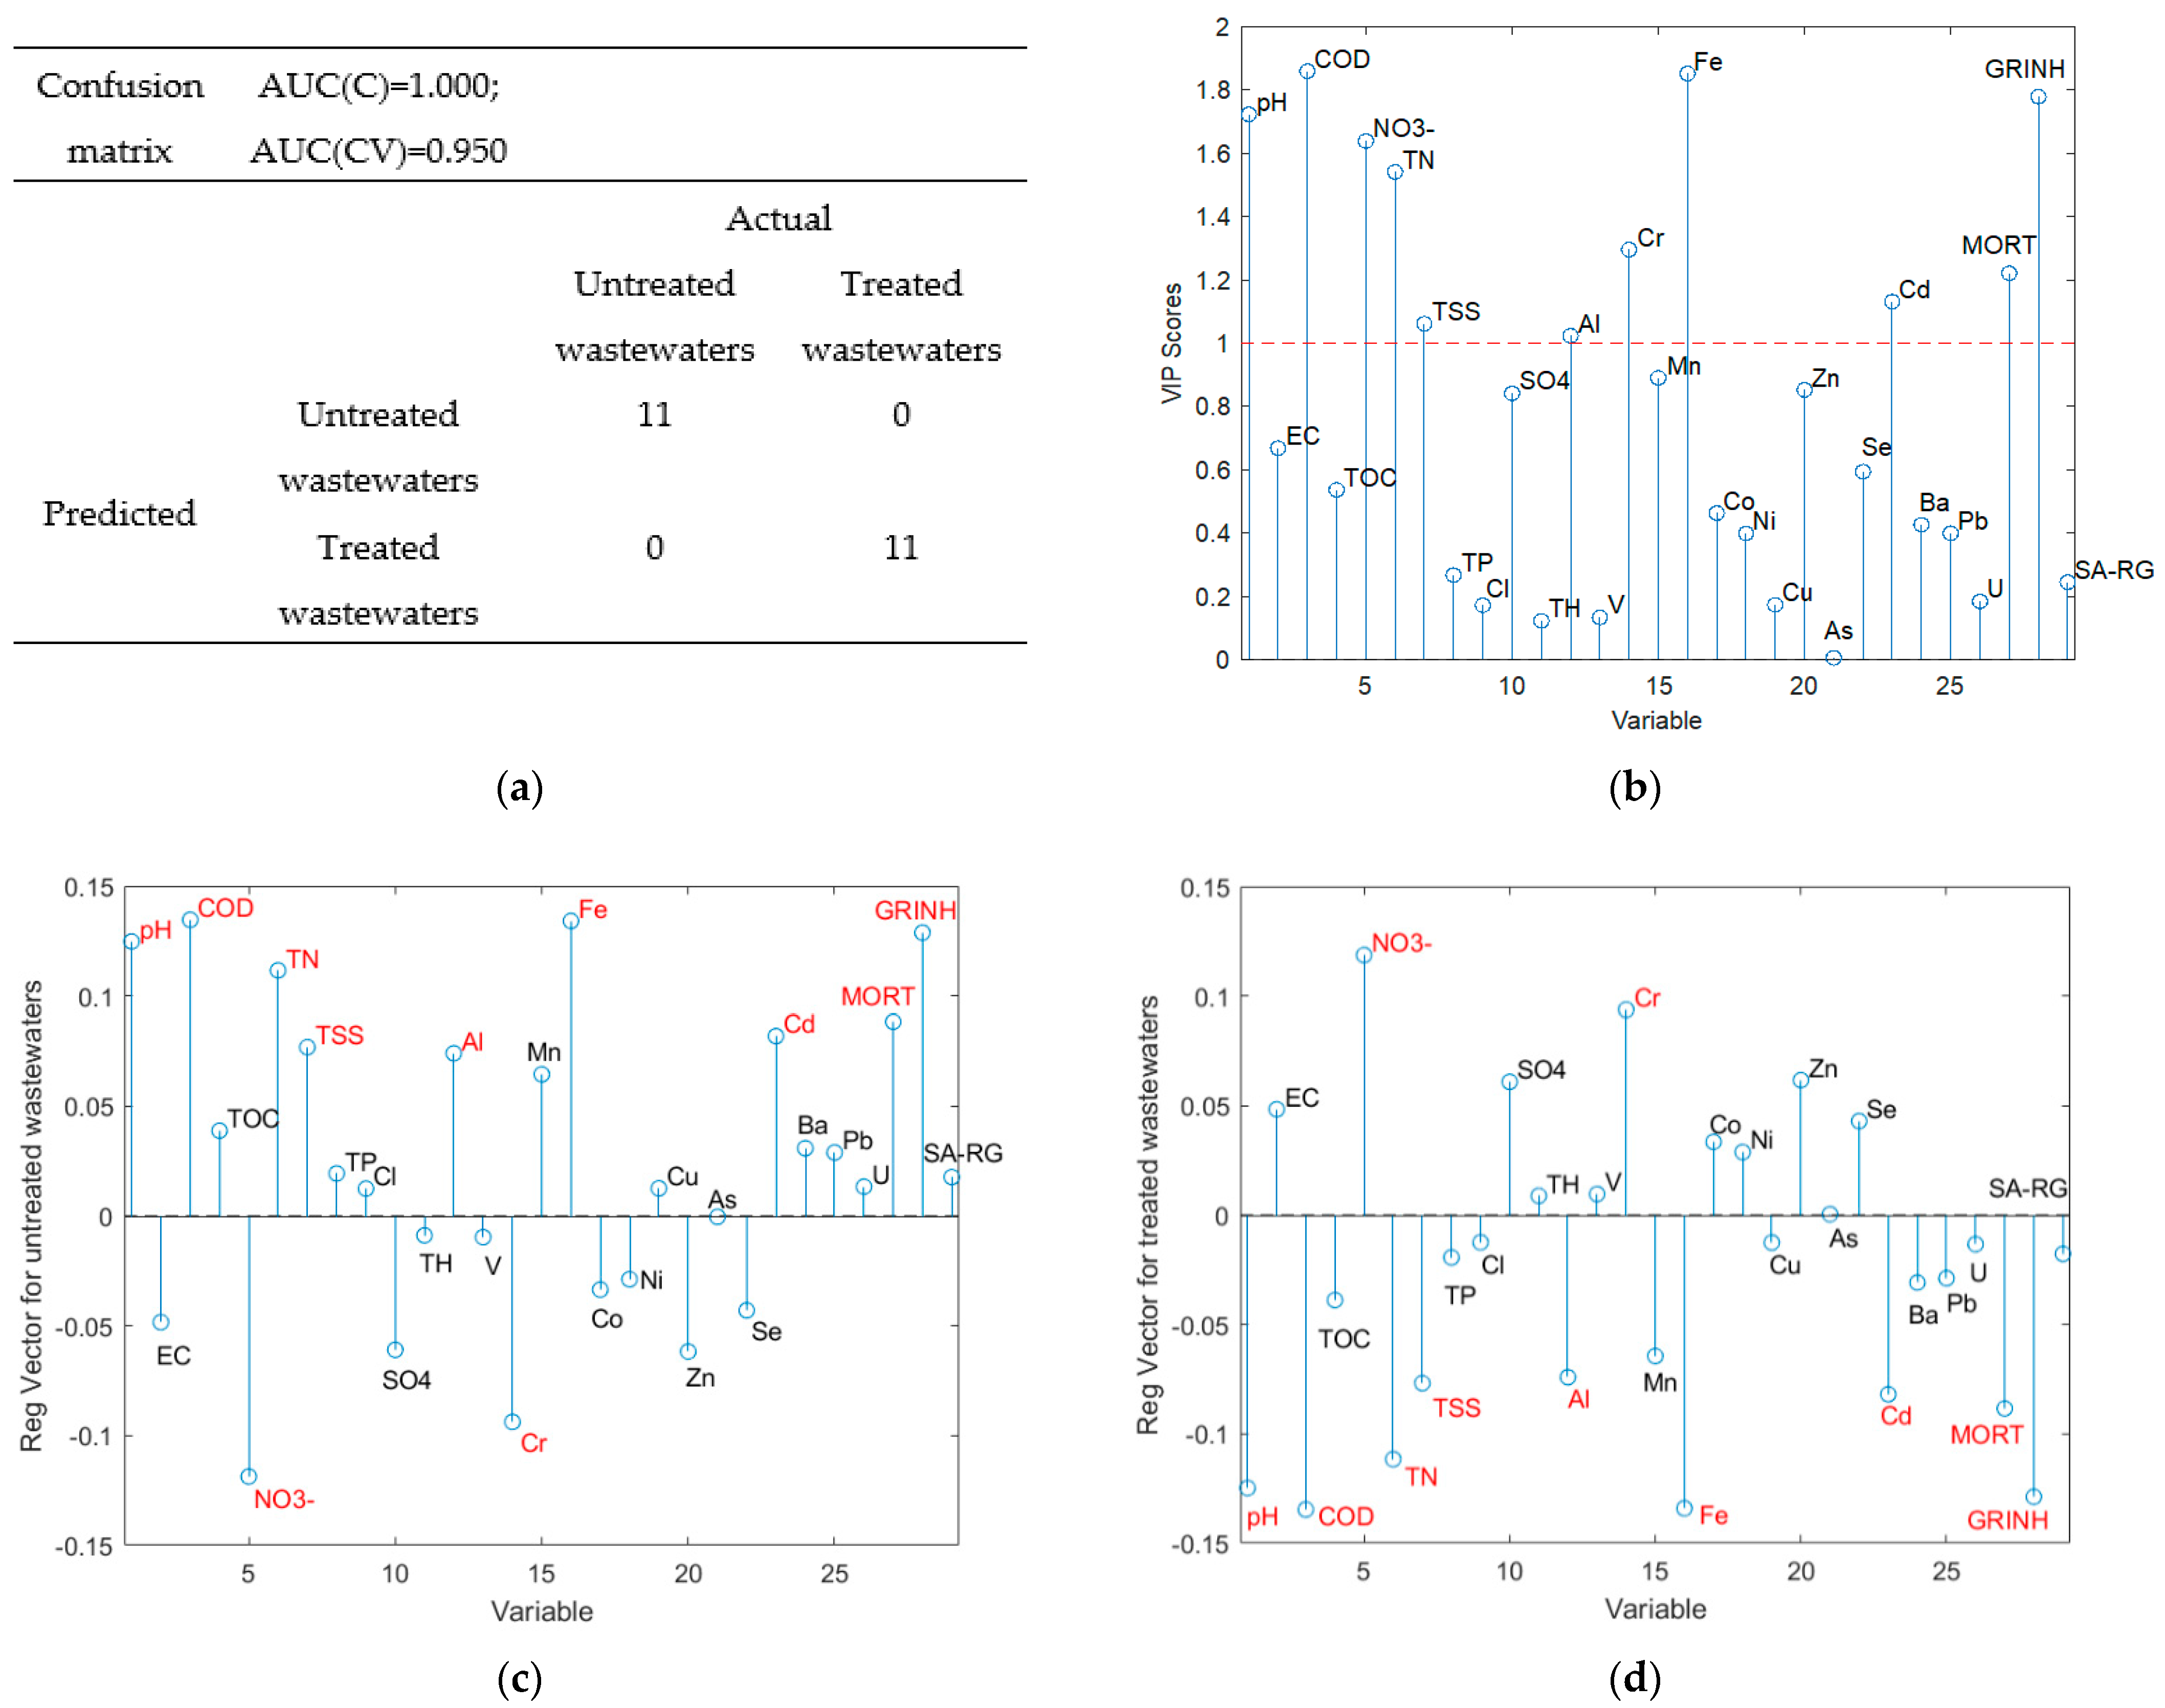
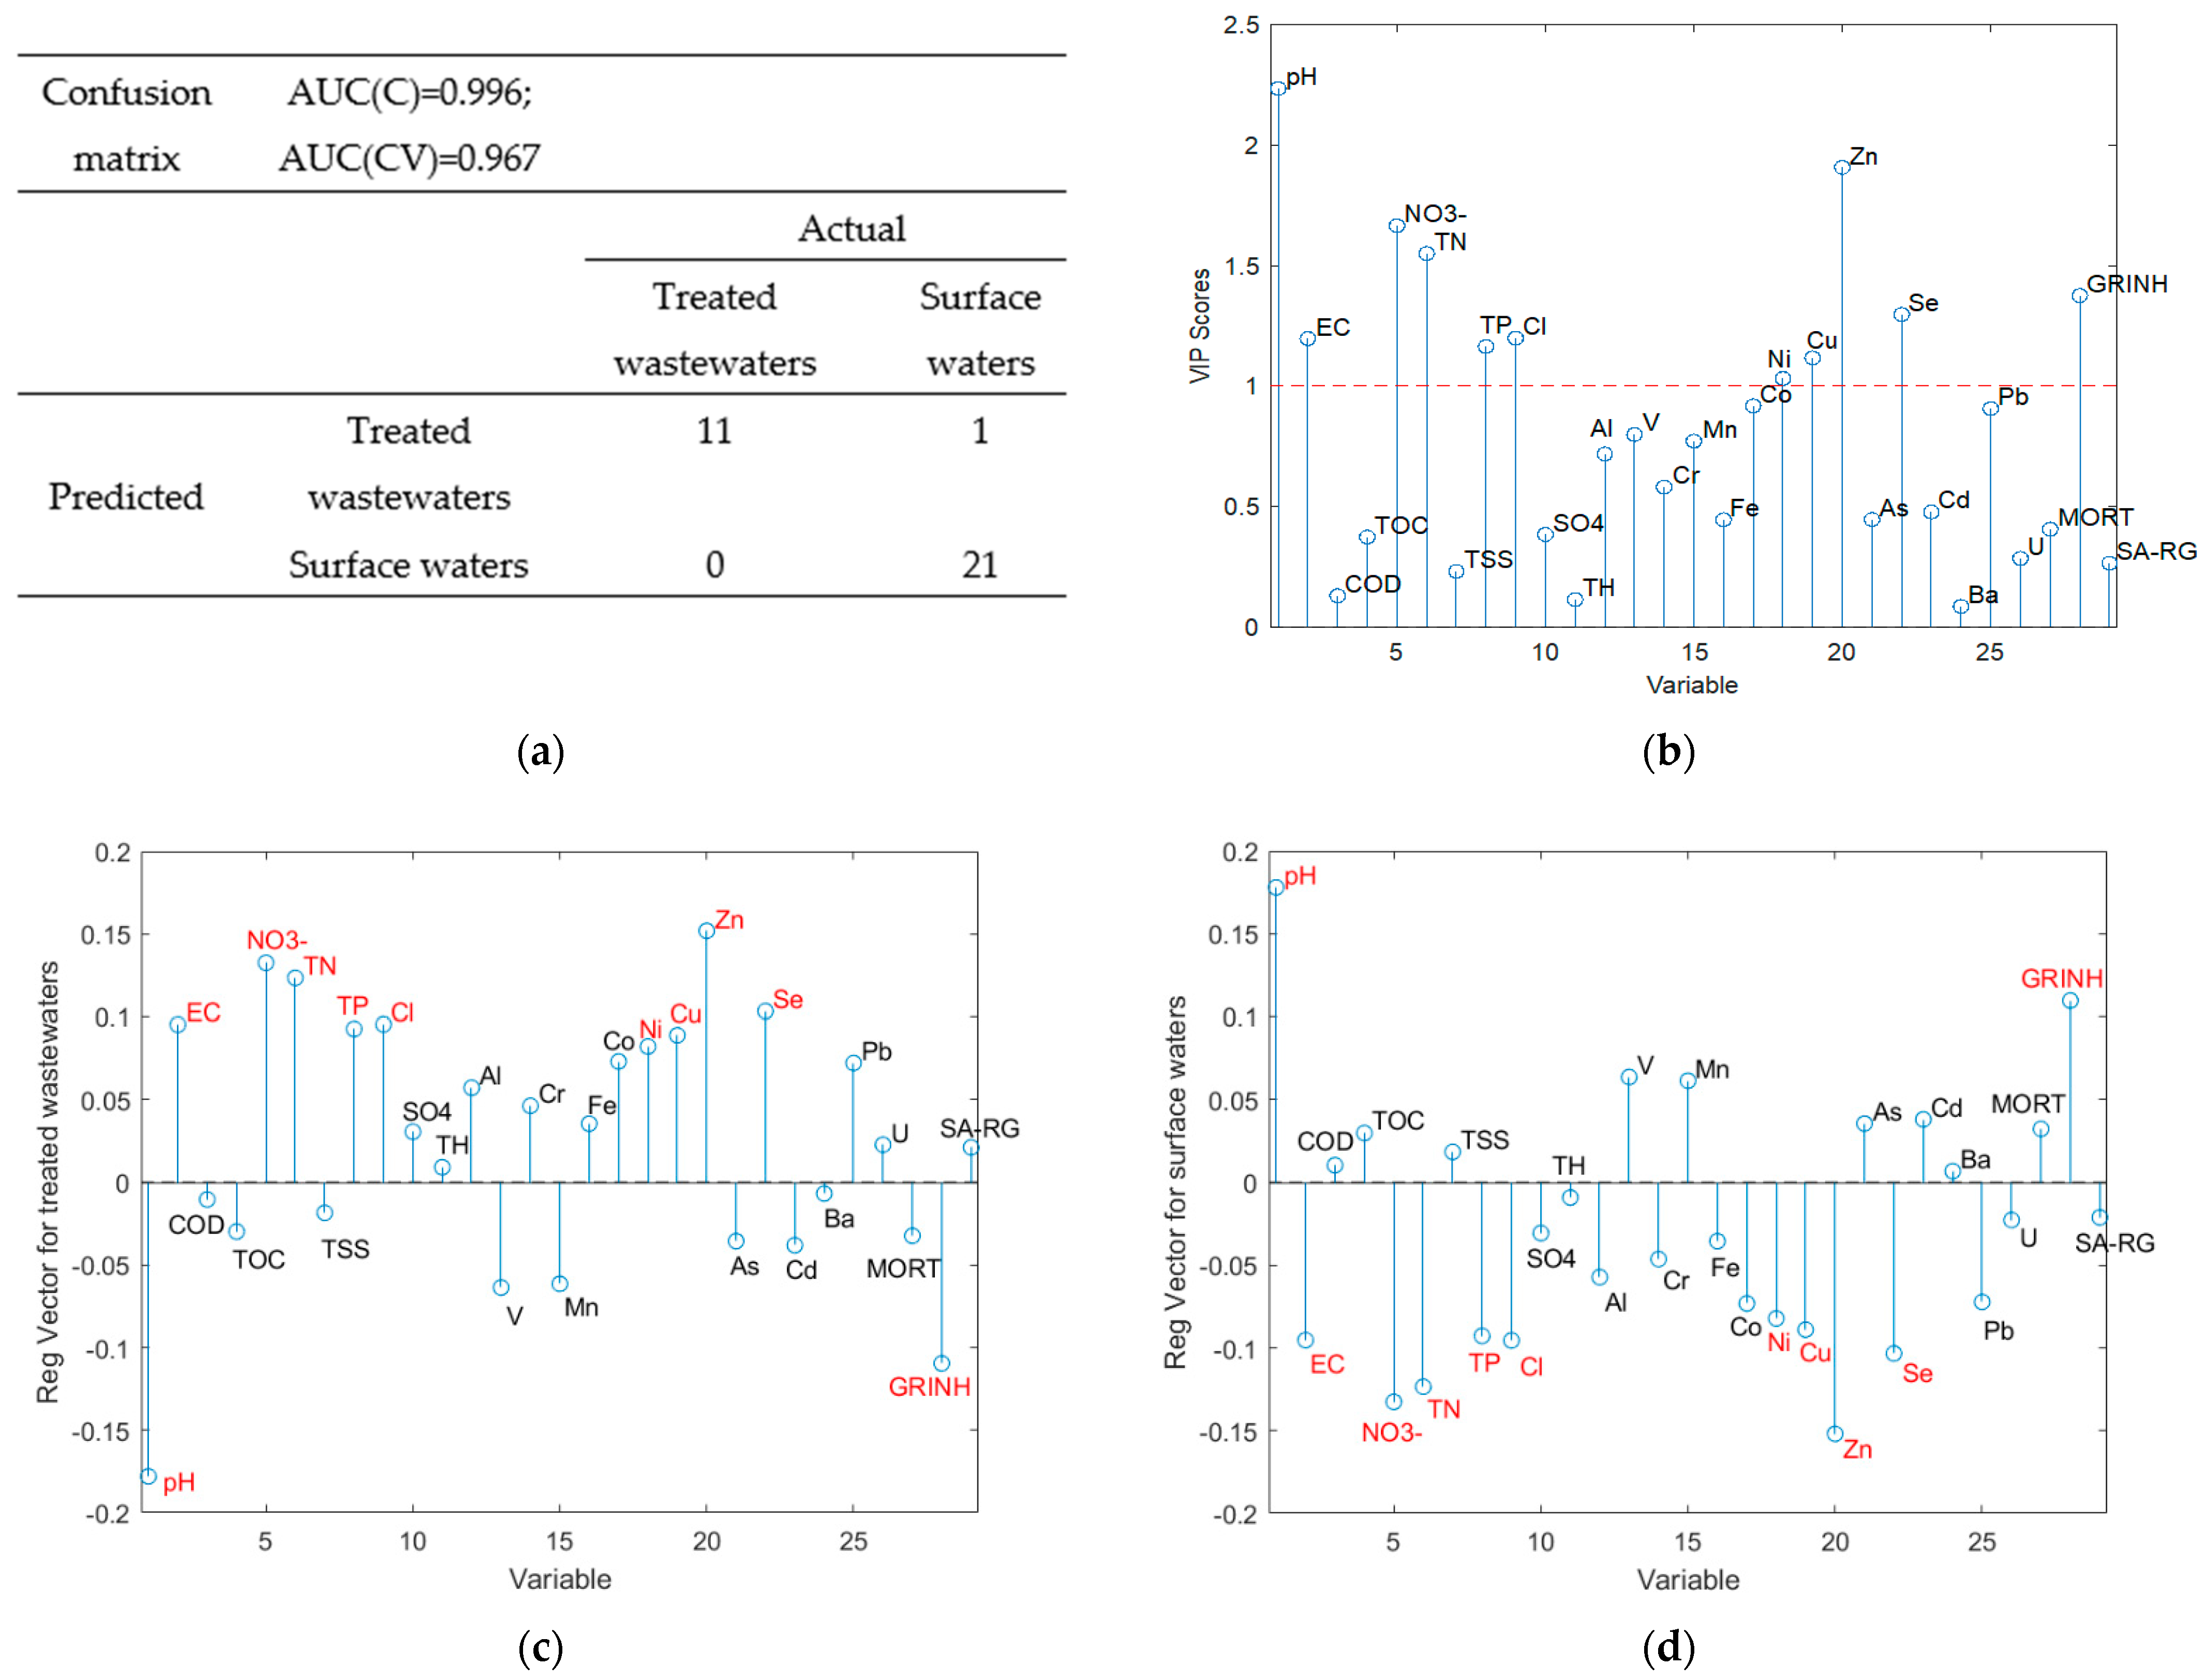
3.3. PLS-DA Results
4. Discussion
5. Conclusions
Author Contributions
Funding
Data Availability Statement
Acknowledgments
Conflicts of Interest
References
- United Nations, Department of Economic and Social Affairs, Population Division. World Urbanization Prospects: The 2014 Revision, Highlights (ST/ESA/SER.A/352); United Nations: New York, NY, USA, 2014. [Google Scholar]
- Moghaddam, M.; Mazaheri, M.; Samani, J. Inverse modeling of contaminant transport for pollution source identification in surface and groundwaters: A review. Groundw. Sustain. Develop. 2021, 15, 100651. [Google Scholar] [CrossRef]
- European Parliament, Council of the European Union. Directive 2000/60/EC of the European Parliament and of the Council establishing a framework for Community action in the field of water policy. Off. J. Eur. Union 2000, 327, 1–73. [Google Scholar]
- Khan, E. Nonpoint source versus point source water pollution. Water Environ. Res. 2020, 92, 1864–1865. [Google Scholar] [CrossRef] [PubMed]
- Salim Dantas, M.; Rodrigues Barroso, G.; Corrêa Oliveira, S. Performance of sewage treatment plants and impact of effluent discharge on receiving water quality within an urbanized area. Environ. Monit. Assess. 2021, 193, 289. [Google Scholar] [CrossRef] [PubMed]
- Council of the European Union. Council Directive 91/271/EEC concerning urban waste-water treatment. Off. J. Eur. Union 1991, 135, 40–52. [Google Scholar]
- Rule, K.L.; Comber, S.; Ross, D.; Thornton, A.; Makropoulos, C.; Rautiu, R. Diffuse sources of heavy metals entering an urban wastewater catchment. Chemosphere 2006, 63, 64–72. [Google Scholar] [CrossRef]
- Buzier, R.; Tusseau-Vuillemin, M.; Keirsbulck, M.; Mouchel, J. Inputs of total and labile trace metals from wastewater treatment plants effluents to the Seine River. Phys. Chem. Earth Parts A/B/C 2011, 36, 500–505. [Google Scholar] [CrossRef]
- Chon, H.; Ohandja, D.; Voulvoulis, N. Assessing the Relative Contribution of Wastewater Treatment Plants to Levels of Metals in Receiving Waters for Catchment Management. Water Air Soil Pollut. 2012, 223, 3987–4006. [Google Scholar] [CrossRef]
- Gobeil, C.; Rondeau, B.; Beaudin, L. Contribution of municipal effluents to metal fluxes in the St. Lawrence river. Environ. Sci. Tech. 2005, 39, 456–464. [Google Scholar] [CrossRef]
- Vink, R.; Behrendt, H.; Salomons, W. Point and diffuse source analysis of heavy metals in the Elbe drainage area: Comparing heavy metal emissions with transported river loads. Hydrobiologia 1999, 410, 307–314. [Google Scholar] [CrossRef]
- Venelinov, T.; Yotova, G.; Lazarova, S.; Mihaylova, V.; Tsakovski, S. Impact Assessment of the Wastewater Treatment Plants’ Discharges on Maritsa River. Int. J. Bioautomation 2021, 25, 169–182. [Google Scholar] [CrossRef]
- Huang, J.; Du, P.; Ao, C.; Ho, M.; Lei, M.; Zhao, D. Multivariate analysis for stormwater quality characteristics identification from different urban surface types in Macau. Bull. Environ. Contam. Toxicol. 2007, 79, 650–654. [Google Scholar] [CrossRef]
- Yotova, G.; Lazarova, S.; Kudłak, B.; Zlateva, B.; Mihaylova, V.; Wieczerzak, M.; Venelinov, T.; Tsakovski, S. Assessment of the Bulgarian Wastewater Treatment Plants’ Impact on the Receiving Water Bodies. Molecules 2019, 24, 2274. [Google Scholar] [CrossRef] [PubMed]
- Marčiulaitienė, E.; Meškauskaitė, L.; Pozniak, N.; Sakalauskas, L. Investigation of Filtration Capacity of Surface Wastewater Filters by Mathematical Modelling. Ecol. Chem. Eng. S 2020, 27, 241–255. [Google Scholar] [CrossRef]
- Yotova, G.; Venelinov, T.; Tsakovski, S. Chemometric Assessment of Bulgarian Wastewater Treatment Plants’ Effluents. Molecules 2020, 25, 4408. [Google Scholar] [CrossRef]
- Yotova, G.; Lazarova, S.; Mihaylova, V.; Venelinov, T. Water quality assessment of surface waters and wastewaters by traditional and ecotoxicological indicators in Ogosta River, Bulgaria. Int. J. Bioautomat. 2021, 25, 25–40. [Google Scholar] [CrossRef]
- U.S. Environmental Protection Agency. Introduction to Water Quality Based Toxics Control for The Npdes Program; U.S. Environmental Protection Agency: Washington, DC, USA, 1992.
- Manusadzianas, L.; Balkelyte, L.; Sadauskas, K.; Blinova, I.; Põllumaa, L.; Kahru, A. Ecotoxicological study of Lithuanian and Estonian wastewaters: Selection of the biotests, and correspondence between toxicity and chemical-based indices. Aquat. Toxicol. 2003, 63, 27–41. [Google Scholar] [CrossRef]
- Szmigielska, M.; Wróbel, M.; Rybak, J. Assessment of water quality contaminated with arsenic using diatoms and Ostracodtoxkit F test. E3S Web of Conf. 2018, 44, 00174. [Google Scholar] [CrossRef]
- Latif, M.; Licek, E. Toxicity assessment of wastewaters, river waters, and sediments in Austria using cost-effective microbiotests. Environ. Toxicol. 2004, 19, 302–309. [Google Scholar] [CrossRef]
- Kudłak, B.; Wieczerzak, M.; Yotova, G.; Tsakovski, S.; Simeonov, V.; Namiesnik, J. Environmental risk assessment of Polish wastewater treatment plant activity. Chemosphere 2016, 160, 181–188. [Google Scholar] [CrossRef]
- Radziemska, M.; Gusiatin, Z.; Cydzik-Kwiatkowska, A.; Cerdà, A.; Pecina, V.; Bęś, A.; Datta, R.; Majewski, G.; Mazur, Z.; Dzięcioł, J.; et al. Insight into metal immobilization and microbial community structure in soil from a steel disposal dump phytostabilized with composted, pyrolyzed or gasified wastes. Chemosphere 2021, 272, 129576. [Google Scholar] [CrossRef] [PubMed]
- Steliga, T.; Kluk, D. Application of Festuca arundinacea in phytoremediation of soils contaminated with Pb, Ni, Cd and petroleum hydrocarbons. Ecotox. Environ. Saf. 2020, 194, 110409. [Google Scholar] [CrossRef] [PubMed]
- Radziemska, M.; Bęś, A.; Gusiatin, Z.M.; Cerdà, A.; Jeznach, J.; Mazur, Z.; Brtnický, M. Assisted phytostabilization of soil from a former military area with mineral amendments. Ecotox. Environ. Saf. 2020, 188, 109934. [Google Scholar] [CrossRef] [PubMed]
- Radziemska, M.; Bęś, A.; Gusiatin, Z.M.; Cerdà, A.; Mazur, Z.; Jeznach, J.; Kowal, P.; Brtnický, M. The combined effect of phytostabilization and different amendments on remediation of soils from post-military areas. Sci. Tot. Environ. 2019, 688, 37–45. [Google Scholar] [CrossRef]
- García-Lorenzo, M.; Crespo-Feo, E.; Esbrí, J.; Higueras, P.; Grau, P.; Crespo, I.; Sánchez-Donoso, R. Assessment of potentially toxic elements in technosols by tailings derived from Pb–Zn–Ag mining activities at San Quintín (Ciudad real, Spain): Some insights into the importance of integral studies to evaluate metal contamination pollution hazards. Minerals 2019, 9, 346. [Google Scholar] [CrossRef]
- Kluk, D.; Steliga, T. Potential of helianthus annuus for phytoremediation of lead, zinc, total petroleum hydrocarbons (TPH) and polycyclic aromatic hydrocarbons (PAHs) contaminated soil. Naft-Gaz 2019, 7, 379–387. [Google Scholar] [CrossRef]
- Wróbel, M.; Stojanowska, A.; Nosarzewska, M.; Rutkowski, R.; Rybak, J. The impact of chemical contaminants on biocenosis (ecotoxycological studies). E3S Web Conf. 2019, 100, 00088. [Google Scholar] [CrossRef]
- Tarnawski, M.; Baran, A. Use of Chemical Indicators and Bioassays in Bottom Sediment Ecological Risk Assessment. Arch. Environ. Contam. Toxicol. 2018, 74, 395–407. [Google Scholar] [CrossRef]
- Singh, P.; Nel, A.; Durand, J. The use of bioassays to assess the toxicity of sediment in an acid mine drainage impacted river in gauteng (South Africa). Water SA 2017, 43, 673–683. [Google Scholar] [CrossRef][Green Version]
- Mierzwa-Hersztek, M.; Gondek, K.; Klimkowicz-Pawlas, A.; Baran, A.; Bajda, T. Sewage sludge biochars management—Ecotoxicity, mobility of heavy metals, and soil microbial biomass. Environ. Toxicol. Chem. 2018, 37, 1197–1207. [Google Scholar] [CrossRef]
- Oleszczuk, P. The toxicity of composts from sewage sludges evaluated by the direct contact tests phytotoxkit and ostracodtoxkit. Waste Manag. 2008, 28, 1645–1653. [Google Scholar] [CrossRef] [PubMed]
- Lyubomirova, V.; Mihaylova, V.; Djingova, R. Determination of macroelements in potable waters with cell-based inductively-coupled plasma mass spectrometry. Spectrosc. Eur. 2020, 32, 18–21. [Google Scholar]
- Lyubomirova, V.; Djingova, R. Determination of Se in Bulgarian commercial flour and bread. Comp. Rend. L’Académ. Bul. Sci. 2015, 68, 847–852. [Google Scholar]
- Kudłak, B.; Wolska, L.; Namieśnik, J. Determination of EC 50 toxicity data of selected heavy metals toward Heterocypris incongruens and their comparison to “direct-contact” and microbiotests. Environ. Monit. Assess. 2011, 174, 509–516. [Google Scholar] [CrossRef]
- Wieczerzak, M.; Kudłak, B.; Namieśnik, J. Impact of Selected Drugs and Their Binary Mixtures on the Germination of Sorghum bicolor (Sorgo) Seeds. Env. Sci. Pol. Res. 2018, 25, 18717–18727. [Google Scholar] [CrossRef]
- Schneider, C.A.; Rasband, W.S.; Eliceiri, K.W. NIH Image to ImageJ: 25 years of image analysis. Nat. Methods 2012, 9, 671–675. [Google Scholar] [CrossRef] [PubMed]
- Platikanov, S.; Rodriguez-Mozaz, S.; Huerta, B.; Barceló, D.; Cros, J.; Batle, M.; Poch, G.; Tauler, R. Chemometrics quality assessment of wastewater treatment plant effluents using physicochemical parameters and UV absorption measurements. J. Environ. Manag. 2014, 140, 33–44. [Google Scholar] [CrossRef] [PubMed]
- Navarro, A.; Tauler, R.; Lacorte, S.; Barceló, D. Occurrence and transport of pesticides and alkylphenols in water samples along the Ebro River Basin. J. Hydrol. 2010, 383, 18–29. [Google Scholar] [CrossRef]
- Ordinance N-4/2012 for Characterisation of Surface Waters. D V 2013, 22, 9–46. (In Bulgarian). Available online: http://eea.government.bg/bg/legislation/water/Naredba13.pdf (accessed on 15 December 2021).
- Venelinov, T.; Tsakovski, S. How to Implement User-Friendly BLMs in the Absence of DOC Monitoring Data: A Case Study on Bulgarian Surface Waters. Water 2022, 14, 246. [Google Scholar] [CrossRef]
- Zhelezov, G.; Benderev, A. State of pollution of Ogosta River waters. Rev. Bul. Geol. Soc. 2021, 82, 195–197. [Google Scholar] [CrossRef]
- Stasinakis, A.; Thomaidis, N. Fate and Biotransformation of Metal and Metalloid Species in Biological Wastewater Treatment Processes. Crit. Rev. Environ. Sci. Technol. 2010, 40, 307–364. [Google Scholar] [CrossRef]
- Angelova, I.; Ivanov, I.; Venelinov, T. Study of hexavalent chromium origin in the groundwater of northern Bulgaria. SGEM Conf. Proc. 2018, 18, 853–860. [Google Scholar] [CrossRef]
- Kudłak, B.; Wieczerzak, M.; Namieśnik, J. Determination of Toxicological Parameters of Selected Bioactive Organic Chemicals Using the Ostracodtoxkit F. Chem.-Didac.-Ecol.-Metrol. 2018, 23, 113–126. [Google Scholar] [CrossRef]
- Sonavane, M.; Schollée, J.; Hidasi, A.; Creusot, N.; Brion, F.; Suter, M.; Hollender, J.; Aїt-Aїssa, S. An integrative approach combining passive sampling, bioassays, and effect-directed analysis to assess the impact of wastewater effluent. Environ. Toxicol. Chem. 2018, 37, 2079–2088. [Google Scholar] [CrossRef]
- De Schamphelaere, K.; Janssen, C. Development and field validation of a biotic ligand model predicting chronic copper toxicity to Daphnia magna. Environ. Toxicol. Chem. 2004, 23, 1365–1375. [Google Scholar] [CrossRef]
- Deleebeeck, N.; De Schamphelaere, K.; Janssen, C. A novel method for predicting chronic nickel bioavailability and toxicity to Daphnia magna in artificial and natural waters. Environ. Toxicol. Chem. 2008, 27, 2097–2107. [Google Scholar] [CrossRef]
- Heijerick, D.; De Schamphelaere, K.; Van Sprang, P.; Janssen, C. Development of a chronic zinc biotic ligand model for Daphnia magna. Ecotoxicol. Env. Saf. 2005, 62, 1–10. [Google Scholar] [CrossRef]
- Olkowska, E.; Kudłak, K.; Tsakovski, S.; Ruman, M.; Simeonov, V.; Polkowska, Z. Assessment of the water quality of Kłodnica River catchment using self-organizing maps. Sci. Total Environ. 2014, 476, 477–484. [Google Scholar] [CrossRef]
- Stalter, D.; Magdeburg, A.; Oehlmann, J. Comparative toxicity assessment of ozone and activated carbon treated sewage effluents using an in vivo test battery. Water Res. 2010, 44, 2610–2620. [Google Scholar] [CrossRef]
- Tchounwou, P.; Wilson, B.; Ishaque, A.; Schneider, J. Toxicity tests to assess pollutants removal during wastewater treatment and the quality of receiving waters in Argentina. Environ. Toxicol. 2001, 16, 217–224. [Google Scholar] [CrossRef]
- Papa, M.; Paredes, L.; Feretti, D.; Viola, G.; Mazzoleni, G.; Steimberg, N.; Pedrazzani, R.; Lema, J.; Omil, F.; Carballa, M. How should ecohazard of micropollutants in wastewater be gauged? Using bioassays to profile alternative tertiary treatments. Environ. Eng. Res. 2021, 26, 200153. [Google Scholar] [CrossRef]


| Instrument | Operating Conditions |
|---|---|
| Argon plasma gas flow | 15 L/min |
| Auxiliary gas flow | 1.20 L/min |
| Nebulizer gas flow | 0.90 L/min |
| Lens voltage | 6.00 V |
| ICP-RF power | 1100 W |
| Pulse stage voltage | 950 V |
| Dwell time | 50 ms |
| Acquisition mode | Peak hop |
| Peak pattern | One point per mass at maximum peak |
| Number of runs | 4 |
| Determined isotopes of trace elements | 27Al, 51V, 52Cr, 54,57Fe, 59Co, 55Mn, 60,62Ni, 63,65Cu, 64,66,68Zn, 75As (1.0/0.7) *, 77,78Se (1.5/0.3) *, 80,82Se (0.9/0.3) *, 113, 114Cd, 137,138Ba, 206, 208Pb, 238U |
| Units | Mean | Median | Minimum | Maximum | Std. Dev. | |
|---|---|---|---|---|---|---|
| pH | - | 7.7 | 7.6 | 6.9 | 8.9 | 0.4 |
| EC | mS/cm | 0.6 | 0.6 | 0.2 | 1.3 | 0.3 |
| COD | mg/L O2 | 68.7 | 15.7 | 8.4 | 449.0 | 114.6 |
| TOC | mg C/L | 10.7 | 9.6 | 1.0 | 42.9 | 9.5 |
| NO3− | mg/L | 13.3 | 5.9 | 0.5 | 68.9 | 15.7 |
| TN | mg/L | 8.8 | 5.1 | 0.5 | 48.8 | 10.9 |
| TSS | mg/L | 35.3 | 8.5 | 1.5 | 611.0 | 96.9 |
| TP | mg/L | 3.1 | 2.4 | 0.3 | 12.0 | 3.0 |
| Cl− | mg/L | 71.3 | 40.0 | 0.5 | 476.0 | 103.9 |
| SO42– | mg/L | 41.5 | 33.0 | 3.0 | 148.0 | 27.5 |
| TH | meq/L | 4.4 | 3.8 | 1.6 | 10.6 | 2.2 |
| Al | µg/L | 13.1 | 10.2 | 2.4 | 41.9 | 10.2 |
| V | µg/L | 1.8 | 1.4 | 0.4 | 6.0 | 1.3 |
| Cr | µg/L | 5.3 | 4.2 | 0.2 | 13.9 | 3.1 |
| Mn | µg/L | 53.4 | 40.0 | 5.1 | 262.6 | 45.4 |
| Fe | µg/L | 47.9 | 33.5 | 1.2 | 163.8 | 45.0 |
| Co | µg/L | 0.6 | 0.4 | 0.2 | 7.2 | 1.0 |
| Ni | µg/L | 3.9 | 3.4 | 1.4 | 13.2 | 2.1 |
| Cu | µg/L | 1.9 | 1.6 | 0.8 | 9.0 | 1.3 |
| Zn | µg/L | 11.4 | 5.4 | 0.07 | 102.7 | 17.3 |
| As | µg/L | 4.4 | 1.5 | 0.5 | 46.9 | 10.1 |
| Se | µg/L | 1.0 | 1.0 | 0.01 | 2.6 | 0.5 |
| Cd | µg/L | 0.02 | 0.01 | 0.0001 | 0.1 | 0.02 |
| Ba | µg/L | 31.2 | 28.3 | 12.2 | 64.5 | 12.2 |
| Pb | µg/L | 0.9 | 0.2 | 0.02 | 24.7 | 3.8 |
| Unat | µg/L | 2.6 | 1.5 | 0.1 | 14.3 | 3.7 |
| MORT | % | 15.6 | 8.9 | −3.6 | 67.9 | 18.9 |
| GRINH | % | 26.9 | 25.0 | −4.7 | 84.2 | 15.6 |
| SA-RG | % | −38.0 | −40.4 | −58.5 | −3.2 | 11.1 |
| Number | Sampling Location | Population Equivalent (p.e.) | Treatment Facilities 1 | Exceeding of the Directive 91/271/EEC 2 | |||
|---|---|---|---|---|---|---|---|
| COD | TN | TP | TSS | ||||
| 1 | Montana (MON) | 98,618 | 4 | - | - | - | - |
| 2 | Lovech (LOV) | 85,700 | 4 | - | - | - | - |
| 3 | Troyan (TRO) | 80,000 | 4 | - | - | - | - |
| 4 | Kazanlak (KZK) | 80,000 | 4 | - | - | - | - |
| 5 | Plovdiv (PDV) | 596,000 | 2 | - | - | + | - |
| 6 | Pazardzhik (PAZ) | 150,000 | 2 | - | - | + | - |
| 7 | Popovo (POP) | 37,720 | 3 | - | - | + | - |
| 8 | Blagoevgrad (BLG) | 87,520 | 4 | - | - | + | - |
| 9 | Dupnitsa (DUP) | 55,000 | 2 | - | - | + | - |
| 10 | Pernik (PER) | 160,000 | 2 | - | - | + | - |
| 11 | Sofia (SOF) | 1,833,333 | 4 | - | - | + | - |
Publisher’s Note: MDPI stays neutral with regard to jurisdictional claims in published maps and institutional affiliations. |
© 2022 by the authors. Licensee MDPI, Basel, Switzerland. This article is an open access article distributed under the terms and conditions of the Creative Commons Attribution (CC BY) license (https://creativecommons.org/licenses/by/4.0/).
Share and Cite
Mihaylova, V.; Yotova, G.; Kudłak, B.; Venelinov, T.; Tsakovski, S. Chemometric Evaluation of WWTPs’ Wastewaters and Receiving Surface Waters in Bulgaria. Water 2022, 14, 521. https://doi.org/10.3390/w14040521
Mihaylova V, Yotova G, Kudłak B, Venelinov T, Tsakovski S. Chemometric Evaluation of WWTPs’ Wastewaters and Receiving Surface Waters in Bulgaria. Water. 2022; 14(4):521. https://doi.org/10.3390/w14040521
Chicago/Turabian StyleMihaylova, Veronika, Galina Yotova, Błażej Kudłak, Tony Venelinov, and Stefan Tsakovski. 2022. "Chemometric Evaluation of WWTPs’ Wastewaters and Receiving Surface Waters in Bulgaria" Water 14, no. 4: 521. https://doi.org/10.3390/w14040521
APA StyleMihaylova, V., Yotova, G., Kudłak, B., Venelinov, T., & Tsakovski, S. (2022). Chemometric Evaluation of WWTPs’ Wastewaters and Receiving Surface Waters in Bulgaria. Water, 14(4), 521. https://doi.org/10.3390/w14040521