
Permanganate/Bisulfite Pre-Oxidation of Natural Organic Matter Enhances Nitrogenous Disinfection By-Products Formation during Subsequent Chlorination

Abstract
:1. Introduction
2. Materials and Methods
2.1. Materials
2.2. Experimental Procedures
2.2.1. Pre-Oxidation
2.2.2. Formation Potential of Disinfection By-Products
2.3. Analysis
2.3.1. TOC, UV254, UV-Vis and Residual Chlorine
2.3.2. Three-Dimensional-EEM
2.3.3. DBPs Analysis
3. Results and Discussion
3.1. Characterization of NOM
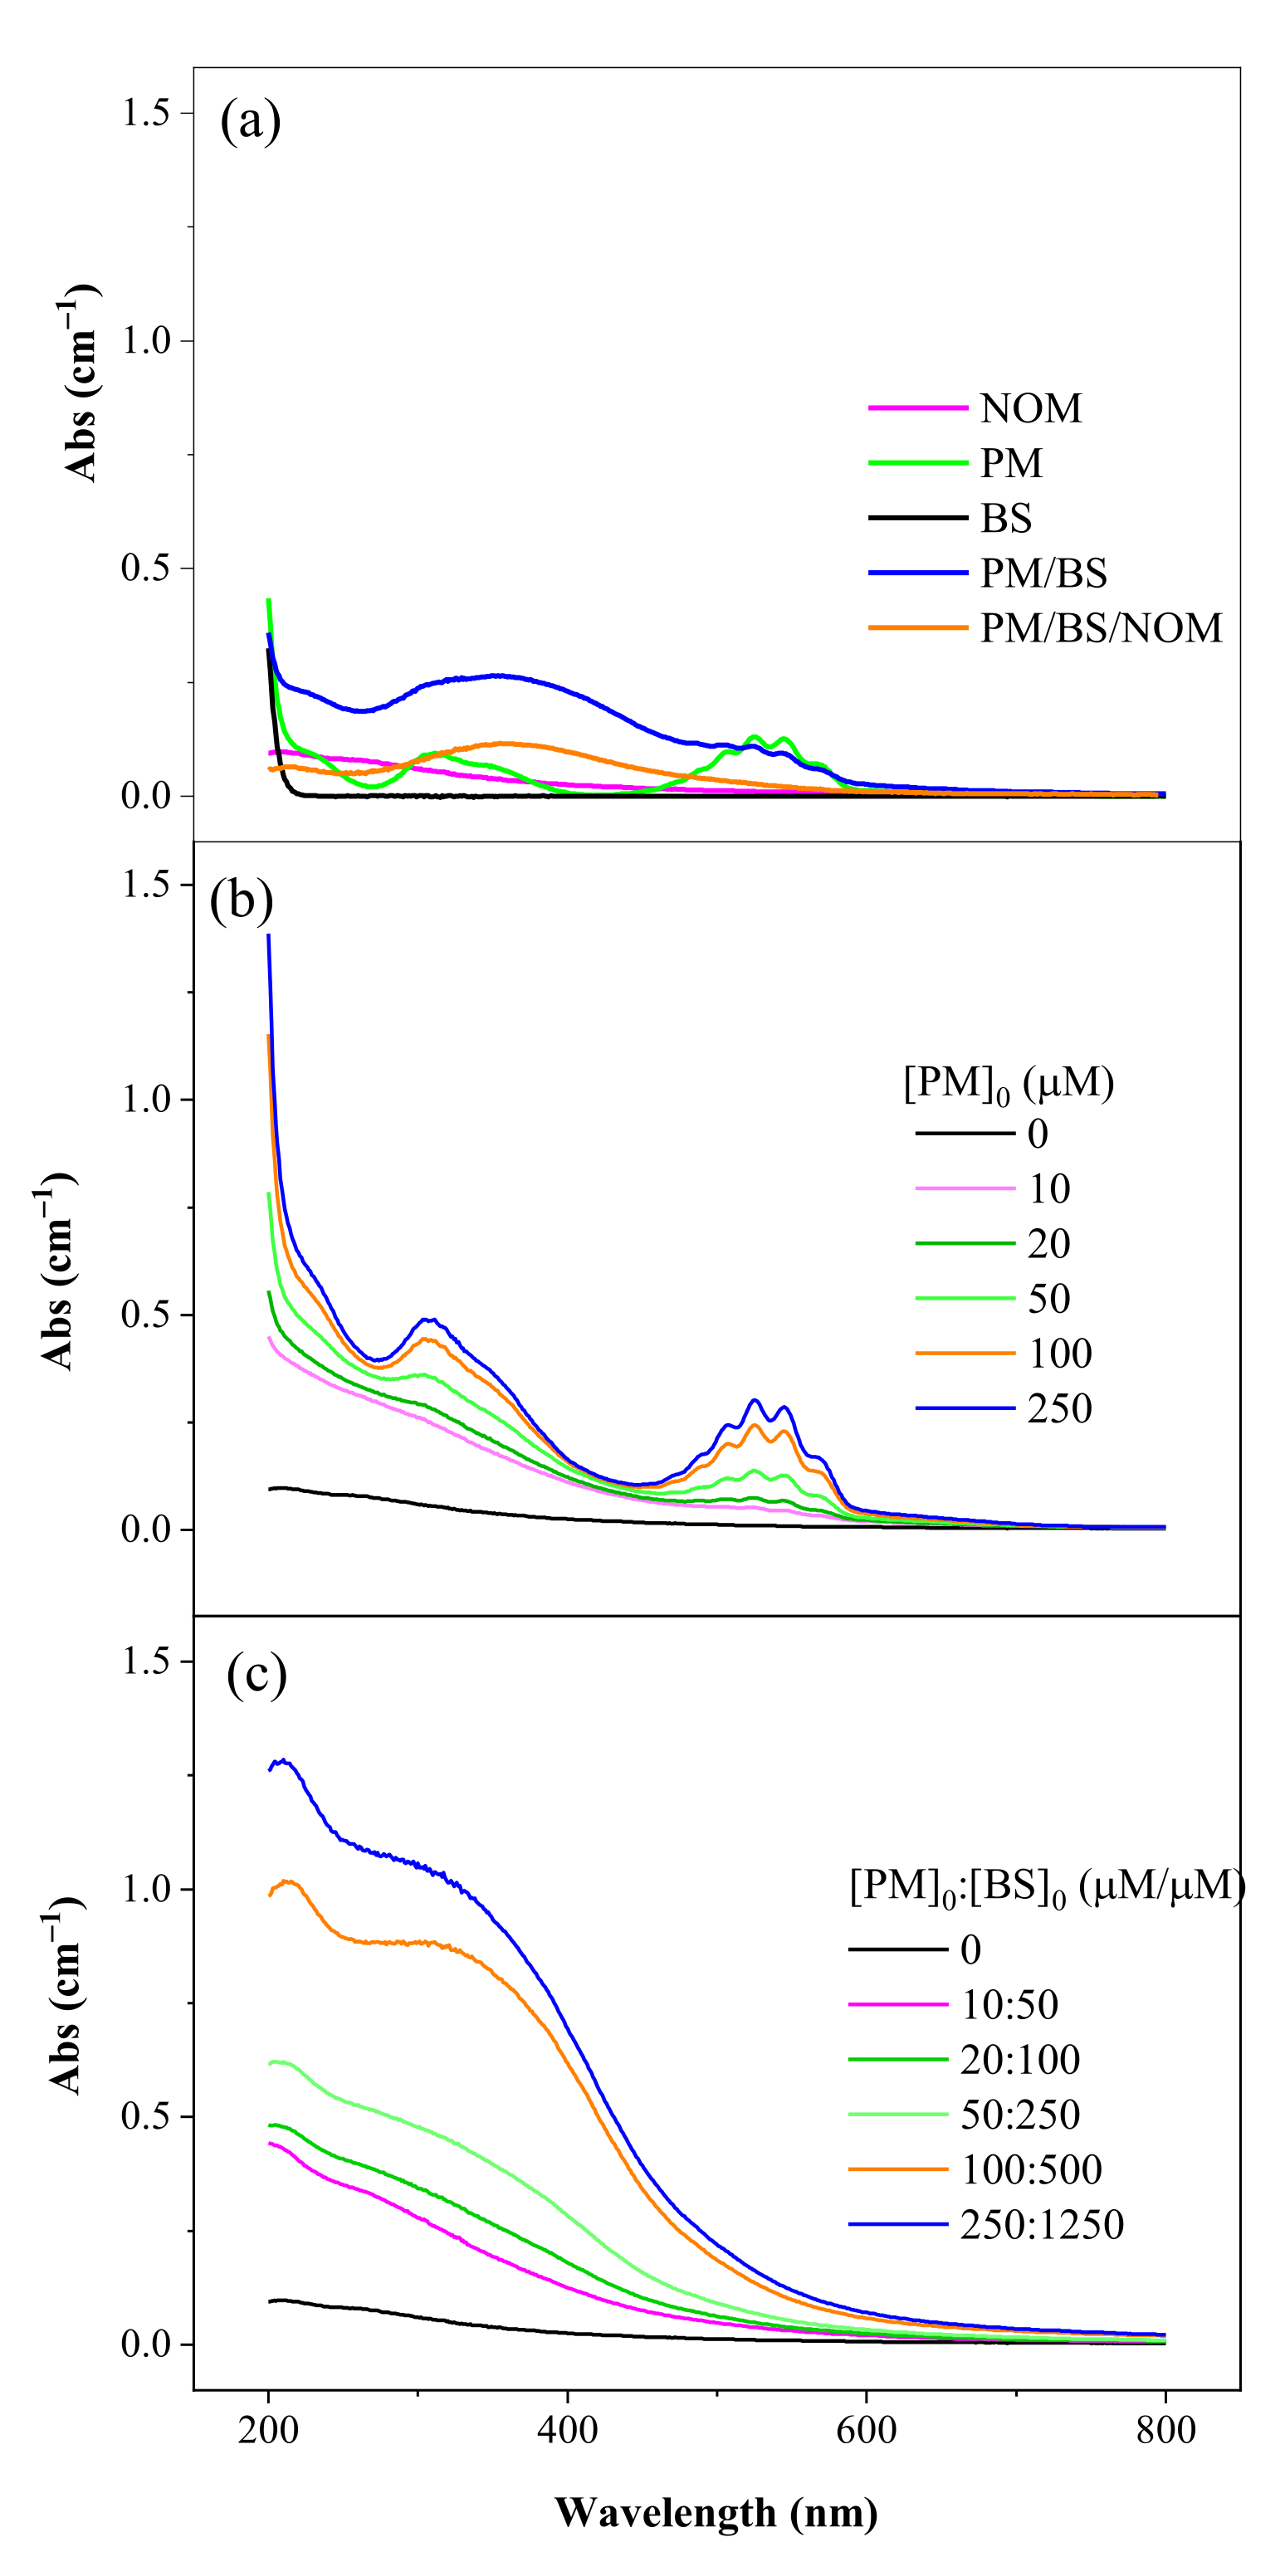
3.1.1. UV-Visible Absorption Spectroscopy of NOM
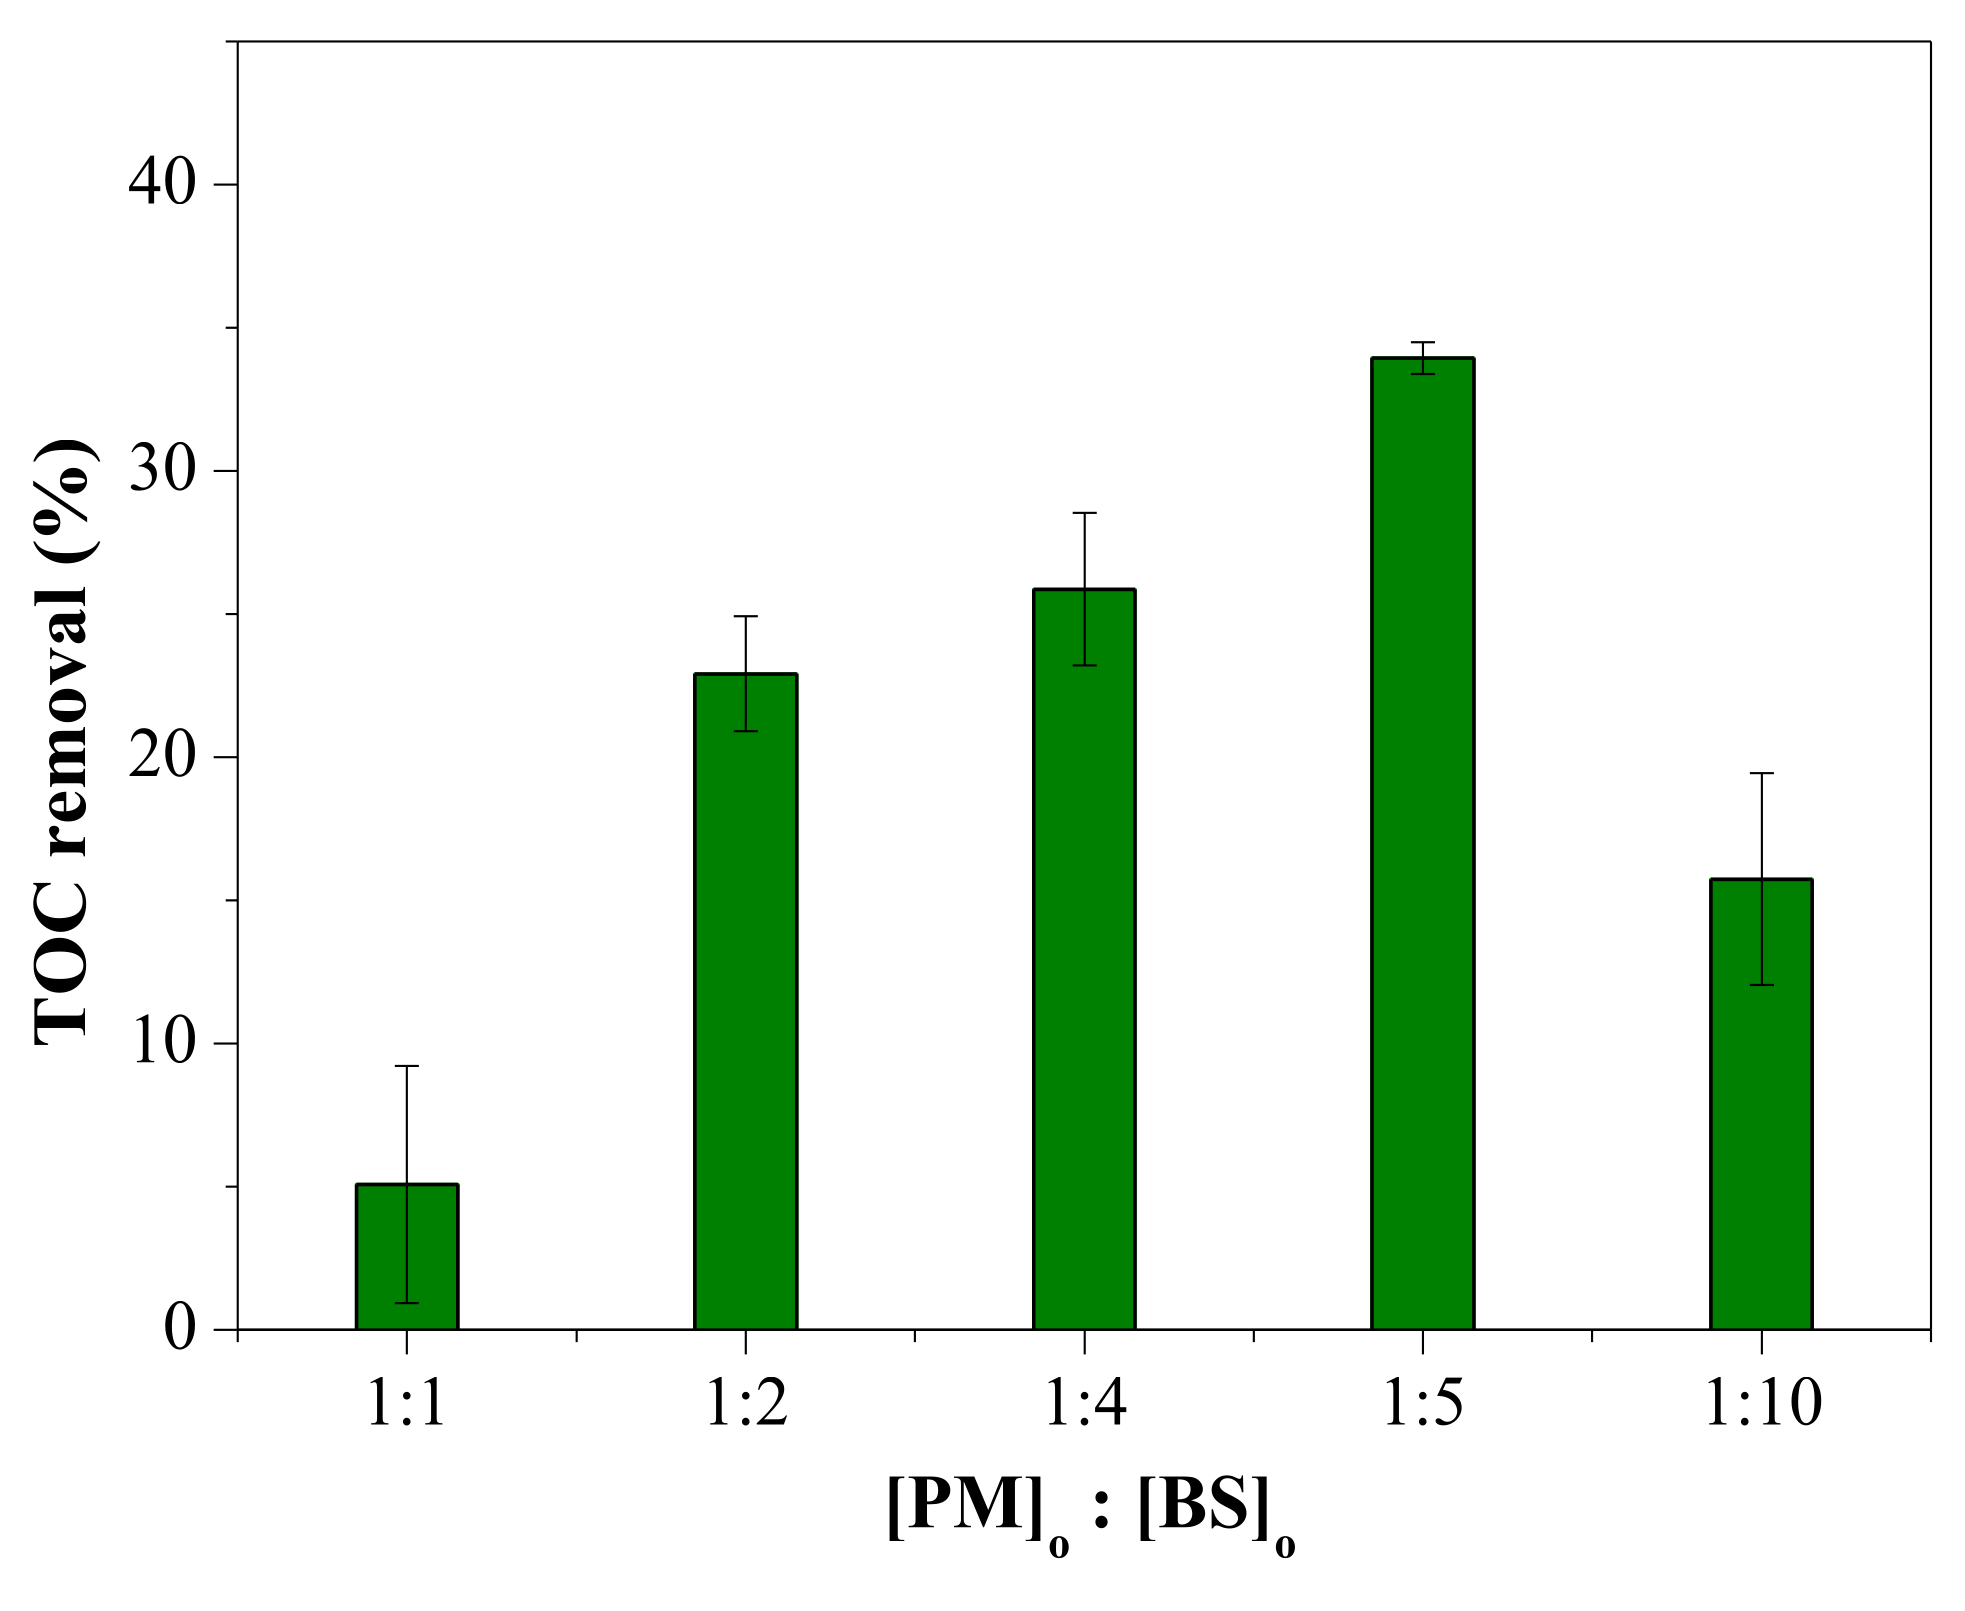
3.1.2. TOC Removal
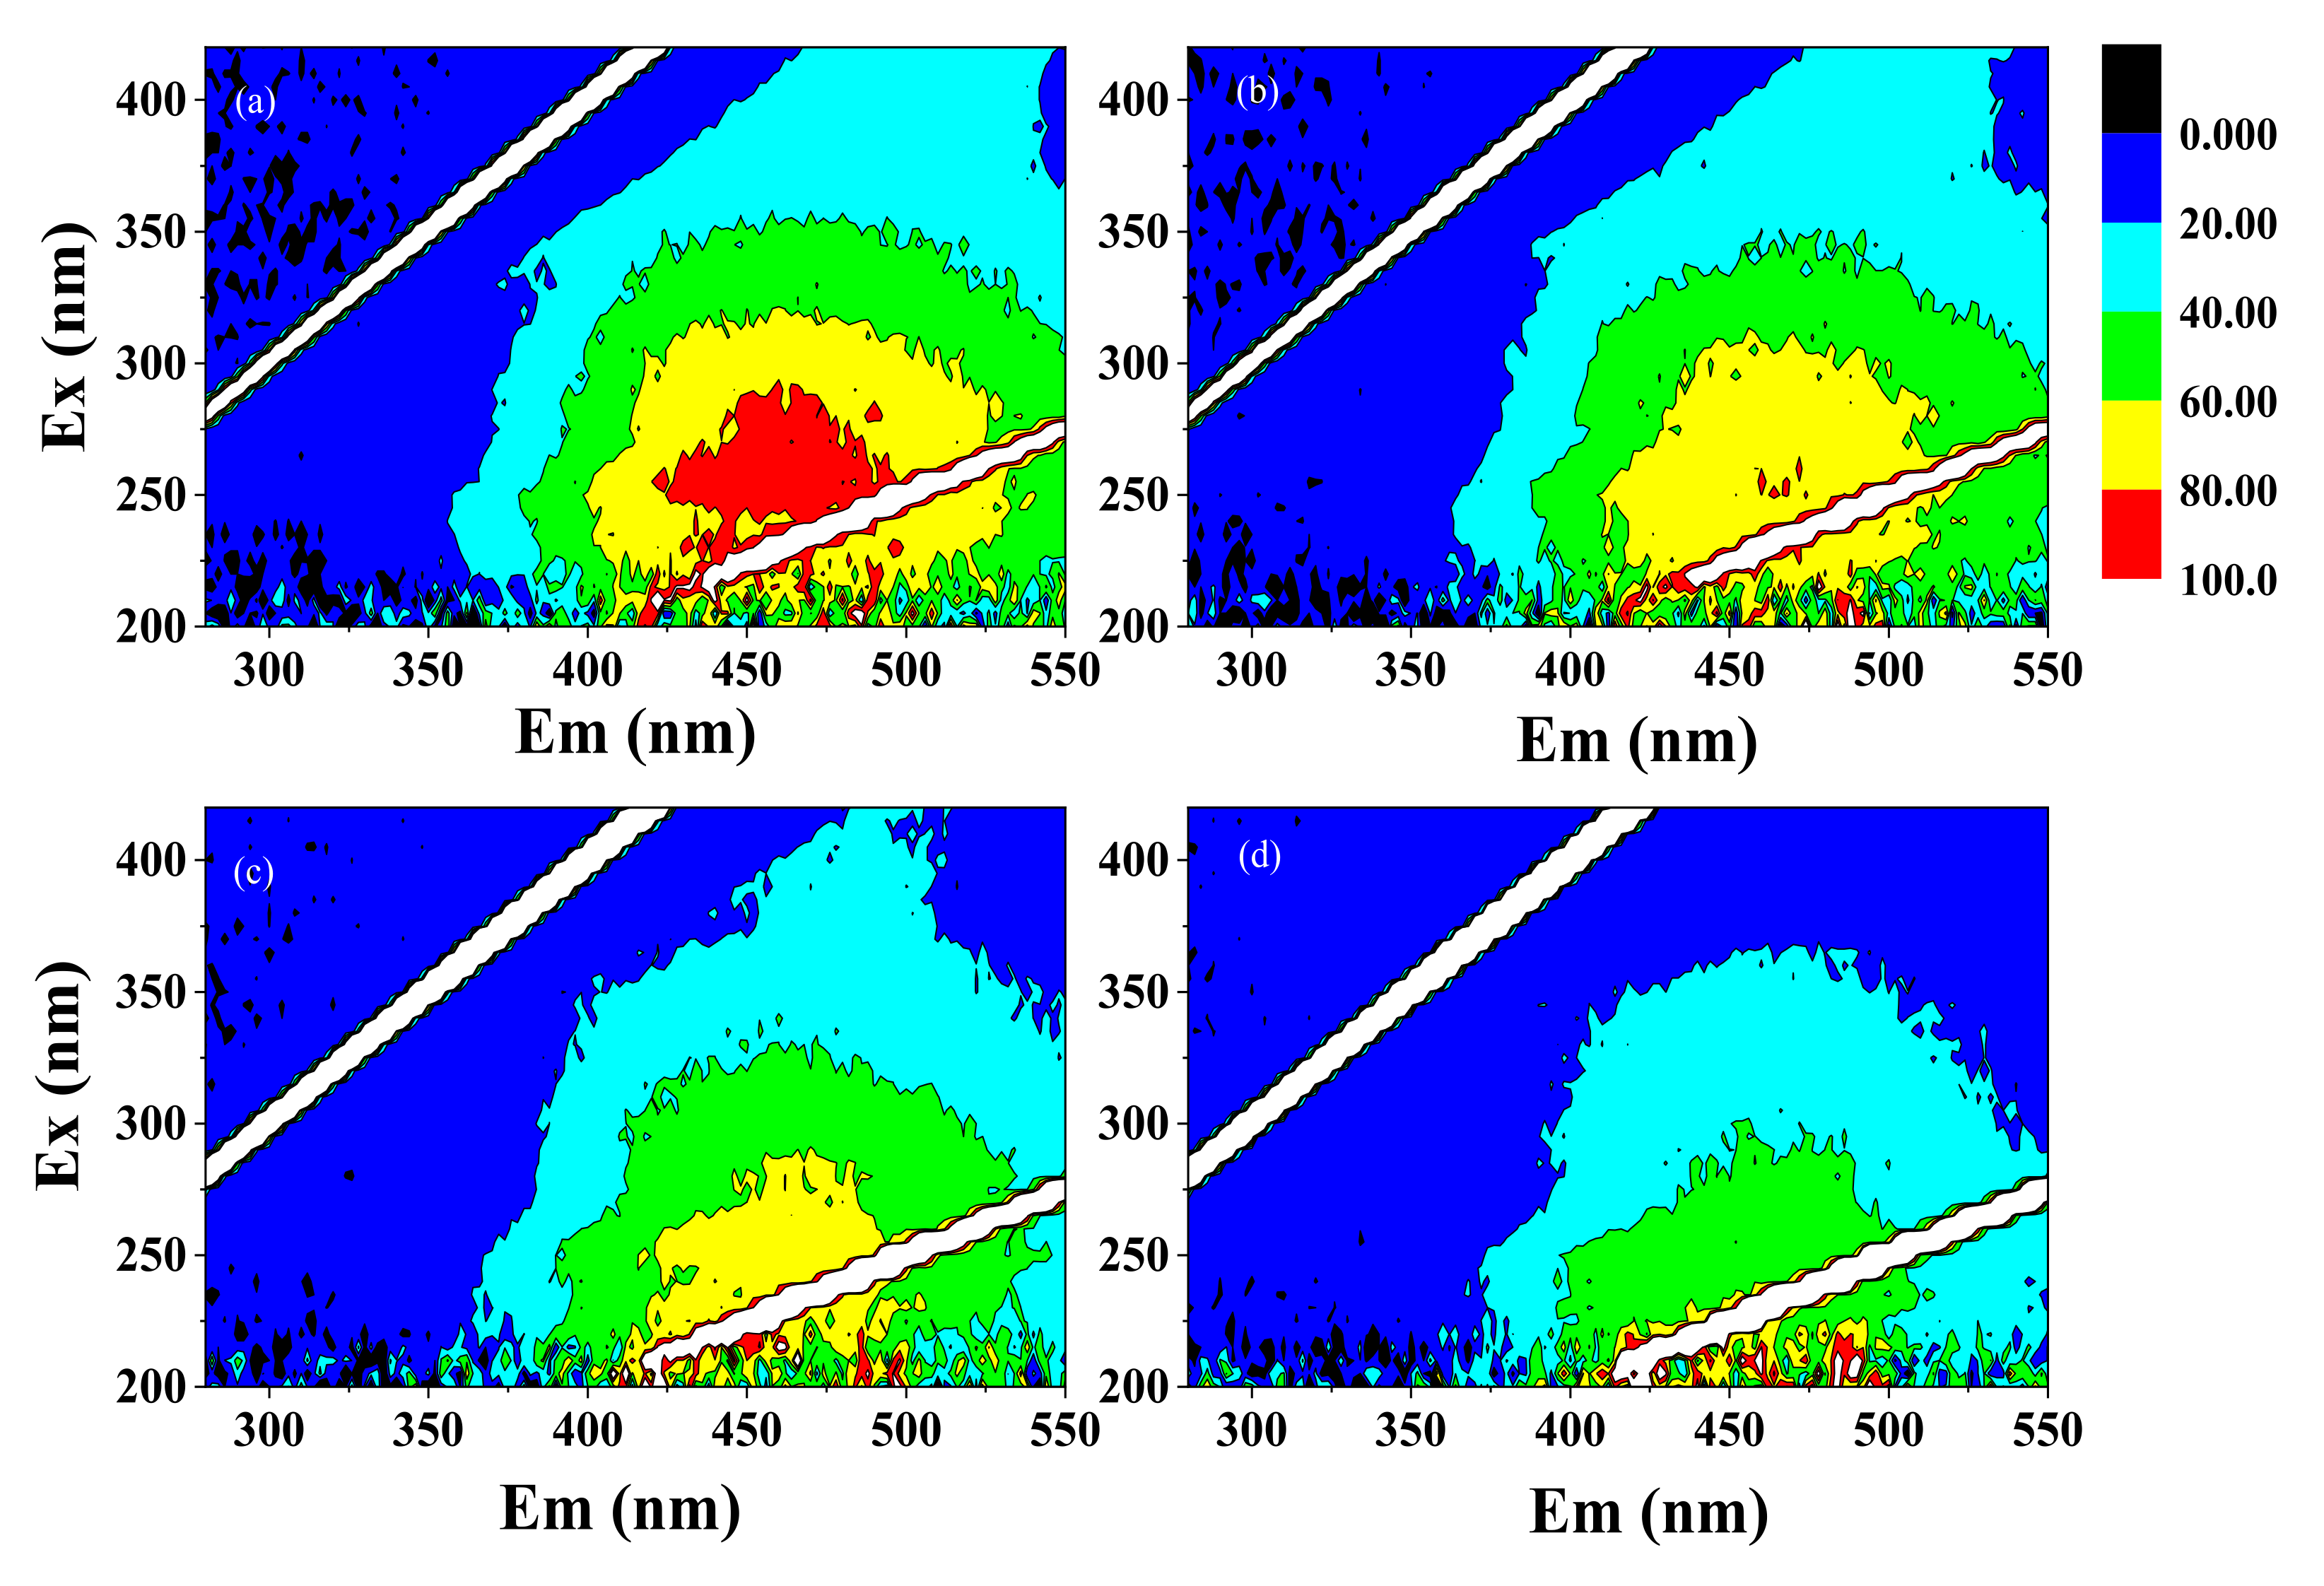
3.1.3. Three-Dimensional Fluorescence Excitation–Emission Matrices of NOM
3.2. Formation Potential of DBPs from NOM
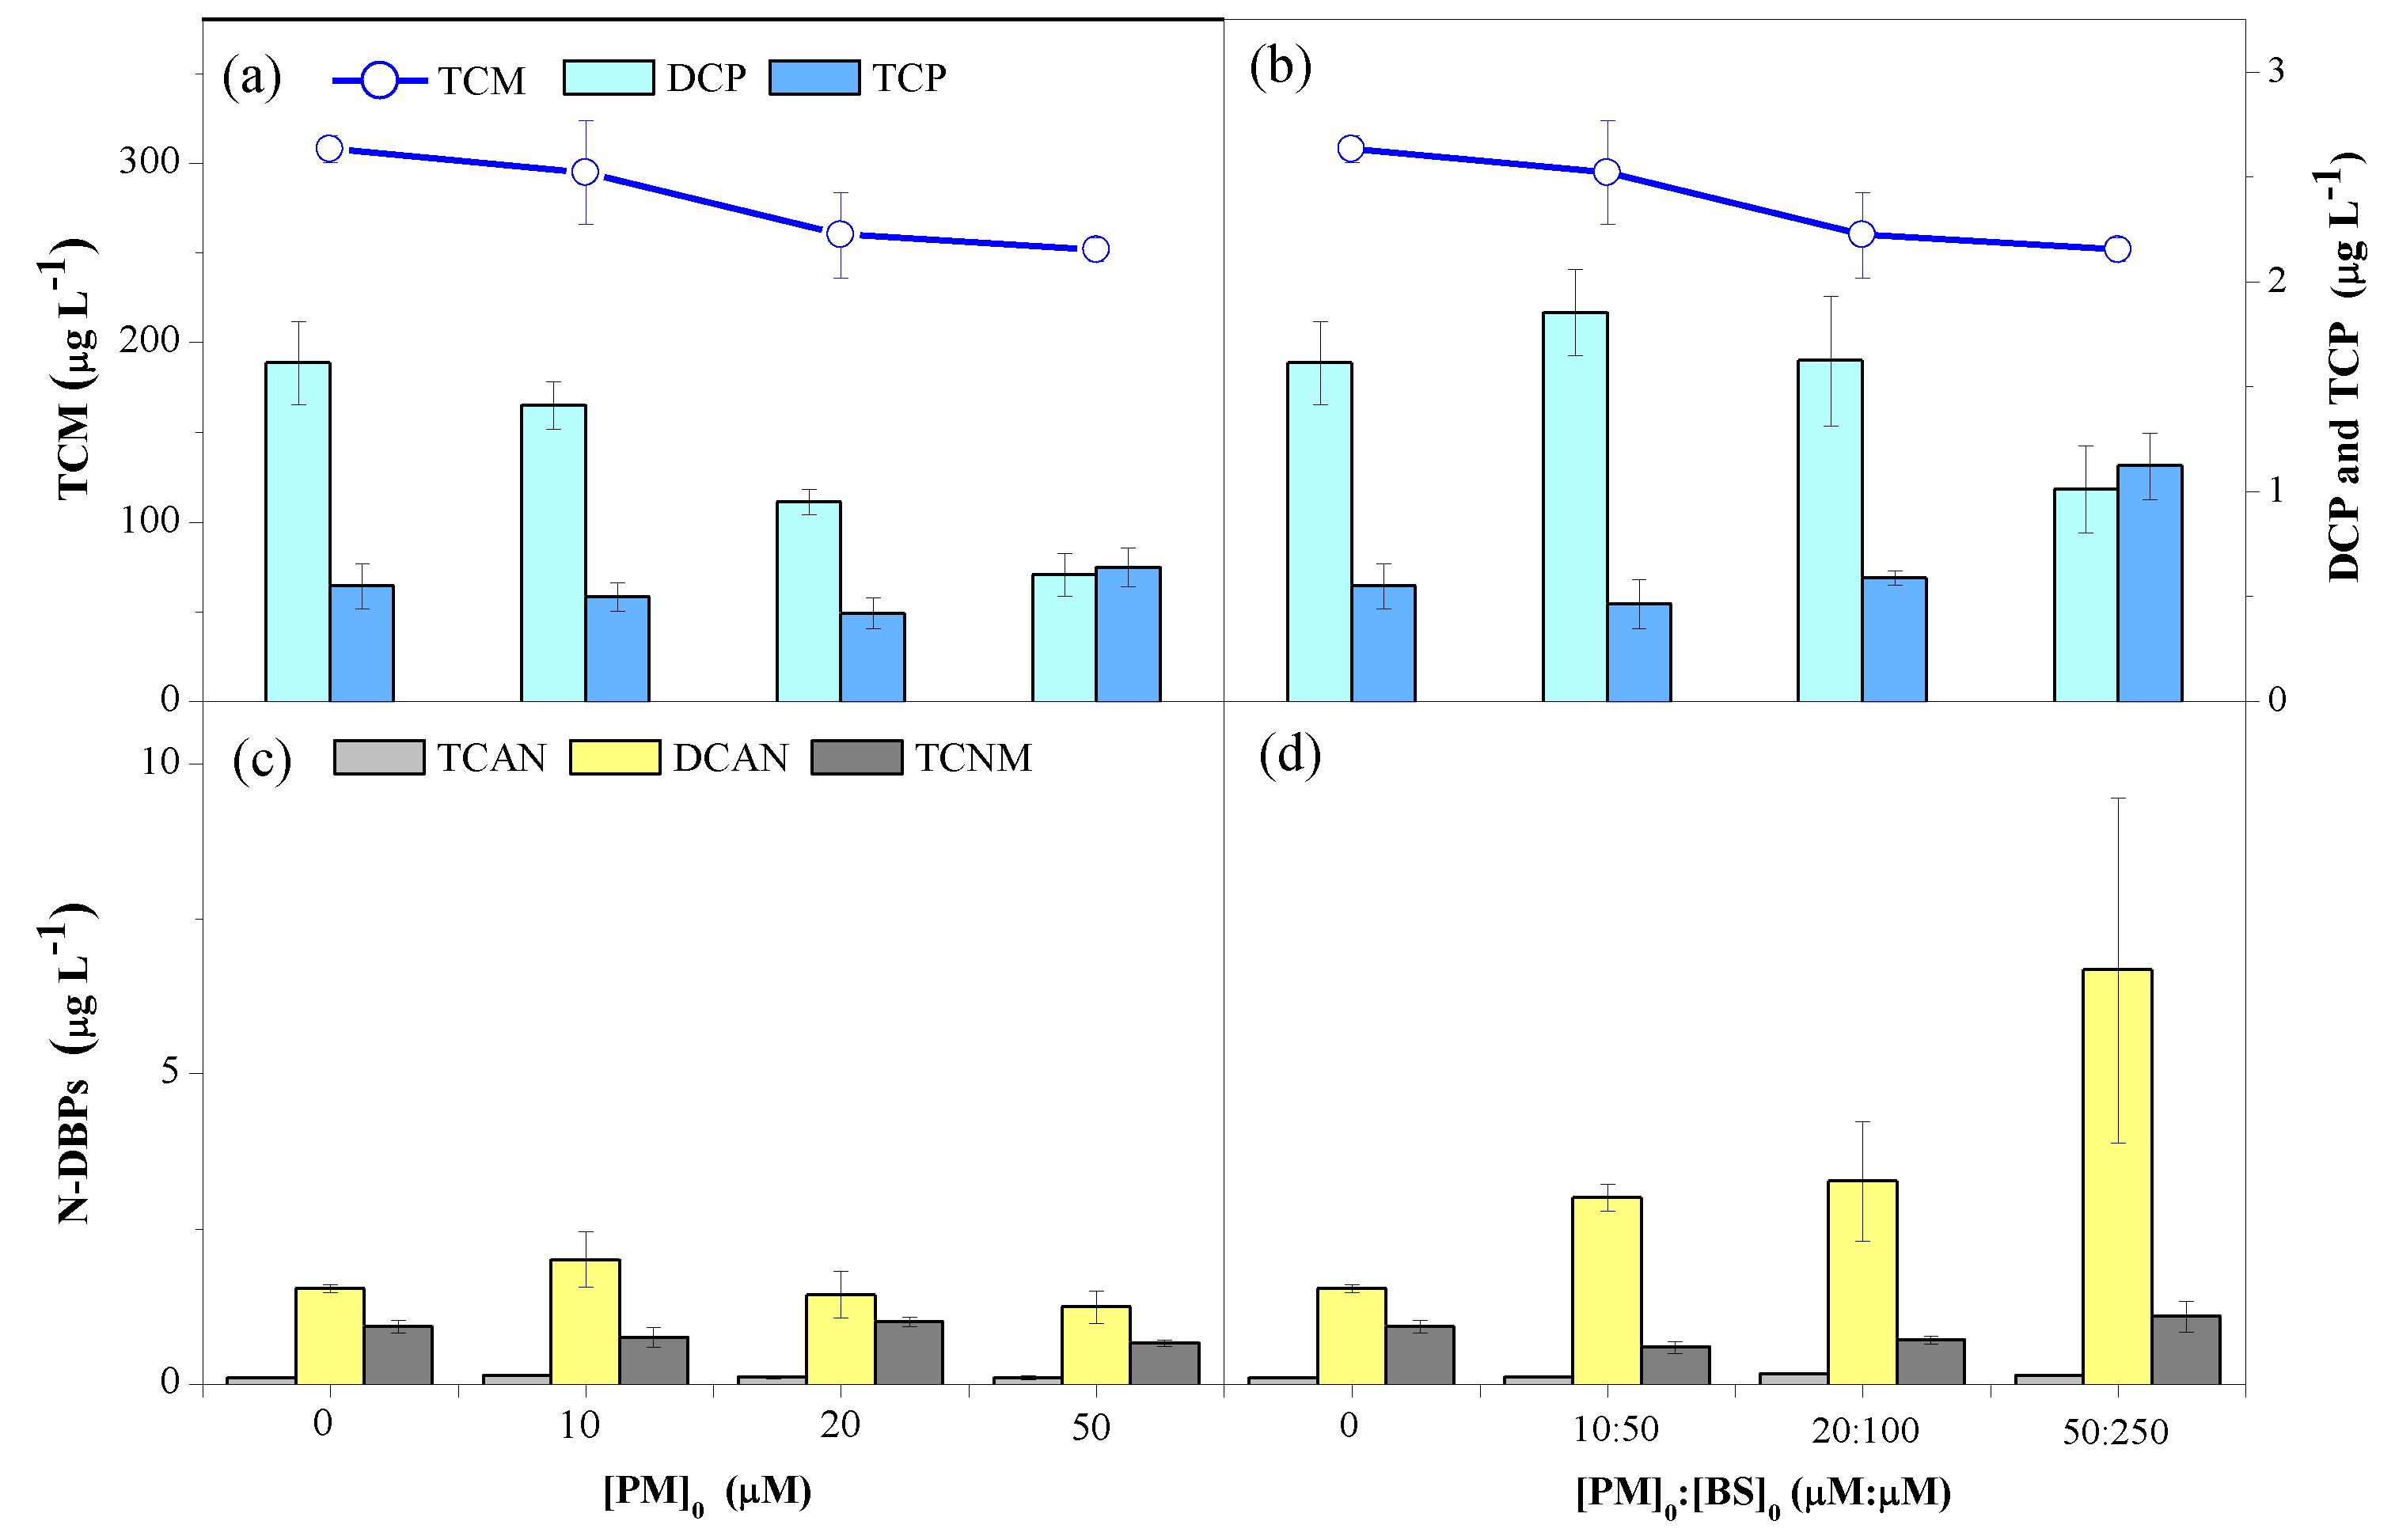
3.2.1. Effects of PM and BS Doses
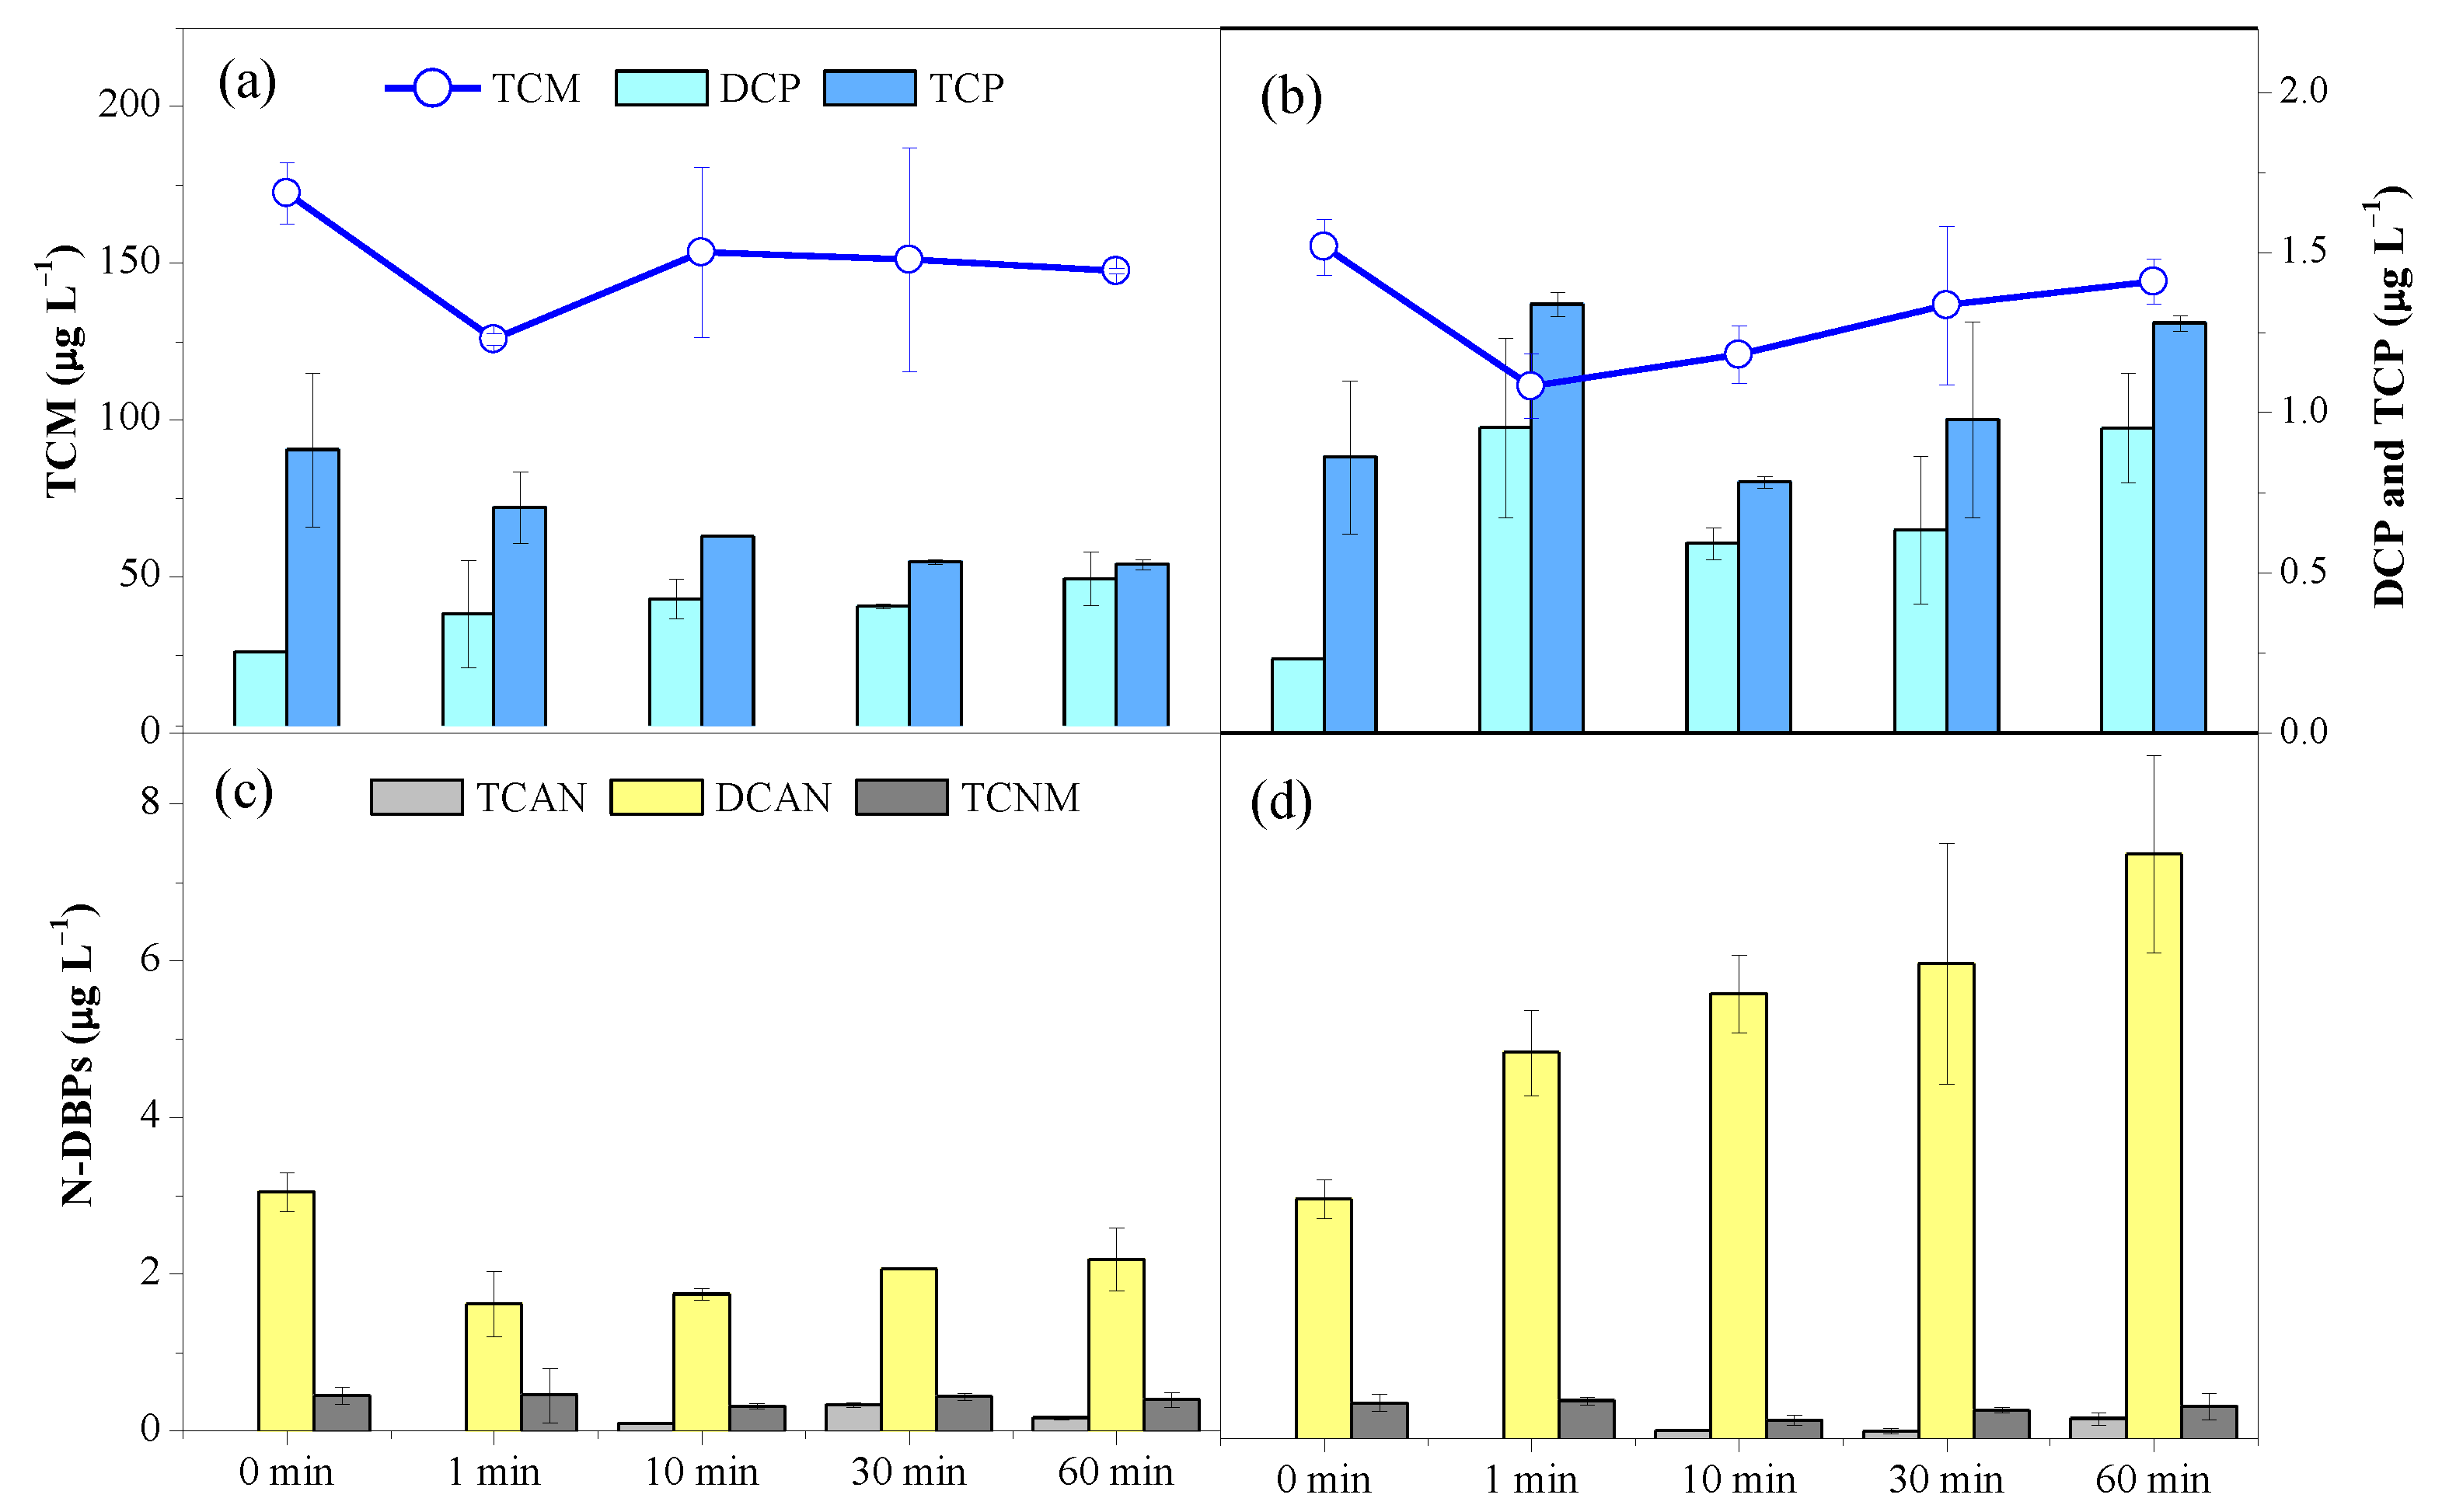
3.2.2. Effects of Pre-Oxidation Time
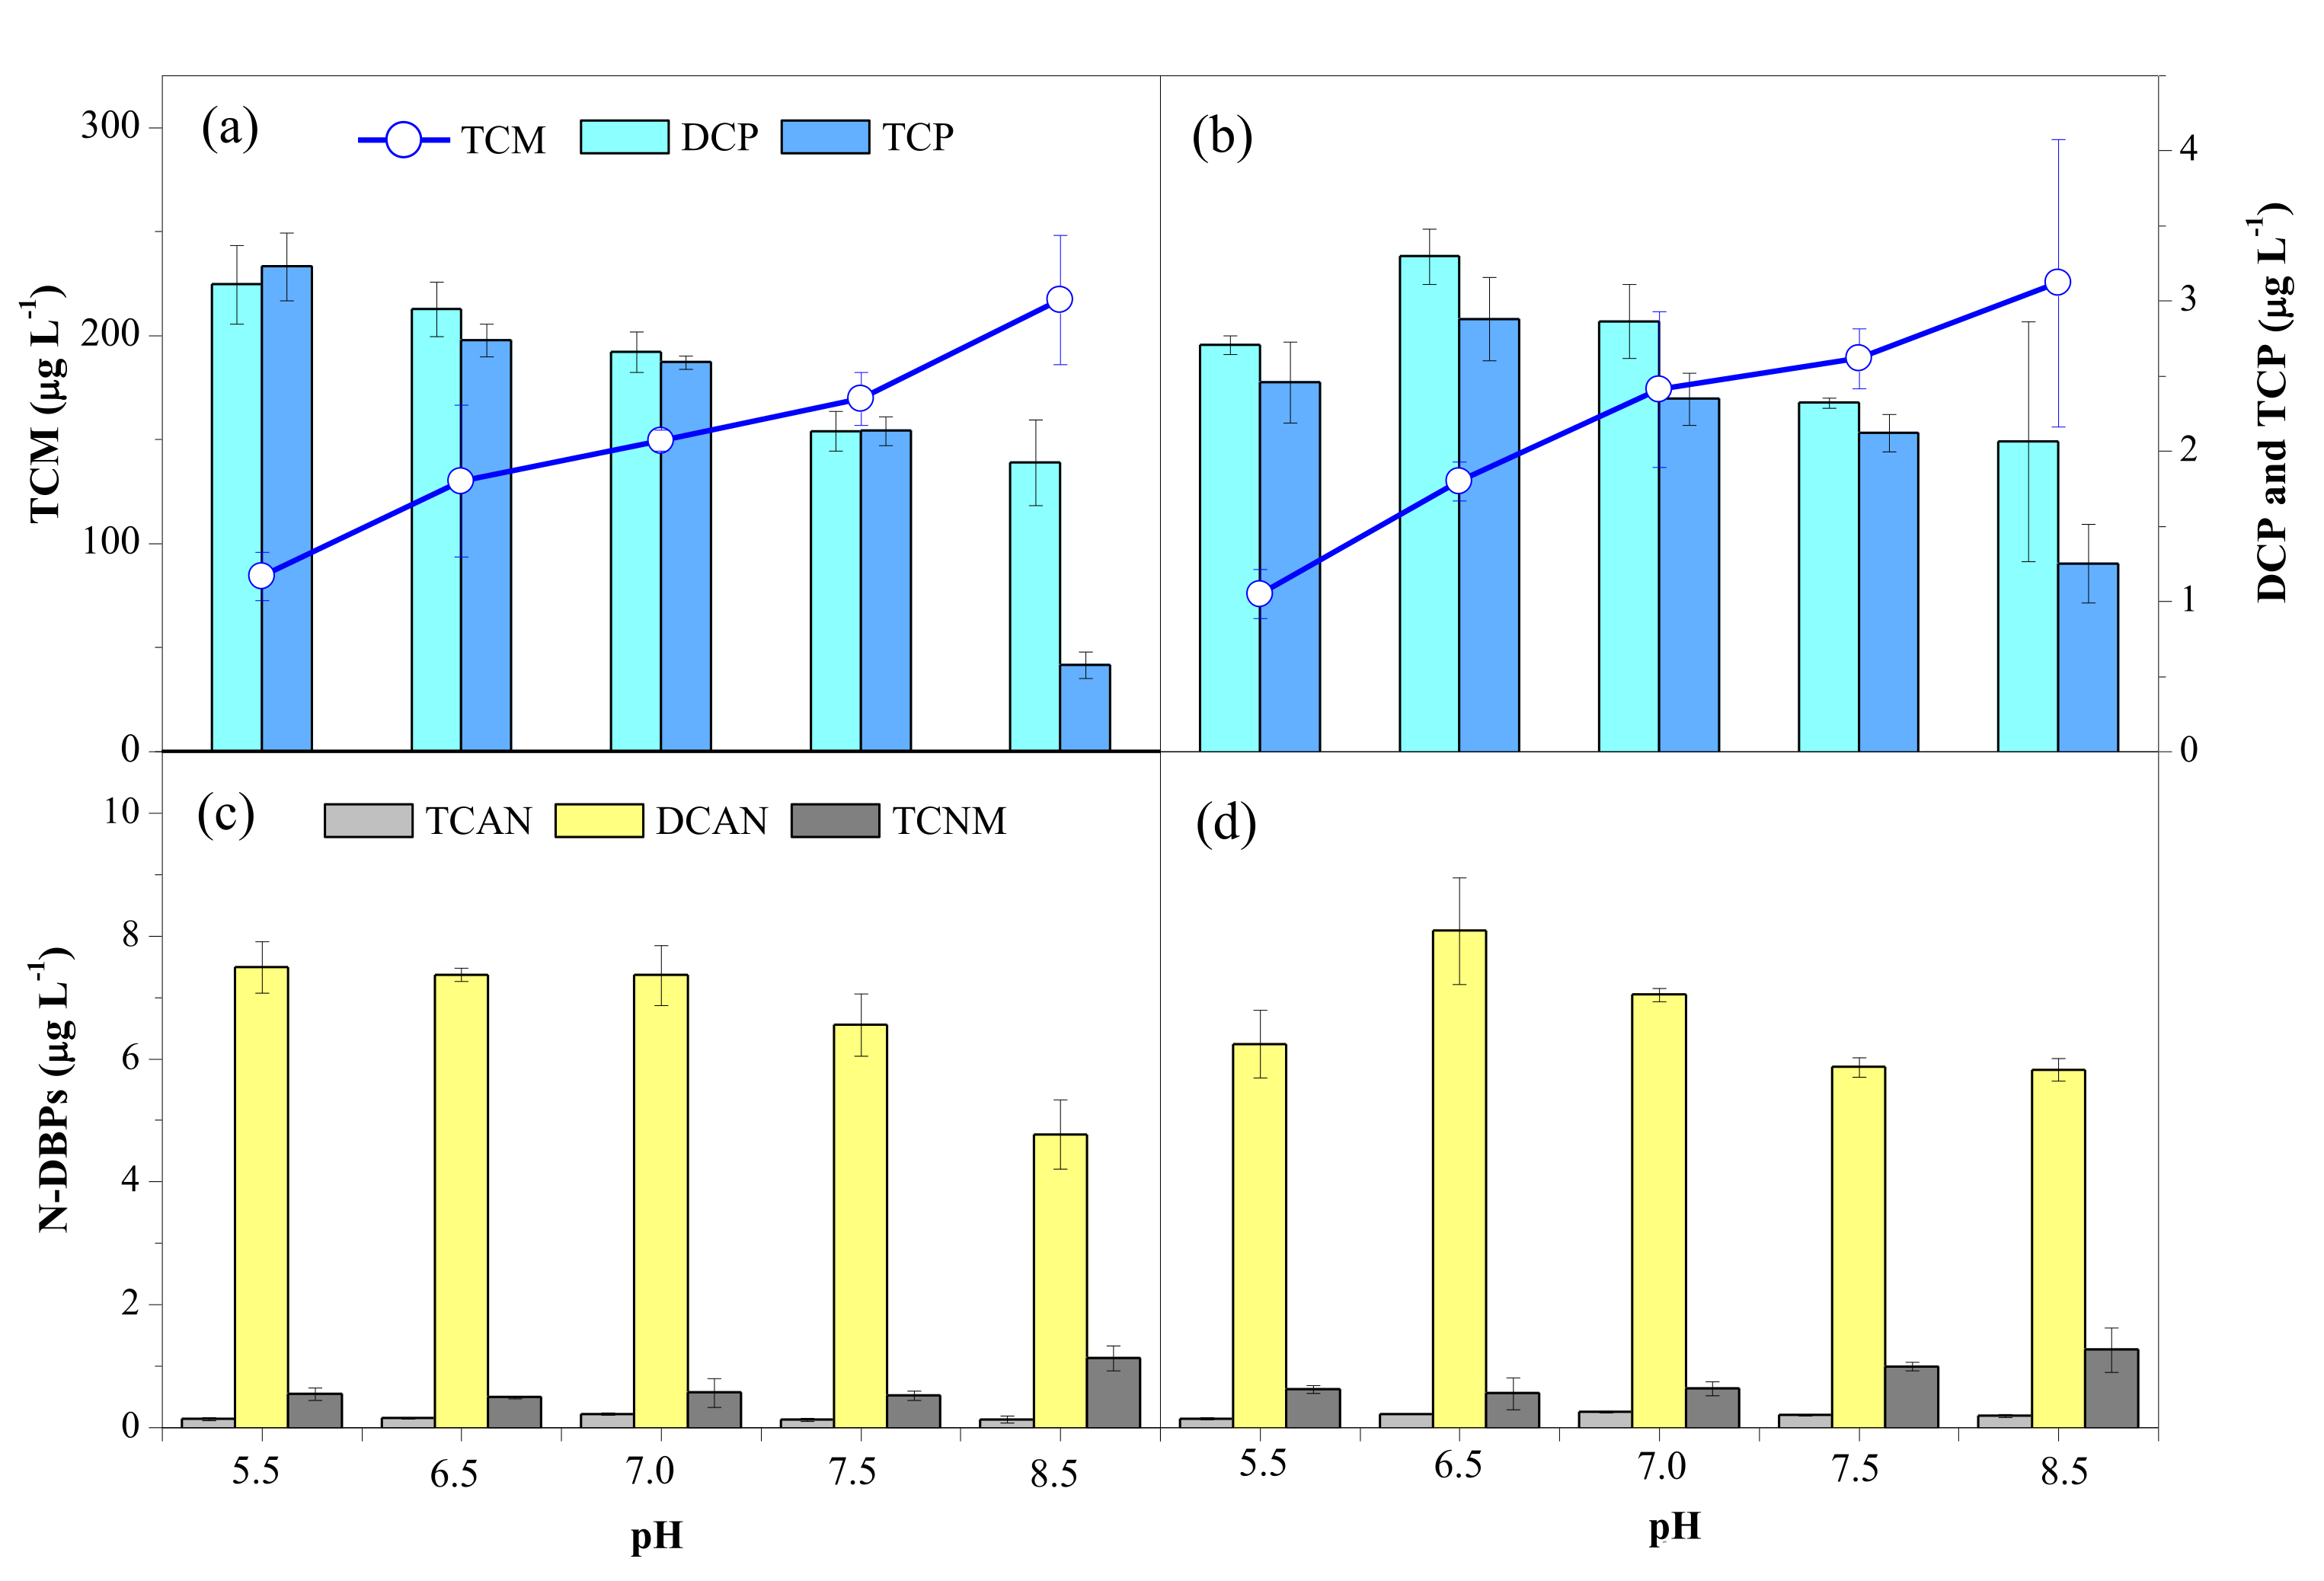
3.2.3. Effect of pH
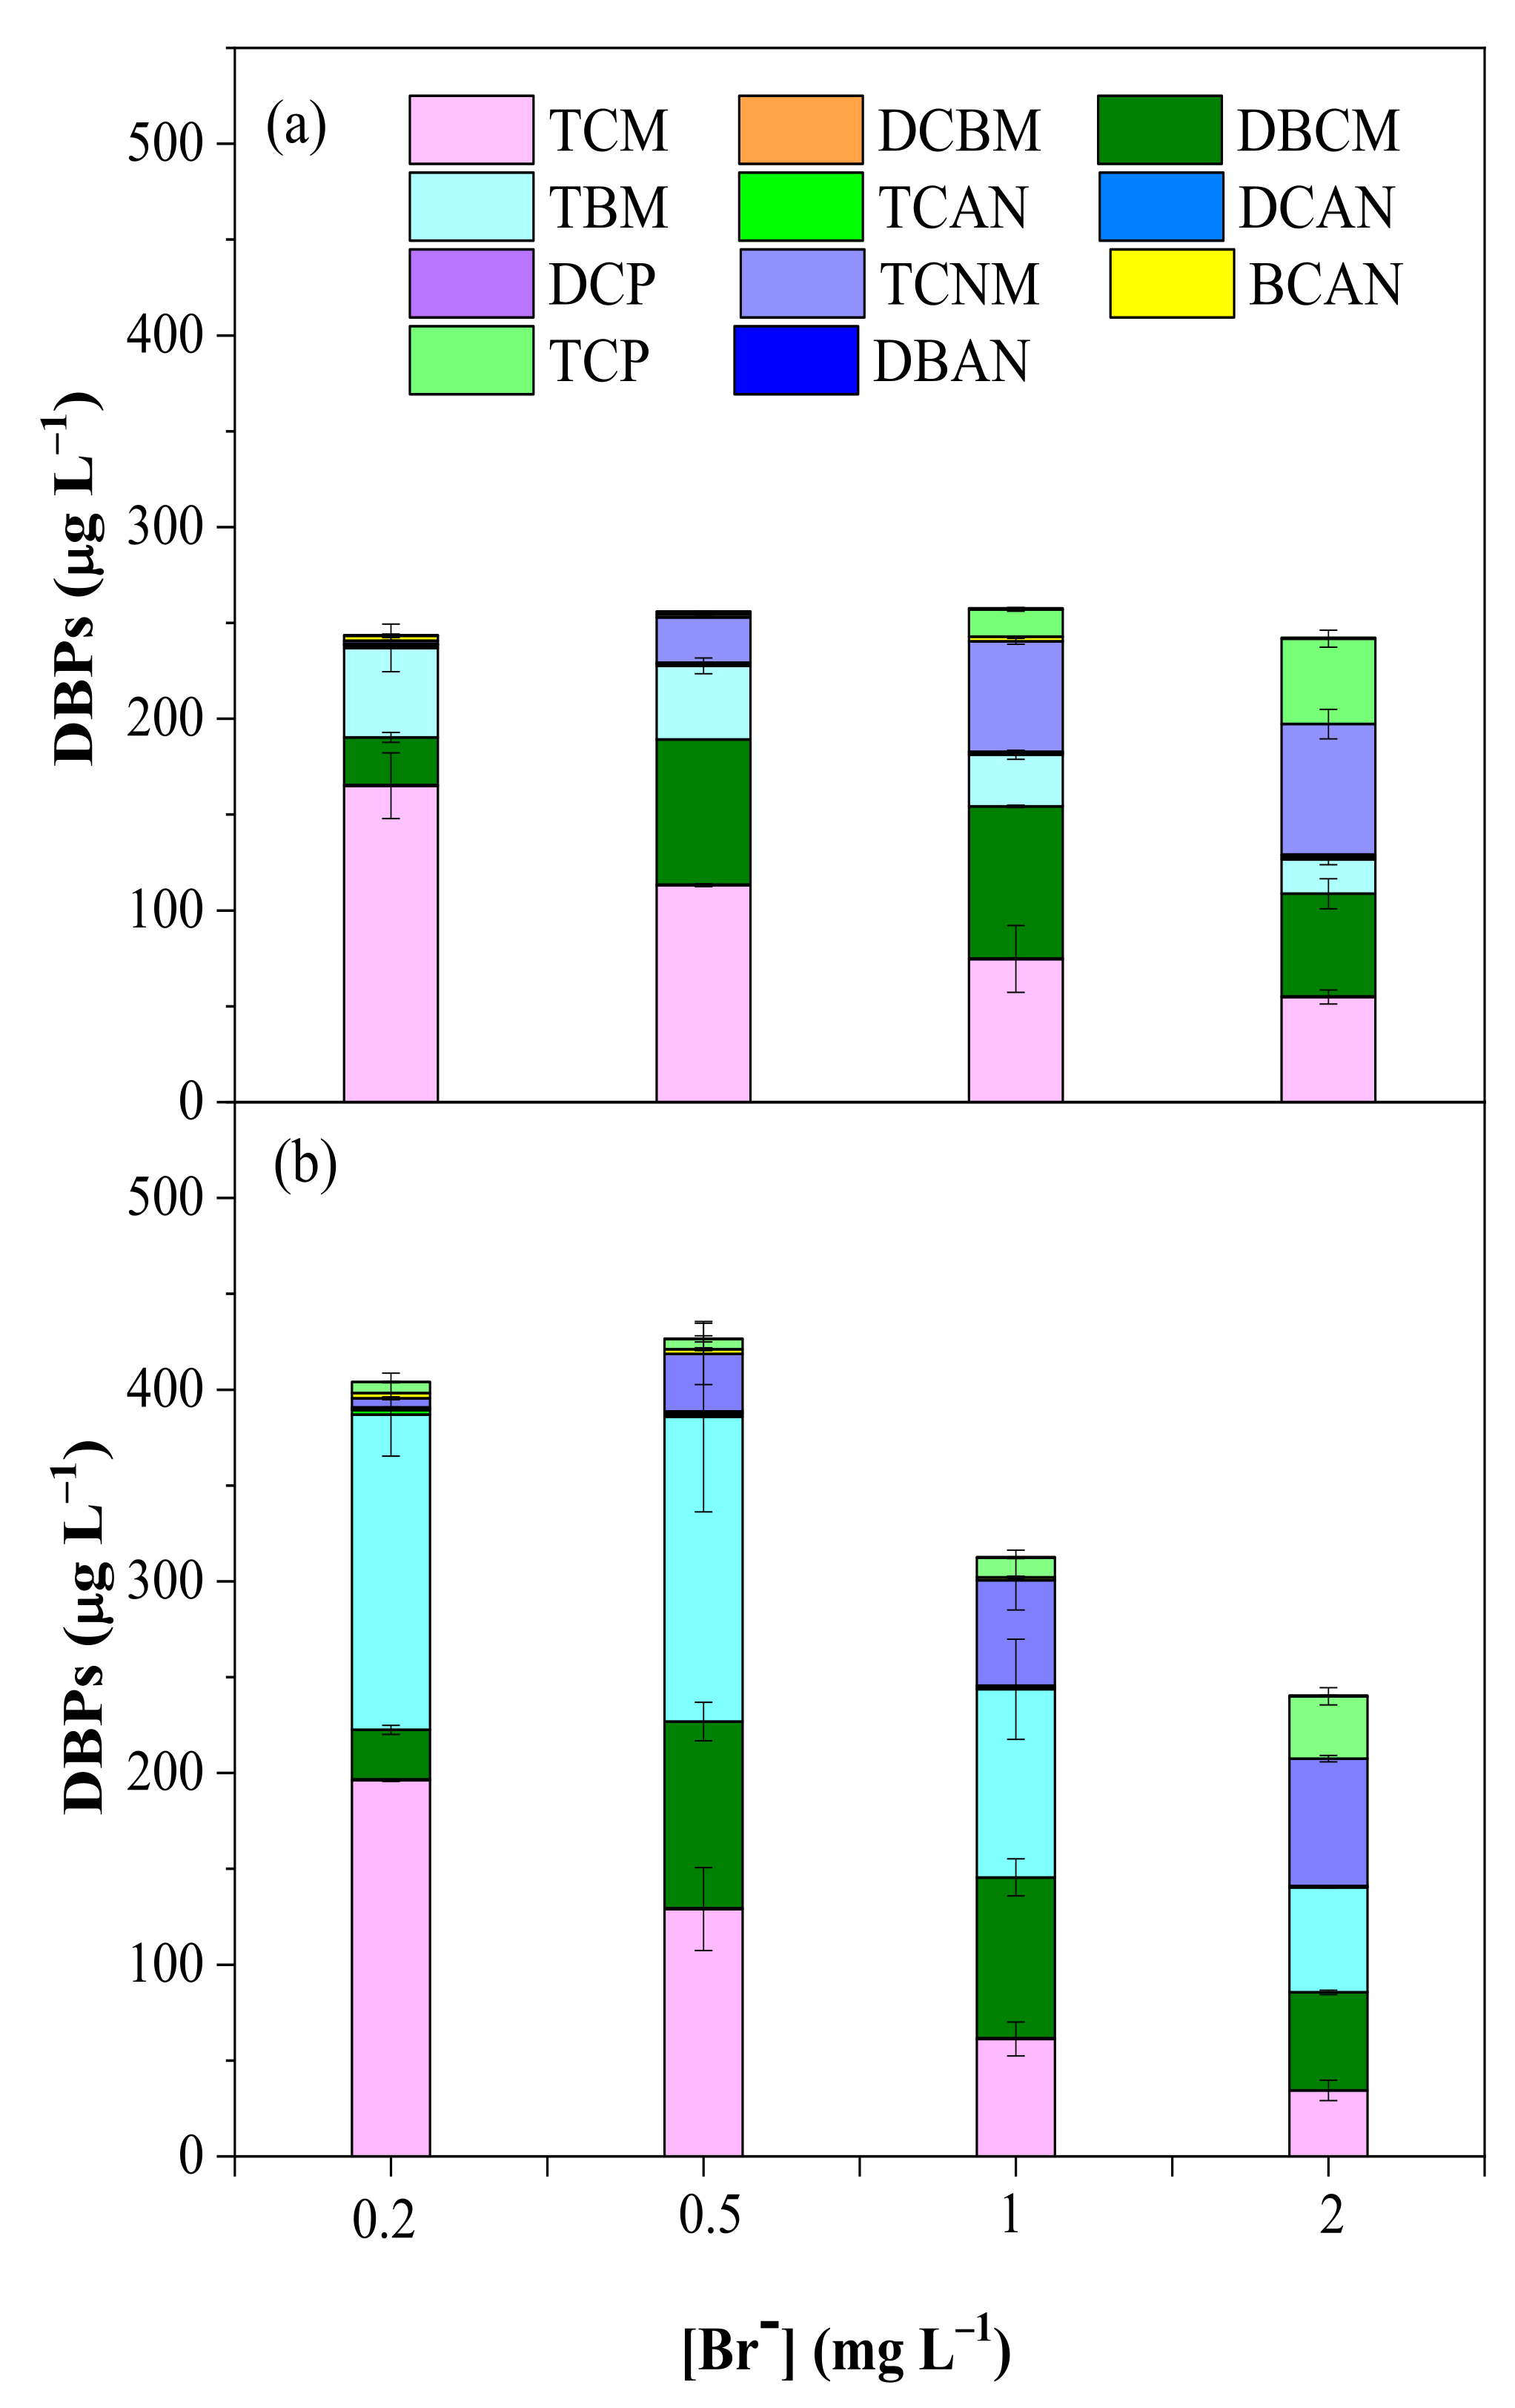
3.2.4. Effect of Br−
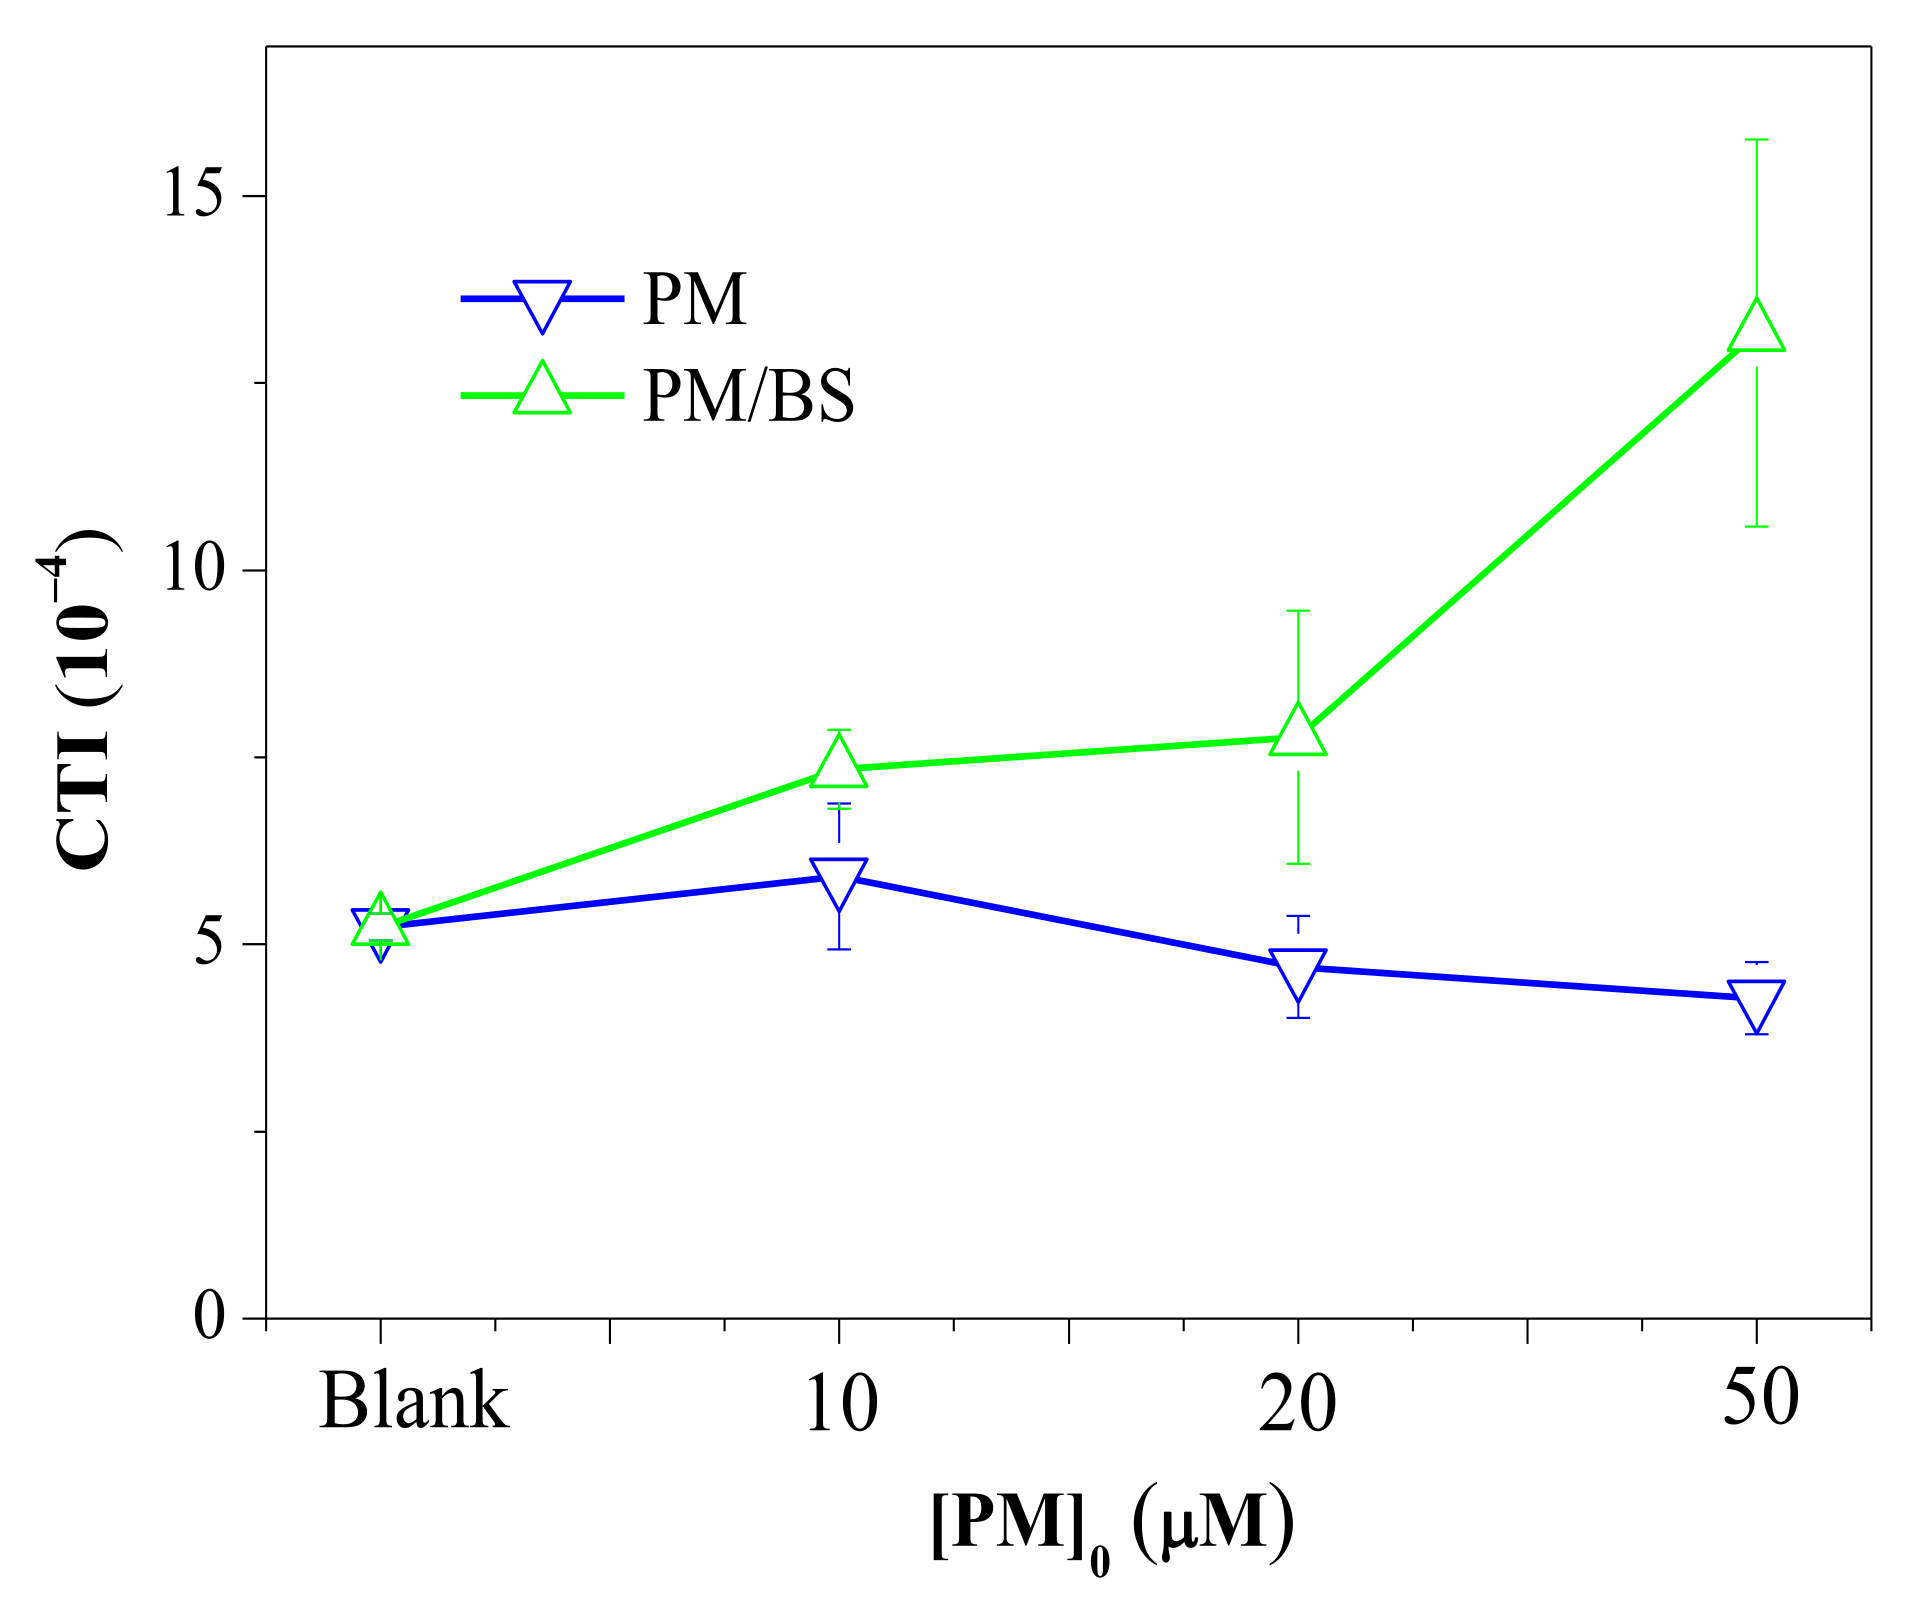
3.3. Calculated Toxicity Analysis
- CTI
- : cytotoxicity index of the selected DBPs;
- CTI
- CX: molar concentration of each DBP;
- CTI
- %C1/2X: concentration of each DBP that induced a cell density of 50%.
4. Conclusions
- TOC removal reached a plateau when the molar ratio of PM to BS was 1:5.
- Increasing ratios of PM to BS decreased the intensity and area of fluorescence spectroscopy.
- PM and BS doses, pre-oxidation time, pH of solutions and concentration of Br− impacted the formation potential of various DBPs.
- PM/BS pre-oxidation decreased the formation of TCM while increasing the yields of N-DBPs, thus increasing the risk of water quality.
Supplementary Materials
Author Contributions
Funding
Institutional Review Board Statement
Informed Consent Statement
Acknowledgments
Conflicts of Interest
References
- Ohanian, E.V.; Mullin, C.S.; Orme, J. Health effects of disinfectants and disinfection by-products: A regulatory perspective. Water Chlorination Environ. Impact Health Eff. 1990, 2, 75–86. [Google Scholar]
- Richardson, S.D.; Plewa, M.J.; Wagner, E.D.; Schoeny, R.; De Marini, D. Occurrence, genotoxicity, and carcinogenicity of regulated and emerging disinfection by-products in drinking water: A review and roadmap for research. Mutat. Res. Mutat. Res. 2007, 636, 178–242. [Google Scholar] [CrossRef] [PubMed]
- Costet, N.; Villanueva, C.M.; Jaakkola, J.J.K.; Kogevinas, M.; Cantor, K.P.; King, W.D.; Lynch, C.F.; Nieuwenhuijsen, M.J.; Cordier, S. Water disinfection by-products and bladder cancer: Is there a European specificity? A pooled and meta-analysis of European case-control studies. Occup. Environ. Med. 2011, 68, 379–385. [Google Scholar] [CrossRef] [PubMed]
- Hua, G.; Reckhow, D.A. Characterization of Disinfection Byproduct Precursors Based on Hydrophobicity and Molecular Size. Environ. Sci. Technol. 2007, 41, 3309–3315. [Google Scholar] [CrossRef] [PubMed]
- Li, X.-F.; Mitch, W.A. Drinking Water Disinfection Byproducts (DBPs) and Human Health Effects: Multidisciplinary Challenges and Opportunities. Environ. Sci. Technol. 2018, 52, 1681–1689. [Google Scholar] [CrossRef] [PubMed]
- Roccaro, P.; Vagliasindi, F.G.A. Differential vs. absolute UV absorbance approaches in studying NOM reactivity in DBPs formation: Comparison and applicability. Water Res. 2009, 43, 744–750. [Google Scholar] [CrossRef] [PubMed]
- Roccaro, P.; Chang, H.-S.; Vagliasindi, F.G.; Korshin, G.V. Differential absorbance study of effects of temperature on chlorine consumption and formation of disinfection by-products in chlorinated water. Water Res. 2008, 42, 1879–1888. [Google Scholar] [CrossRef] [PubMed]
- Sanly, L.M.; Chiang, K.; Amal, R.; Fabris, R.; Chow, C.; Drikas, M. A Study on the Removal of Humic Acid Using Advanced Oxidation Processes. Sep. Sci. Technol. 2007, 42, 1391–1404. [Google Scholar] [CrossRef]
- Von Gunten, U. Disinfection and byproduct formation in presence of bromide, iodide or chlorine. Water Res. 2003, 37, 1469–1487. [Google Scholar] [CrossRef]
- Mao, Y.; Wang, X.; Yang, H.; Wang, H.; Xie, Y.F. Effects of ozonation on disinfection byproduct formation and speciation during subsequent chlorination. Chemosphere 2014, 117, 515–520. [Google Scholar] [CrossRef] [PubMed]
- Li, C.; Li, X.; Graham, N. A study of the preparation and reactivity of potassium ferrate. Chemosphere 2005, 61, 537–543. [Google Scholar] [CrossRef] [PubMed]
- Xu, L.; Dong, H.; Xu, K.; Li, J.; Qiang, Z. Accelerated degradation of pesticide by permanganate oxidation: A comparison of organic and inorganic activations. Chem. Eng. J. 2019, 369, 1119–1128. [Google Scholar] [CrossRef]
- Duan, S.; Hou, P.; Yuan, X.; Stanic, M.; Qiang, Z.; Dong, H. Homogeneous activation of bisulfite by transition metals for micro-pollutant degradation: Mn (VII) versus Cr (VI). Chem. Eng. J. 2020, 394, 124814. [Google Scholar] [CrossRef]
- Liu, C.; Zhao, M.; He, S.; Cao, Z.; Chen, W. Activation of permanganate with hydrogen sulfite for enhanced oxidation of a typical amino acid. Environ. Technol. 2018, 40, 1605–1614. [Google Scholar] [CrossRef] [PubMed]
- Gao, Y.; Jiang, J.; Zhou, Y.; Pang, S.-Y.; Ma, J.; Jiang, C.; Wang, Z.; Wang, P.-X.; Wang, L.-H.; Li, J. Unrecognized role of bisulfite as Mn(III) stabilizing agent in activating permanganate (Mn(VII)) for enhanced degradation of organic contaminants. Chem. Eng. J. 2017, 327, 418–422. [Google Scholar] [CrossRef]
- USEPA. Method 551.1. Determination of Chlorination Disinfection by Products, Chlorinated Solvents, and Halogenated Pesticides/Herbicides in Drinking Water by Liquid-Liquid Extraction and Gas Chromatography with Electron-Capture Detection; National Exposure Research Laboratory Office of Research and Development: Cincinnati, OH, USA, 1995. [Google Scholar]
- Huang, S.; Gan, W.; Yan, M.; Zhang, X.; Zhong, Y.; Yang, X. Differential UV–vis absorbance can characterize the reaction of organic matter with ClO2. Water Res. 2018, 139, 442–449. [Google Scholar] [CrossRef] [PubMed]
- Gan, W.; Sharma, V.; Zhang, X.; Yang, L.; Yang, X. Investigation of disinfection byproducts formation in ferrate(VI) pre-oxidation of NOM and its model compounds followed by chlorination. J. Hazard. Mater. 2015, 292, 197–204. [Google Scholar] [CrossRef] [PubMed]
- Krasner, S.W.; Weinberg, H.S.; Richardson, S.D.; Pastor, S.J.; Chinn, R.; Sclimenti, M.J.; Onstad, G.D.; Thruston, A.D. Occurrence of a New Generation of Disinfection Byproducts. Environ. Sci. Technol. 2006, 40, 7175–7185. [Google Scholar] [CrossRef] [PubMed]
- Plewa, M.J.; Wagner, E.D.; Muellner, M.G.; Hsu, K.-M.; Richardson, S.D. Comparative Mammalian Cell Toxicity of N-DBPs and C-DBPs; ACS Symposium Series; Oxford University Press: Oxford, UK, 2007; Volume 3, pp. 36–50. [Google Scholar]
- Plewa, M.J.; Wagner, E.D. Charting a new path to resolve the adverse health effects of DBPs, Chapter 1. In Recent Advances in Disinfection By-Products; Karanfil, T., Mitch, B., Westerhoff, P., Xie, Y., Eds.; American Chemical Society: Washington, DC, USA, 2015; pp. 3–23. [Google Scholar]


Publisher’s Note: MDPI stays neutral with regard to jurisdictional claims in published maps and institutional affiliations. |
© 2022 by the authors. Licensee MDPI, Basel, Switzerland. This article is an open access article distributed under the terms and conditions of the Creative Commons Attribution (CC BY) license (https://creativecommons.org/licenses/by/4.0/).
Share and Cite
He, S.; Ren, N. Permanganate/Bisulfite Pre-Oxidation of Natural Organic Matter Enhances Nitrogenous Disinfection By-Products Formation during Subsequent Chlorination. Water 2022, 14, 507. https://doi.org/10.3390/w14030507
He S, Ren N. Permanganate/Bisulfite Pre-Oxidation of Natural Organic Matter Enhances Nitrogenous Disinfection By-Products Formation during Subsequent Chlorination. Water. 2022; 14(3):507. https://doi.org/10.3390/w14030507
Chicago/Turabian StyleHe, Shu, and Nanqi Ren. 2022. "Permanganate/Bisulfite Pre-Oxidation of Natural Organic Matter Enhances Nitrogenous Disinfection By-Products Formation during Subsequent Chlorination" Water 14, no. 3: 507. https://doi.org/10.3390/w14030507
APA StyleHe, S., & Ren, N. (2022). Permanganate/Bisulfite Pre-Oxidation of Natural Organic Matter Enhances Nitrogenous Disinfection By-Products Formation during Subsequent Chlorination. Water, 14(3), 507. https://doi.org/10.3390/w14030507