Article

Insights into Shallow Freshwater Lakes Hydrology in the Yangtze Floodplain from Stable Water Isotope Tracers

1
Geographic Information and Tourism College, Chuzhou University, Chuzhou 239000, China
2
Information Center (Hydrology and Water Resources Monitoring and Forecasting Center), The Ministry of Water Resources of the People’s Republic of China, Beijing 100053, China
3
Jiangxi Earthquake Agency, Nanchang 330026, China
4
Key Laboratory of Watershed Geographic Sciences, Nanjing Institute of Geography and Limnology, Chinese Academy of Sciences, Nanjing 210008, China
*
Authors to whom correspondence should be addressed.
Water 2022, 14(3), 506; https://doi.org/10.3390/w14030506
Submission received: 30 December 2021 / Revised: 24 January 2022 / Accepted: 27 January 2022 / Published: 8 February 2022
(This article belongs to the Special Issue Isotope Tracers in Watershed Hydrology)

Abstract

:
Stable isotopes of lake waters are widely used to identify the relative importance of hydrological processes on the lake water balance across the ungauged landscape via the coupled-isotope tracer model. The isotopic compositions of twenty shallow freshwater lakes across the mid-lower reaches of Yangtze floodplain (MLY) were investigated in January and May of 2018. The lake-specific input water (δI) and evaporation-to-inflow (E/I) ratios were estimated to explore the specific lake hydrology across the MLY. Results showed that distinct isotopic enrichment trends in May compared with those in January, which was indicative of stronger evaporation in May. The δ18OI values of specific lakes exhibited large variability across the MLY, which may be related to the watershed properties, such as watershed area and elevation, and rainfall. The estimated E/I ratios of lakes across the MLY were below 1, which suggested that these lakes (code 1–15) are flood-dominated in the middle reaches of Yangtze River where lakes are susceptible to Three Gorges Dams regulations. By contrast, the relatively lower variability of lake E/I ratios were observed from the Yangtze River Delta (code 17–20) because these lakes with developed river network systems are highly exchanged by artificial regulation. Our investigation of lake types and corresponding isotopic evolution patterns are likely typical of other floodplain landscapes and their identification could be used to better predict hydrological responses to ongoing climate change and artificial regulations by dams.

1. Introduction

Floodplains receiving nutrients and sediments from both the river channel and terrestrial sources are among the Earth’s most distinctive and productive landscapes [1,2]. In recent years, however, floodplains around the world are suffering from rapid changes due to the pervasive impacts from human activities and climatic changes such as the water conservancy project, agricultural irrigation, and artificial water diversion [3,4]. These changes largely influence the freshwater resources of shallow lakes within floodplains and thus result in environmental deteriorations of these lakes. Eutrophication is one of the prevalent existence and severe problems of freshwater ecosystems [5] and is considered to reflect the transitions of ecosystem states between the macrophyte-dominated clear water state and algae-dominated turbid state in floodplain shallow lakes [6,7]. Identification of causes and consequences of the alterations of lakes is the prerequisite of their environmental protection and restoration, which is one of the most significant challenges in present researches.
In a river–floodplain system, the shallow lakes serve as sinks for river and its lateral floodplain of water, sediment, and nutrients [4]. Natural hydrological regimes of river affect the lateral interaction and nutrient cycling between the shallow lakes and floodplains which determine the limnological and ecological conditions [8,9]. For example, river water that carries higher levels of sediments and nutrients mixes with flood-connected lake water that generally processes high concentrations of organic detritus and algal biomass during the inundation periods. After floodwaters recede and connection to the river channel is severed, floodplain shallow lakes display their local limnological characteristics [7,10]. However, despite these generalities, little is known about the specific conditions of floodplain shallow lakes under which evaporation or water influx may determine the variations of physical, chemical, and biological properties due to the insufficient hydrometric and climatic records. Therefore, it is an urgent need of understanding the shallow lakes hydrology to interpret the effects of future climate change on the evolution of environmental conditions in these lakes.
The middle and lower reaches of Yangtze floodplain (MLY), characterized by a complex river–lake–floodplain system, provides habitats and water resources for a quarter of the population of China [11,12,13]. The Yangtze floodplain is lake-rich, including more than 600 lakes with surface areas over 1 km2 [12]. In recent decades, the degree of natural hydraulic connection between the river and floodplain lakes suffered remarkable changes due to of land reclamation [14,15] and hydrological regulation by dams [16,17]. In the Yangtze watershed, more than 50,000 dams and levees have been built since the 1950s [16]. In particular, the Three Gorges Dam (TGD), the world’s largest hydropower project to date, has remarkably changed erosional and hydrological processes in the river–lake–floodplain systems since its operation in 2003 [16,18,19]. The TGD operation has reallocated the seasonal water flow and sediment deposition along the MLY, changed the hydrological connectivity between the river channel and connected lakes, and thus further affected the spatiotemporal distributions of organic matter and nutrient compositions of the connected lakes in the mid-lower reaches [20,21]. Although several studies focused on the influence of TGD on the hydrological processes of Yangtze mainstream by comparing the difference of water discharges before and after the TGD operation [22,23], they may not provide full recognition regarding the damming impacts on the mainstream and its connected shallow lakes. To narrow this gap, this study presents a new perspective on the hydrological processes of shallow lakes in the MLY evident by stable isotopes.
Stable isotope tracers have been effectively used as an alternative approach for assessing hydrological processes and water balance in lakes, especially those with limited gauge data [24,25,26,27]. The theory for calculating the ratio of evaporation-to-inflow (E/I) from stable isotopes has been well documented and widely applied to explore the water balance in thermokarst lakes in high-latitude regions [25,28] and floodplain shallow lakes in northern boreal region of Canada [10,29]. Using this method, Pham et al. (2009) [24] identified how nutrient compositions in lakes were associated with lake evaporation and land use activities in the northern Great Plains. Turner et al. (2014) [25] assessed the hydrological processes on lake water balance and classified lakes into various hydrological dominated types such as rainfall-, evaporation-, and drained lake types. However, to our knowledge, there is limited isotopic researches to explore the shallow lake hydrology in the MYL, but focus on the assessment of the altered river water cycles of Yangtze River influenced by the TGD operation [30,31,32]. Hence, it is an urgent need to study the shallow lakes hydrology responding to the seasonal variability of river flow discharge along the MLY.
In this study, stable water isotopes (δ18O and δ2H) of shallow lakes were investigated across the MLY. The aims of this study were to characterize hydrological regimes in January and May of 2018 using isotope tracers. The specific objectives of this study were to (1) present isotopic characteristics of different hydrological components in the shallow lakes; (2) assess the role of evaporation (E) and water inflow (I) as controls of shallow lakes hydrology. It is expected that the results of this study will be helpful for answering the questions regarding how shallow lakes respond to the influence of human activities (e.g., dams’ regulation) and future climate change in the Yangtze floodplain.

2. Geological Setting

The Yangtze River is the largest river in China and the third largest in the world, stemming from the Tibetan Plateau and flowing eastward to the East China Sea (Figure 1). Generally, the Yangtze River is classified into three sections: the upper (from Yibin to Yichang), middle (Yichang to Hukou), and lower (Hukou to river mouth) reaches. The world’s largest hydroelectric project of Three Gorges Dam (TGD) initialized water impoundment in 2003, which has remarkably altered the flow regime, decreased the sediment transport rate, and changed the inundation area of individual shallow lakes along the MLY [21]. The mid-lower reaches of Yangtze floodplain cover the provinces of Hubei, Hunan, Anhui, Jiangxi, Jiangsu, and Shanghai (Figure 1).
The mid-lower reaches of Yangtze floodplain are one of the most important ecoregions for population habitats and agricultural production in China (Figure 1), which are composed primarily of agricultural lowland, village-paddy field landscapes and expanding urban area. The Yangtze floodplain is characterized by numerous shallow freshwater lakes, which are hydrologically connected with Yangtze River or its major tributaries. The water depth of the lakes varies from 1.31 to 23.5 m and the lakes area ranges from 1 to 3842 km2. These lakes are primarily distributed in three geomorphological depressions such as the west of Jianghan watershed, the center of Huayang watershed, and the east of Taihu watershed on the Yangtze Delta plain [11,12]. Numerous lakes have undergone eutrophication due to the increasing intensification of agriculture and urban expansion over the last decades. Three largest shallow lakes in China including Lake Dongting, Poyang, and Taihu, are located in this region (Figure 1). The whole catchment of mid-lower reaches of Yangtze has a total drainage area of 8 × 10⁵ km2. It is dominated by a subtropical monsoonal climate zone with annual average precipitation of 1000–1600 mm/yr, of which more than 70% falls between April and October.

3. Materials and Methods

3.1. Sampling Collection and Analysis

Lake water samples for stable oxygen-18 and deuterium isotopes were collected from 20 lakes along the MLY (Figure 1). The detailed information of study lakes was listed in Table 1. Sampling period occurred in January and May, 2018. At least three samples from each study lake were collected from approximately 10 cm below the water surface at each study lake, and immediately sealed tightly in a 30-ml high density polyethylene bottle. The geographical information of each sampling site, including longitude, latitude, and elevation, was recorded in a portable GPS. All these samples were transported to the Nanjing Institute of Geographical and Limnology, Chinese Academy of Sciences for isotopic analysis. The isotopic compositions (δ2H and δ18O) of all lake water samples were measured using a Laser Absorption Water-Vapor Isotope Spectrometer (Los Gatos Research, Mountain View, CA, USA) at the State Key Laboratory of Lake Science and Environment, Chinese Academy of Sciences. All the isotopic data were expressed in per mil (‰) relative to the international Vienna Standard Mean Ocean Water (V-SMOW) standard. The analytical precision for δ2H and δ18O was 0.5‰ and 0.1‰, respectively.
Deuterium excess (d-excess = δ2H − 8 × δ18O) was calculated as an index of the extent of evaporation of lake water. The d-excess values reflected the influence of kinetic fractionation on water isotopic compositions. Generally, lake water with lower d-excess values indicated strong evaporation.

3.2. Stable Isotope Mass-Balance Modelling

Stable isotopes (δ2H and δ18O) were used to quantitatively assess the relative influence of evaporation and water inflows on water balance of specific lakes. The water mass balance and the isotopic mass balance of the study lakes at steady state is considered into the calculation of the evaporation-to-inflow (E/I) ratio [26,33]. The calculation was performed using the Hydrocalculator software [34]. The E/I ratio can be expressed as follows:
E I = 1 h h × δ L δ I δ * δ L
where h is the average relative humidity of specific lakes. δL and δI are the isotopic composition of lake water and total input water, respectively. δ* is the limiting isotope composition enrichment. The δI value for each lake water was determined as the intersection of a specific lake evaporation line (LEL) with LMWL of MYL [33]. Three parameters were used in the isotopic analysis: δp (the average amount-weighted isotopic composition of precipitation), δss (the isotopic composition of lake waters under isotopic steady state), and δ* (the theoretical maximum isotopic enrichment of water in a desiccating basin).
The historical monthly isotope compositions in precipitation from the MYL were used to determine the LMWL in the MYL, which were collected from the Global Network of Isotopes in Precipitation (GNIP) dataset system (http://www-naweb.iaea.org/, accessed on 1 May 2021) including sites of Wuhan (1986–1998), Changsha (1988–1992), and Nanjing (1987–1992). The δ18Op values of studied lakes were obtained from WaterIsotopes.org using the watershed centroid information and mean watershed elevation (Table 1). The detailed calculation on E/I ratio and the input variables were described in the Supplementary Material and Table 2.

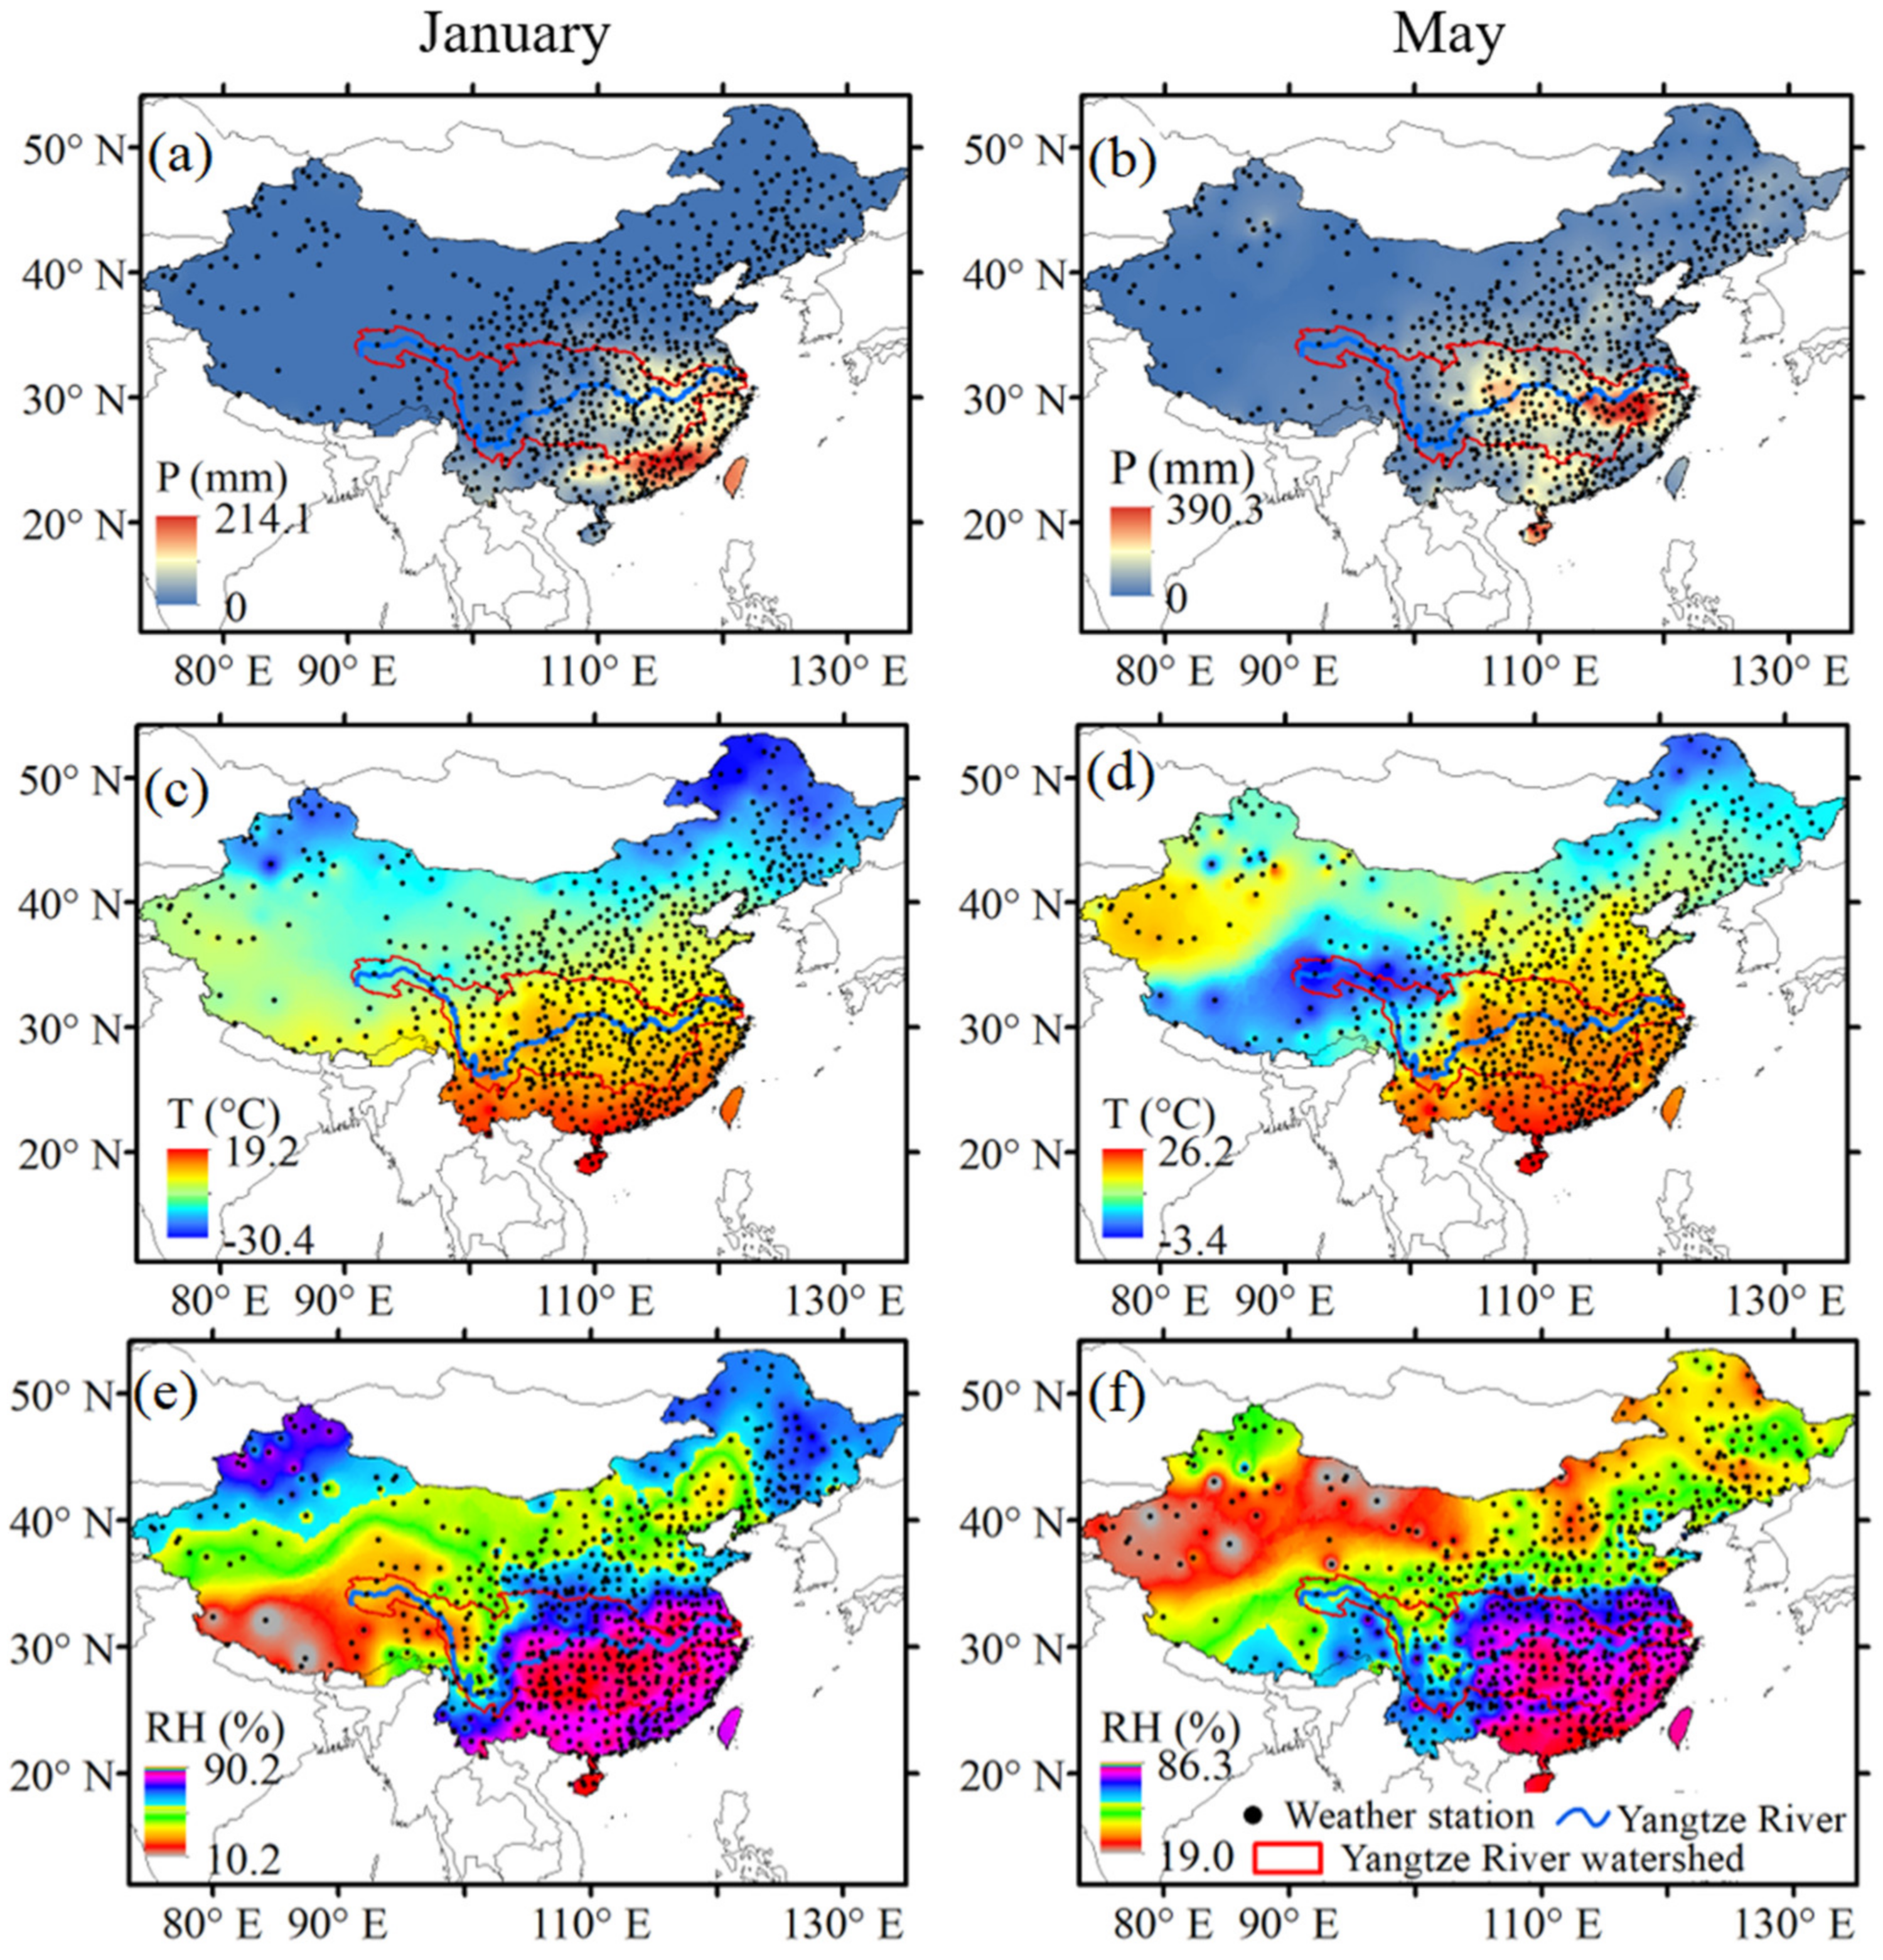
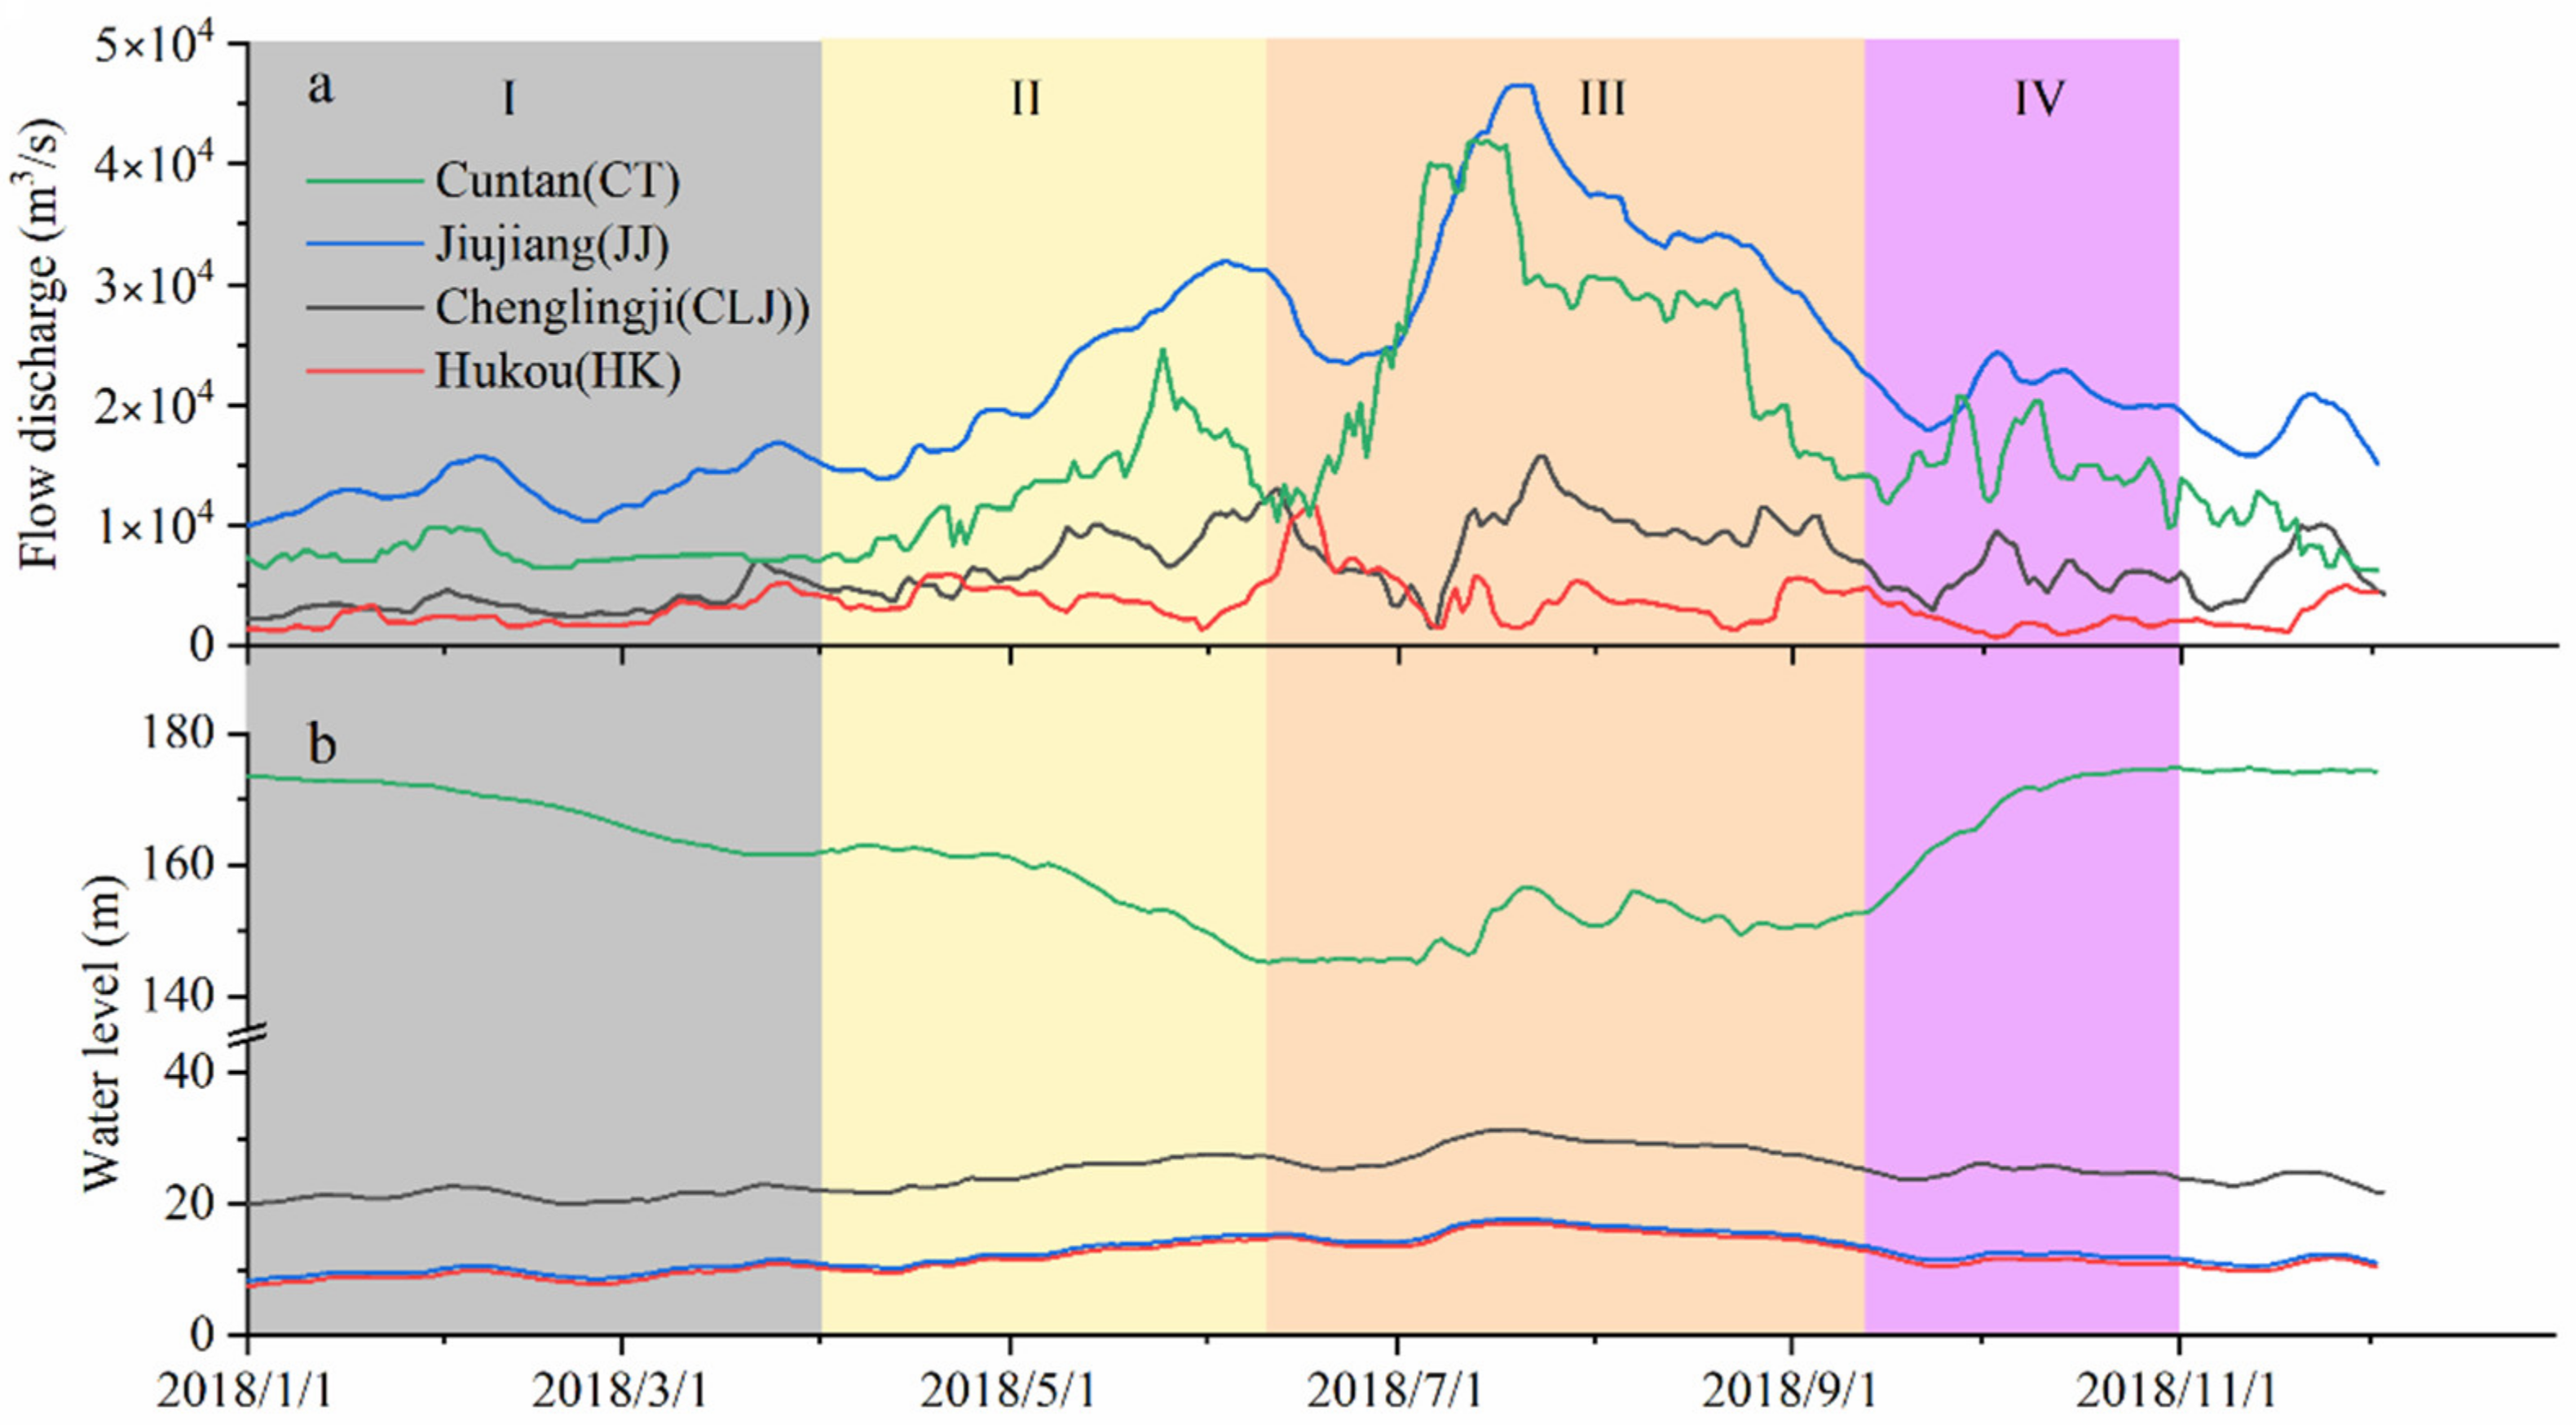
3.3. Meteorological and Hydrological Data

The monthly average precipitation amount, surface air temperature, and relative humidity during 1955–2018 at 699 meteorological stations were downloaded from the National Meteorological Information Center of China (http://data.cma.cn/, accessed on 1 October 2019). According to these data, grid-based data with a spatial resolution of 1 km were derived using the inverse distance-weighted interpolation method. Figure 2 shows the monthly average precipitation amount, surface air temperature, and relative humidity in January and May of 2018. The annual mean values from these grid-based data in specific lakes were extracted using the calculating E/I ratios of specific lakes.
The daily water discharge and level from the Cuntan (CT), Chenglingji (CLJ), Jiujiang (JJ), and Hukou (HK) in 2018 were obtained from the Changjiang Water Resources Commission (http://www.cjw.gov.cn/, accessed on 1 October 2018). The JJ, CLJ, and HK hydrometric stations are located the mainstream of Yangtze River, outlet of Dongting Lake and Poyang Lake, respectively (Figure 1). In addition, the lake evaporation rate (mm/d) of specific lakes was derived from https://data.tpdc.ac.cn/zh-hans/, accessed on 1 October 2019 [35].

3.4. Statistics Analysis

The data were submitted to descriptive, univariate, and multivariate statistical analysis [36]. To evaluate the statistical significance of the differences in lake water isotope values between January and May, a Mann–Whitney U Test was performed for stable isotopes (δ18O and δ2H, d-excess) of lake water of different months at the significance level of 0.05 [37]. The Mann–Whitney U test is defined as:
U = i = 1 n j = 1 m S X i , Y j
with
S X , Y = 1 ,   i f   X > Y 1 2 , i f   Y = X 0 ,   i f   X < Y  
where X and Y represent both samples independently of each other.

4. Results

4.1. Hydrological Characteristics

Daily variations of water level and flow discharge along the downstream of TGD are provided in Figure 3. The station discharges from mainstream Yangtze exhibit higher fluctuation than those from the tributary stations of the outlet of Dongting Lake (CLJ) and Poyang Lake (HK). The fluctuation of water level at the gauge Cuntan (CT) station indicated the impact of TGD on the downstream Yangtze by four regulation dispatch models. For example, (1) the TGR level was steadily lowered to 155 m under the first regulation model (I) of water-supplement dispatch from January to March. This regulation model corresponds to the increased outflow from the TGD; (2) The TGR level was further declined to the minimum level (145 m) under the pre-discharge regulation model from April to early June (II). This period aimed to store water volume for precautioning summer flood in the downstream Yangtze regions and thus alter the water discharge (Figure 3a); (3) The third model (III) of flood-control dispatch during July and August stabilized the Yangtze flow to alleviate flood pressure in the downstream Yangtze regions. The influence of TGD’s flow regulation decreased the natural variation of downstream gauge station level of JJ station; and (4) The water level of TGR elevated from approximately 145 m to the maximum of 175 m in the water-storage dispatch model (IV), preparing for electricity generation. The flow discharge of JJ station gradually decreased in this model.

4.2. Variations of Isotopic Compositions of Lake Water

The isotopic compositions (δ18O and δ2H) of lake water along the MLY showed distinct enrichment trends in May compared with those in January (Figure 4a,b) except for Dongting L., Wuchangdong L., and Yangcheng L. In January, lake water δ18O values ranged from −7.8‰ to −3.9‰ with an arithmetic mean of −5.4‰ while δ2H from −54.8‰ to −27.5‰ with an arithmetic mean of −38.7‰. By contrast, in May, lake water δ18O values varied from −6.8‰ to −1.7‰ with an arithmetic mean of −3.9‰ while δ2H from −43.4‰ to −13.4‰ with an arithmetic mean of −28.1‰. The relatively lower δ18O and δ2H values were found Chang L. and Dongting L., located close to the TGD. The mean d-excess values of lake waters exhibited lower than the global d-excess value of 10‰ except for the Dongting L. in May and Yangcheng L. in January (Figure 4c). Especially in May, some negative d-excess values were found in Junshan L. and Wuchangdong L., which may be indicative of greater evaporative enrichment or other enriched water source supplement into lakes.
The LMWL across the MLY was established as δ2H = 8.02 × δ18O + 11.3 (r = 0.98, Figure 5) according to the GNIP monthly dataset. The slope and intercept of LMWL were similar to the Global meteoric water line (GMWL: δ2H = 8 δ18O + 10 reported by Craig 1961). For lake water, the δ2H versus δ18O relationship was defined as the lake water evaporation line (LEL) δ2H = 6.26 × δ18O − 4.9 in January and δ2H = 6.37 × δ18O − 2.5 in May, respectively. Both slope and intercept of LEL were remarkably lower than those of LMWL, which might suggest lake water undergo secondary evaporative isotopic enrichment. The limiting steady-state isotope composition (δSS) and the theoretical limiting isotopic enrichment (δ*) were located along the LEL (Figure 5).

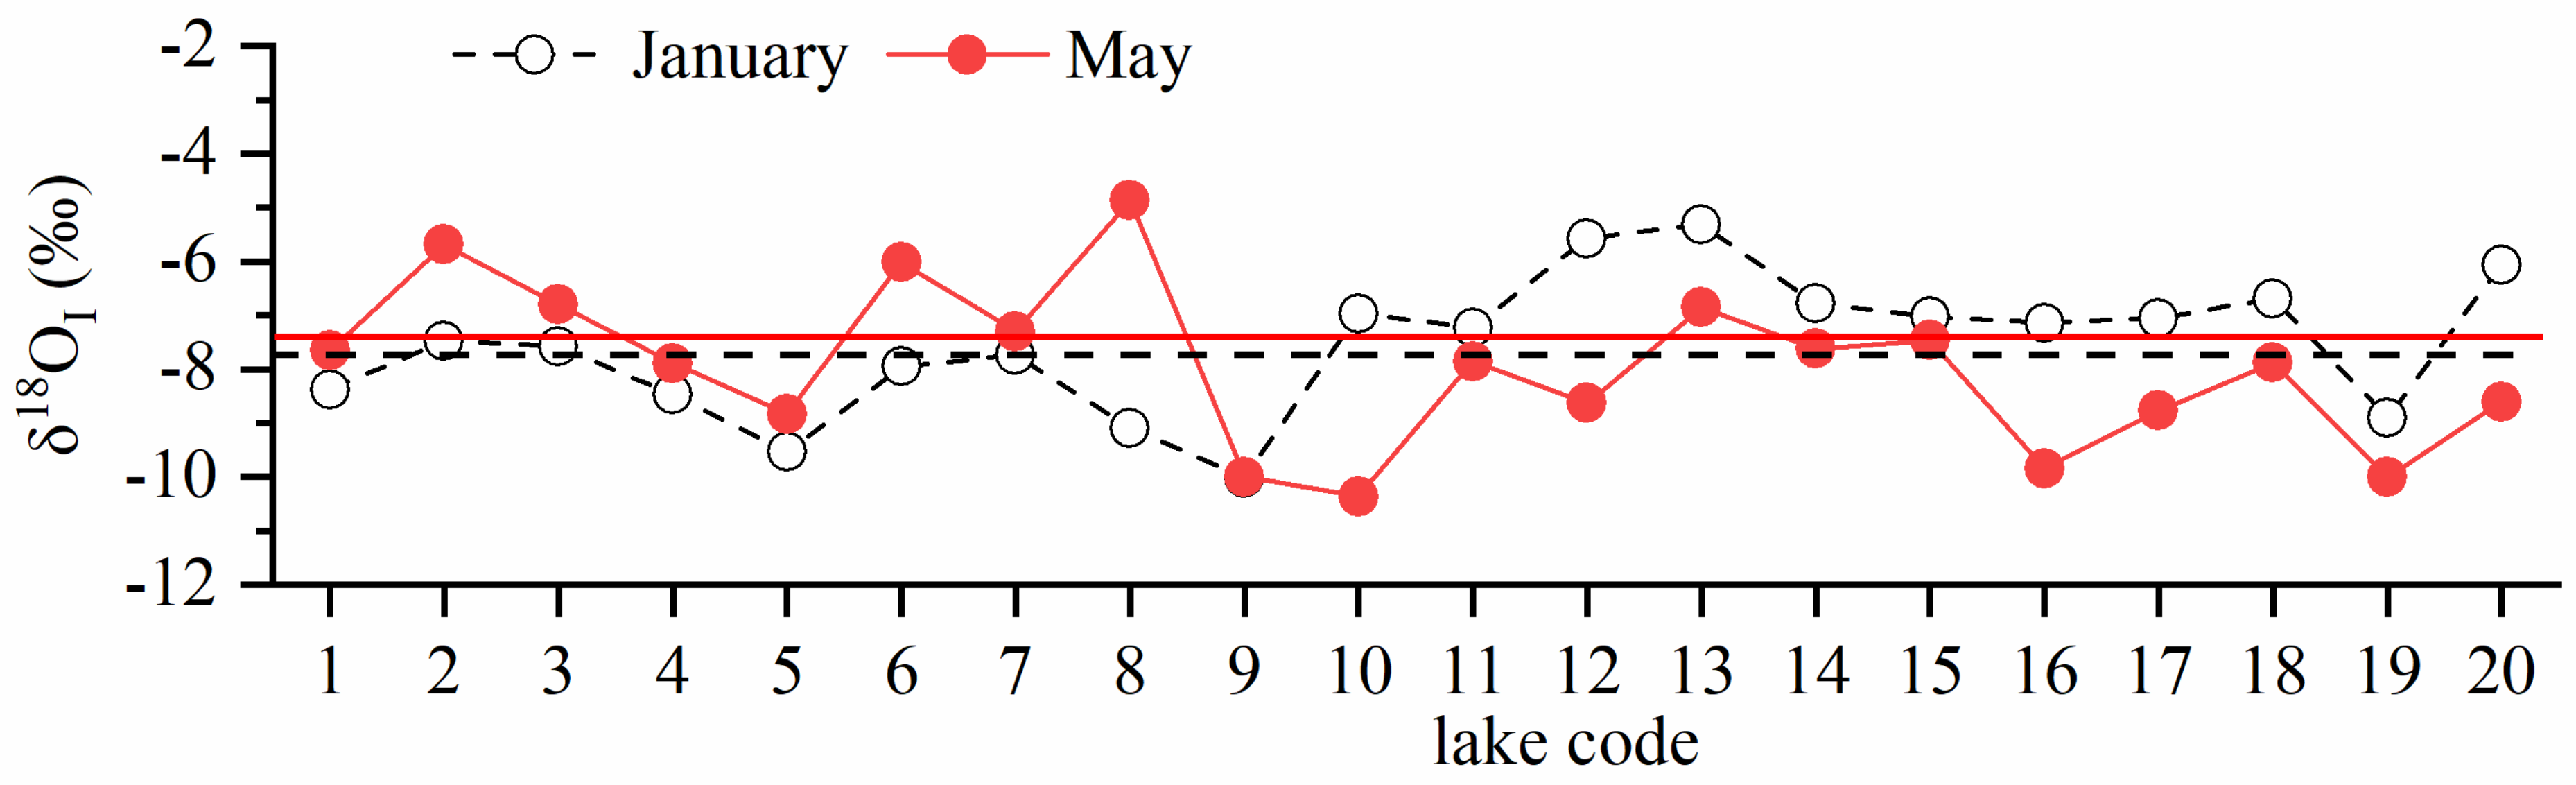
4.3. Sources of the Lake Water (δI) and Evaporation-to-Inflow Ratio (E/I)

The isotope composition of lake-specific input water (δ18OI) was estimated (Figure 6) to identify the hydrological conditions of specific shallow floodplain lakes. As shown in Figure 6, the δ18OI of specific lakes varied from −10‰ to −5.3‰ with an average of −7.7‰ in January whereas it ranged from −10.4‰ to −3.6‰ with an average of −7.4‰ in May. The δ18OI values of specific lakes exhibited large variability across the MLY, which may be related to the watershed properties, such as watershed area and elevation, and rainfall.
The E/I ratios for January and May were used to identify the importance of evaporative processes for specific lake water balances (Figure 7). Good agreement exists between δ18O- and δ2H-estimated E/I ratio. Lake E/I ratios ranged from 0.008 to 0.61 with an average of 0.16 in January whereas the E/I ratios varied from 0.002 to 0.29 with an average of 0.13 in May, which indicated strongly positive water balances for these lakes along the MLY. Some lakes had particularly high E/I ratios: Zhu L. (061 in January), Junshan L. (0.28 in May), and Wushan L. (0.29 in May), as shown in Figure 7. Based on the spatial patterns of E/I ratios, the majority of studied lakes showed rather low evaporative influence (E/I < 0.5), except for the Zhu L. in January.

5. Discussion

5.1. The Evaporation Effect on Lake Water

Due to the kinetic fraction fractionation processes, light isotopes (1H or 16O) are preferentially removed and thus the heavy isotopes (2H or 18O) are left in the residue liquid phase by evaporation, which result in the enrichment of heavy isotopes in the remaining waters [38,39]. Hence, lake water samples affected by evaporation are distributed along the lake water evaporation line (LEL), showing a lower and similar slope (<8) in January and May (Figure 5). The slope of LEL varying from 4 to 6 depends on the local climatic and environmental conditions such as relative humidity [34,40]. The similar and lower slopes of LEL are observed in January and May, which is associated with strong evaporation [41,42]. In addition, the d-excess of lake water exhibited lower values than the global average of 10‰ (Figure 4), which suggested lake water experienced evaporation in January and May along the mid-lower reaches of Yangtze River.
In total, lake water δ18O and δ2H values are higher in May than those in January along the mid-lower reaches of Yangtze River (Figure 4a,b), implying that lake water in May have been influenced by evaporation. This is evidenced by the higher monthly evaporation amount in May (E: 121.4 mm) compared with that in January (E: 37.4 mm) (Figure S1) and thus results in more enriched isotopic values of lake water in May. Most lakes exhibit significant difference of δ18O and δ2H values between January and May, except for Dongting L., Wuchangdong L., and Yangcheng L. with no significant difference observed, which is possibly associated with the lake mixing and watershed input water. In January, lakes experience a low water level with smaller watershed precipitation which reduces the hydrologic connectivity between lakes and Yangtze River [15,43]. For example, Dongting L. and Poyang L. show the lowest water level (Figure 3). Hence, lake water balance is largely determined by input water from groundwater and watershed precipitation in January. In May, however, Yangtze River water level (e.g., JJ station) gradually rise due to the discharge regulation by TGD (Figure 3), which could increase the connectivity between mainstream and lakes and thus result in the homogeneity of lake water isotopic compositions such as Dongting L. [44]. The hydrological behavior of Dongting lake is closely associated with TGD regulation due to its geographical property and [43,45,46].
Isotopic values plotting at the intersection of the LEL and LMWL represent the isotopic signals of all inflow into the lakes (e.g., surface water, groundwater, and direct precipitation) and assume that no evaporation occurred before the water entered the lake [27]. Although the similar mean δ18OI values are showed in January and May (Figure 6), the δ18OI values of lakes exhibited spatial heterogeneity along mid-lower reaches suggesting varying proportions of isotopic compositions of inflow water fed the lakes such as rainfall and shallow groundwater. Compared with those in January, the more depleted δ18OI values of lakes from low reaches of Yangtze River (code 10–20) also suggested that lake water may be influenced by the shallow groundwater and precipitation replenished these lakes in May [47] (Figure 6). Several studies reported that the watershed precipitation and shallow groundwater with lower isotopic values fed the lakes (e.g., Dongting L. and Poyang L.) in pre-flood period of May [30,37,48,49]. Zhan et al. (2015) demonstrated that the isotopic composition of the river water in April indicates that rivers are probably mainly recharged by base flow in the beginning of the rainy season and flow into the lakes.

5.2. Lake E/I Ratios and Shallow Lakes Hydrology

During the monitoring period, the estimated E/I ratios across the MLY are below 1, consistent with hydrological classification of these lakes as flood-dominated. There are spatial differences in water balance status in lakes across the MLY showing the higher mean E/I ratio value in January compared with in May (Figure 7). The E/I ratio of lakes became reduced in May, falling to values below 0.3. However, one lake (code 13) with high E/I ratio of 0.61 could be attributed to strong evaporation. Code 13 (Zhu L.) underwent rapid drainage due to floodplain lake fishing in January. A possible cause of seasonal variation in E/I ratios may be attributed to an increase in air temperature and precipitation amount in May [41]. A similar phenomenon was found by Cui et al. (2018) [48] showing that seasonal variations in E/I ratios of Cona lake were associated with interannual meteorological conditions. The authors also indicated that a lower E/I ratio in 2011 was caused by a larger monsoon precipitation amount and thus groundwater inflow than that was found in the years of higher E/I ratios [48]. Turner et al. (2015) reported that most rainfall- and snowmelt-dominated lakes presented a lower E/I ratio (<0.5) due to limited evaporative enrichment [25].
Lake E/I ratios from middle reach of Yangtze River was more spatially extensive than in the lower reach of Yangtze River indicating these lakes are susceptible to TGD regulation under different water regimes. By contrast, the relatively lower lake E/I ratios were observed in the Yangtze River Delta (code 17–20) because these lakes with developed river network systems are highly exchanged by artificial regulation. Xu et al. (2010) demonstrated that lake and river network systems in the Yangtze River Delta are highly connected under the influence of intensive urbanization. Some previous studies reported by Zhan et al. (2016) and Mao et al. (2021) demonstrated that rivers in the Poyang Lake Basin are primarily recharged by groundwater with different ratio between base flow and near-surface quick flow, rather than by surface runoff directly formed by concurrent rainfall across seasons [37,48].
Furthermore, most lakes across the MYL are flow-through lakes connecting with the main channel of Yangtze River through free connections (e.g., Dongting L., and Poyang L.) or artificial channel connections (e.g., Wuchangdong L., Longgan L., and Yangcheng L.) [46]. Hence, these specific lakes’ water balance is partly influenced by Yangtze River water level, which determines the outflow discharge of connected lakes, especially for Dongting L. and Poyang L. [23,31]. The relatively lower water level of Yangtze River may facilitate the outflow volume of connected lakes across the middle reach of Yangtze River in January (Figure 3), and thus result in the relatively higher fraction of water loss. Due to the effects of TGD regulation, the water level of Yangtze mainstream gradually rises (Figure 3) and is combined with the huge input of watershed precipitation [49], resulting in the reduction in water loss (E/I ratio).
Although we collected lakes’ water samples over part of a hydrological year, this study quantified the E/I ratio of the floodplain shallow lakes in January and May and helps identify the hydrological behavior of these lakes. In future work, we will continue to explore a long-term field sampling for lakes and groundwater across MYL, which will provide new insights on the systemic elevation of hydrological functions under the new hydrological regimes of TGD operation.

6. Conclusions

Stable water isotopes from twenty lakes across the MLY were investigated in January and May of 2018 to explore the hydrological processes that control the lake water balances both individually and at the landscape scale. An isotope mass balance model implemented in the Hydrocalculator program was employed. Results indicated that isotopic composition of shallow floodplain lakes exhibited both spatially and temporally, indicating various phases of dilution and enrichment attributable to hydrological inflows of shallow groundwater, rainfall, and evaporative loss across seasons. The more depleted δ18OI values of lakes from low reaches of Yangtze River (code 10–20) also suggested that lake water may be influenced by the shallow groundwater and precipitation with depleted isotopic signatures replenished these lakes in May. Moreover, the finding revealed that E/I ratios varied seasonally, which possibly resulted from the influences of meteorological conditions (e.g., evaporation and temperature). The drain-type lakes (code 13) in January displayed the highest E/I ratio in comparison with other lakes, suggesting the influence of strong evaporation. Lakes (code 1–15) with highly variable E/I ratios are found in the middle reach of Yangtze River because these lakes are susceptible to TGD regulation under different water regimes. By contrast, exchange-dominated lakes in the Yangtze River Delta (code 17–20) were characterized with the relatively lower variability of E/I ratios due to the developed river network systems here. These findings of diverse hydrological behaviors over the spatial scales may be useful for informing a vulnerability assessment of water resources and better predicting hydrological responses to ongoing climate change and artificial regulations by dams across the MYL.

Supplementary Materials

The following are available online at https://www.mdpi.com/article/10.3390/w14030506/s1. Supporting Information for calculation of E/I ratios. Figure S1: Temporal variation of evaporation amount at each specific lake.

Author Contributions

Methodology, J.L.; formal analysis, J.L.; writing—original draft, J.L.; data curation, H.F. and Z.B.; writing—review and editing, F.S. and H.W. All authors have read and agreed to the published version of the manuscript.

Funding

This study was supported by the Key project of Science and technology plan of Jiangsu Province (BE2019773), by the National Natural Science Foundation of China (No. 42071145 and 41861022), and the Pioneer Hundred Talent Program, Chinese Academy of Sciences (Y7BR021001).

Institutional Review Board Statement

Not applicable.

Informed Consent Statement

Not applicable.

Data Availability Statement

Monthly isotope compositions in precipitation of Wuhan (1986–1998), Changsha (1988–1992), and Nanjing (1987–1992) are obtained from http://www-naweb.iaea.org/ (accessed on 1 May 2021). The meteorological data of precipitation amount, surface air temperature, and relative humidity during 1955–2018 at 699 meteorological stations were downloaded from http://data.cma.cn/ (accessed on 1 October 2019). Daily water discharge and level of the Cuntan (CT), Chenglingji (CLJ), Jiujiang (JJ), and Hukou (HK) in 2018 were obtained http://www.cjw.gov.cn/ (accessed on 1 October 2018). Lake evaporation rate of specific lakes was derived from https://data.tpdc.ac.cn/zh-hans/ (accessed on 1 October 2019).

Acknowledgments

The authors appreciated the editor and anonymous reviewers for their constructive comments and suggestions on the revision of this paper.

Conflicts of Interest

The authors declare no conflict of interest.

References

  1. Tockner, K.; Stanford, J.A. Riverine flood plains: Present state and future trends. Environ. Conserv. 2002, 29, 308–330. [Google Scholar] [CrossRef] [Green Version]
  2. Zeng, L.; McGowan, S.; Cao, Y.; Chen, X. Effects of dam construction and increasing pollutants on the ecohydrological evolution of a shallow freshwater lake in the Yangtze floodplain. Sci. Total Environ. 2018, 621, 219–227. [Google Scholar] [CrossRef] [PubMed]
  3. Wolfe, B.B.; Hall, R.I.; Edwards, T.W.D.; Johnston, J.W. Developing temporal hydroecological perspectives to inform stewardship of a northern floodplain landscape subject to multiple stressors: Paleolimnological investigations of the Peace–Athabasca Delta. Environ. Rev. 2012, 20, 191–210. [Google Scholar] [CrossRef]
  4. Tockner, K.; Pusch, M.; Borchardt, D.; Lorang, M.S. Multiple stressors in coupled river-floodplain ecosystems. Freshw. Biol. 2010, 55, 135–151. [Google Scholar] [CrossRef]
  5. Williamson, C.E.; Saros, J.E.; Vincent, W.F.; Smol, J.P. Lakes and reservoirs as sentinels, integrators, and regulators of climate change. Limnol. Oceanogr. 2009, 54, 2273–2282. [Google Scholar] [CrossRef]
  6. Liu, D.; Duan, H.; Yu, S.; Shen, M.; Xue, K. Human-induced eutrophication dominates the bio-optical compositions of sus-pended particles in shallow lakes: Implications for remote sensing. Sci. Total Environ. 2019, 667, 112–123. [Google Scholar] [CrossRef] [PubMed]
  7. Wiklund, J.A.; Hall, R.I.; Wolfe, B.B. Timescales of hydrolimnological change in floodplain lakes of the Peace-Athabasca Delta, northern Alberta, Canada. Ecohydrology 2012, 5, 351–367. [Google Scholar] [CrossRef]
  8. Funk, A.; Martínez-López, J.; Borgwardt, F.; Trauner, D.; Bagstad, K.J.; Balbi, S.; Magrach, A.; Villa, F.; Hein, T. Identification of conservation and restoration priority areas in the Danube River based on the multi-functionality of river-floodplain systems. Sci. Total Environ. 2019, 654, 763–777. [Google Scholar] [CrossRef]
  9. Forsberg, B.R.; Devol, A.H.; Richey, J.E.; Martinelli, L.A.; dos Santos, H. Factors controlling nutrient concentrations in Amazon floodplain lakes. Limnol. Oceanogr. 1988, 33, 41–56. [Google Scholar] [CrossRef]
  10. Brock, B.E.; Wolfe, B.B.; Edwards, T.W.D. Characterizing the Hydrology of Shallow Floodplain Lakes in the Slave River Delta, NWT, Canada, Using Water Isotope Tracers. Arct. Antarct. Alp. Res. 2007, 39, 388–401. [Google Scholar] [CrossRef] [Green Version]
  11. Yang, X.; Anderson, N.J.; Dong, X.; Shen, J. Surface sediment diatom assemblages and epilimnetic total phosphorus in large, shallow lakes of the Yangtze floodplain: Their relationships and implications for assessing long-term eutrophication. Freshw. Biol. 2008, 53, 1273–1290. [Google Scholar] [CrossRef]
  12. Wang, S.-M.; Dou, H.-S. Lakes in China; Science Press: Beijing, China, 1998. [Google Scholar]
  13. Dong, X.; Anderson, N.J.; Yang, X.; Chen, X.; Shen, J. Carbon burial by shallow lakes on the Yangtze floodplain and its relevance to regional carbon sequestration. Glob. Chang. Biol. 2012, 18, 2205–2217. [Google Scholar] [CrossRef]
  14. Du, Y.; Xue, H.-P.; Wu, S.-J.; Ling, F.; Xiao, F.; Wei, X.-H. Lake area changes in the middle Yangtze region of China over the 20th century. J. Environ. Manag. 2011, 92, 1248–1255. [Google Scholar] [CrossRef]
  15. Cui, L.; Gao, C.; Zhao, X.; Ma, Q.; Zhang, M.; Li, W.; Song, H.; Wang, Y.; Li, S.; Zhang, Y. Dynamics of the lakes in the middle and lower reaches of the Yangtze River basin, China, since late nineteenth century. Environ. Monit. Assess. 2013, 185, 4005–4018. [Google Scholar] [CrossRef]
  16. Yang, S.L.; Milliman, J.D.; Li, P.; Xu, K. 50,000 dams later: Erosion of the Yangtze River and its delta. Glob. Planet. Chang. 2011, 75, 14–20. [Google Scholar] [CrossRef]
  17. Karim, F.; Dutta, D.; Marvanek, S.; Petheram, C.; Ticehurst, C.; Lerat, J.; Kim, S.; Yang, A. Assessing the impacts of climate change and dams on floodplain inundation and wetland connectivity in the wet–dry tropics of northern Australia. J. Hydrol. 2015, 522, 80–94. [Google Scholar] [CrossRef]
  18. Wu, H.; Huang, Q.; Fu, C.; Song, F.; Liu, J.; Li, J. Stable isotope signatures of river and lake water from Poyang Lake, China: Implications for river–lake interactions. J. Hydrol. 2021, 592, 125619. [Google Scholar] [CrossRef]
  19. Lai, X.; Liang, Q.; Jiang, J.; Huang, Q. Impoundment Effects of the Three-Gorges-Dam on Flow Regimes in Two China’s Largest Freshwater Lakes. Water Resour. Manag. 2014, 28, 5111–5124. [Google Scholar] [CrossRef]
  20. Gao, J.H.; Jia, J.; Kettner, A.J.; Xing, F.; Wang, Y.P.; Xu, X.N.; Yang, Y.; Zou, X.Q.; Gao, S.; Qi, S.; et al. Changes in water and sediment exchange between the Changjiang River and Poyang Lake under natural and anthropogenic conditions, China. Sci. Total Environ. 2014, 481, 542–553. [Google Scholar] [CrossRef]
  21. Wang, J.; Sheng, Y.; Gleason, C.J.; Wada, Y. Downstream Yangtze River levels impacted by Three Gorges Dam. Environ. Res. Lett. 2013, 8, 044012. [Google Scholar] [CrossRef]
  22. Chen, J.; Finlayson, B.L.; Wei, T.; Sun, Q.; Webber, M.; Li, M.; Chen, Z. Changes in monthly flows in the Yangtze River, China–With special reference to the Three Gorges Dam. J. Hydrol. 2016, 536, 293–301. [Google Scholar] [CrossRef]
  23. Hu, Q.; Feng, S.; Guo, H.; Chen, G.; Jiang, T. Interactions of the Yangtze river flow and hydrologic processes of the Poyang Lake, China. J. Hydrol. 2007, 347, 90–100. [Google Scholar] [CrossRef]
  24. Pham, S.V.; Leavitt, P.R.; McGowan, S.; Wissel, B.; Wassenaar, L. Spatial and temporal variability of prairie lake hydrology as revealed using stable isotopes of hydrogen and oxygen. Limnol. Oceanogr. 2009, 54, 101–118. [Google Scholar] [CrossRef]
  25. Turner, K.W.; Wolfe, B.B.; Edwards, T.W.D.; Lantz, T.C.; Hall, R.; Larocque, G. Controls on water balance of shallow thermokarst lakes and their relations with catchment characteristics: A multi-year, landscape-scale assessment based on water isotope tracers and remote sensing in Old Crow Flats, Yukon (Canada). Glob. Chang. Biol. 2014, 20, 1585–1603. [Google Scholar] [CrossRef]
  26. Gibson, J.J.; Birks, S.J.; Yi, Y. Stable isotope mass balance of lakes: A contemporary perspective. Quat. Sci. Rev. 2016, 131, 316–328. [Google Scholar] [CrossRef]
  27. Brooks, J.R.; Gibson, J.J.; Birks, S.J.; Weber, M.H.; Rodecap, K.D.; Stoddard, J.L. Stable isotope estimates of evaporation: Inflow and water residence time for lakes across the United States as a tool for national lake water quality assessments. Limnol. Oceanogr. 2014, 59, 2150–2165. [Google Scholar] [CrossRef] [Green Version]
  28. Yang, Y.; Wu, Q.; Hou, Y.; Zhang, P.; Yun, H.; Jin, H.; Xu, X.; Jiang, G. Using stable isotopes to illuminate thermokarst lake hydrology in permafrost regions on the Qinghai-Tibet plateau, China. Permafr. Periglac. Process. 2019, 30, 58–71. [Google Scholar] [CrossRef]
  29. Yu, Z.; Ito, E.; Engstrom, D.R. Water isotopic and hydrochemical evolution of a lake chain in the northern Great Plains and its paleoclimatic implications. J. Paleolimnol. 2002, 28, 207–217. [Google Scholar] [CrossRef]
  30. Ding, T.; Gao, J.; Tian, S.; Shi, G.; Chen, F.; Wang, C.; Luo, X.; Han, D. Chemical and Isotopic Characteristics of the Water and Suspended Particulate Materials in the Yangtze River and Their Geological and Environmental Implications. Acta Geol. Sin. Engl. Ed. 2014, 88, 276–360. [Google Scholar] [CrossRef]
  31. Wu, H.; Li, J.; Song, F.; Zhang, Y.; Zhang, H.; Zhang, C.; He, B. Spatial and temporal patterns of stable water isotopes along the Yangtze River during two drought years. Hydrol. Process. 2018, 32, 4–16. [Google Scholar] [CrossRef]
  32. Deng, K.; Yang, S.; Lian, E.; Li, C.; Yang, C.; Wei, H. Three Gorges Dam alters the Changjiang (Yangtze) river water cycle in the dry seasons: Evidence from H-O isotopes. Sci. Total Environ. 2016, 562, 89–97. [Google Scholar] [CrossRef] [PubMed]
  33. Yi, Y.; Brock, B.E.; Falcone, M.D.; Wolfe, B.B.; Edwards, T.W.D. A coupled isotope tracer method to characterize input water to lakes. J. Hydrol. 2008, 350, 1–13. [Google Scholar] [CrossRef]
  34. Skrzypek, G.; Mydłowski, A.; Dogramaci, S.; Hedley, P.; Gibson, J.J.; Grierson, P. Estimation of evaporative loss based on the stable isotope composition of water using Hydrocalculator. J. Hydrol. 2015, 523, 781–789. [Google Scholar] [CrossRef] [Green Version]
  35. Zhang, Y.; Kong, D.; Gan, R.; Chiew, F.H.S.; McVicar, T.R.; Zhang, Q.; Yang, Y. Coupled estimation of 500 m and 8-day resolution global evapotranspiration and gross primary production in 2002–2017. Remote Sens. Environ. 2019, 222, 165–182. [Google Scholar] [CrossRef]
  36. IBM Corp. IBM SPSS Statistics for Windows, Version 22.0; IBM Corp: Armonk, NY, USA, 2013.
  37. Mao, H.; Wang, G.; Shi, Z.; Liao, F.; Xue, Y. Spatiotemporal Variation of Groundwater Recharge in the Lower Reaches of the Poyang Lake Basin, China: Insights from Stable Hydrogen and Oxygen Isotopes. J. Geophys. Res. Atmos. 2021, 126, e2020JD033760. [Google Scholar] [CrossRef]
  38. Horita, J.; Rozanski, K.; Cohen, S. Isotope effects in the evaporation of water: A status report of the Craig–Gordon model. Isot. Environ. Health Stud. 2008, 44, 23–49. [Google Scholar] [CrossRef]
  39. Dansgaard, W. Stable isotopes in precipitation. Tellus 1964, 16, 436–468. [Google Scholar] [CrossRef]
  40. Gibson, J.J.; Birks, S.J.; Edwards, T.W.D. Global prediction of δA and δ2H-δ18O evaporation slopes for lakes and soil water accounting for seasonality. Glob. Biogeochem. Cycles 2008, 22, GB2031. [Google Scholar] [CrossRef]
  41. Vyse, S.A.; Semiromi, M.T.; Lischeid, G.; Merz, C. Characterizing hydrological processes within kettle holes using stable water isotopes in the Uckermark of northern Brandenburg, Germany. Hydrol. Process. 2020, 34, 1868–1887. [Google Scholar] [CrossRef]
  42. Esquivel-Hernández, G.; Sánchez-Murillo, R.; Quesada-Román, A.; Mosquera, G.M.; Birkel, C.; Boll, J. Insight into the stable isotopic composition of glacial lakes in a tropical alpine ecosystem: Chirripó, Costa Rica. Hydrol. Process. 2018, 32, 3588–3603. [Google Scholar] [CrossRef]
  43. Yang, G.; Zhang, Q.; Wan, R.; Lai, X.; Jiang, X.; Li, L.; Dai, H.; Lei, G.; Chen, J.; Lu, Y. Lake hydrology, water quality and ecology impacts of altered river–lake interactions: Advances in research on the middle Yangtze river. Hydrol. Res. 2016, 47, 1–7. [Google Scholar] [CrossRef]
  44. Zhan, L.; Chen, J.; Zhang, S.; Huang, D.; Li, L. Relationship between Dongting Lake and surrounding rivers under the operation of the Three Gorges Reservoir, China. Isot. Environ. Health Stud. 2015, 51, 255–270. [Google Scholar] [CrossRef]
  45. Ou, C.; Li, J.; Zhang, Z.; Li, X.; Yu, G.; Liao, X. Effects of the dispatch modes of the Three Gorges Reservoir on the water regimes in the Dongting Lake area in typical years. J. Geogr. Sci. 2012, 22, 594–608. [Google Scholar] [CrossRef]
  46. Huang, J.; Xu, Q.; Xi, B.; Wang, X.; Jia, K.; Huo, S.; Su, J.; Zhang, T.; Li, C. Effects of lake-basin morphological and hydrological characteristics on the eutrophication of shallow lakes in eastern China. J. Great Lakes Res. 2014, 40, 666–674. [Google Scholar] [CrossRef]
  47. Wu, J.; Lin, L.; Zeng, H.; Zhang, E.; Yang, X. Characteristics of oxygen isotopic composition of the lakes along the mid-lower reaches of the Yangtze river. Mar. Geol. Quat. Geol. 2006, 26, 53–56. (In Chinese) [Google Scholar]
  48. Cui, J.; Tian, L.; Gibson, J.J. When to conduct an isotopic survey for lake water balance evaluation in highly seasonal climates. Hydrol. Process. 2018, 32, 379–387. [Google Scholar] [CrossRef]
  49. Zhang, Q.; Ye, X.-C.; Werner, A.D.; Li, Y.-L.; Yao, J.; Li, X.; Xu, C.-Y. An investigation of enhanced recessions in Poyang Lake: Comparison of Yangtze River and local catchment impacts. J. Hydrol. 2014, 517, 425–434. [Google Scholar] [CrossRef] [Green Version]
Figure 1. Distributions of lakes samplings in the mid-lower reaches of Yangtze floodplain region. Numbers represent the studied lakes.
Water 14 00506 g001
Figure 2. Monthly average precipitation amount, surface air temperature, and relative humidity in January (a,c,e) and May (b,d,f) of 2018.
Water 14 00506 g002
Figure 3. Daily variation of flow discharge (a) and water level (b) at the sites of Yangtze River (CT and JJ) and Lakes (CLJ of Dongting Lake and HK of Poyang Lake) in the Yangtze River watershed.
Water 14 00506 g003
Figure 4. Variations of lake water isotopic compositions (a) δ18O, (b) δ2H and (c) d-excess across the MYL. The symbols of *, **, and ns represent the significance level of 0.05, 0.01, and no significance level, respectively. The gray dashed line represents the average value of d-excess in lake water. The blue insets are the outline of specific lakes across the MYL.
Water 14 00506 g004
Figure 5. Plots of δ18O and δ2H in lake water during January (red solid circles) and May (open circles) across the MLY.
Water 14 00506 g005
Figure 6. Spatiotemporal variations of isotopic compositions (δ18OI) of input water into specific lakes across the MLY.
Water 14 00506 g006
Figure 7. Spatial patterns of evaporation-to-inflow (E/I) ratios of specific lakes estimated by lake water δ18O during (a) January and (b) May across the MLY.
Water 14 00506 g007
Table 1. Lakes information across the MLY.
Lake CodesLake NamesLake Area
(km2)
Lon.
(Centroid)
Lat.
(Centroid)
Alt.
(Centroid)
1Chang L.129.1112.3430.5554.5
2Dongting L.2432.5111.5427.74371.3
3Datong L.114.2112.4829.2530.1
4Yueyangnan L.12113.1229.3337.0
5Hong L.344.4113.3729.8722.7
6Huanggai L.86113.6029.6088.9
7Wuchangdong L.34114.2130.4427.9
8Liangzi L.304.3114.4830.2427.8
9Ci L.10115.1730.2453.8
10Wushan L.16115.6129.8962.9
11Poyang L.2933115.7527.64241.1
12Junshan L.192.5116.3628.6424.4
13Zhu L.80.8116.8729.3976.1
14Longgan L.316.2116.0430.0989.8
15Huang L.299.2116.3530.1937.5
16Chao L.769.6117.4531.5731.6
17Ge L.146.5119.8631.616.8
18Tai L.2425120.1231.0456.6
19Yangcheng L.119120.6731.599.8
20Dianshan L.63.7121.0331.107.4
Table 2. Variables used in the calculation of E/I ratio.
VariablesDescriptionRemarks
TTemperature [°C]Measured or assumed
hRelative humidity [%]
δPRainfall [‰], calculated from WaterIsotopes.org
δIInput water value [‰], calculated from the intersection of a specific LEL with LMWL
δLLake water final value [‰]
LELSlope of Local Evaporation Line
δAAir ambient moisture [‰]
ekKinetic isotope fractionation factor [‰] (h dependent)Calculated from the model
e* Equilibrium isotope fractionation factor [‰] (T dependent)
eTotal isotope fractionation [‰]
CkThe kinetic fractionation constant [‰]
a* Equilibrium isotope fractionation factor [‰] (T dependent)
δ*Limiting isotopic composition [‰]
mCalculation factor (he/1000)/(1 − h + ek/1000)
δE((δLe*)/a+Aek)/(1 − hek) from Yi et al., 2008 [33]
E/IResult for steady-state model: Evaporation over Inflow ratioResults
Publisher’s Note: MDPI stays neutral with regard to jurisdictional claims in published maps and institutional affiliations.

