Article

Spatiotemporal Analysis of Drought and Agriculture Standardized Residual Yield Series Nexuses across Punjab, Pakistan

1
Centre of Excellence in Water Resources Engineering, University of Engineering & Technology, Lahore 54890, Pakistan
2
Faculty of Agricultural Engineering and Technology, PMAS Arid Agriculture University, Rawalpindi 46000, Pakistan
3
Chengyi Zhao Land Science Research Center, Nanjing University of Information Science & Technology, Nanjing 210044, China
4
National Crisisonomy Institute, Chungbuk National University, Cheongju 28644, Korea
*
Authors to whom correspondence should be addressed.
Water 2022, 14(3), 496; https://doi.org/10.3390/w14030496
Submission received: 5 January 2022 / Revised: 3 February 2022 / Accepted: 4 February 2022 / Published: 7 February 2022
(This article belongs to the Special Issue The Impacts of Climate Change on Hydrologic Extremes)

Abstract

:
Food security for the growing global population is closely associated with the variations in agricultural yield at the regional scale. Based on this perspective, the current study was designed to determine the impacts of drought on wheat production in the Punjab province, which is the agricultural hub of Pakistan. Wheat is a staple food in Pakistan, and Punjab provides a major contribution to the total wheat production of the country. Therefore, Punjab is vital to scientific concerns regarding the evaluation of climatic impacts on the annual wheat yield. The current study offers a better understanding of the drought impacts on wheat in Punjab during 2001–2019. The Standardized Precipitation Index was used to assess the impact of drought stress on the wheat yield. Its temporal evolution indicates the recurrent appearance of drought episodes during the wheat cropping season. Furthermore, meteorological drought was noticed in all study years except for 2019. The results reveal that 2002 experienced severe drought conditions. The frequency of drought was calculated as 29% for SPI-12. The relationships between soil moisture, the Standardized Yield Residual Series (SYRS), and the detrended SPI at lags of 1–12 months indicate that zones 1 and 2 are more sensitive to dry conditions. The results presented in this study provide evidence to authorities responsible for developing policies in the context of natural hazards, particularly droughts, and for preparing drought mitigation plans and implementing the adaptation strategies to minimize the effects of drought on wheat yields.
Keywords:
SPI-1; drought; SPI-12

1. Introduction

Drought has far-reaching effects on the environment and many aspects of society around the world [1]. The erratic phenomenon of drought is caused by two forcing functions, namely, climate change and anthropogenic activities [2]. Current climate changes have induced and accelerated hydrological extremes, including floods and droughts [3]. This has induced significant variations at the regional scale. The climate of Pakistan is more vulnerable to warmer conditions because of its geographical location, where the rise in average temperature is higher compared to that in the global temperature. Furthermore, the annual average drought rate is 40%, which increases to 60% in some parts of the country. The associated problems are more complicated when droughts have adverse effects on agricultural land, leading to massive losses in annual agricultural productivity [4]. About 60% of Pakistan receives annual rainfall of 250 mm, and 24% of the country receives 250 to 500 mm, meaning this land is mostly arid and semi-arid [5].
The economy of Pakistan depends on the agricultural industry, which is highly sensitive and responsive to climate-induced changes. Agricultural yield varies with respect to the variations in precipitation, temperature, and solar radiation, and therefore, has a significant influence on the socio-economic stability of the country. The changing rainfall pattern has caused frequent droughts and floods in this region. Drought and water stress conditions prevailed in Pakistan in recent years (excluding 2004–2005, which corresponded to a wet year), affecting the wheat yield in both rain-fed and irrigated areas. Wheat is not only the main food of Pakistan; it is also a highly cultivated food crop around the world, due to its highly nutritious properties, and constitutes about 72 percent of the average diet [6]. Studies have revealed that the current climatic conditions have resulted in negative impacts on the global wheat yield, which are becoming a challenge to fulfilling the rising demands of the growing population [7,8].
Various studies have been conducted, both at the regional and global scales, to assess the climate change impacts (particularly droughts) on the wheat yield. For example, Ahmed et al. [9] found that water-deficit conditions significantly lowered the wheat yield. Gul et al. [10] found that, since 1930, the potential wheat production has decreased at an increasing rate, due to the rise in the minimum temperature, and the wheat yield may drop by 7.5 percent for every 1 °C increase in the temperature. Corassa et al. [11] found that higher temperatures lowered the yield by accelerating the plant’s development, causing the premature maturation of plants, and consequently decreasing the time required to produce yields. Ashfaq et al. [12] studied the impacts of the increase in temperature at each stage of wheat growth. He found that wheat productivity increases by 146.57 kg ha−1 if the mean minimum temperature rises by 1 °C at the sowing stage; similarly, a rise in mean maximum temperature at the growing stage hampers the crop yield, whereas a rise in temperature at the maturity stage increases the yield by 136.63 kg ha−1.
Compared to other categories of drought, agricultural droughts are a complex and poorly understood hazard [2]. An agricultural drought produces a harsh environment, causing soil moisture to be inadequate for healthy plant growth, and resulting in yield loss and food insecurity [13,14]. Agricultural droughts have far greater impacts on rain-fed agricultural regions [15,16,17]. These facts highlight the need to investigate the agricultural drought, particularly at the regional scale, for planning effective adaptation strategies and improving drought monitoring systems. Various drought indexes have been established for the assessment and quantification of drought, using different climatic variables (i.e., temperature, precipitation, and soil moisture) [2,18,19]. Among these, the Standardized Precipitation Index (SPI) [20], the Palmer Drought Severity Index (PDSI) [21], and the Standardized Precipitation Evapotranspiration Index (SPEI) [22] are the most commonly used drought indexes for assessing drought conditions. To calculate droughts for hydrological and agricultural applications at various timescales, only precipitation variables are used in the SPI for a particular timescale [2]. The current study employed the SPI for quantification of drought conditions at a lag of 1–12 months, aiming to assess the impacts of drought on wheat production in different zones of Punjab during 2001–2019.
The present study was conducted in the Punjab province, which is the second-largest and most populous province of Pakistan. Punjab provides the largest share of national agricultural production; therefore, it has a significant role in the sustainable growth of the national economy. The landscape of Punjab is dominated by the agricultural industry, both in terms of the total agricultural land (16.68 million hectors) and the percentage share (60 percent) of the total agricultural gross domestic product (GDP) of the country. (http://www.agripunjab.gov.pk/overview, assessed on 2 December 2021). Wheat is ranked first among the staple foods of Pakistan, and the highest wheat production is registered in Punjab, which fulfills more than 70 percent of the national wheat demand. The main objectives of this work were to: (a) evaluate the spatiotemporal evolution and frequency of drought at different timescales; (b) assess the impacts of drought on the wheat yield; and (c) investigate the variations in the relationship between drought and wheat yield for the study period (2001–2019). This work was conducted in response to the need for careful analysis of agricultural drought and its possible effects on wheat production in Punjab, Pakistan.

2. Materials and Methods

2.1. Study Area

This study was carried out in Punjab province, which is the second-largest province of Pakistan, having a total area of 205,344 square kilometers, and a location of 31.17° N 72.70° E (Figure 1). It is characterized by a diverse landscape, including flat land, mountainous ranges (Suleiman range in the southwest, Margalla hills, Salt range, and Potohar plateau), and sparse deserts (Cholistan and Thal in the south and southeast region). This province encompasses the fertile alluvial plains of the Indus River and its major tributaries, namely, Jhelum, Chenab, Ravi, and Sutlej. Due to the combination of these features and a widespread irrigation network, this province is sufficiently fertile to enable extensive agricultural activities. For this reason, it is known as the agricultural hub of Pakistan, and contributes more than 50% of the country’s total annual agricultural production [23]. Agriculture is a major source of livelihood for Punjab’s rural population, and therefore variations in agricultural productivity due to climate change have significant impacts on the socio-economic status of this province. The monsoon season in Punjab begins in June and ends in September, with the rainfall alternating between 300 and 1000 mm, and the climate is usually damp and arid. In the present study, Punjab was divided into 5 zones according to the amount of rainfall each zone received. This approach helps in the identification of drought-prone regions of Punjab based on the particular meteorological boundary conditions. Zone 1 refers to the districts in the south and southeastern regions of Punjab (e.g., Multan, Rahim Yar Khan, Bahawalnagar, and Bahawalpur). It is characterized by sparse deserts, such as Cholistan and Thal, which cover the south and southeastern regions. According to the meteorological conditions, Zone 2 includes the districts of the southwestern (Dera Ghazi Khan), central (Jhang and Toba Tak Singh), and eastern (Sahiwal and Okara) regions of Punjab. This zone has a diverse landscape, including the flat plane of the eastern and central regions, and the Suleiman range of the southwestern region. Zone 3 encompasses central and western Punjab, including the districts Faisalabad, Bakhar, and Khushab. Faisalabad and Bakhar have relatively flat landscapes suitable for agricultural activities, whereas Khushab belongs to the Pothohar region. Zone 4 covers eastern to western Punjab, including the Pothohar region, and the districts of Lahore, Gujranwala, Sargodha, Mandi Bahauddin, and Chakwal. Zone 5 lies in the north region of Punjab and includes the districts of Rawalpindi, Jhelum, Gujrat, and Sialkot.

2.2. Data

A total of 28 meteorological stations (established by the Pakistan Meteorological Department (PMD)) were selected over the study domain for the collection of climatic variables. For these stations, precipitation data were collected for the study period (2001–2019). The quality control test was performed to screen stations with more than 5% missing data. In addition, homogeneity tests, such as SNHT and Pettit tests, were performed to identify the variations in crop data series. This quality control testing helped in the selection of those stations which have continuous rainfall data, and 21 stations were found to be fit for this study. Wheat yield data were collected only for those stations for which continuous precipitation data was available. The data were taken from Crop the Reporting Service, Punjab, for the 21 districts of the study area for the study period (2001–2019). The soil moisture was considered to be an important parameter for the quantification and calculation of the possible impacts of droughts on crop yield. The soil moisture data used in this study have a spatial resolution of 0.25° × 0.25°. This dataset is produced on behalf of the Copernicus Climate Change Service (C3S). It is based on the ESA Climate Change Initiative soil moisture version 03.3 and represents the current state-of-the-art approach for the production of satellite-based soil moisture climate data (https://cds.climate.copernicus.eu/cdsapp#!/home), accessed on 2 December 2021.

2.3. Drought Quantification

The present study employed the SPI to determine the drought conditions in different zones of Punjab for the time period of 2001–2019. The SPI uses precipitation as the input data in its drought calculation. The DRINC software was used to calculate the drought at different timescales. The multiple time series of SPIs (SPI-1, SPI-3, SPI-6, and SPI-12) were generated. The negative and positive values of the SPI time series demonstrate the dry and wet conditions, respectively. Table 1 describes the different categories of drought.
The SPI value for each zone was obtained by taking the average of SPI values at each station of a zone, because the stations located in a zone demonstrate the homogenous seasonal climatic characteristics with maximum possible precipitation during the monsoon period (i.e., June–September) [24]. A similar method was employed by [16] for all the stations in a study domain that represent a similar climatology. The SPI computed for various lags has the memory of moisture conditions for the preceding and present months [25]. In general, SPI3 reflects the moisture condition of the present month and the previous two months (e.g., SPI3 (April) represents the moisture condition memory of February, March, and April), whereas SPI12 indicates the retention of the water condition from the previous 11 months until the present month [26].
The response of the crop to drought conditions varies according to the crop’s stages. Drought effects can be observed in the rate of germination and emergence; development of root, leaf, and stem; flowering; pollination; grain-filling; and the quality of the grains [16,27]. The complete phrenological period was separated into three sub-periods, i.e., sowing, growing, and harvesting (Figure 2). The cropping calendar of the wheat crop was taken from the FAO website (http://www.fao.org/giews/countrybrief/country.jsp?code=NPL, accessed in 2 December 2019).

2.4. Drought Frequency

Drought frequency was calculated to determine the number of droughts that occurred between 2001 and 2019. The drought frequency was computed as a fractional frequency, which yields the likelihood of a month having an SPI value less than or equal to the drought threshold value (SPI ≤ −0.5). It can be calculated using the following equation:
frequency = n N
where n is the number of drought months and N is the total number of months for the particular time period.

2.5. Calculation of Standardized Residual Yield Series (SYRS)

The agriculture data comprise two types of information in terms of area and production (tons) for the study period 2001–2019 for each district of Punjab. It can be observed that technical advancements and certain adaptation practices in the agriculture sector have caused an increasing trend in crop production. Before the drought analysis, yield data were detrended using the linear regression method to eliminate the linear/technological trend. The residuals of yields resulting from detrending signify the climatic effects on the crop yield [16,17]. The following formula was used to calculate the SYRS:
S Y R S = y i μ σ
where yi is the residual of the detrended crop yield, μ indicates the mean of residuals of the detrended yield, and σ corresponds to the standard deviation. The categories for yield loss based on the SYRS values is given in Table 2.

2.6. Mann-Kendall Trend Analysis

This study employed the Mann–Kendall trend test to investigate whether a significance level and trend exist in the wheat yield data. This analysis was performed in XLSTAT Software at the significance level of 95% (p < 0.05). The magnitude of the slope helped to assess the temporal changes in the wheat yield data of Punjab.

2.7. Correlation Analysis

Correlation analyses were performed to analyze the possible effects of drought and soil moisture on wheat productivity. For this purpose, the non-parametric Spearman’s rho correlation coefficient having a significance level of p < 0.05 (95%) was used. The SPI at different timescales was detrended prior to deriving the correlation with the SYRS in different zones of Punjab. The correlation between SPI, SYRS, and soil moisture was analyzed for the complete study duration (2001–2019) for all five zones of Punjab.

3. Results

3.1. Temporal Evaluation of Meteorological Drought

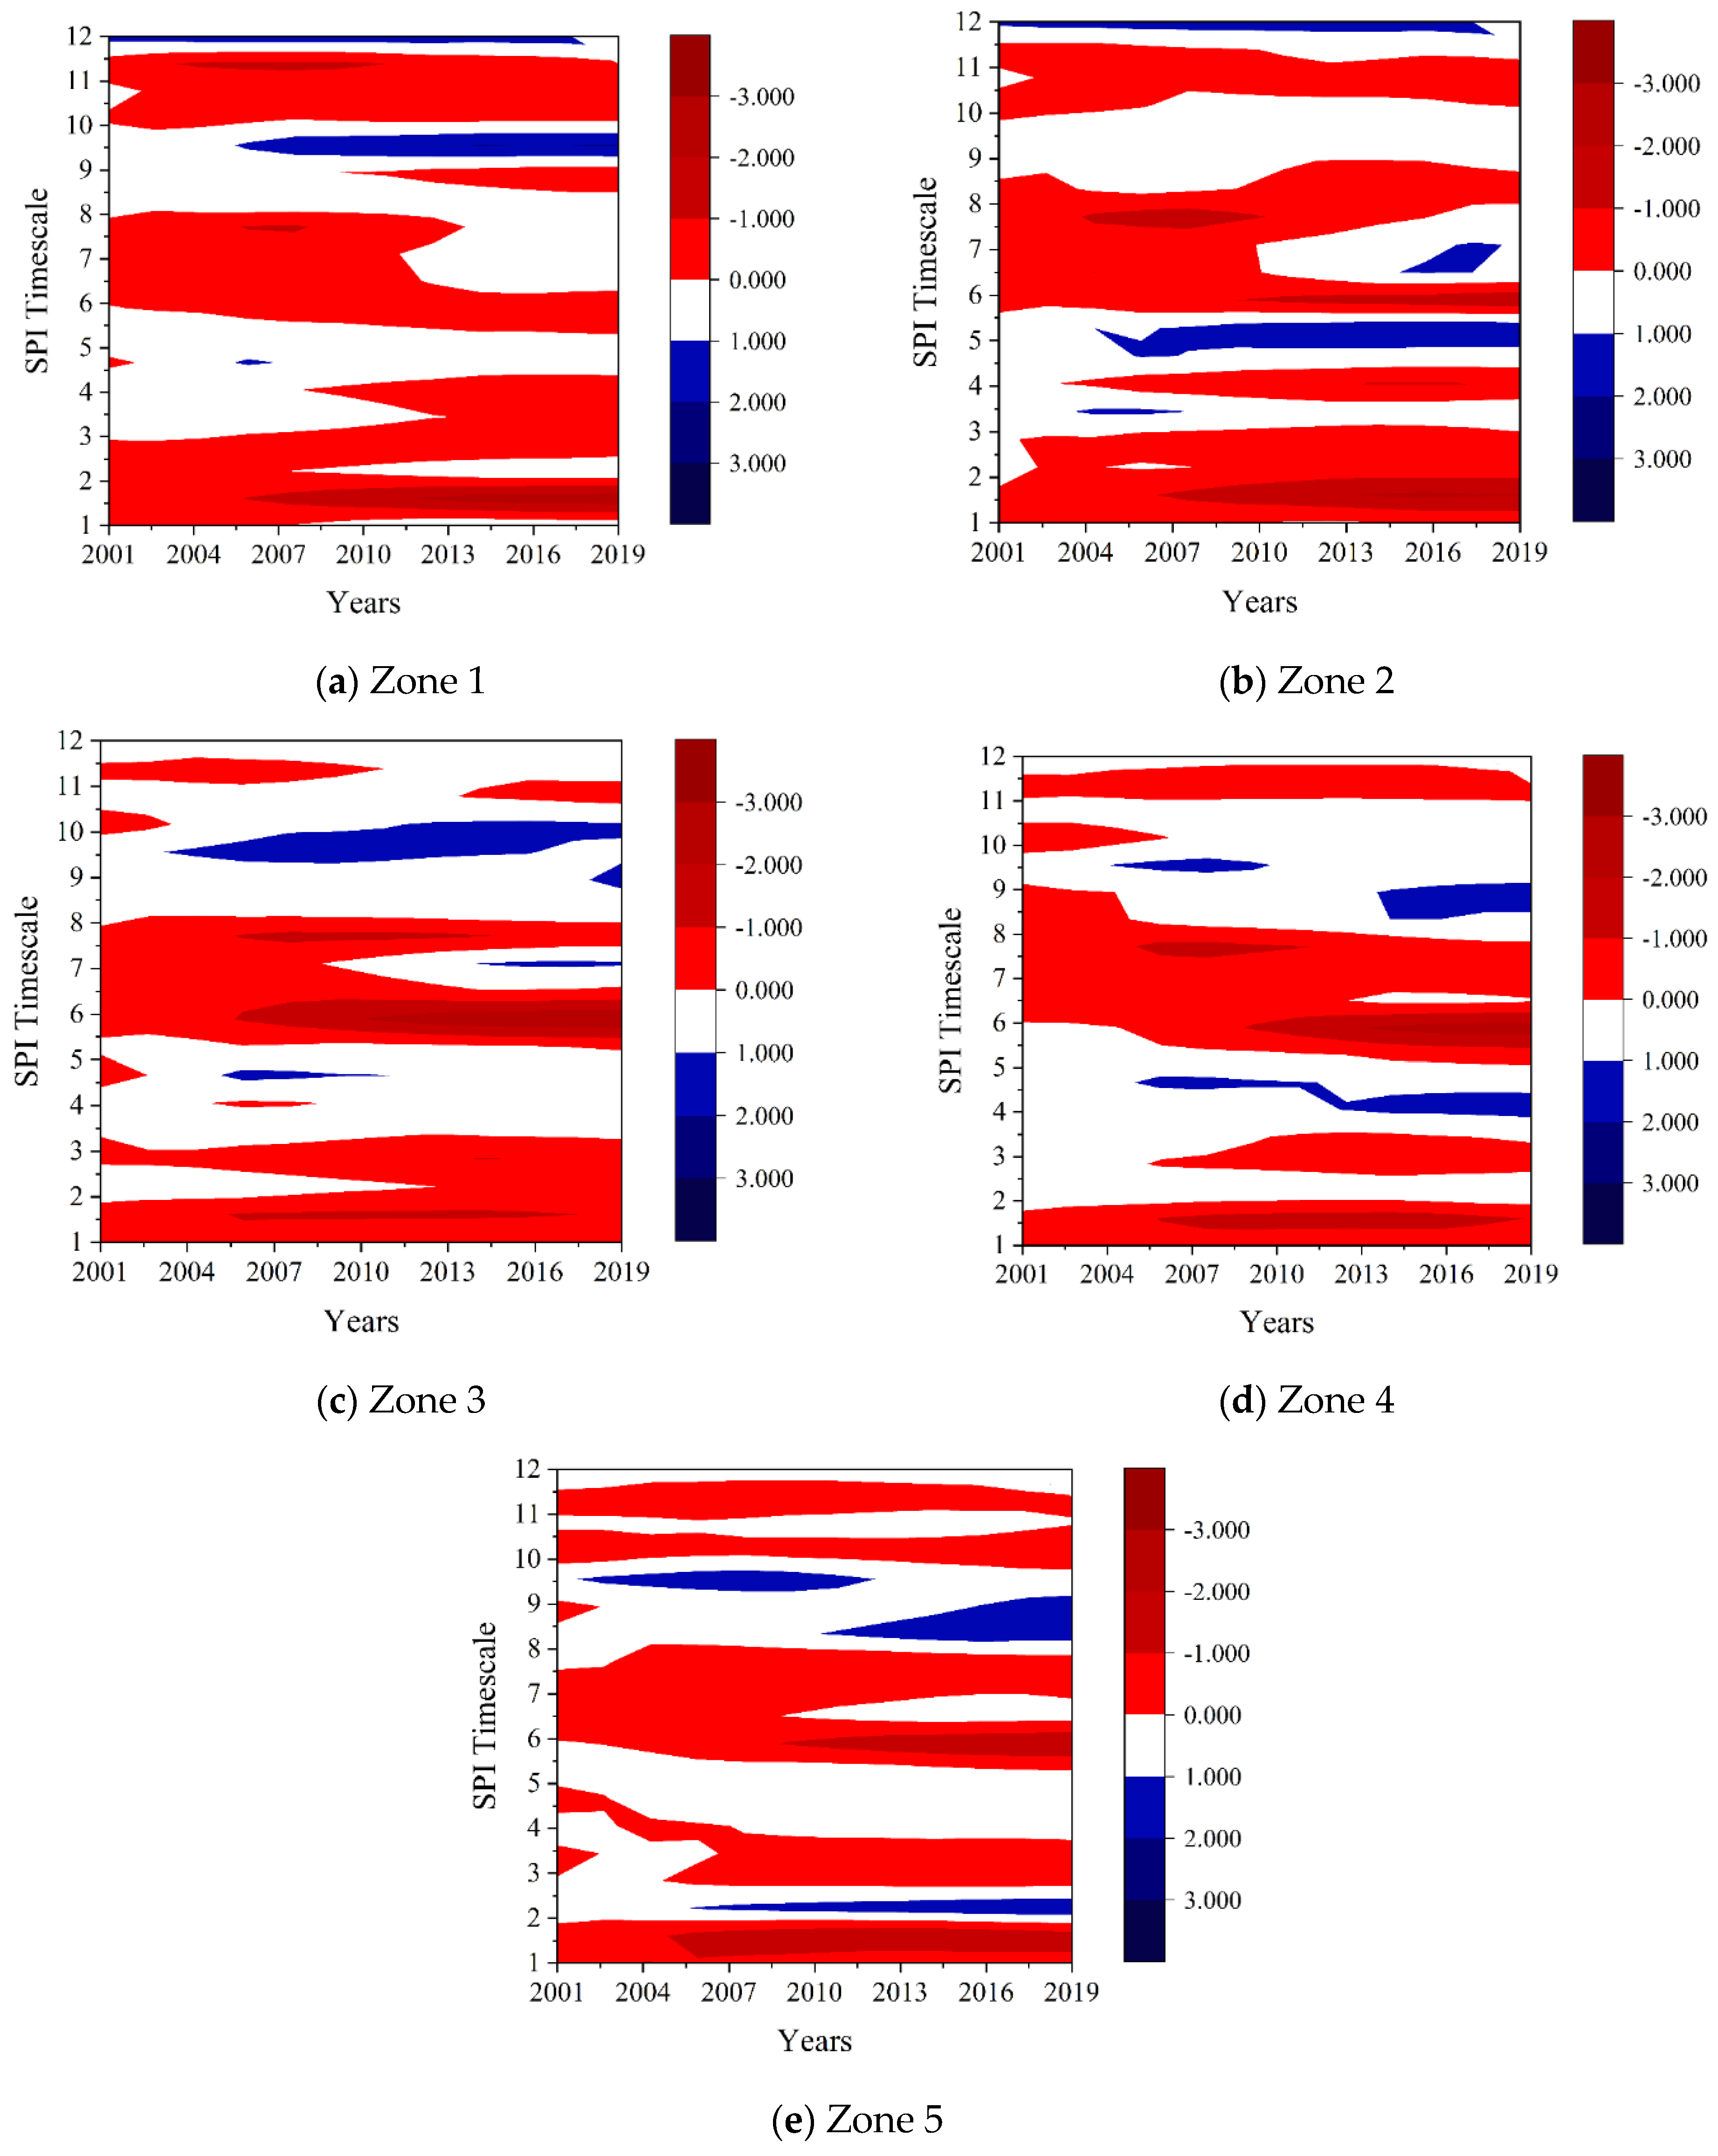
The temporal evolution of the averaged SPIs for the wheat cropping months (i.e., November–April) indicates that different zones experienced frequent drought episodes during 2001–2019; Figure 3. The SPI at lags of 1–12 months shows the alternate occurrence of dry periods throughout the wheat cropping season, which indicates the drought timing and its persistent behavior in different zones of Punjab for the particular timescale. The results reveal that almost all the zones of Punjab were sensitive to droughts having a timescale of 1 and 6 months during the period 2006 to 2019, based on a negative SPI value. It is noteworthy here to mention that the occurrence of drought in Pakistan is mainly due to the variations in monsoon rainfall and western disturbance. According to the Pakistan Meteorological Department, the rainfall in Pakistan during the first five months decreased by an average of 45% compared to the previous decade. This may be the cause of the frequent drought episodes in different parts of Punjab, resulting in serious water stress, especially for the agriculture sector during Rabi crops.
The most severe drought years in Zones 1 for 1- and 2-monthtimescales were from 2007 to 2019. In Zone 2, the drought events occurred for 1,2, 6, and 7, 8 month timescales during the time periods of 2007–2019, 2010–2019, and 2004–2006, respectively. For Zone 3, the severe drought years occurred from 2007 to 2019 for the 6-month timescale. Zone 4 exhibited the drought sensitivity for 1, 6, and 8-month timescales, and drought-affected years occurred during 2006–2018, 2010–2019, and 2006–2010 for the respective timescale. The most severe drought years in Zone 5 for a 1-month timescale were from 2005 to 2019, and for a 6-month timescale were from 2010 to 2019. Overall, it is observed that all the zones of Punjab are under the influence of recurrent moderate drought episodes at particular timescales. It should be mentioned that there was a shift from moderate to severe drought periods between 2001–2006 and 2007–2019 in almost all the zones of Punjab at 1 and2-month timescale. This shift in the intensity of drought from moderate to severe had a serious impact on the groundwater in Punjab, which declined at the rate of about 0.79 m/year during 2001–2018 due to over-abstraction for agriculture purposes (survey of the Irrigation Department of Punjab). Therefore, Pakistan recently implemented steps toward a sustainable groundwater policy, starting with the water policy 2018 for drought management and identification of priority areas for groundwater management under water-stress conditions.

3.2. Fractional Frequency

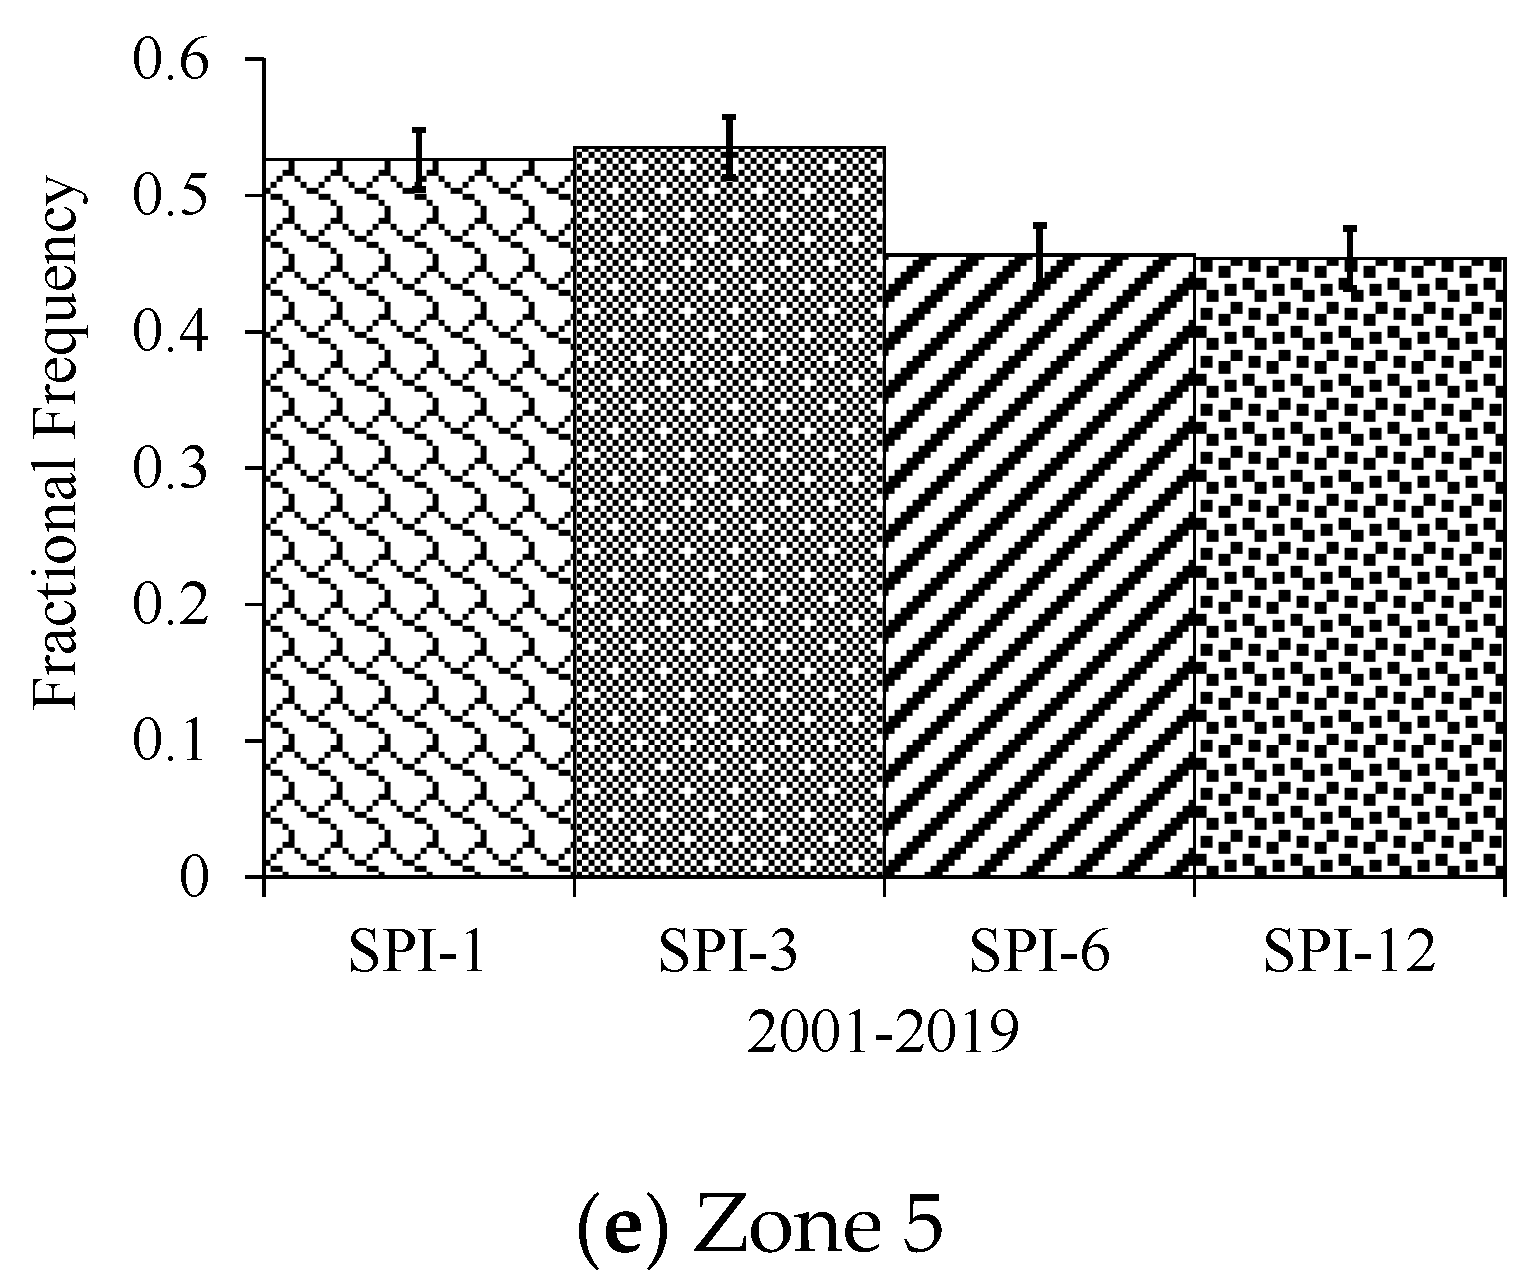
Figure 4 describes the yearly variations in the temporal distribution of drought over Punjab. There was approximately the same number of drought months and years in all zones. The frequency of the dry month was about 50%. The average drought frequency in Zones 1, 2, 3, 4, and 5 during 2001–2019 was 0.52, 0.50, 0.46, 0.49, and 0.49, respectively. The frequency of drought in Zones 1 and 2 is slightly higher than that in other zones of Punjab. The results reveal that 1- and 3-month droughts had a higher frequency (i.e., a greater number of dry months, which indicates the severity of the meteorological drought) for all zones except Zone 1, whereas the frequency of 6-month droughts was slightly higher than that of the droughts of other timescales. Zone 2 was sensitive to 3-month droughts, i.e., the frequency of SPI-3 was higher than that of SPI-1, SPI-6, and SPI-12. In Zone 3, SPI-1 was most frequent, whereas the frequency of SPI-3 was slightly higher than that of SPI-6 and 12, which had equal frequencies. The frequencies of occurrence of short-term droughts, such as SPI-1 and SPI-3, were almost equal in Zone 4, and SPI-6 seems to have had a higher frequency than SPI-12, which occurred least. The results for Zone 5 also show its sensitivity to SPI-1 and SPI-3, which occurred with equal frequencies, whereas the frequencies of SPI-6 and SPI-12 were lower and also equal in their occurrence.
The SPIs for 1–3 months and 6 months indicate short-term and medium-term droughts, respectively, whereas SPI-12 describes the long-term water deficiency for a certain region [17,25]. The analyses show the occurrence of frequent drought years during the wheat cropping period over the last two decades. Moreover, the results describe the simultaneous increase in drought frequency with the increasing number of drought months during the past two decades.

3.3. Evolution of SYRS

Table 3 indicates whether, for a particular zone, a trend exists in the yield data. The results show the existence of a trend in Zones 1, 2, and 3, whereas no trend was found in Zones 4 and 5. Zones 1, 2, and 3 show an increasing trend, and the available farmland, suitable environment, minimum price support declared by the government, and the soil may have contributed to the production increase in these regions. In addition to the above, due to the modernization in the varieties of wheat and the use of technology to utilize more available cultivable land, the average wheat yield was higher in Zone 2 (1.197 tons/ha−1) and Zone 1 (1.176 tons/ha−1) than in Zones 3, 4, and 5 (0.983 tons/ha−1, 0.943 tons/ha−1, 0.761 tons/ha−1) of Punjab. The northern districts of Punjab have lower productivity per unit of land area due to topographical features and higher relative humidity.
Furthermore, due to the presence of a trend, the wheat yield time series were detrended. The detrended SYRS results showed the year-wise variabilities in the wheat yield for different zones of Punjab (Figure 5). The results for Zones 1, 2, and 3 indicate major wheat yield losses during 2007, whereas Zone 4 and 5 experienced yield losses in 2009, and wheat yield losses in Zone 4 also occurred in 2018. Hence, 2007, 2009, and 2018 were identified as years experiencing wheat yield losses, with SYRS ≤ −1.5, and these years were related to drought years in the respective zones.

3.4. The Correlation between the SPI, SYRS, and Soil Moisture

The cropping period of wheat extends from the November of the previous year to April of the current year (Figure 2). Moreover, the drought conditions that impact the net yield of the wheat crop are described by the positive correlation. Hence, the correlation coefficients between the time series of monthly SPI at lags of 1–12 months and the SYRS of the wheat yield for the study period (i.e., 2001 to 2019) were estimated during the cropping period of wheat. The results show that the wheat yield is sensitive and responsive to the dry conditions at different time lags. Each zone experienced drought conditions during 2001–2019 at different time lags and different cropping stages of the wheat.
Figure 6 illustrates that, in Zone 1, moderate drought conditions prevailed during January and February at 1–2-month lags. In Zone 2, the highest positive correlation indicating severe drought is observed during January and March at a 1- and 3-month timescales. However, in Zone 3, severe drought appeared in January at 1- and 5-month timescales, whereas 2- to 4-month timescales revealed moderate drought conditions during the same month. For Zone 4, moderate drought was detected in December and January at 1- to 2- and 3- to 4-month timescales respectively. Zone 5 showed moderate drought conditions during the month of December at a 1- to 4-month timescale.
In contrast to other zones, Zone 2 showed exceptional behavior due to the appearance of mild to severe drought in all the stages of the wheat cropping period at both short and long-term timescales. The results indicates that this zone is a drought-prone region of Punjab, and that its wheat yield is very sensitive to drought. The correlation coefficients between the SPIs and SYRS from December to March are above 0.20, which indicates that the wheat yield loss is correlated with drought. Moreover, a positive correlation between medium- to long-term drought and SYRS can influence the wheat cropping cycle, particularly in Zone 2 (Figure 6b).
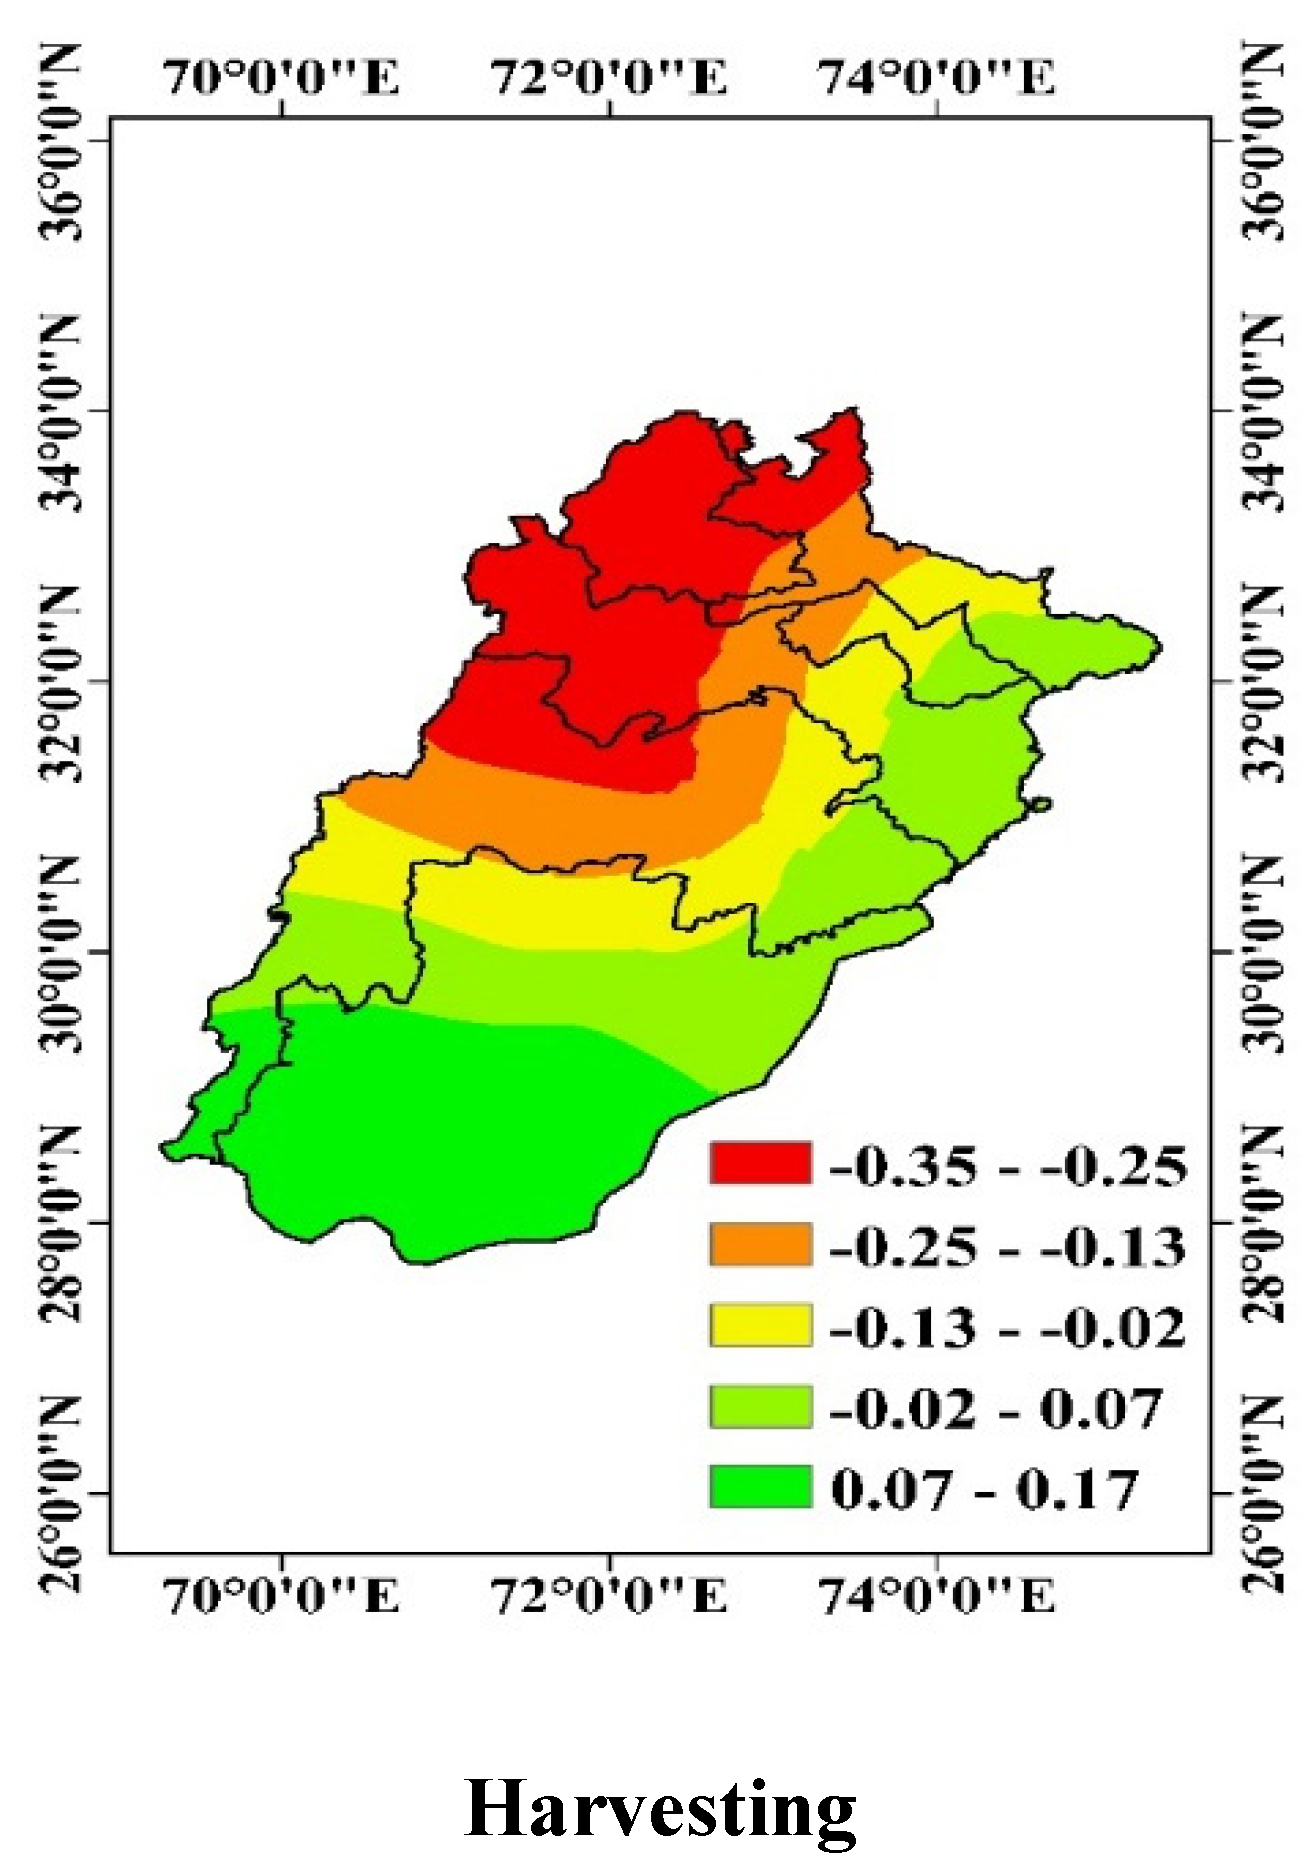
Across Punjab, the growing period of wheat showed the highest correlation between soil moisture and wheat yield, with R = 0.661, compared to other cropping stages (Figure 7). However, the correlation was observed to be reduced and shifted from lower Punjab to upper Punjab during sowing and harvesting stages (Figure 7). The SYRS of wheat is considerably correlated with the soil moisture during the growing stage (Figure 7). These findings indicate the growing period of the wheat crop is the most sensitive time affected by the fluctuation in insufficient soil moisture. During the growing period, the plants require high a soil moisture content, and droughts during this critical time cause crop yield losses [19,28]. Hence, the negative consequences of drought in terms of crop yield losses can be minimized if arrangements are made to maintain soil moisture during the reproductive phase of the wheat crop, particularly in the two lower zones of Punjab.

3.5. Variations in the Correlation between the SYRS and SPI

The correlation between the SPIs (1, 3, 6, and 12) and SYRS of wheat shows the variations between 2001 and 2019 (Figure 8). During 2001–2017, the correlation coefficient between SPI-1 and the wheat yield showed an increasing trend, particularly during the first two months of the growing period, in all five zones of Punjab (Figure 8). The first three zones were found to be sensitive to drought conditions during the harvesting period, with a positive correlation between SPI-1 and SYRS. A negative correlation was observed between the seasonal SPIs (SPI3 and SPI6) and SYRS during 2001–2019 for the growing period in almost all zones of Punjab (Figure 8b,c). The long-term water-deficient condition (SPI-12) had a negative impact on the wheat yield in Zone 5 during the sowing and growing season of the wheat crop (Figure 8d). SPI6 and SPI12 show a positive correlation with SYRS during the late growing and harvesting stages of wheat crops in all zones of Punjab. Moreover, meteorological drought (SPI-1) exerted an influence on the yield of wheat crops in all zones of Punjab.

4. Discussion

Agriculture, as the single largest sector of the Pakistan’s economy, can help to achieve the ultimate goal of economic development. Among different agriculture products, wheat is Pakistan’s major staple crop and, as such, is critical to the country’s food and nutrition security. Wheat contributes approximately 23.55 percent of total agricultural value addition in Pakistan and 4.67 percent of GDP (https://www.statista.com/statistics/383256/pakistan-gdp-distribution-across-economic-sectors/) accessed in 2 December 2021. Therefore, wheat self-sufficiency has always been a top priority for governments. According to the Food and Agriculture Organization, Pakistan is the eighth-largest wheat producer in the world and the third-largest in Asia. Moreover, based on agriculture statistics, wheat production in Pakistan in 2016–2017 was approximately 26 million tons, with the Punjab province producing approximately 75 percent of that amount. In Pakistan, precipitation plays an important role in wheat production and, due to inconsistent rain patterns, almost every region in Pakistan has experienced severe drought, seriously harming wheat production and economic sectors.
Hence, this study was designed to assess the variations in the spatiotemporal pattern of drought and its possible impacts on the wheat cropping cycle over the five zones of Punjab during 2001–2019. The SPI time series during the wheat cropping season revealed the occurrence of wet and dry conditions at 1–12-month lags, indicating the drought characteristics (i.e., severity, duration, and extent) [29]. Temporally, SPI at different lags indicates that all zones showed sensitivity to short-term drought (1–2-month timescale). The important aspect of the current analysis is the investigation of the drought during the different stages of the wheat crop. The correlation between drought and the wheat yield was determined only for the actual cropping season of the wheat (i.e., November to April), rather than the whole annual calendar, to avoid uncertainties [16,22]. However, the results of the short-term lags of the SPI revealed the highest correlation, particularly during the sowing and growing stages of the wheat crop, which means initial stages such as cultivation, germination, physiological maturity, and growth require a high moisture content [19,28]. Fluctuation in soil moisture in sowing and growing stages can have adverse effects on the yield of the wheat crop. The wheat yield loss is high when drought occurs during the reproductive phase because the limited availability of soil moisture reduces seed germination [13,16]. Furthermore, low soil moisture potential in winter has negative impacts on the wheat yield. A negative correlation between drought and yield during the harvesting season of the crop indicates the availability of soil moisture, which may not be associated with crop production. However, a positive correlation was found during the harvesting season for medium- and long-term droughts in all zones of Punjab.
Droughts have recently intensified in Asian countries, and rain-fed agriculture is under serious threat due to the deficiency in the soil water potential [15]. A drought study conducted in India for the crop phenology of wheat indicated an increased drought frequency every decade [14]. The current analyses also indicate that there was an increase in the sensitivity of the wheat crop yield to drought in Zones 1 and 2 of Punjab during 2001–2019. For example, in 2020 alone, lower rainfall during the sowing and growing season, and moderate rainfall during the harvesting season, decreased the wheat production in Punjab by 25.5 million tons. As a result, Pakistan is transforming from an exporter to an importer of wheat. Moreover, climate change has impacts on all four seasons, but the temperature increase rate (i.e., growing degree days) in winter is higher than that of summer [30,31], which is also having a serious impact on wheat production. A similar study illustrating the spatiotemporal pattern of drought was conducted for the different parts of China [14,23,30]. To make agriculture more adaptable to climate change, it is critical to understand the effects of climate extreme events (such as drought) on the agricultural sector at different timescales of the cropping calendar.
This study emphasizes the difficulty of ensuring a sustainable food supply in the midst of meteorological drought. The current findings contribute to a better understanding of climate-induced yield variability by quantifying variability in drought sensitivity across Punjab at both spatial and temporal scales for one of the major cash crops, i.e., wheat. This type of spatiotemporal understanding allows us to determine when and where meteorological droughts have a significant impact on the wheat yield, and how the yield sensitivity to drought has changed over time. This can guide the drought responses of management, stakeholders, and farmers, and mitigation at the district and regional levels.
The current study only considered the climate-induced variability to identify the drought impacts on the wheat yield, and did not take account of anthropogenic influences. For example, Zones 4 and 5 were found to be less sensitive to drought, which may be due to an effective irrigation system or the use of adaptive crop varieties to mitigate the impacts of drought. However, future studies on the investigation of the correlation between droughts and the crop yield should include anthropogenic information, such as irrigation practices, changes in crop varieties, and other adaptive measures, so that a complete picture of drought impacts can be conceptualized for designing effective drought mitigation plans.

5. Conclusions

The present study explored the frequency and spatiotemporal evolution of drought during the cropping period of one of the major food crops, i.e., wheat, during 2001–2019, using the Standardized Precipitation Index (SPI), in all five zones of Punjab. The drought impact, in terms of the soil moisture deficit, on the wheat crop yield was assessed. The results revealed the occurrence of drought episodes during 2007–2019 in almost all the zones of Punjab. The correlation between the wheat yield and SPIs identified the growing stage as the most critical stage affected by drought. The analysis of soil moisture showed that drought can create water stress during the growing phase of the wheat crop, which ultimately results in yield losses, and Zones 1 and 2 were identified as critical zones. Furthermore, the correlation between SYRS (wheat crop) and the SPI (1, 3, 6, and 12) was determined to evaluate the variations in the wheat yield due to drought. The correlation between wheat and short-term drought (SPI-1) increased during the growing period, and all zones were found to be sensitive to short-term drought. The study concludes that drought episodes occurred in all cropping stages of wheat, but its occurrence during the growing stage significantly affected the wheat yield. The results focus on climate-induced variability, which has significant implications for understanding the drought evolution in the Punjab province. Therefore, these results provide national planners with references for the development of future drought mitigation plans.

Author Contributions

Conceptualization, M.W. and A.H.J.; methodology, I.A.; software, A.A.; original draft preparation writing, M.W., review and editing, M.A.; funding acquisition, J.-E.L. All authors have read and agreed to the published version of the manuscript.

Funding

This work was supported by the Ministry of Education of the Republic of Korea and the National Research Foundation of Korea (NRF-2020S1A5B8103910).

Institutional Review Board Statement

Not applicable.

Informed Consent Statement

Not applicable.

Data Availability Statement

All data is provided in the form of tables and figures.

Conflicts of Interest

The authors declare no conflict of interest.

References

  1. Haile, G.; Tang, Q.; Li, W.; Liu, X.; Zhang, X. Drought: Progress in broadening its understanding. WIREs Water 2019, 7, e1407. [Google Scholar] [CrossRef]
  2. Mishra, A.K.; Singh, V.P. A review of drought concepts. J. Hydrol. 2010, 391, 202–216. [Google Scholar] [CrossRef]
  3. Field, C.B.; Barros, V.; Stocker, T.F. IPCC. 2012. Available online: https://www.ipcc.ch/report/managing-the-risks-of-extreme-events-and-disasters-to-advance-climate-change-adaptation/ (accessed on 1 January 2022).
  4. Emerick, K.; De Janvry, A.; Sadoulet, E.; Dar, M.H. Technological Innovations, Downside Risk, and the Modernization of Agriculture. Am. Econ. Rev. 2016, 106, 1537–1561. [Google Scholar] [CrossRef] [Green Version]
  5. Raza, M.; Bakhsh, A.; Kamran, M. Managing climate change for wheat production: An evidence from southern Punjab, Pakistan. J. Econ. Impact 2019, 1, 48–58. [Google Scholar] [CrossRef]
  6. Zaharieva, M.; Ayana, N.G.; Al Hakimi, A.; Misra, S.C.; Monneveux, P. Cultivated emmer wheat (Triticum dicoccon Schrank), an old crop with promising future: A review. Genet. Resour. Crop Evol. 2010, 57, 937–962. [Google Scholar] [CrossRef]
  7. Bank, T.; Code, P.B.; Name, B.; Name, C.; Name, A.F.; Aslam, M.; No, R.; Engineering, A.; Cnic, T.; Registration, C.; et al. Apply for Convocation Apply for Convocation. 2021; pp. 2–3. [Google Scholar]
  8. Ankit, R. India in The Pakistan Times, September 1950–February 1951. India Rev. 2020, 19, 52–84. [Google Scholar] [CrossRef]
  9. Ahmad, I.; Wajid, S.A.; Ahmad, A.; Cheema, M.J.M.; Judge, J. Optimizing irrigation and nitrogen requirements for maize through empirical modeling in semi-arid environment. Environ. Sci. Pollut. Res. 2019, 26, 1227–1237. [Google Scholar] [CrossRef]
  10. Gul, F.; Jan, D.; Ashfaq, M. Assessing the socio-economic impact of climate change on wheat production in Khyber Pakhtunkhwa, Pakistan. Environ. Sci. Pollut. Res. 2019, 26, 6576–6585. [Google Scholar] [CrossRef]
  11. Corassa, G.M.; Amado, T.J.C.; Strieder, M.L.; Schwalbert, R.; Pires, J.L.F.; Carter, P.R.; Ciampitti, I.A. Optimum soybean seeding rates by yield environment in southern Brazil. Agron. J. 2018, 110, 2430–2438. [Google Scholar] [CrossRef]
  12. Ashfaq, M.; Zulfiqar, F.; Quddos, A.; Baig, I.; Sarwar, I.; Quddus, M.A.; Baig, I.A. Impact of climate change on wheat productivity in mixed cropping system of Punjab. Soil Environ. 2011, 30, 110–114. [Google Scholar]
  13. Fahad, S.; Bajwa, A.A.; Nazir, U.; Anjum, S.A.; Farooq, A.; Zohaib, A.; Sadia, S.; Nasim, W.; Adkins, S.; Saud, S.; et al. Crop production under drought and heat stress: Plant responses and management options. Front. Plant Sci. 2017, 8, 1147. [Google Scholar] [CrossRef] [Green Version]
  14. Mao, Y.; Wu, Z.; He, H.; Lu, G.; Xu, H.; Lin, Q. Spatio-temporal analysis of drought in a typical plain region based on the soil moisture anomaly percentage index. Sci. Total Environ. 2017, 576, 752–765. [Google Scholar] [CrossRef] [PubMed]
  15. Miyan, M.A. Droughts in Asian Least Developed Countries: Vulnerability and sustainability. Weather Clim. Extrem. 2015, 7, 8–23. [Google Scholar] [CrossRef] [Green Version]
  16. Hussain, H.A.; Hussain, S.; Khaliq, A.; Ashraf, U.; Anjum, S.A.; Men, S.; Wang, L. Chilling and drought stresses in crop plants: Implications, cross talk, and potential management opportunities. Front. Plant Sci. 2018, 9, 393. [Google Scholar] [CrossRef] [PubMed]
  17. Potopová, V.; Boroneanţ, C.; Boincean, B.; Soukup, J. Impact of agricultural drought on main crop yields in the Republic of Moldova. Int. J. Climatol. 2016, 36, 2063–2082. [Google Scholar] [CrossRef] [Green Version]
  18. Sohrabi, M.M.; Ryu, J.H.; Abatzoglou, J.; Tracy, J. Development of Soil Moisture Drought Index to Characterize Droughts. J. Hydrol. Eng. 2015, 20, 04015025. [Google Scholar] [CrossRef]
  19. Potopová, V.; Boroneanţ, C.; Možný, M.; Soukup, J. Driving role of snow cover on soil moisture and drought development during the growing season in the Czech Republic. Int. J. Climatol. 2016, 36, 3741–3758. [Google Scholar] [CrossRef] [Green Version]
  20. McKee, T.; Doesken, N.; Kleist, J. The relationship of drought frequency and duration to time scales. In Proceedings of the 8th Conference on Applied Climatology, Anaheim, CA, USA, 17–22 January 1993. [Google Scholar]
  21. Palmer, W.C. Meteorological Drought; U.S. Department of Commerce, Weather Bureau: Washington, DC, USA, 1965.
  22. Potopová, V.; Štěpánek, P.; Možný, M.; Türkott, L.; Soukup, J. Performance of the standardised precipitation evapotranspiration index at various lags for agricultural drought risk assessment in the Czech Republic. Agric. For. Meteorol. 2015, 202, 26–38. [Google Scholar] [CrossRef]
  23. Abbas, F. Analysis of a Historical (1981–2010) Temperature Record of the Punjab Province of Pakistan. Earth Interact. 2013, 17, 1–23. [Google Scholar] [CrossRef]
  24. Sharma, S.; Hamal, K.; Khadka, N.; Joshi, B.B. Dominant pattern of year-to-year variability of summer precipitation in Nepal during 1987–2015. Theor. Appl. Climatol. 2020, 142, 1071–1084. [Google Scholar] [CrossRef]
  25. Potop, V.; Boroneanţ, C.; Možný, M.; Štěpánek, P.; Skalák, P. Observed spatiotemporal characteristics of drought on various time scales over the Czech Republic. Theor. Appl. Climatol. 2014, 115, 563–581. [Google Scholar] [CrossRef]
  26. Li, X.; He, B.; Quan, X.; Liao, Z.; Bai, X.; Zhao, X.; Yang, W.; Huete, A.R.; Thenkabail, P.S. Use of the Standardized Precipitation Evapotranspiration Index (SPEI) to Characterize the Drying Trend in Southwest China from 1982–2012. Remote Sens. 2015, 7, 10917–10937. [Google Scholar] [CrossRef] [Green Version]
  27. Sehgal, A.; Sita, K.; Siddique, K.H.M.; Kumar, R.; Bhogireddy, S.; Varshney, R.K.; HanumanthaRao, B.; Nair, R.M.; Prasad, P.V.V.; Nayyar, H. Drought or/and heat-stress effects on seed filling in food crops: Impacts on functional biochemistry, seed yields, and nutritional quality. Front. Plant Sci. 2018, 871, 1705. [Google Scholar] [CrossRef] [Green Version]
  28. Liu, X.; Pan, Y.; Zhu, X.; Yang, T.; Bai, J.; Sun, Z. Drought evolution and its impact on the crop yield in the North China Plain. J. Hydrol. 2018, 564, 984–996. [Google Scholar] [CrossRef]
  29. Lloyd-Hughes, B. A spatio-temporal structure-based approach to drought characterization. Int. J. Climatol. 2012, 32, 406–418. [Google Scholar] [CrossRef] [Green Version]
  30. Gebremeskel Haile, G.; Tang, Q.; Leng, G.; Jia, G.; Wang, J.; Cai, D.; Sun, S.; Baniya, B.; Zhang, Q. Long-term spatiotemporal variation of drought patterns over the Greater Horn of Africa. Sci. Total Environ. 2020, 704, 135299. [Google Scholar] [CrossRef] [PubMed]
  31. Kreyling, J.; Grant, K.; Hammerl, V.; Arfin-Khan, M.A.S.; Malyshev, A.V.; Peñuelas, J.; Pritsch, K.; Sardans, J.; Schloter, M.; Schuerings, J.; et al. Winter warming is ecologically more relevant than summer warming in a cool-temperate grassland. Sci. Rep. 2019, 9, 14632. [Google Scholar] [CrossRef] [Green Version]
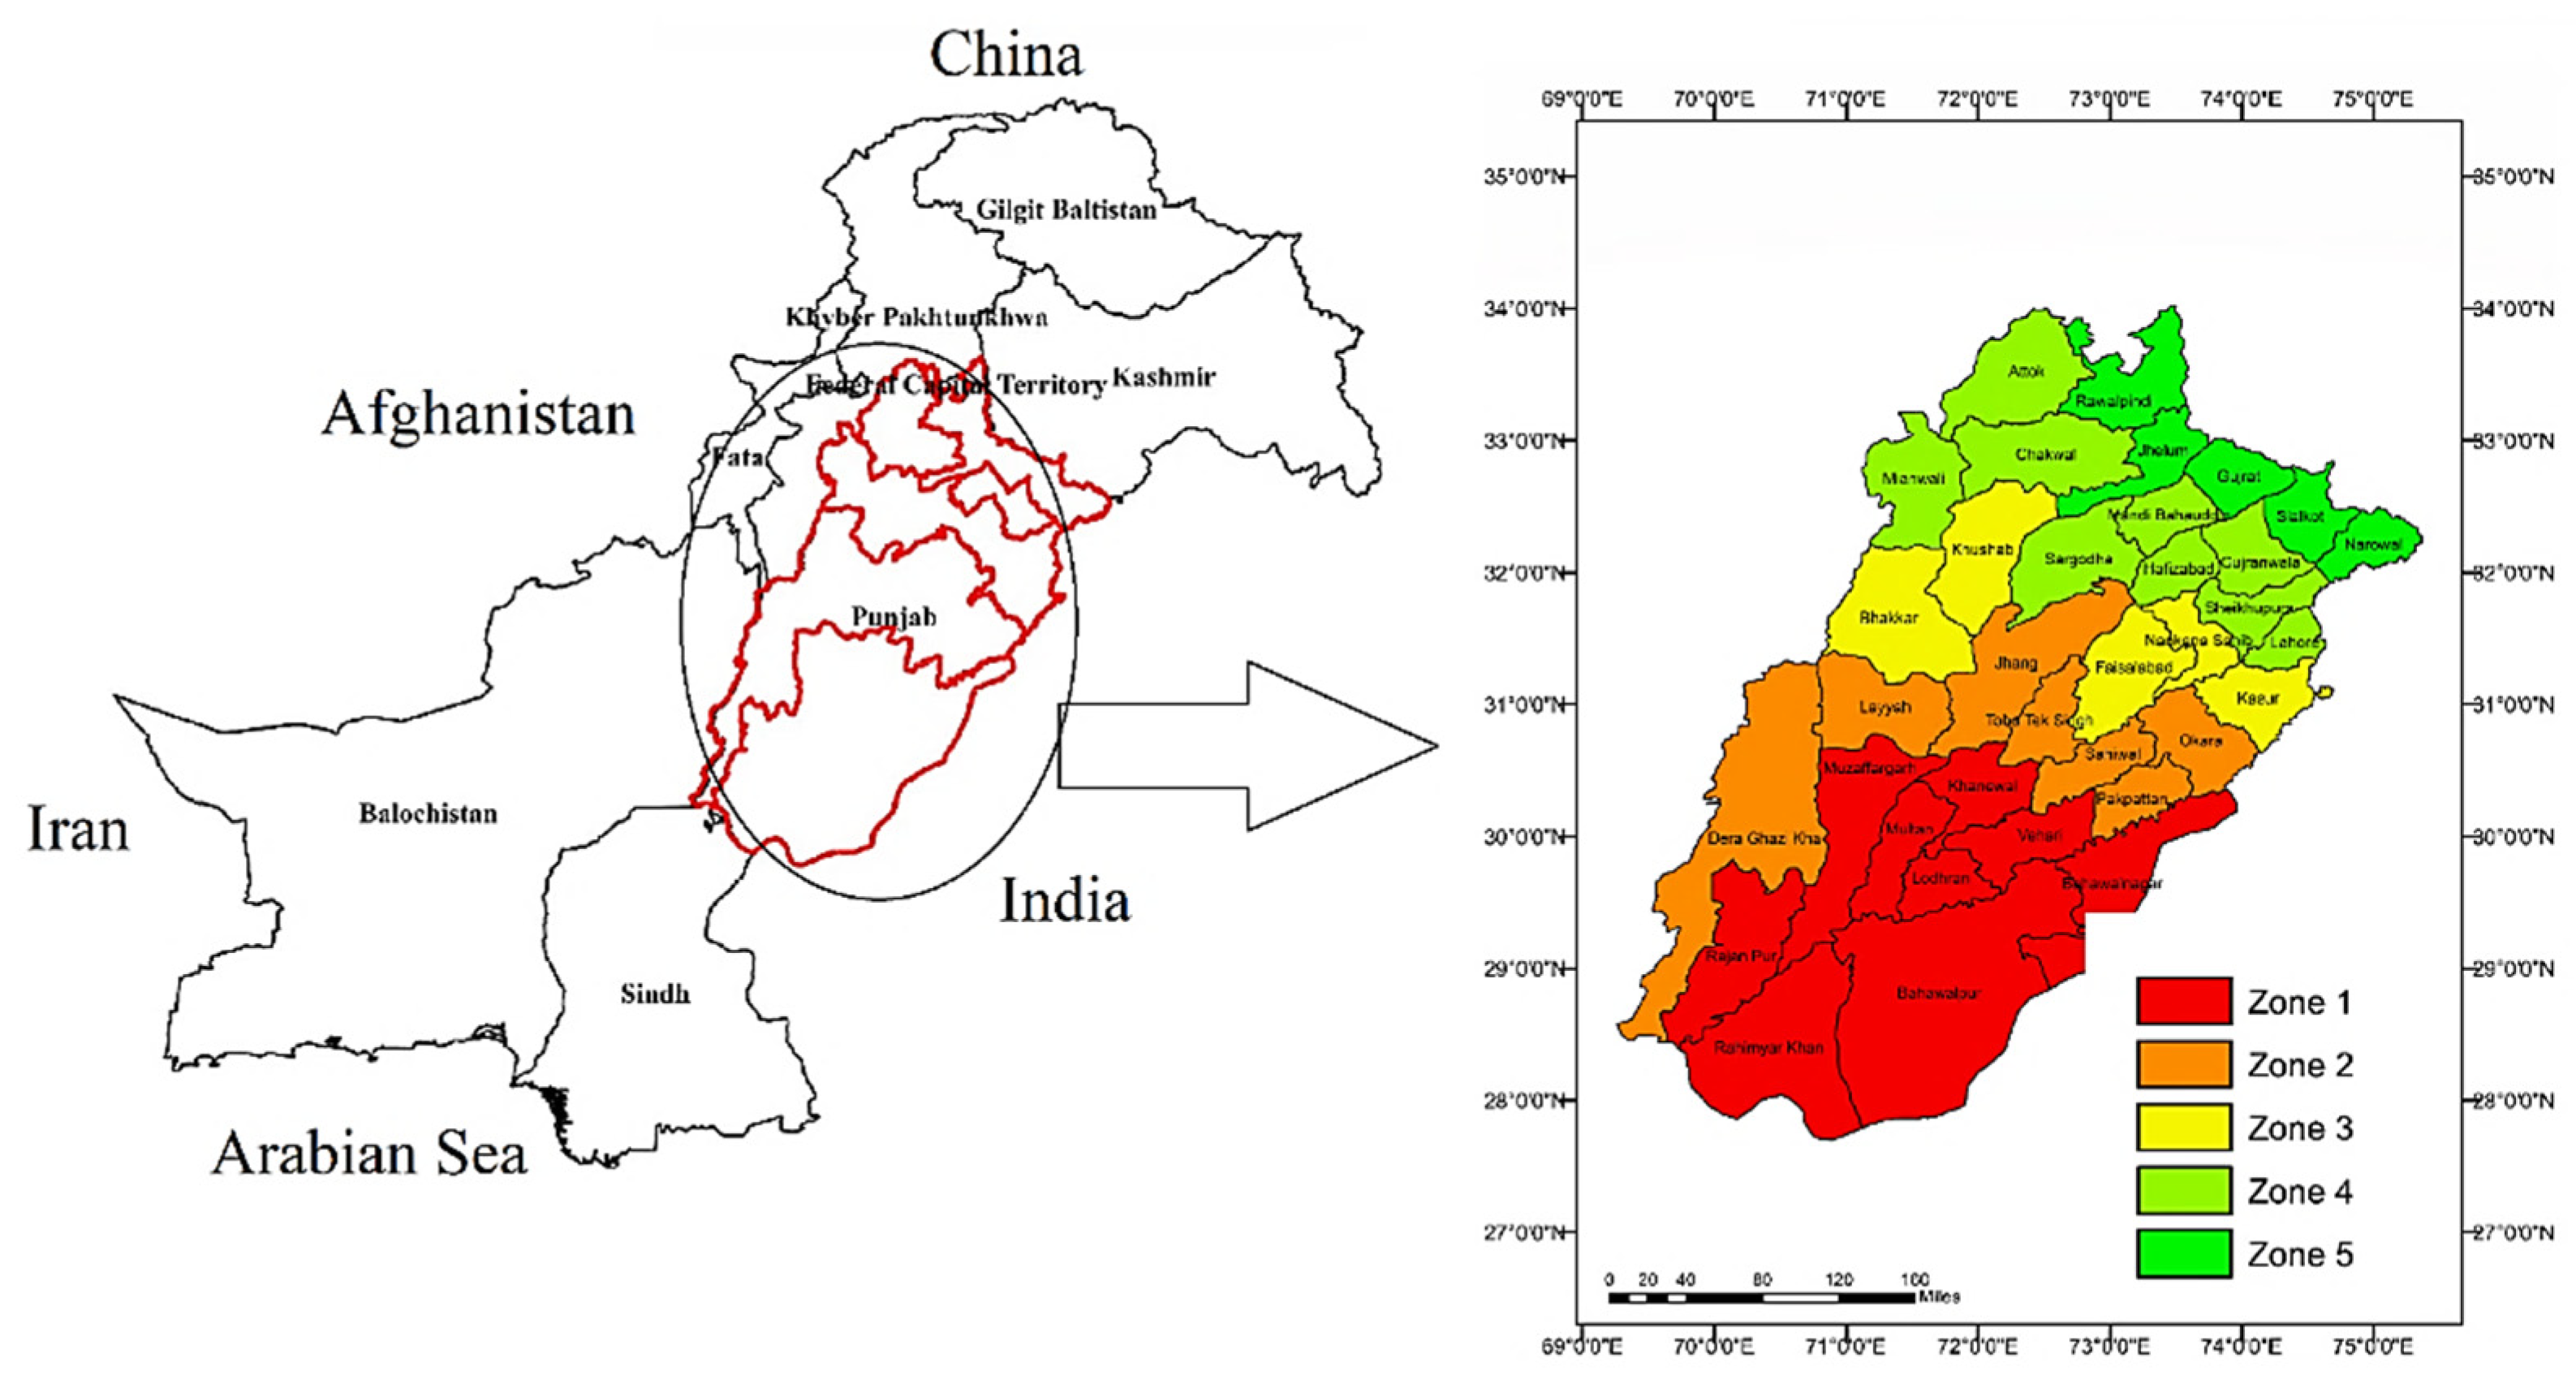
Figure 1. Study area map of Punjab, Pakistan, where different colors represent the selected zones.
Water 14 00496 g001
Figure 2. Cropping calendar of wheat in Punjab, Pakistan.
Water 14 00496 g002
Figure 3. The temporal time series of the Standardized Precipitation Index (SPI) at 1–12-month lags in different zones of Punjab, (a) Zone 1, (b) Zone 2, (c) Zone 3, (d) Zone 4 and (e) Zone 5. The blue color describes the wet condition and the red color shows the dry condition.
Water 14 00496 g003
Figure 4. Fractional frequency of the Standardized Precipitation Index (SPI) for the wheat crop in different zones of Punjab, (a) Zone 1, (b) Zone 2, (c) Zone 3, (d) Zone 4 and (e) Zone 5.
Water 14 00496 g004aWater 14 00496 g004b
Figure 5. Temporal time series of the Standardized Yield Residual Series (SYRS) of the wheat crop in different zones of Punjab during 2001–2019, (a) Zone 1, (b) Zone 2, (c) Zone 3, (d) Zone 4 and (e) Zone 5.
Water 14 00496 g005aWater 14 00496 g005b
Figure 6. The correlation coefficients between the monthly Standardized Precipitation Index (SPI) series at 1–12-month lags and the Standardized Yield Residual Series (SYRS) of wheat in different zones of Punjab during 2001–2019, (a) Zone 1, (b) Zone 2, (c) Zone 3, (d) Zone 4 and (e) Zone 5. The red color indicates a positive correlation, and the blue color indicates a negative correlation.
Water 14 00496 g006aWater 14 00496 g006b
Figure 7. Spatial correlation between soil moisture at different cropping stages and the Standardized Yield Residual Series (SYRS) of wheat over the study domain during 2001–2019.
Water 14 00496 g007aWater 14 00496 g007b
Figure 8. The correlation between the detrended Standardized Precipitation Index (SPIs) and Standardized Yield Residual Series (SYRS) for the wheat crop.(a) SP-1; (b) SP-3; (c) SP-6; (d) SP-12.
Water 14 00496 g008aWater 14 00496 g008b
Table 1. Drought categories defined based on the SPI value.
SPI ValueDrought Category
−1.5 < SPI < 0 Moderate
−2 < SPI < 1.5 Severe
SPI < −2 Extreme
Table 2. The categories for yield loss based on the SYRS value.
SYRS Value Yield Loss Category
−1.0 < SYRS ≤ −0.5Low yield loss
−1.5 < SYRS ≤ −1Moderate yield loss
SYRS ≤ −1.5High yield loss
Table 3. Trend analysis of the yield for selected zones.
RegionWheat
Zone 10.0655 (p < 0.05)
Zone 20.0499 (p < 0.05)
Zone 30.0524 (p < 0.05)
Zone 40.0534 (p < 0.05)
Zone 50.0619 (p < 0.05)
Publisher’s Note: MDPI stays neutral with regard to jurisdictional claims in published maps and institutional affiliations.