Article

Combination of Microscopic Tests of the Activated Sludge and Effluent Quality for More Efficient On-Site Treatment

by
Agnieszka Karczmarczyk
1,* and
Weronika Kowalik
2
1
Department of Environmental Management, Institute of Environmental Engineering, Warsaw University of Life Sciences, Nowoursynowska 159, 02-776 Warsaw, Poland
2
Water Centre, Warsaw University of Life Sciences, Ciszewskiego 6, 02-776 Warsaw, Poland
*
Author to whom correspondence should be addressed.
Water 2022, 14(3), 489; https://doi.org/10.3390/w14030489
Submission received: 30 December 2021 / Revised: 1 February 2022 / Accepted: 6 February 2022 / Published: 7 February 2022
(This article belongs to the Section Wastewater Treatment and Reuse)

Abstract

:
Container on-site wastewater treatment plants are systems of growing interest in the areas where sewer systems cannot be implemented. In this study, container on-site wastewater treatment plant with low-loaded activated sludge has been examined. The aim of the study was: (i) to assess the efficiency of the plant; and (ii) to evaluate the relationship between the condition of activated sludge and selected parameters of effluent quality. Effluent quality has been characterized by the reliability factor (RF) and technological purity index (TPI). Sludge quality assessment covered measurements of volume (Vo), dry matter (DM), sludge index (SI), and the unit oxygen consumption rate (UOCR). Microscopic analysis has been performed to assess the morphological (flocks) and biotic quality (sludge biotic index, SBI) of activated sludge. The research has been completed by an on-site measurement of dissolved oxygen concentration in an activated sludge chamber with 30 s intervals. Results confirmed a significant (p < 0.05) correlation (CC = −0.9277) between biochemical oxygen demand (BOD5) and SBI for the oxygen level in the aeration chamber between 1–2 mg/L. Negative significant correlation (p < 0.05) has also been found between SBI and electrical conductivity (EC) (CC = −0.7478). In the examined case, the optimal EC of the effluent was in the range of 600–800 µS/cm.

1. Introduction

The activated sludge is the most widely used treatment process for the removal of organic pollutants from wastewater [1]. Activated sludge treatment processes are difficult to be controlled because of their complex and nonlinear behavior [2]. It is even more difficult in small container plants when the ability to control the technological parameters is limited and possible mainly by adjusting the blower operation. Container wastewater treatment plants available on the EU market have a certificate of compliance with EN 12566-3:2016 [3]. This European Standard applies to plants where all prefabricated components are factory or site-assembled by one manufacturer and which are tested as a whole. Treatment efficiency of chemical oxygen demand (COD), biochemical oxygen demand (BOD), total solids (TS), nitrogen (N), and phosphorus (P) is a manufacturer’s declaration and should be equal to, or higher than the regulations of the country of distribution. The real efficiency of container on-site wastewater treatment systems, however, often deviates from the assumed values [4] and can be a source of contamination of the environment [5,6,7]. The insufficient degree of wastewater treatment in on-site plants was widely reported. Poorly performing on-site wastewater treatment systems are often attributed to inadequate installation, inadequate maintenance, poor public awareness, insufficient local authority resources, ongoing wastewater management issues, or the inadequate adoption of standards, procedures, and guidelines [8]. Chatterjee et al. [9] stated that insufficient treatment is not the result of faulty technology but the result of unskilled operation. The research by Naughton and Hyngs [10] also addresses the lack of knowledge on the behaviors and attitudes towards domestic wastewater treatment systems. What can be stated is the fact that on-site treatment plants are not maintenance-free facilities. To obtain high efficiency of wastewater treatment, many conditions must be met, and the skills and tools used by the user are very important. Prefabricated wastewater treatment systems, connected to the house drain and electricity, are not “plug and play” devices. Professional operation of a container treatment plant requires “know how”, time and permanent monitoring. In practice, however, the typically operated on-site treatment plant will be subject to limited user control, focused mainly on checking the flow patency and visual inspection of effluent. In activated sludge treatment plants, it is also necessary to check the sludge volume in the aeration chamber periodically. Monitoring of the effluent quality for chemical contamination, the measurement of oxygen level in the activated sludge chamber, or the microscopic analysis of sludge requires advanced skills, equipment, and access to the laboratory, and is beyond the reach of on-site plant’s users. Professional service of on-site treatment plants is usually offered by manufacturers, however, if it is not obligatory, it is rare. The interest in control of on-site plants by local government units that register such facilities is also very limited in this respect. To sum up, the user plays the main role in the quality control of the work of the on-site treatment plant. Therefore, there is a need for a simple and available tool for the assessment of activated sludge conditions, which together with a sludge sedimentation test and visual inspection of the sludge and effluent, will allow the user to monitor the on-site plant efficiently.
In this study, a complex analysis of the operation of the activated sludge-based on-site wastewater treatment plant was carried out, including (i) quality control of the effluent; (ii) controlling the oxygen concentration in the aeration chamber; and (iii) activated sludge quality testing. The quality of the sludge was analyzed by measuring the volume and dry weight, oxygen consumption as well as microscopic analysis of the microorganisms and flocks. A base for this approach is a well-described relationship between the efficiency of wastewater treatment and different groups of microfauna [11,12,13,14,15]. Based on the dominant group of the microfauna, treatment performance can be predicted, e.g., the presence of small flagellates and small naked amoebae will result in low treatment performance, and the presence of testate amoebae and crawling ciliates indicates good treatment efficiency. The sludge biotic index (SBI) appears to be a highly useful index for the integrative assessment of plant functionality, in particular when monitoring and identifying critical situations that can determine the exceedance of discharge limit values [13]. However, there are also examples of failure SBI as an indicator of effluent quality [16,17], e.g., SBI failed in the case of a full-scale municipal wastewater treatment plant working with shock organic and ammonium loadings caused by periodic wastewater delivery from septic tanks [17]. It was also not useful in the case of operation conditions of submerged membrane bioreactors (MBR) [16]. The use of SBI to evaluate the operation of household sewage treatment plants is extremely rare and requires confirmation by testing of such facilities. The set of described relationships between microscopic observation and effluent quality is presented in Table 1 [18].
The aim of the research was: (i) to assess efficiency of an on-site container wastewater treatment plant with a low-loaded activated sludge; and (ii) to evaluate the relationship between the condition of activated sludge and selected parameters of effluent quality.

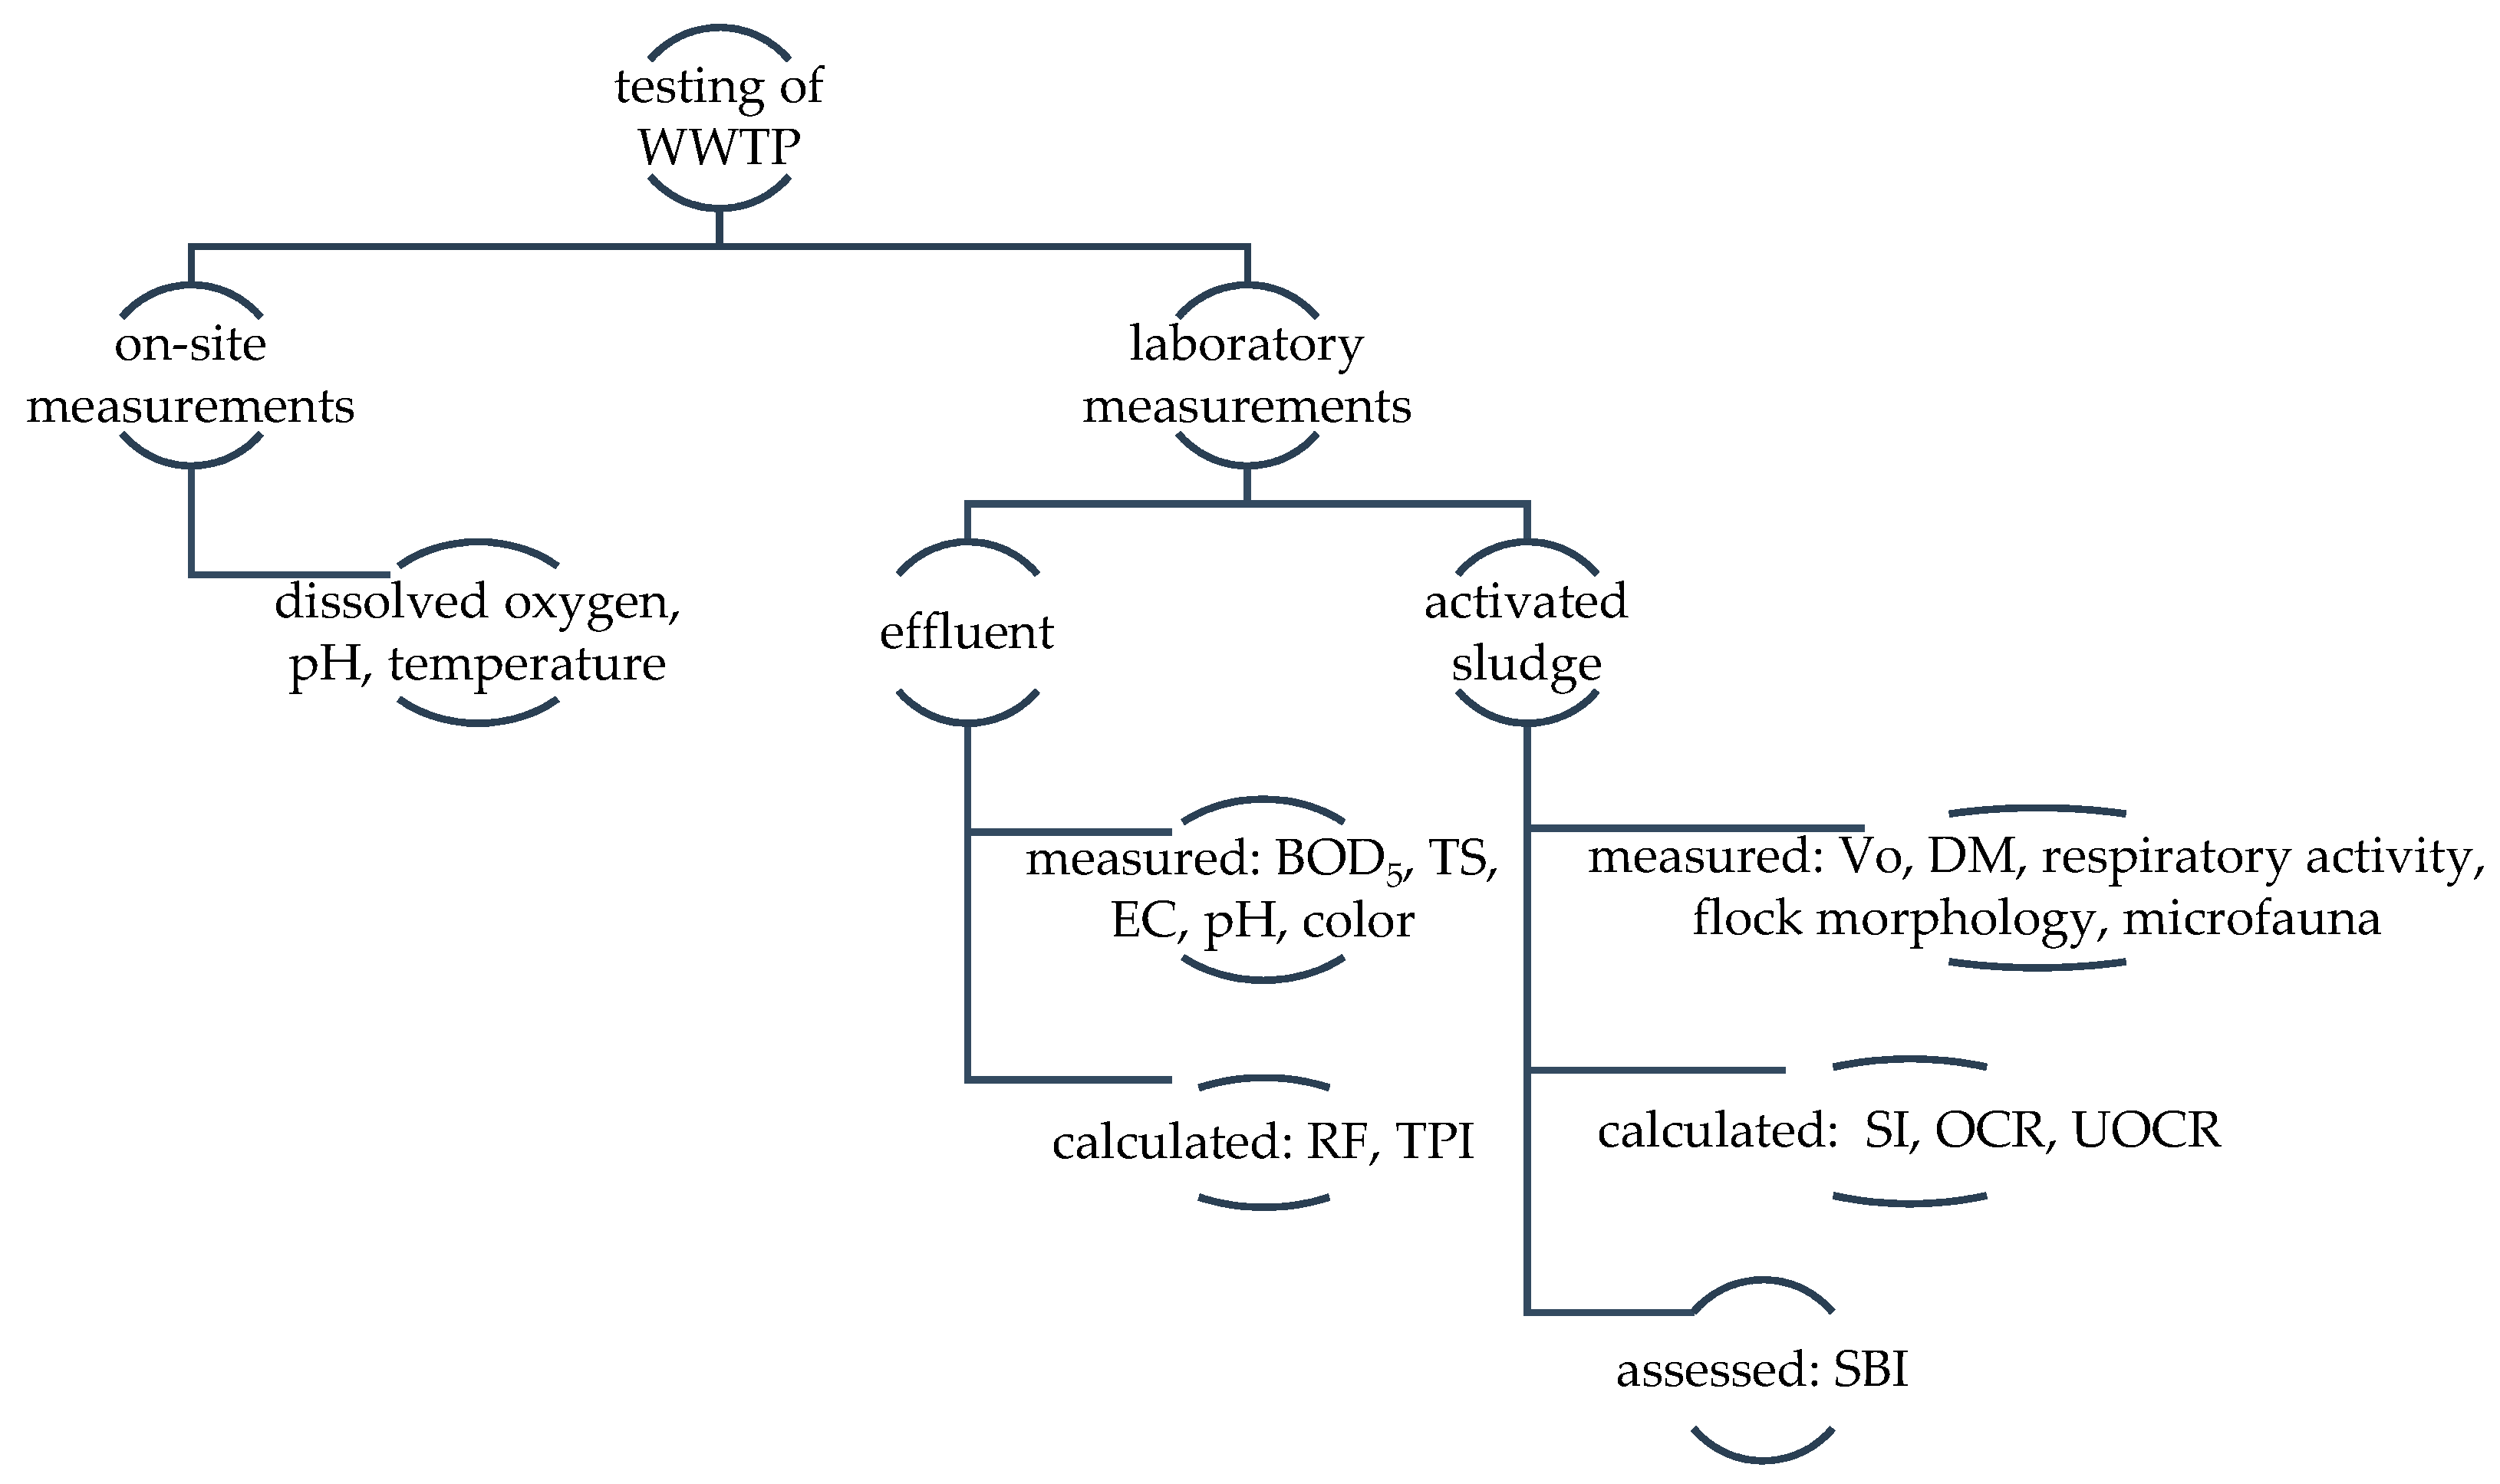
2. Materials and Methods

The examined on-site wastewater treatment plant is located in central Poland (51°59’ N 20°36’ E) and has been installed and run since 2019. It serves as a single house inhabited by two people. The average daily wastewater flow is 0.255 m3/day. This is a container-type plant, without a separate tank for the preliminary treatment. The system consists of a watertight tank, technological equipment, a cover, connections to the inlet and outlet piping, compressor, fine bubble aeration system, and a pump. The plant is equipped with a controller that allows the blower operation time to be adjusted between 1 and 15 min and the rest time in the same range. The plant operates on the principle of low-loaded activated sludge. The time of retention of the activated sludge is from 24 to 72 h [19]. Hydraulic retention time (HRT) for the tested system is 42.5 h. The plant has a certificate of compliance with EN 12566-3: 2016 [3]. Technical parameters of the plant are set in Table 2 and assumed and required effluent quality are in Table 3.
The on-site wastewater treatment plant has been monitored for over a year, be-tween December 2020 and December 2021. Within this period, 81 samples of effluent and 17 samples of activated sludge were collected. During the research period, several on-site measurements of the oxygen concentration in the aeration chamber were also carried out, combined with a change in the settings of the aeration system controller. A graphical explanation of measurements and calculations performed in this study for characterization of the tested on-site wastewater treatment plant is presented in Figure 1.

2.1. Effluent Characteristics

Effluent samples were analyzed for BOD5 (mgO2/L), TS (mg/L), EC (µS/cm), pH and color (PtCo units). BOD was measured by the respirometry method using the OxiTop kit. TS was measured by an indirect method by spectrophotometrically determining the unfiltered suspension in the range of 0–750 mg/l. Color was measured spectrophotometrically in the range of 0–500 PtCo and assessed visually. The EC was measured with an Ultimar conductometer and the pH with an Elmetron model CPR-411 pH meter.
Reliability factor (RF) and technological purity index (TPI) were calculated for BOD5 and TS using the following formulas [21]:
R F = m x X a c c
where: RF—reliability factor; mx—average value of a given indicator in effluent (mg/L); Xacc—acceptable value of an indicator in effluent (mg/L); and
T P I = n z ( N + 1 )
where: TPI—technological purity index; nz—number of test results compliant with limit values, N—number of all test results for a given indicator.
Values of the technological reliability index below 1.0 confirm the proper functioning of the treatment plant. The lower the RF value, the better the treatment effect. TPI index equal to 1.0 means that all obtained results meet the requirements of the quality of treated wastewater. The lower the TPI value, the higher is the number of samples that exceeded the expected values.

2.2. Activated Sludge Characteristic

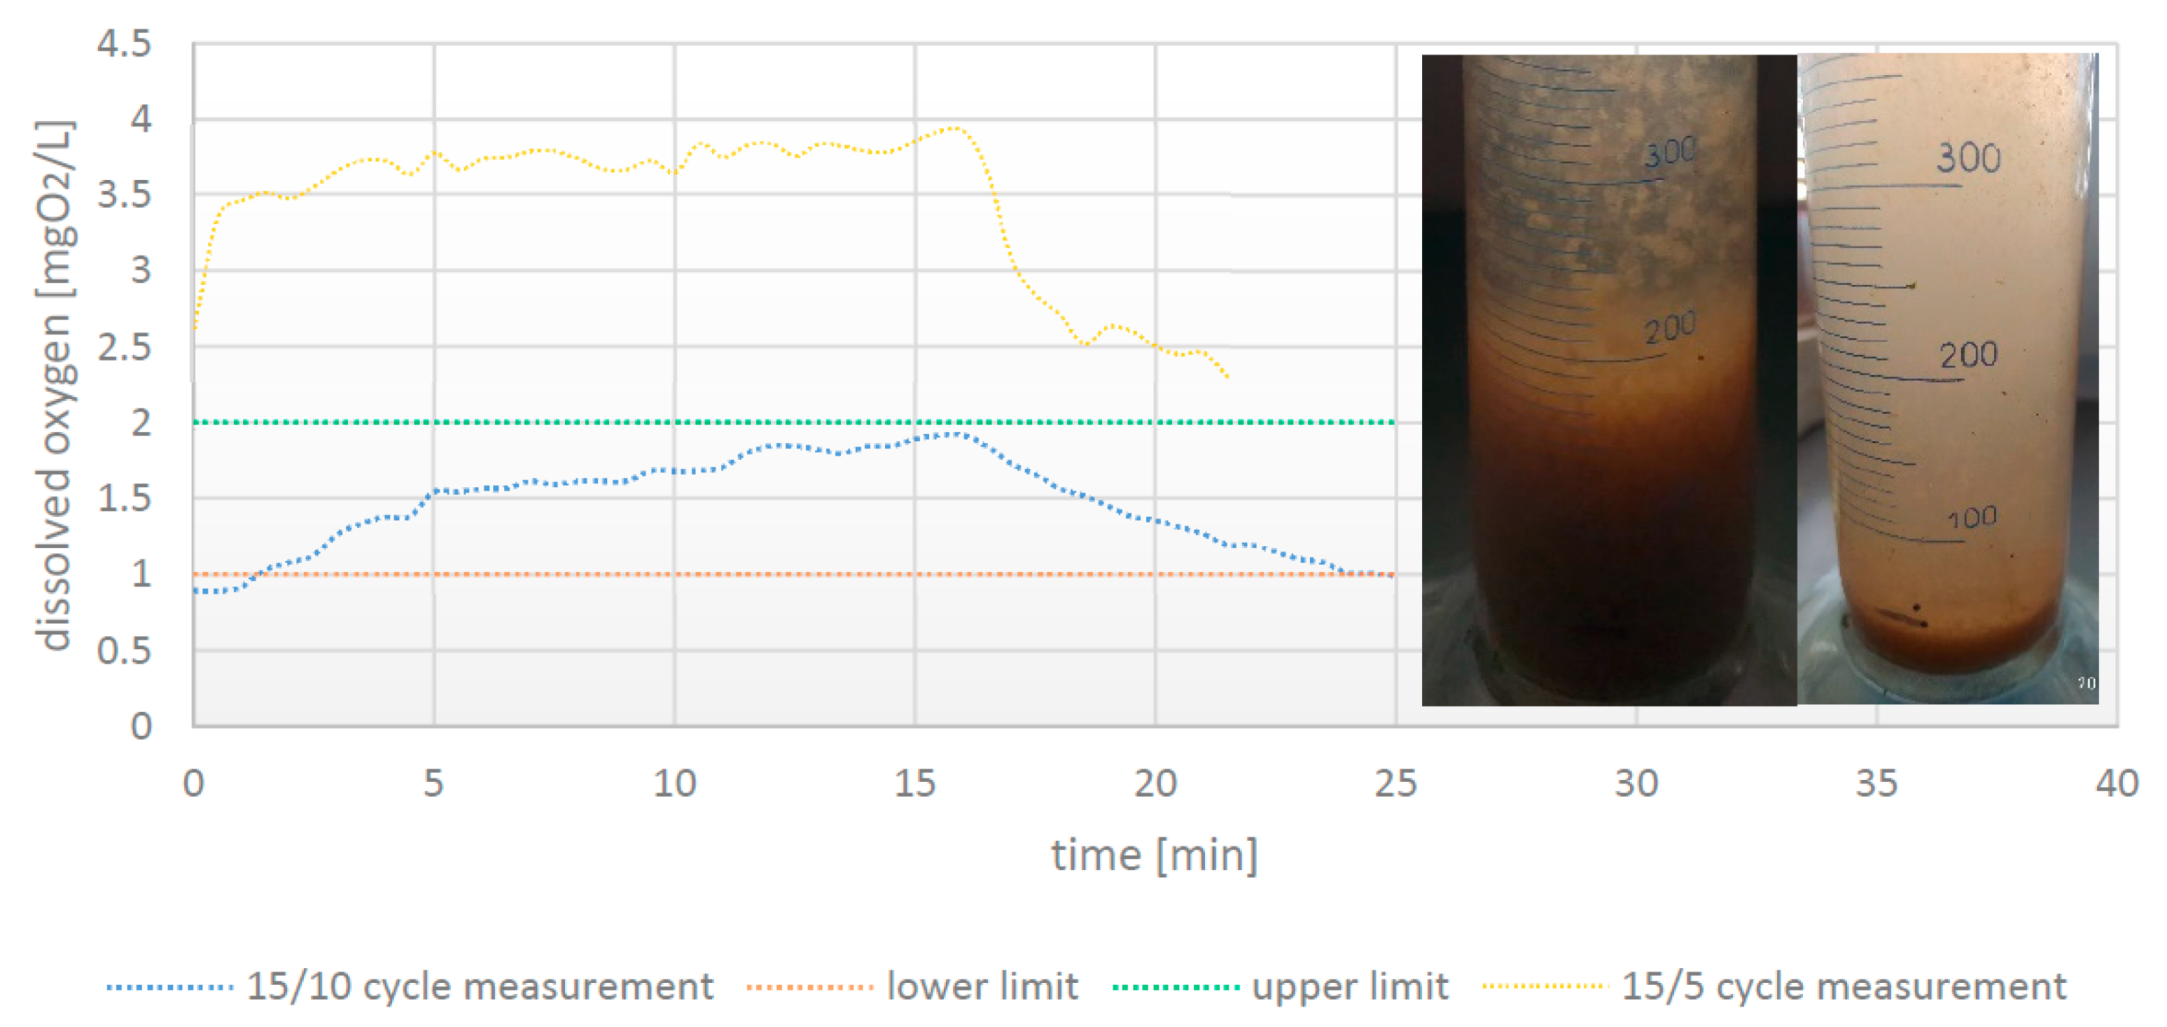
2.2.1. At-Site Dissolved Oxygen Measurement in Aeration Chamber

At-site measurements of the concentration of dissolved oxygen in the aeration chamber (readings every 30 s) were done several times. Readings reflected different settings of the controller that allowed the blower operation time to be adjusted between 1 and 15 min and the rest time in the same range. Such a controller was part of the treatment plant kit, but the supplier did not provide guidelines to what extent aeration and rest should be set. In the initial stage of on-site wastewater system operation, the plant was fully aerated for a month. Then the controller settings were changed to 15/15 min of aeration and rest. Oxygen content readings taken during this period showed a concentration well below 1 mg/L and a slow build-up to expected concentration after the start of aeration. Therefore, a decision was made to shorten the rest time. In this study, the course of dissolved oxygen in the aeration chamber in two different variants of aeration/resting time in the cycle: 15/10 and 15/5 min, is shown. A minimum 7-day stabilization period was maintained between the measurement and the change of controller settings. Measurements were made with a Senso Direct Oxi200 oxygen meter with temperature compensation. The temperature and pH of the wastewater in the activated sludge chamber during the measurement of 15/10 amounted to 20.0–20.4 °C and 6.57, and during the measurement of 15/5 amounted to 15.9–16.1 °C and 6.78, respectively.

2.2.2. Activated Sludge—Physical Parameters

Samples of activated sludge were always taken from the same place, from the aerated zone of the activated sludge chamber, and transported so, that there was an air layer above the sludge [18,22]. Freshly sampled activated sludge was settled for 30 min for volume (Vo) estimation in a 1 L cylinder. Dry matter (DM) content of sludge was measured by vacuum filtration in a Buchner funnel and calculated from the formula [18]:
D M = ( a b ) × 1000 V  
where: DM—dry matter of activated sludge (g/L); a—mass of the filter with sludge (g); b—the mass of the filter (g); V—sample volume used for filtration (mL). Sludge index (SI) was calculated using the following formula [18]:
S I = V o D M  
where: SI—sludge index (mL/g); Vo—volume of sludge (mL/L); DM—dry matter of activated sludge (g/L).

2.2.3. Activated Sludge—Respiratory Activity

In three sampling periods, oxygen concentration has been measured in sludge sample with 30 s intervals, and oxygen consumption rate (OCR) and unit oxygen consumption rate (UOCR) were calculated from the formula [18]:
O C R = D O 1 D O 2 t
where: OCR—oxygen consumption rate (mgO2/L/min); DO1—initial dissolved oxygen reading (mg/L); DO2—final dissolved oxygen reading (mg/L); t—time between initial and final reading (min); and
U O C R = O C R × 60 D M  
where: UOCR—unit oxygen consumption rate (mgO2/g d.m./h); OCR—oxygen consumption rate (mgO2/L/min); 60—converter (min/h); DM—dry matter of activated sludge (g/L).
Measurements were made with a Senso Direct Oxi200 oxygen meter with temperature compensation. The temperature of activated sludge ranged between 15.4 and 16.1 °C and the pH was 7.04.

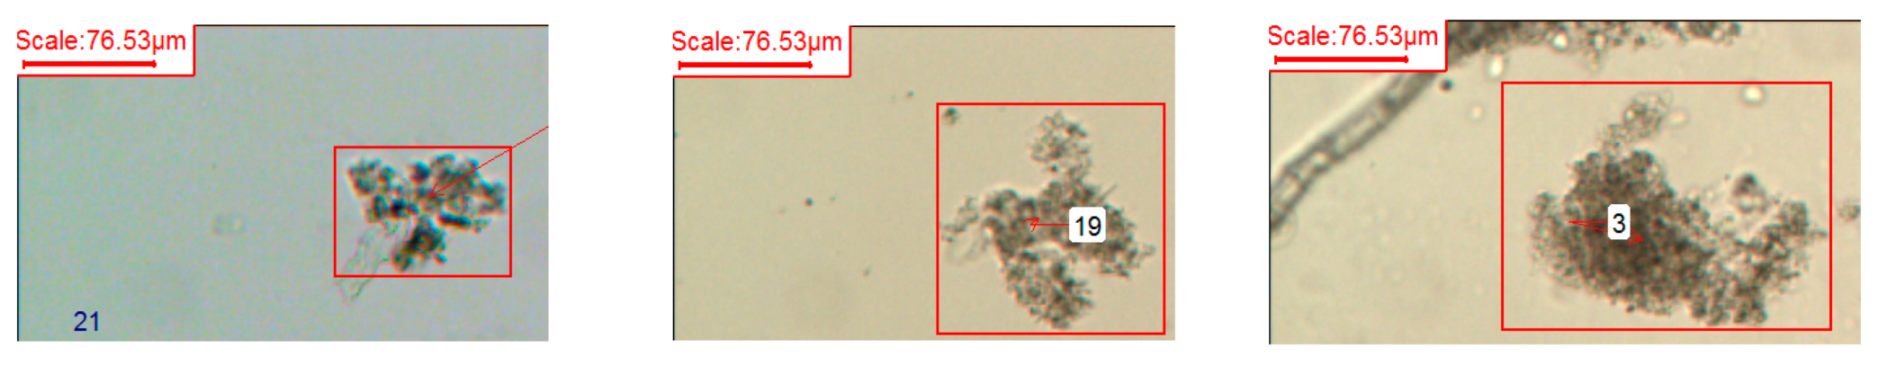
2.2.4. Microscopic Analysis of Activated Sludge

Microscopic analyses were performed to assess the sludge biotic index (SBI; Table 4) [11,23] and flocks’ morphology [24]. For SBI, sludge was analyzed under the microscope at 200- and 400-times magnification, in five replications. The SBI method assumes that the dominance of key groups and their number, as well as the number of indicator taxa of the activated sludge microfauna, change depending on the physicochemical and technological parameters and the effects of the treatment process. The term “key” or “functional” groups denote groups of protozoa distinguished on the basis of the way they move and the role they play in the biocenosis of activated sludge. Key groups are free-swimming ciliates, crawling ciliates, sessile ciliates, testate amoebae, small heterotrophic flagellates, sessile ciliates of the genus Opercularia spp., and sessile ciliates of the species Vorticella microstoma. When calculating the SBI of the sludge, individual species of ciliates are taken as individual taxa, but flagellates, rotifers, nematodes, tardigrades, gastropods, and oligochaetes are taken without distinguishing into species [11]. Flocks were assessed based on their morphology with a focus on shape, structure, strength, and size [22,23]. Microscopic analyses were performed on an optical system for image analysis, which includes the optical microscope OPTA-TECH with the camera OPTA-TECH and the OptaView software.
Statistical analyses covering correlations between characteristics of sludge and effluent quality were performed in Statistica v.13.3. For those analyses, 11 of 17 results of SBI were used, all obtained under the same compressor operating conditions (aeration/brake: 15/10 min). The remaining 6 SBI analyses were carried out during the operation phase when the aeration in the chamber was too intense (aeration/brake: 15/5 min) and a low sludge volume and no visible flocks during the sedimentation test were observed (see Figure 2).

3. Results and Discussion

3.1. Quality of Effluent

The efficiency of wastewater treatment in the tested on-site treatment plant is variable. Reliability factor (RF) and technological purity index (TPI) calculated for BOD5 and TS in relation to limit values (Table 3: effluent discharged to water) are set in Table 5. Over 60% of samples had TS values below 20 mg/L which is confirmed by low RF value. A high value of TPI proves that the exceedance of the limit values did not occur frequently in the case of TS (less than 8% of samples). RF for BOD5, however, is very close to 1.0, which reflects the mean BOD5 of effluent at the maximum limit value. Low TPI reflects the frequent exceedance of BOD5 in the effluent. Over 37% of samples exceeded the maximum limit of 40 mg/L. For other analyzed parameters (EC, pH, color), RF and TPI could not be calculated, because limits for these indexes in effluent have not been set. In the monitoring period, EC of effluent ranged between 519 and 1609 µS/cm, with the most frequent values in the range of 719–919 µS/cm; pH 6.42–8.94, with the most frequent values in the range of 7.28–7.71; and color from 0 (not detected) to exceed the range of the method 500 PtCo, with the most frequent values between 0 and 280 PtCo units.

3.2. Dissolved Oxygen Content in Aeration Chamber

Figure 2 shows the course of dissolved oxygen in the aeration chamber in two different variants of aeration/resting time in the cycle: 15/10 and 15/5 min. It can be seen that the 15/10 min cycle provides optimal oxygen conditions in the activated sludge chamber. Shortening the time without aeration to 5 min resulted in higher dissolved oxygen content (concentrations between 2.5 and 4 mg/L) and at the same time had a negative effect on the structure of the sludge, which can be seen on the photo in Figure 2. This sludge state is not a result of higher oxygen concentration [24] but too intense turbulence in the chamber.
Measurements of oxygen concentration in the aeration chamber in wastewater treatment plants with activated sludge should be a permanent element of their monitoring. The design of the treatment plant must enable the maintenance of the oxygen content in the activated sludge chamber at the level of 1–2 mg/L to ensure the growth of desired microorganisms [18]. Too low levels of oxygen can contribute to the growth of filamentous bacteria, which causes the sludge to swell. Higher concentrations generally do not harm the activated sludge; however, too intensive aeration causes excessive turbulence in the chamber and can break up the sludge flocks, which also leads to unsatisfactory sedimentation of the sludge in the settling tank and the production of a poorly clear effluent [18,22]. Oxygen concentrations above 3 mg/L do not contribute to better treatment results, but significantly increase operating costs related to energy consumption [18]. Annual energy use in the analyzed on-site plant was estimated on the assumption of 15/15 cycle [4] for the value of 262.8 kWh/yr (2.8 kWh per m3 of treated wastewater), followed with unit annual cost of EUR 24.77 per 1 kg of the removed load of BOD5 and EUR 9.66 per 1 m3 of treated wastewater [4]. Energy consumption in low-loaded activated sludge plants was lower than reported for sequencing batch reactors (SBR; 365 kWh/yr) [25], the moving bed bioreactor (MBBR, 147 kWh/ca.year), or membrane bioreactors (MBR) which use up to 345 kWh/ca.year [26]. For the aeration/rest cycles of 15/10 and 15/5 min, energy use will be higher due to longer blower operation and can be estimated at 315 and 395 kWh/yr. Depending on the number of people served, energy use per capita can be therefore higher than reported for SBR, MBBR, and MBR plants.

3.3. Respiratory Activity

Disturbances in the respiratory activity of activated sludge are often not associated with changes in the oxygen concentration in the activated sludge chambers [27]. Healthy sludge consumes oxygen quickly, poisoned sludge absorbs oxygen poorly, killed sludge does not take up oxygen at all. If the sludge is dead, the oxygen concentration is high because it is not consumed. The respiratory activity control can complement oxygen measurements in the aeration chamber by providing information on the oxygen uptake rate. Oxygen consumption rate (OCR) value is different for each treatment plant and depends on such factors, such as the amount of biomass, BOD load, sludge age, and health condition. Unit oxygen consumption rate (UOCR) is the respiration rate for 1 g of the dry weight of the sludge and is a value comparable to other measurements [18]. As each treatment plant has its own “normal” UOCR value, this index is often used for the assessment of the health status of the sludge. The values obtained for the tested plant varied between 11 and 17 mgO2/g d.m./h and correspond to the “normal” respiration rate of the sludge. Values below 8 and above 20 mgO2/g d.m./h indicate too high or too short sludge age or too low and too high organic load, respectively. The UOCR is also an indicator of the toxicity of the wastewater supplied to the treatment plant [18].

3.4. Physical Parameters of Sludge

The characteristic of activated sludge was performed for all taken samples, but only 11 samples were used for statistical analysis. The reason was that those 11 samples represent similar operation conditions of the treatment system. The compressor was set to 15 min of aeration and 10 min break, resulting in dissolved oxygen concentration between 1 and 2 mg/L (Figure 2). For the rest samplings, aeration conditions were different (15 min aeration & 5 min brake), which resulted in sludge fragmentation (Figure 2). Characteristics of activated sludge are presented in Table 6. The volume of sludge was low, significantly below optimal values of 300–700 mL/L [19]. A similar situation was in the case of DM of sludge. Optimal values of dry matter of sludge are between 3 and 7 g/L [22]. Greater DM content values reflect higher pollutant loads to the treatment system, which means that the load of organic pollutants in the tested treatment plant is insufficient. Sludge index (SI) for normal activated sludge should be in a range of 80–150 mL/g [22]. Higher values are typical for swollen sludge which usually is a result of high filamentous bacteria content [18]. The lower the value of the sludge index, the more favorable its sedimentation properties are. Well-settling activated sludge should have SI within the range of 50–150 mL/g [18]. The optimal values were exceeded in three out of eleven analyzed samples.

3.5. Microscopic Analysis

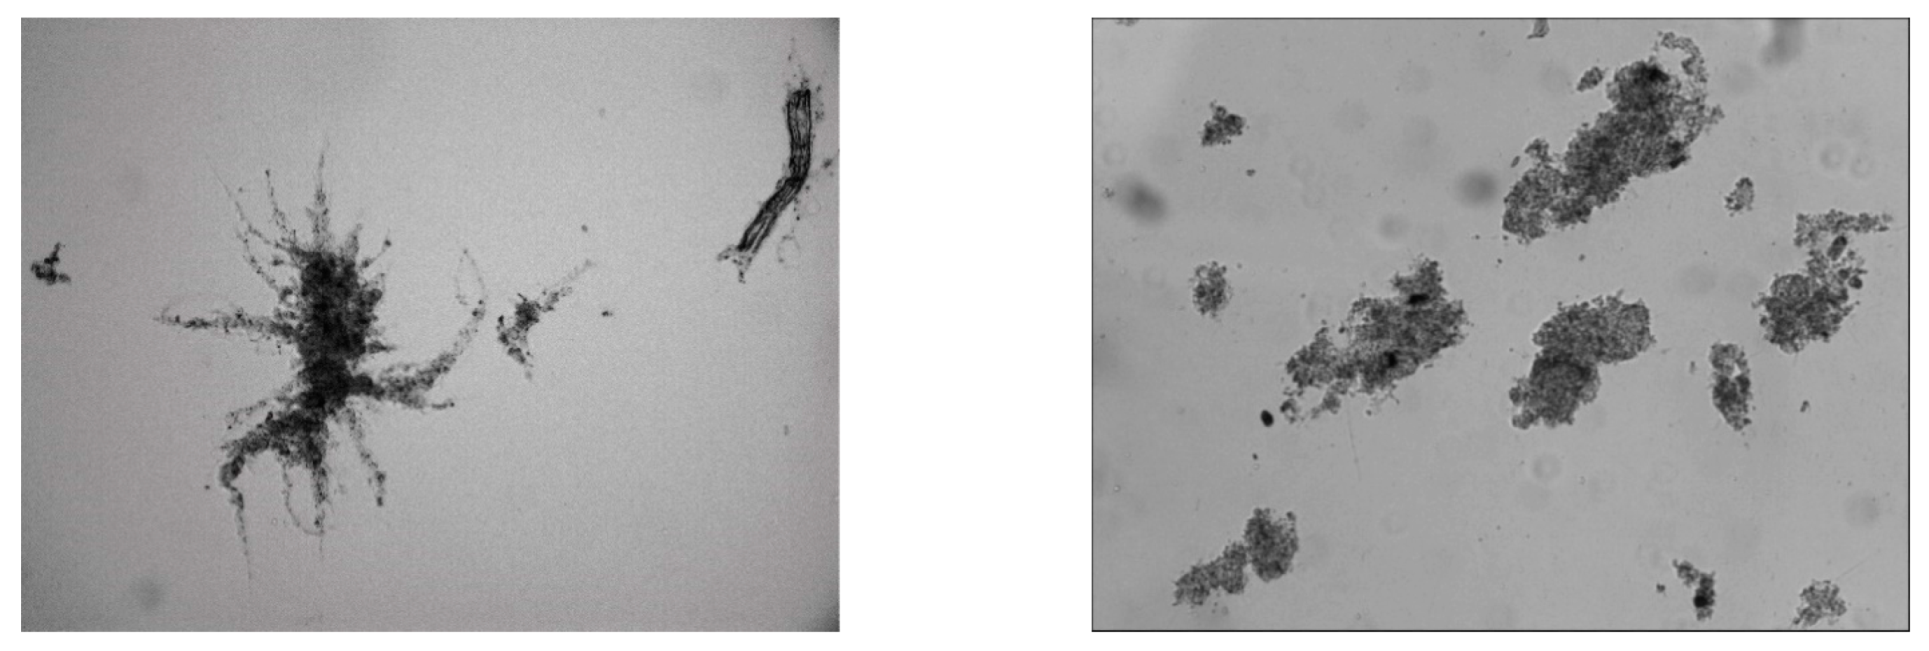
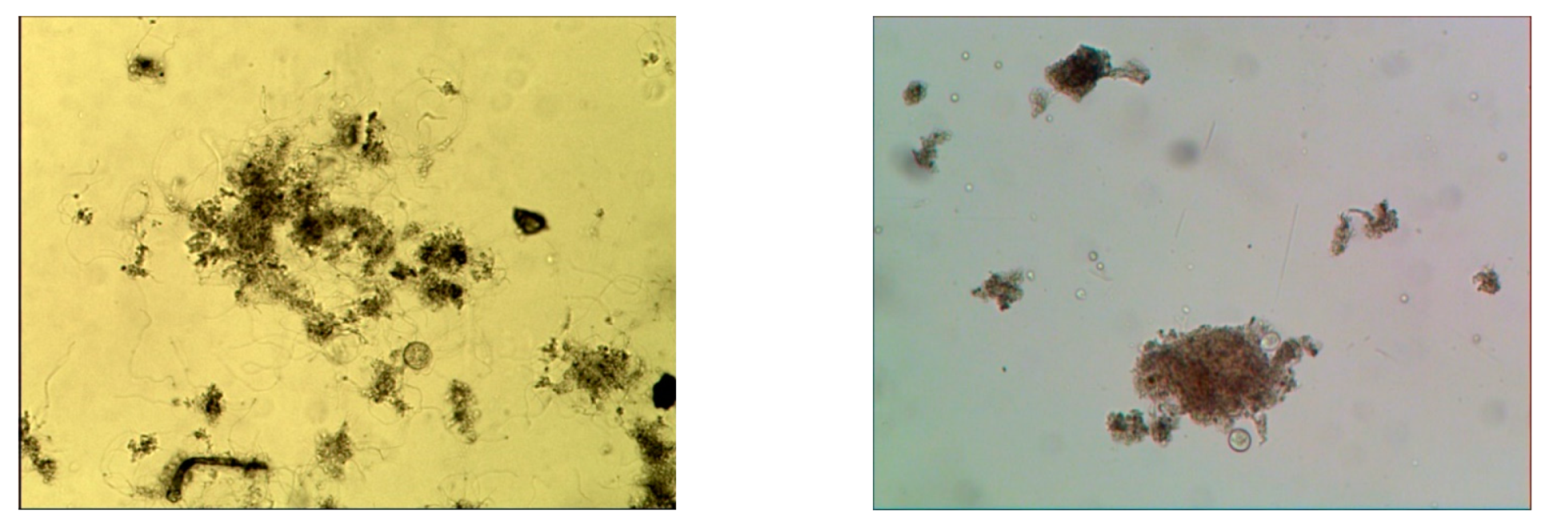
3.5.1. Flocks Morphology

Flocks of activated sludge are characterized by shape, structure, strength, and size [23]. The shape of the flock can vary from more or less round to irregular. The most commonly occurring flock shape is round. If the flocks are irregularly shaped, their settling velocity is reduced. The shape of the flocks is a feature that may indicate some unfavorable phenomena in the sludge. For example, a star-shaped, feathery, or reticular shape is usually associated with the presence of filamentous microorganisms (mainly bacteria and fungi), the presence of which is undesirable, as they cause the sludge to swell. The structure of the flocks can be open (water can flow through the flock particles) or compacted. In conditions of hypoxia or lack of food, the flocks take the form of compact, covered with gray formations. The presence of such flocks in the sediment causes a decrease in its activity. There are many different factors that make the flock loose. These include the development of thread-like forms, excess, or deficiency of oxygen, overload of the sludge, or starvation conditions. Flocks settle faster if they are more compact. Based on the strength, firm, and weak flocks can be distinguished. Weak flocks can be easily damaged. The flock size of the sludge is considerably variable. There are three flock size classes: small, with a diameter < 25 µm, medium 25–250 µm; and large > 250 µm [23]. Small flocks occur with high aeration, vigorous agitation, and high sludge loading [18]. A large proportion of small flocks (>25%) may cause their presence in the sewage treatment plant effluent [23]. It is recommended to keep flocks of medium size [18].
In most terms, flocks of activated sludge from the tested on-site plant had a rounded shape, but also irregular flocks were observed in three terms (Figure 3, Table 7). The irregular shape of the flock corresponds to the dates in which optimal values of the sludge index were exceeded (SI = 228, 281, and 305 mL/g). Flock structure in most cases was open (Figure 4, Table 7), but an also more compacted structure was observed in four terms. Open flocks settle slower than compacted ones [23]. The flock structure can be influenced by the presence of filamentous bacteria. If their dominance occurs and they are located both centrally and outside the flock, sludge flotation may occur. Such sludge often has a high sludge index. The ideal activated sludge flock is created by balanced microorganisms and centrally arranged filamentous bacteria. The absence of filamentous bacteria means that the flocks are small and weak with dispersed particles. In such a case, usually, the SI is low [18]. Most of the flocks from the tested on-site plant were of medium size, with only a few exceptions when large flocks formed the sludge (Figure 5, Table 7).
The size of the flock is an important feature that influences treatment efficiency [24]. Two important processes depend on it: biosorption (absorption of pollutants) and sedimentation. Biosorption is the stage preceding biodegradation and depends on the size of the flock surface. The surface area is larger, the smaller the flock is. However, too small flocks, although they have a large sorption surface, settle badly in the secondary settling tank. This can lead to contamination of the receiver. On the other hand, when the flock is too large, it settles well but cleans the wastewater poorly. This is due to the fact that the bacteria located in the central part of a large flock have difficult access to oxygen and contaminants that are the food substrate. The flock must, therefore, show the proper state of fragmentation that ensures appropriate oxygen and nutritional conditions.

3.5.2. Indication of Microfauna

The second part of the microscopic analysis was focused on the indication of microfauna to assess sludge biotic index (SBI) [11]. The sludge biotic index (SBI) is a scale for showing the condition of activated sludge, considering the sensitivity of basic protozoan groups and the presence of other indicative microorganisms [14]. Protozoa are commonly found in the mixed liquor of activated sludge plants. It has been estimated that the protozoa biomass can reach values of 250 mg/L (dry weight), constituting over 9% of the volatile solids [28]. Organisms included in the SBI method are small swimming flagellates, ciliates, testate amoebae, rotifers, and nematodes. Although a large number of organisms can be observed in the activated sludge process, some forms, such as naked amoebae and drifting organisms (algae, crustaceans, insects), are not considered in the SBI method [11]. Results of microscopic analysis of tested activated sludge are set in Table 7. After dominating key groups, density, and the number of taxonomic units of the microfauna were identified, and a two-way table for determination of the SBI given by Madoni [11] was used. After the estimation of the SBI value, the class of activated sludge was assigned base on Table 4.
Considering the effect of wastewater treatment, positive groups of microfauna are crawling and sessile ciliates and testate amoebae. Negative groups are small flagellates, swimming ciliates, and sessile ciliates, such as Vorticella microstoma and Opercularia spp. The above-mentioned are recognized indicators of problems in activated sludge. A large number of small flagellates, the dominance of free-swimming bacterivorous ciliates, sessile ciliates with a narrow peristome (Vorticella microstoma or Opercularia spp.), significantly reduce the value of the sludge biotic index [11]. Due to the existence of a rich environment of sessile and free-swimming ciliates, and possibly rotifers, it can be concluded that there is a sufficient oxygen amount in the activated sludge and that the activated sludge is not poisoned with harmful substances. Activated sludge poor in microorganisms or a clear predominance of only one type of microorganisms (e.g., only flagellates) indicate sludge damage [22]. The change in the biocenosis and the dominance of a certain group of organisms in developed activated sludge is the result of a change of organic load and sludge age [29].

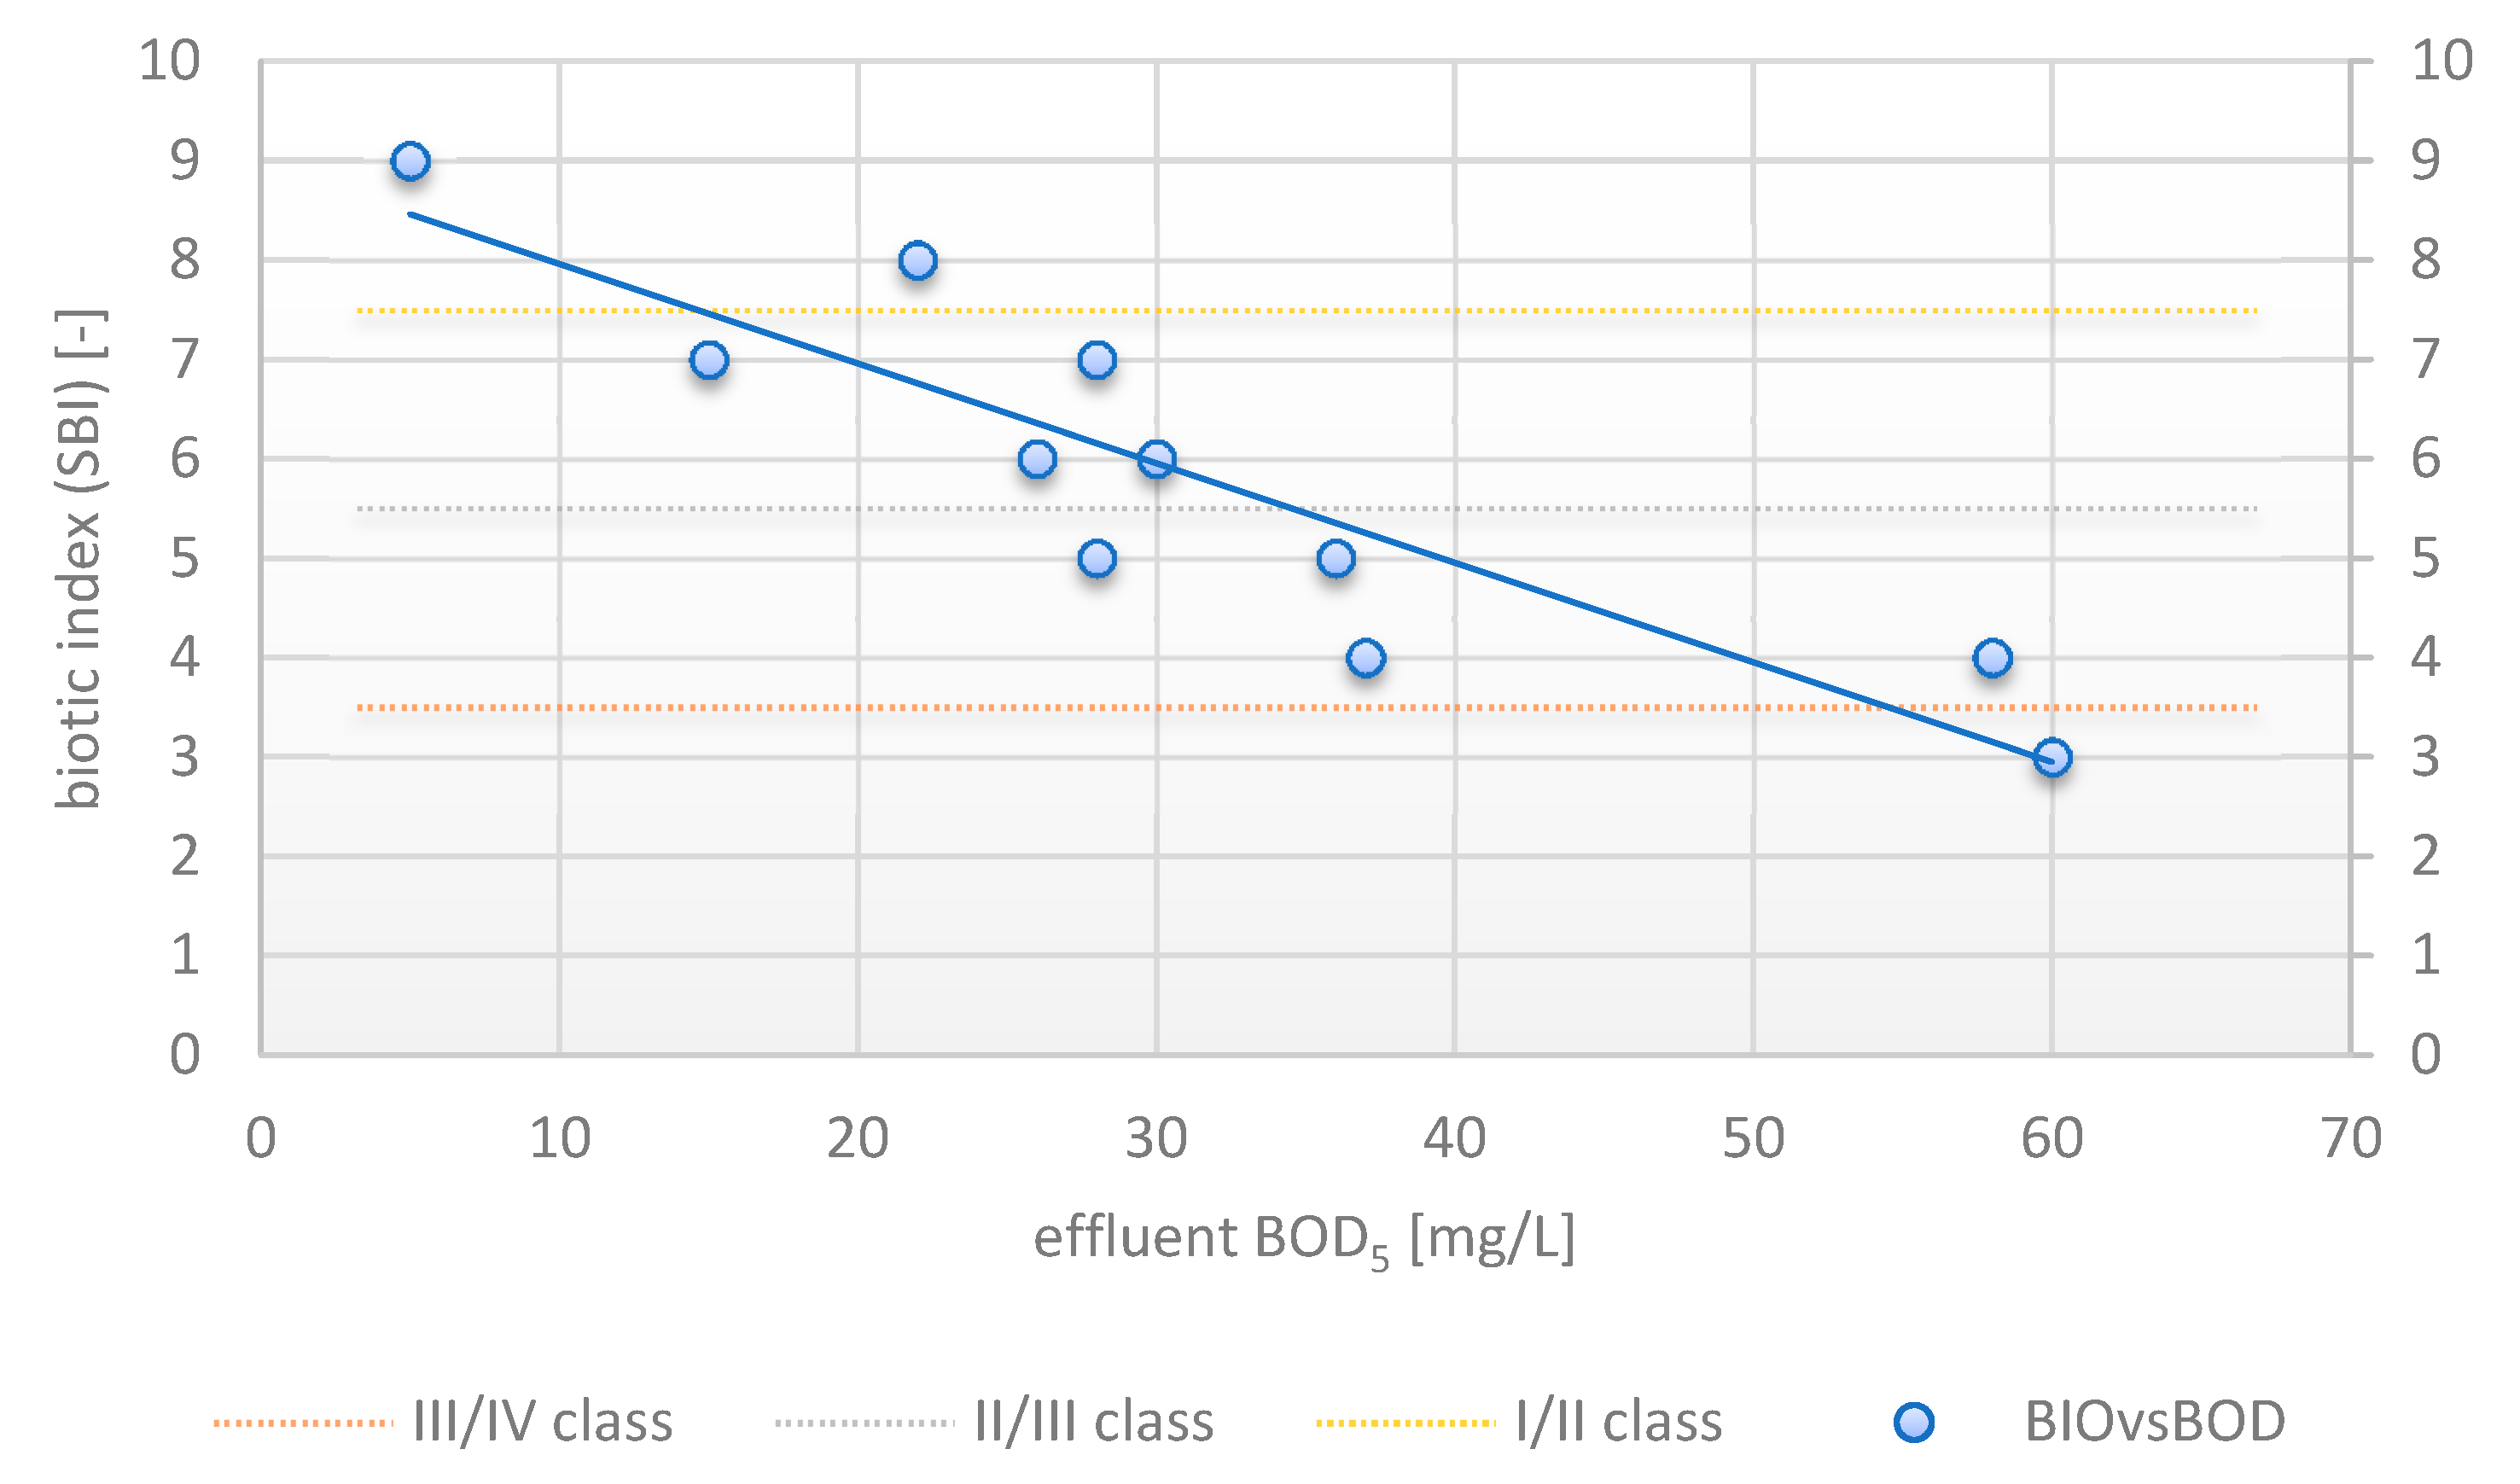
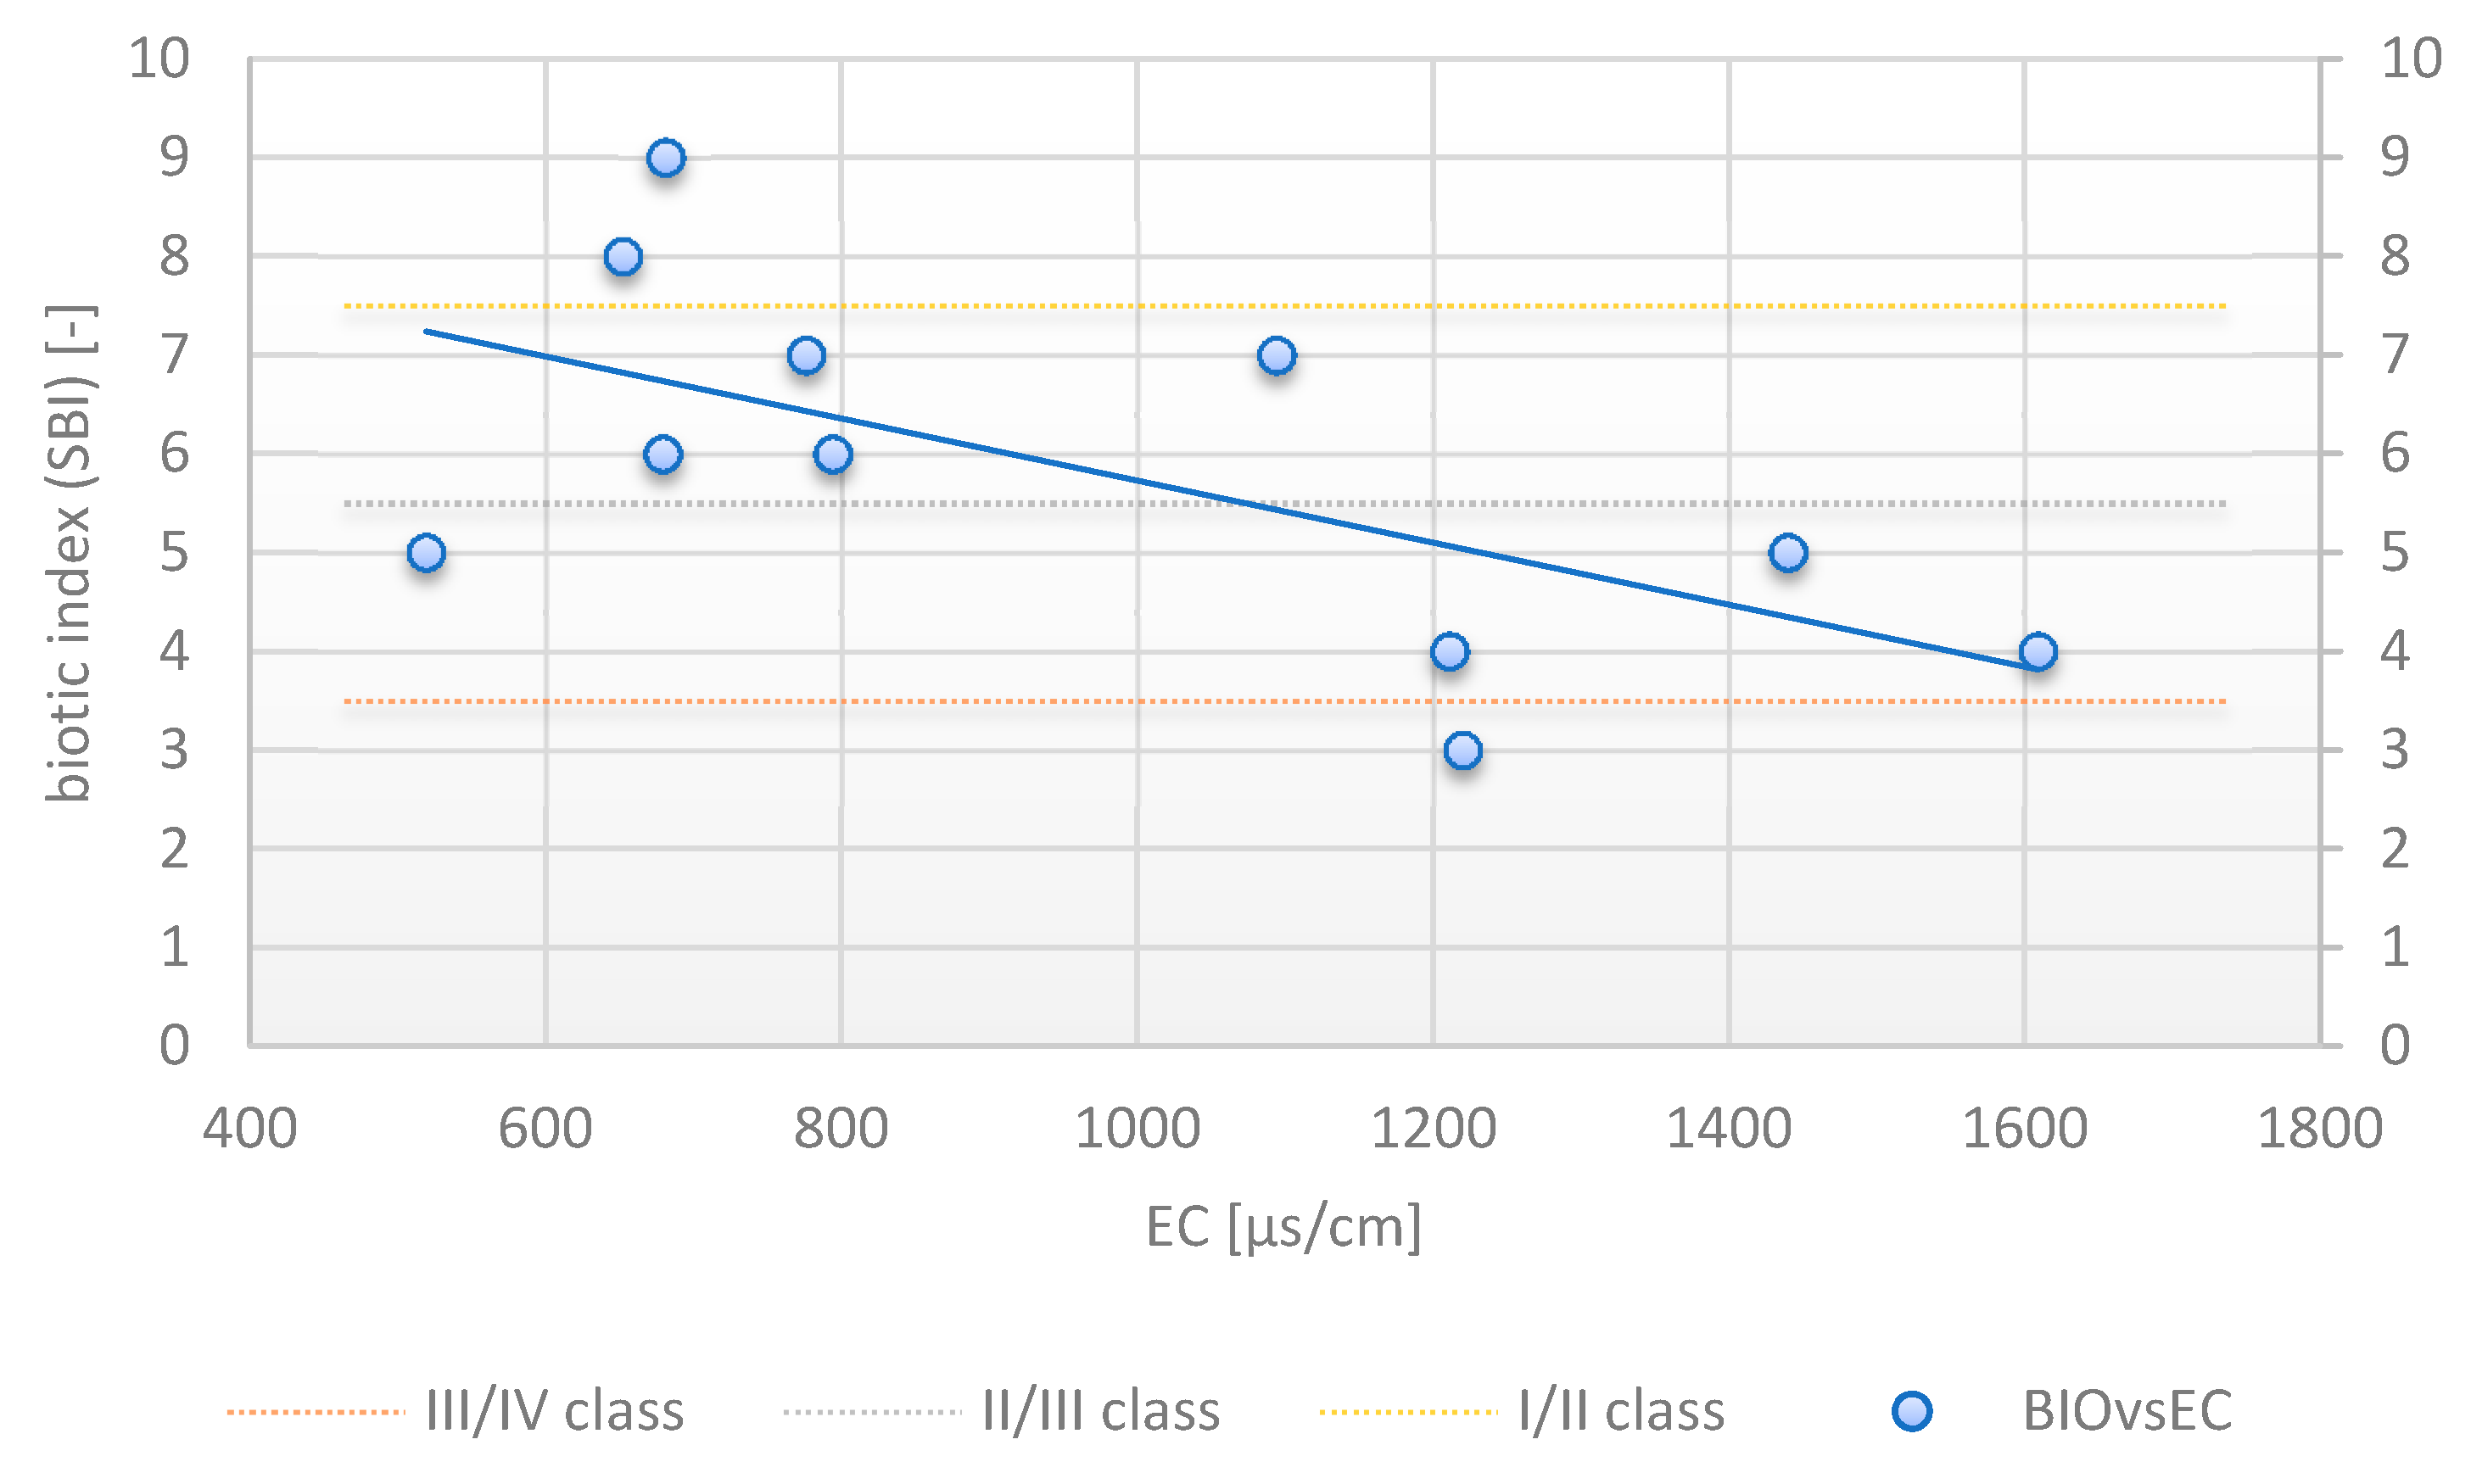
3.6. Correlation between SBI and Effluent Quality

Following the data presented in Table 6, the activated sludge (biocenosis and morphology) in the studied treatment plant underwent some changes. They may be in part a natural phenomenon, as in the course of the process of wastewater treatment with activated sludge, a characteristic biocenosis succession can be observed [30]. However, in part, they could also be the result of attempts to control the treatment process due to the unsatisfactory quality of the effluent. Sludge quality testing is a very useful tool in optimizing the operation of a treatment plant because the knowledge of the indicative significance of microorganisms makes it possible to find out the reasons for the low efficiency of the system, e.g., there is an inverse relationship between the number of flagellates and ciliates in activated sludge. While a large number of flagellates indicates that the sludge is overloaded, the presence of ciliates indicates that the activated sludge works properly [30]. Crawling and sessile ciliates and/or testate amoebae were dominating groups in 7 from 11 sludge samples (Table 7). The terms of those analyses correspond to good treatment efficiency, confirmed by RF of 0.57 and 0.30 and TPI of 0.88 and 0.75 for BOD5 and TS, respectively. From the analyzed 11 samples of sludge, 4 were located in the III SBI class, 5 in the II class, and 2 in the I class of activated sludge quality. Based on Table 4, it can be concluded that the sludge quality varied, giving from poor to very high wastewater treatment effect. Statistical analysis of SBI values and effluent quality indicators proved that there is a negative significant (p < 0.05) correlation between BOD5 (Table 8, Figure 6). This correlation is true for activated sludge working under the longer rest time, and an oxygen level in the aeration chamber between 1–2 mg/L. A negative significant correlation (p < 0.05) has been also found between SBI and EC (Table 8, Figure 7). This is a very promising relationship because the EC index is very easy to analyze and EC meters are cheap and available to all users. One could therefore indirectly infer the quality of the sludge without access to a laboratory. However, in order to recognize it as a practical effect of these studies, this relationship requires confirmation on different operation conditions and/or other objects of this type. In the examined case, the optimal EC of the effluent was in the range of 600–800 µS/cm (Figure 7).

4. Conclusions

The aim of this study was to assess the efficiency of an on-site container wastewater treatment plant with a low-loaded activated sludge and to evaluate the relationship between the condition of activated sludge and selected parameters of effluent quality. The plant was tested in two different aeration/rest conditions. It was not reflected in the efficiency of wastewater treatment, however significantly influenced the physical state of activated sludge. In over 60% of 81 samples of effluent, the TS value was below 20 mg/L. The mean BOD5 of effluent was close to the maximum limit value of 40 mg/L with the values ranging from 5 to 92 mg/L. EC of effluent ranged between 519 and 1609 µS/cm, with the most frequent values in the range of 719–919 µS/cm. The relationship (CC = −0.927747, p < 0.05) between effluent BOD5 and SBI was found for activated sludge working under longer rest time (10 min), and an oxygen level in the aeration chamber between 1–2 mg/L. For the whole monitoring period, including changes to the aeration schedule, the correlation was also significant but lower (CC = −0.7347, p < 0.05). A negative significant correlation (CC = −0.747845, p < 0.05) has also been found between SBI and EC of effluent. Controlling the operation of the on-site treatment plant by the EC parameter would be promising, as an EC meter is achievable for any single user of an on-site treatment plant. In the examined treatment plant, the optimal EC was in the range of 600–800 µS/cm.
The efficiency of wastewater treatment in on-site plants should be subject to monitoring. The research carried out at the container treatment plant with a low-loaded activated sludge showed that the quality of the effluent significantly exceeds the limits specified in the certificates, and may have a negative impact on the quality of the environment. Container wastewater treatment plants should be additionally secured with a professional service because the optimization of the plant operation goes beyond the skills of the average user.

Author Contributions

Conceptualization, A.K.; methodology, A.K.; formal analysis, A.K.; investigation: on-site and laboratory tests of wastewater and physical sludge analysis, A.K.; microscopic analysis: W.K.; resources, A.K.; data curation, A.K.; writing—original draft preparation, A.K.; writing—review and editing, A.K. and W.K. All authors have read and agreed to the published version of the manuscript.

Funding

This research received no external funding.

Informed Consent Statement

Not applicable.

Data Availability Statement

All data are available from the corresponding author.

Acknowledgments

Laboratory equipment used in this study belongs to the Water Center of Warsaw University of Life Sciences.

Conflicts of Interest

The authors declare no conflict of interest.

References

  1. Surerus, V.; Giordano, G.; Teixeira, L.A.C. Activated Sludge Inhibition Capacity Index. Braz. J. Chem. Eng. 2014, 31, 385–392. [Google Scholar] [CrossRef]
  2. Holenda, B.; Domokos, E.; Rédey, Á.; Fazakas, J. Dissolved Oxygen Control of the Activated Sludge Wastewater Treatment Process Using Model Predictive Control. Comput. Chem. Eng. 2008, 32, 1270–1278. [Google Scholar] [CrossRef]
  3. European Standards. EN 12566-3 Small Wastewater Treatment Systems for up to 50 PT Packaged and/or Site Assembled Domestic Wastewater Treatment Plants. Available online: https://www.en-standard.eu/bs-en-12566-3-2016-small-wastewater-treatment-systems-for-up-to-50-pt-packaged-and-or-site-assembled-domestic-wastewater-treatment-plants/ (accessed on 28 December 2021).
  4. Karczmarczyk, A.; Bus, A.; Baryła, A. Assessment of the Efficiency, Environmental and Economic Effects of Compact Type On-Site Wastewater Treatment Plants—Results from Random Testing. Sustainability 2021, 13, 982. [Google Scholar] [CrossRef]
  5. Scott, W.C.; Breed, C.S.; Haddad, S.P.; Burket, S.R.; Saari, G.N.; Pearce, P.J.; Chambliss, C.K.; Brooks, B.W. Spatial and Temporal Influence of Onsite Wastewater Treatment Systems, Centralized Effluent Discharge, and Tides on Aquatic Hazards of Nutrients, Indicator Bacteria, and Pharmaceuticals in a Coastal Bayou. Sci. Total Environ. 2019, 650, 354–364. [Google Scholar] [CrossRef]
  6. Schneider, M.Y.; Furrer, V.; Sprenger, E.; Carbajal, J.P.; Villez, K.; Maurer, M. Benchmarking Soft Sensors for Remote Monitoring of On-Site Wastewater Treatment Plants. Environ. Sci. Technol. 2020, 54, 10840–10849. [Google Scholar] [CrossRef]
  7. Du, B.; Price, A.E.; Scott, W.C.; Kristofco, L.A.; Ramirez, A.J.; Chambliss, C.K.; Yelderman, J.C.; Brooks, B.W. Comparison of Contaminants of Emerging Concern Removal, Discharge, and Water Quality Hazards among Centralized and on-Site Wastewater Treatment System Effluents Receiving Common Wastewater Influent. Sci. Total Environ. 2014, 466–467, 976–984. [Google Scholar] [CrossRef]
  8. Gunady, M.; Shishkina, N.; Tan, H.; Rodriguez, C. A Review of On-Site Wastewater Treatment Systems in Western Australia from 1997 to 2011. J. Environ. Public Health 2015, 2015, 1–12. [Google Scholar] [CrossRef] [Green Version]
  9. Chatterjee, P.; Ghangrekar, M.M.; Rao, S. Low efficiency of sewage treatment plants due to unskilled operations in India. Environ. Chem. Lett. 2016, 14, 407–416. [Google Scholar] [CrossRef]
  10. Naughton, O.; Hynds, P.D. Public awareness, behaviours and attitudes towards domestic wastewater treatment systems in the Republic of Ireland. J. Hydrol. 2014, 518, 108–119. [Google Scholar] [CrossRef]
  11. Madoni, P. A Sludge Biotic Index (SBI) for the Evaluation of the Biological Performance of Activated Sludge Plants Based on the Microfauna Analysis. Water Res. 1994, 28, 67–75. [Google Scholar] [CrossRef]
  12. de Celis, M.; Belda, I.; Ortiz-Álvarez, R.; Arregui, L.; Marquina, D.; Serrano, S.; Santos, A. Tuning up Microbiome Analysis to Monitor WWTPs’ Biological Reactors Functioning. Sci. Rep. 2020, 10, 4079. [Google Scholar] [CrossRef]
  13. Ostoich, M.; Serena, F.; Zacchello, C.; Falletti, L.; Zambon, M.; Tomiato, L. Discharge Quality from Municipal Wastewater Treatment Plants and the Sludge Biotic Index for Activated Sludge: Integrative Assessment. Water Pract. Technol. 2017, 12, 857–870. [Google Scholar] [CrossRef]
  14. Sowinska, A.; Pawlak, M.; Mazurkiewicz, J.; Pacholska, M. Comparison of the Results from Microscopic Tests Concerning the Quality of Activated Sludge and Effluent. Water 2017, 9, 918. [Google Scholar] [CrossRef] [Green Version]
  15. Pedrazzani, R.; Menoni, L.; Nembrini, S.; Manili, L.; Bertanza, G. Suitability of Sludge Biotic Index (SBI), Sludge Index (SI) and Filamentous Bacteria Analysis for Assessing Activated Sludge Process Performance: The Case of Piggery Slaughterhouse Wastewater. J. Ind. Microbiol. Biotechnol. 2016, 43, 953–964. [Google Scholar] [CrossRef] [PubMed]
  16. Arévalo, J.; Moreno, B.; Pérez, J.; Gómez, M.A. Applicability of the Sludge Biotic Index (SBI) for MBR Activated Sludge Control. J. Hazard. Mater. 2009, 167, 784–789. [Google Scholar] [CrossRef] [PubMed]
  17. Drzewicki, A.; Kulikowska, D. Limitation of Sludge Biotic Index Application for Control of a Wastewater Treatment Plant Working with Shock Organic and Ammonium Loadings. Eur. J. Protistol. 2011, 47, 287–294. [Google Scholar] [CrossRef]
  18. Dymaczewski, Z. (Ed.) A Sewage Treatment Plant Operator’s Guide; PZITS Poznań: Poznań, Poland, 2011; ISBN 978-83-89696-38-X. (In Polish) [Google Scholar]
  19. VH TECH 2014. Work Regulations (for the Functioning of the Process) Biological Sewage Treatment Plant Type: VH4L-VH50L. Available online: http://www.ekohouse-oczyszczalnie.pl/przydomowe-oczyszczalnie-sciekow/typoszereg-vh4l-v12l.html (accessed on 30 December 2021).
  20. Regulation of The Minister of Maritime Economy and Inland Navigation of July 12, 2019 on Substances Particularly Harmful to the Aquatic Environment and Conditions to Be Met when Discharging Wastewater into Waters or Land, and also When Draining Rainwater or Meltwater to Waters or to Water Devices; Journal of Laws: Warsaw, Poland, 2019; Volume item 1311. (In Polish)
  21. Cupak, A.; Chmielowski, K.; Bugajski, P.; Dacewicz, E. Assessment of Efficiency of Rural Sewage Treatment Plant with Bioreactor. Acta Sci. Pol. Form. Circumiectus 2019, 18, 137–143. [Google Scholar] [CrossRef]
  22. Stier, E.; Fischer, M. A Handy Guide to the Operation of a Sewage Treatment Plant; Seidel-Przywecki: Poznań, Poland, 1998; ISBN 83-909960-0-6. [Google Scholar]
  23. Eikelboom, D.H. Process Control of Activated Sludge Plants by Microscopic Invastigation; IWA Publishing: London, UK, 2000. [Google Scholar]
  24. Wilén, B.-M.; Balmér, P. The Effect of Dissolved Oxygen Concentration on the Structure, Size and Size Distribution of Activated Sludge Flocs. Water Res. 1999, 33, 391–400. [Google Scholar] [CrossRef]
  25. Lehtoranta, S.; Vilpas, R.; Mattila, T.J. Comparison of carbon footprints and eutrophication impacts of rural on-site wastewater treatment plants in Finland. J. Clean. Prod. 2014, 65, 439–446. [Google Scholar] [CrossRef]
  26. Dubber, D.; Gill, L. Application of On-Site Wastewater Treatment in Ireland and Perspectives on Its Sustainability. Sustainability 2014, 6, 1623–1642. [Google Scholar] [CrossRef] [Green Version]
  27. Głodniok, M.; Zdebik, D. Biological control of industrial wastewater treatment using in-situ respirometric measuring of activated sludge. Inżynieria Sr. 2011, 142, 63–74. Available online: https://zbc.uz.zgora.pl/dlibra/publication/51738/edition/45497 (accessed on 30 December 2021). (In Polish).
  28. Madoni, P. Protozoa in Wastewater Treatment Processes: A Minireview. Ital. J. Zool. 2011, 78, 3–11. [Google Scholar] [CrossRef]
  29. Miksch, K. (Ed.) Wastewater Biotechnology; Wydawnictwo Politechniki Sląskiej: Gliwice, Poland, 2000; ISSN 0434-0825. (In Polish) [Google Scholar]
  30. Kołwzan, B.; Adamiak, W.; Grabas, K.; Pawełczyk, A. Fundamentals of Microbiology in Environmental Protection; Oficyna Wydawnicza Politechniki Wrocławskiej: Wrocław, Poland, 2006; ISBN 83-7085-992-5. (In Polish) [Google Scholar]
Figure 1. Testing protocol for on-site wastewater treatment plant (WWTP) used in this study.
Water 14 00489 g001
Figure 2. The course of dissolved oxygen concentration in activated sludge chamber in different aeration/resting cycles. Photos of sludge during sedimentation (left: 15/10 min cycle; right 15/5 min cycle).
Water 14 00489 g002
Figure 3. Microscopic image of flock shape (magnification 100×): rounded (left) and irregular (right).
Water 14 00489 g003
Figure 4. Microscopic image of flock structure (magnification 100×): open flocks (left) and compacted flocks (right).
Water 14 00489 g004
Figure 5. Microscopic image and the measurement of the size of the flock (magnification 100×).
Water 14 00489 g005
Figure 6. Correlation between BOD5 of the effluent and sludge biotic index in tested container on-site wastewater treatment plant. Horizontal lines mark the borders between classes of activated sludge. Each class reflects a different sludge quality (see Table 4).
Water 14 00489 g006
Figure 7. Correlation between EC of the effluent and sludge biotic index in tested container on-site wastewater treatment plant. Horizontal lines mark the borders between classes of activated sludge. Each class reflects different sludge quality (see Table 4).
Water 14 00489 g007
Table 1. Relationship between results of microscopic analysis and effluent quality [18].
MicrooganismsFlocksSludge CharacteristicTurbidityEffluent BOD5 (mg/L)
Group of ProtozoaGenus/SpeciesSize/Structure/ColorSedimentation Capacity
amoebaenaked--overloadedhigh>150
flagellatesBodosmall to medium, openlowoverloadedhigh>100
Mastigophorasmall to medium, openlowoverloadedhigh>75
floating ciliatesParameciumsmall to medium, light brownsufficient to goodslightly overloadedmoderately high20 ÷ 50
Uronema nigricanssmall to medium, light brownsufficientoverloadedmoderate40 ÷ 50
Tetrahymena pyriformissmall to medium, light brown to brownsufficient to pooroverloadedmoderate to low30 ÷ 60
Aspidisca costatamedium to large, brown to dark brownsufficient to goodslightly overloadedlow20 ÷ 40
attached ciliatesVorticellamedium to large, dark browngood to very goodvery good-10 ÷ 30
Operculariamedium to small, dark brownvery good to excellentvery good-5 ÷ 15
Epistylismedium to small, dark brownvery good to excellentvery good-5 ÷ 15
Suctoriasmall to medium, light brownexcellentunderloadedinsignificant2 ÷ 10
Table 2. Technical parameters of container on-site wastewater treatment plant with low-loaded activated sludge [19].
ParameterValueUnit
Population Equivalent (PE)Up to 4PE
Average daily flow (Q)0.54m3/d
Load of BOD5 (LBOD5)0.24kg/d
Diameter (D)1.00m
Height of the tank (H)1.50m
Height of the inlet (Vp)1.30m
Height of the outlet (Vo)1.15m
Table 3. Assumed and required effluent quality parameters.
Quality IndexAssumed by the Manufacturer [1]PL Regulation * [20]
Effluent Discharged to WaterEffluent Discharged to Soil
BOD5 (mg/L)540min. reduction of 20%
COD (mg/L)50150-
TS (mg/L)1550min. reduction of 50%
N (mg/L)-30 **-
P (mg/L)-5 **-
* applies to areas outside the designated boundaries of the agglomeration; ** values required only for wastewater discharged into lakes and their tributaries, and directly into artificial reservoirs located on rivers.
Table 4. Sludge biotic index (SBI) and its relation with treatment efficiency [11].
SBI ValueSBI ClassSludge Quality and Treatment Effect
0–3IVinsufficient biological treatment in aeration chambers, poor treatment effect
4–5IIIpoor biological purification in aeration chambers, poor treatment effect
6–7IIwell inhabited and stable, biological activity slightly reduced, good treatment effect
8–10Ivery well inhabited and stabilized, excellent biological activity, very high treatment effect
Table 5. Effluent quality characteristic, reliability factor (RF), and technological purity index (TPI) calculated for tested on-site wastewater treatment plant.
ParameterEffluent Quality Characteristic (mg/L)Reliability Indicators
NMEAN M I N ÷ M A X S D RFTPI
BOD54839.10 5 ÷ 92 22.44 0.980.61
TS 6318.35 0 ÷ 134 29.8 0.370.84
Table 6. Characteristic of tested activated sludge.
ParameterNMEAN M I N ÷ M A X S D Optimal Values
Vo (mL/L)11108.89 40 ÷ 200 56.67 300 ÷ 700
DM (g/L)110.93 0.39 ÷ 1.82 0.47 3 ÷ 7
SI (mL/g)11141.69 51.09 ÷ 304.66 99.78 50 ÷ 150
Table 7. Results of microscopic analyses of activated sludge.
Sample no.Dominating Key Groups
of Microfauna
SBI
Value/Class
Flock Morphology Shape/Structure/Strength/Size
1Swimming bacterivorous ciliates4/IIIrounded/open/weak/medium
2Swimming bacterivorous ciliates3/IIrounded/open/weak/medium
3Crawling + sessile ciliates and/or testate amoebae5/IIIirregular/compacted/firm/medium to small
4Crawling + sessile ciliates and/or testate amoebae6/IIirregular/compacted/firm/large
5Crawling + sessile ciliates and/or testate amoebae7/IIirregular/open/weak/medium to small
6Crawling + sessile ciliates and/or testate amoebae6/IIrounded/open/firm/large
7Swimming bacterivorous ciliates4/IIIrounded/compacted/weak/medium
8Crawling + sessile ciliates and/or testate amoebae9/Irounded/open/weak/medium to large
9Crawling + sessile ciliates and/or testate amoebae8/Irounded/open/weak/medium
10Crawling + sessile ciliates and/or testate amoebae7/IIrounded/compacted/firm/medium to large
11Opercularia spp.5/IIIrounded/open/weak/medium to large
Table 8. Correlation table.
BOD5 (mg/L)TS (mg/L)EC (µs/cm)Vo (mL/L)DM (g/L)SI (mL/g)SBI
BOD5 (mg/L)1.0000000.5784820.6885170.2712200.432850−0.035482−0.927747
TS (mg/L)0.5784821.0000000.520251−0.3596920.453229−0.646216−0.564339
EC (µs/cm)0.6885170.5202511.0000000.2586690.1588560.129761−0.747845
Vo (mL/L)0.271220−0.3596920.2586691.0000000.1761180.697091−0.302407
DM (g/L)0.4328500.4532290.1588560.1761181.000000−0.546505−0.158357
SI (mL/g)−0.035482−0.6462160.1297610.697091−0.5465051.000000−0.140440
SBI −0.927747−0.564339−0.747845−0.302407−0.158357−0.1404401.000000
N = 11; Correlation coefficients marked in red are significant with p < 0.05.
Publisher’s Note: MDPI stays neutral with regard to jurisdictional claims in published maps and institutional affiliations.

