Article

Streamflow Consumption vs. Climate Change in the Evolution of Discharge in the Tarim River Basin, Northwest China

1
State Key Laboratory of Desert and Oasis Ecology, Xinjiang Institute of Ecology and Geography, Chinese Academy of Sciences, Urumqi 830011, China
2
University of Chinese Academy of Sciences, Beijing 100049, China
3
Department of Civil and Architectural Engineering, University of Wyoming, Laramie, WY 82071, USA
4
School of Geographical Sciences, Nanjing University of Information Science & Technology, Nanjing 210044, China
*
Author to whom correspondence should be addressed.
Water 2022, 14(3), 392; https://doi.org/10.3390/w14030392
Submission received: 17 December 2021 / Revised: 19 January 2022 / Accepted: 25 January 2022 / Published: 27 January 2022

Abstract

:
Quantifying and separating the impacts of hydroclimatic change and human activities on streamflow consumption are crucial issues for the planning, management, and rational allocation of water resources in arid inland river basins. Generalized additive models were used to reveal the interactions between climate, land-use change, and streamflow consumption in the mainstream Tarim River basin in Northwest China. The results showed that streamflow has decreased, while streamflow consumption has had an increasing trend in the upper reaches and a decreasing trend in the middle and lower reaches during the past 45 years. Land-use change was estimated to contribute 50.1–84.30% (mean of 58.1%) of streamflow consumption, and it was followed by climatic change, which contributed 10.5–28.3% (mean of 21.5%), and inflow runoff, which contributed 11.8–23.6% (mean of 17.7%) from 1970–2015. Land-use change played a dominant role in streamflow consumption in the mainstream Tarim River basin. Cropland expansion and urban area growth were the primary factors causing the decreased streamflow and increased streamflow consumption in the upper reaches. The streamflow consumption in the middle and lower reaches decreased, which was attributed to the decreased inflow. The results are useful for informing policy-making accordingly so that the river can be properly restored, which will benefit the ecosystem services.

1. Introduction

Climate change and human activity are considered to be the two major drivers that alter the hydrological cycle processes and change the spatio-temporal distribution of water availability [1,2]. The interactions between climate, human activity, and hydrologic processes are crucial for better future sustainable water resource management and land-use planning [3].
Most studies have focused on identifying changes in runoff generation and concentration processes (flow routing time, peak flows, and volume) in response to changes in the climate and human activity [4,5,6,7]. However, for arid inland rivers, there is no runoff that originates after outlets in the mountains due to the arid climate and rare precipitation. The streamflow is almost entirely consumed in the oasis, and then disappears in the dry plains [8,9]. Streamflow consumption is a complex system dependent on natural conditions and human-induced effects [9,10,11,12,13]. Hu et al. (2021) quantified the contributions of climatic and human activity factors to runoff variation by the elasticity coefficients in the Amu Darya River Basin [10]. Gokool et al. (2019) established the contribution of riparian total evaporation to streamflow transmission losses along the Groot Letaba River [11]. Yan et al. (2013) analysed the nonlinear relationships between natural streamflow, precipitation, and air temperature in the Yellow River basin [12,13]. The main methods include hydrological modelling [14,15,16], statistical and analytical approaches [17,18,19], hydrological sensitivity methods [20,21], climate elasticity methods [22], Budyko hypotheses [23,24] and Tomer–Schilling frameworks [1,25]. Such studies are not available for the arid inland basin due to the existence of nonlinearity in the behaviour of streamflow consumption. However, generalized additive models can be used to directly process the nonlinear relationship between response variables and multiple explanatory variables [26]. Several more attempts to understand the changes in streamflow consumption and its response need to be made.
The Tarim River basin is one of the world’s largest inland basins and is located in the southern part of Xinjiang Autonomous Prefecture, China. During the past 40 years, land-use has changed dramatically [27], and streamflow has decreased [28], causing serious environmental problems [29], such as vegetation degradation, river dry-up, and land desertification. Therefore, a comprehensive control project has been implemented for the ecosystem protection and restoration of the Tarim River since 2000. The dike used to transport water was built to prevent overflowing during flood periods and increase the streamflow discharge to the downstream regions [30]. While the streamflow from the headwaters of the Tarim River has significantly increased [31,32], the streamflow along the mainstream of the river has exhibited a decreasing trend due to the increase in population and the expansion of irrigated agriculture [28,33]. The decreasing river flow has led to serious ecological problems such as water-soil quality deterioration, degradation of natural vegetation, and dust storms. The effects of positive and negative interventions from local human activities on hydrological processes remain poorly understood.
The objectives of this study are to (1) analyse the trends in temperature, precipitation, evaporation, streamflow, and streamflow consumption (difference in discharge between upstream and downstream hydrometric stations) from 1957 to 2015; (2) examine the spatio-temporal changes in land use for the period of 1970–2015; (3) propose generalized additive models to separate and determine the changes in climate and land-use effects on streamflow consumption changes and further quantify the contributions of various factors. This study is expected to improve the management of the Tarim River’s natural resources and the balance between agricultural and environmental assets.

2. Materials and Methodology
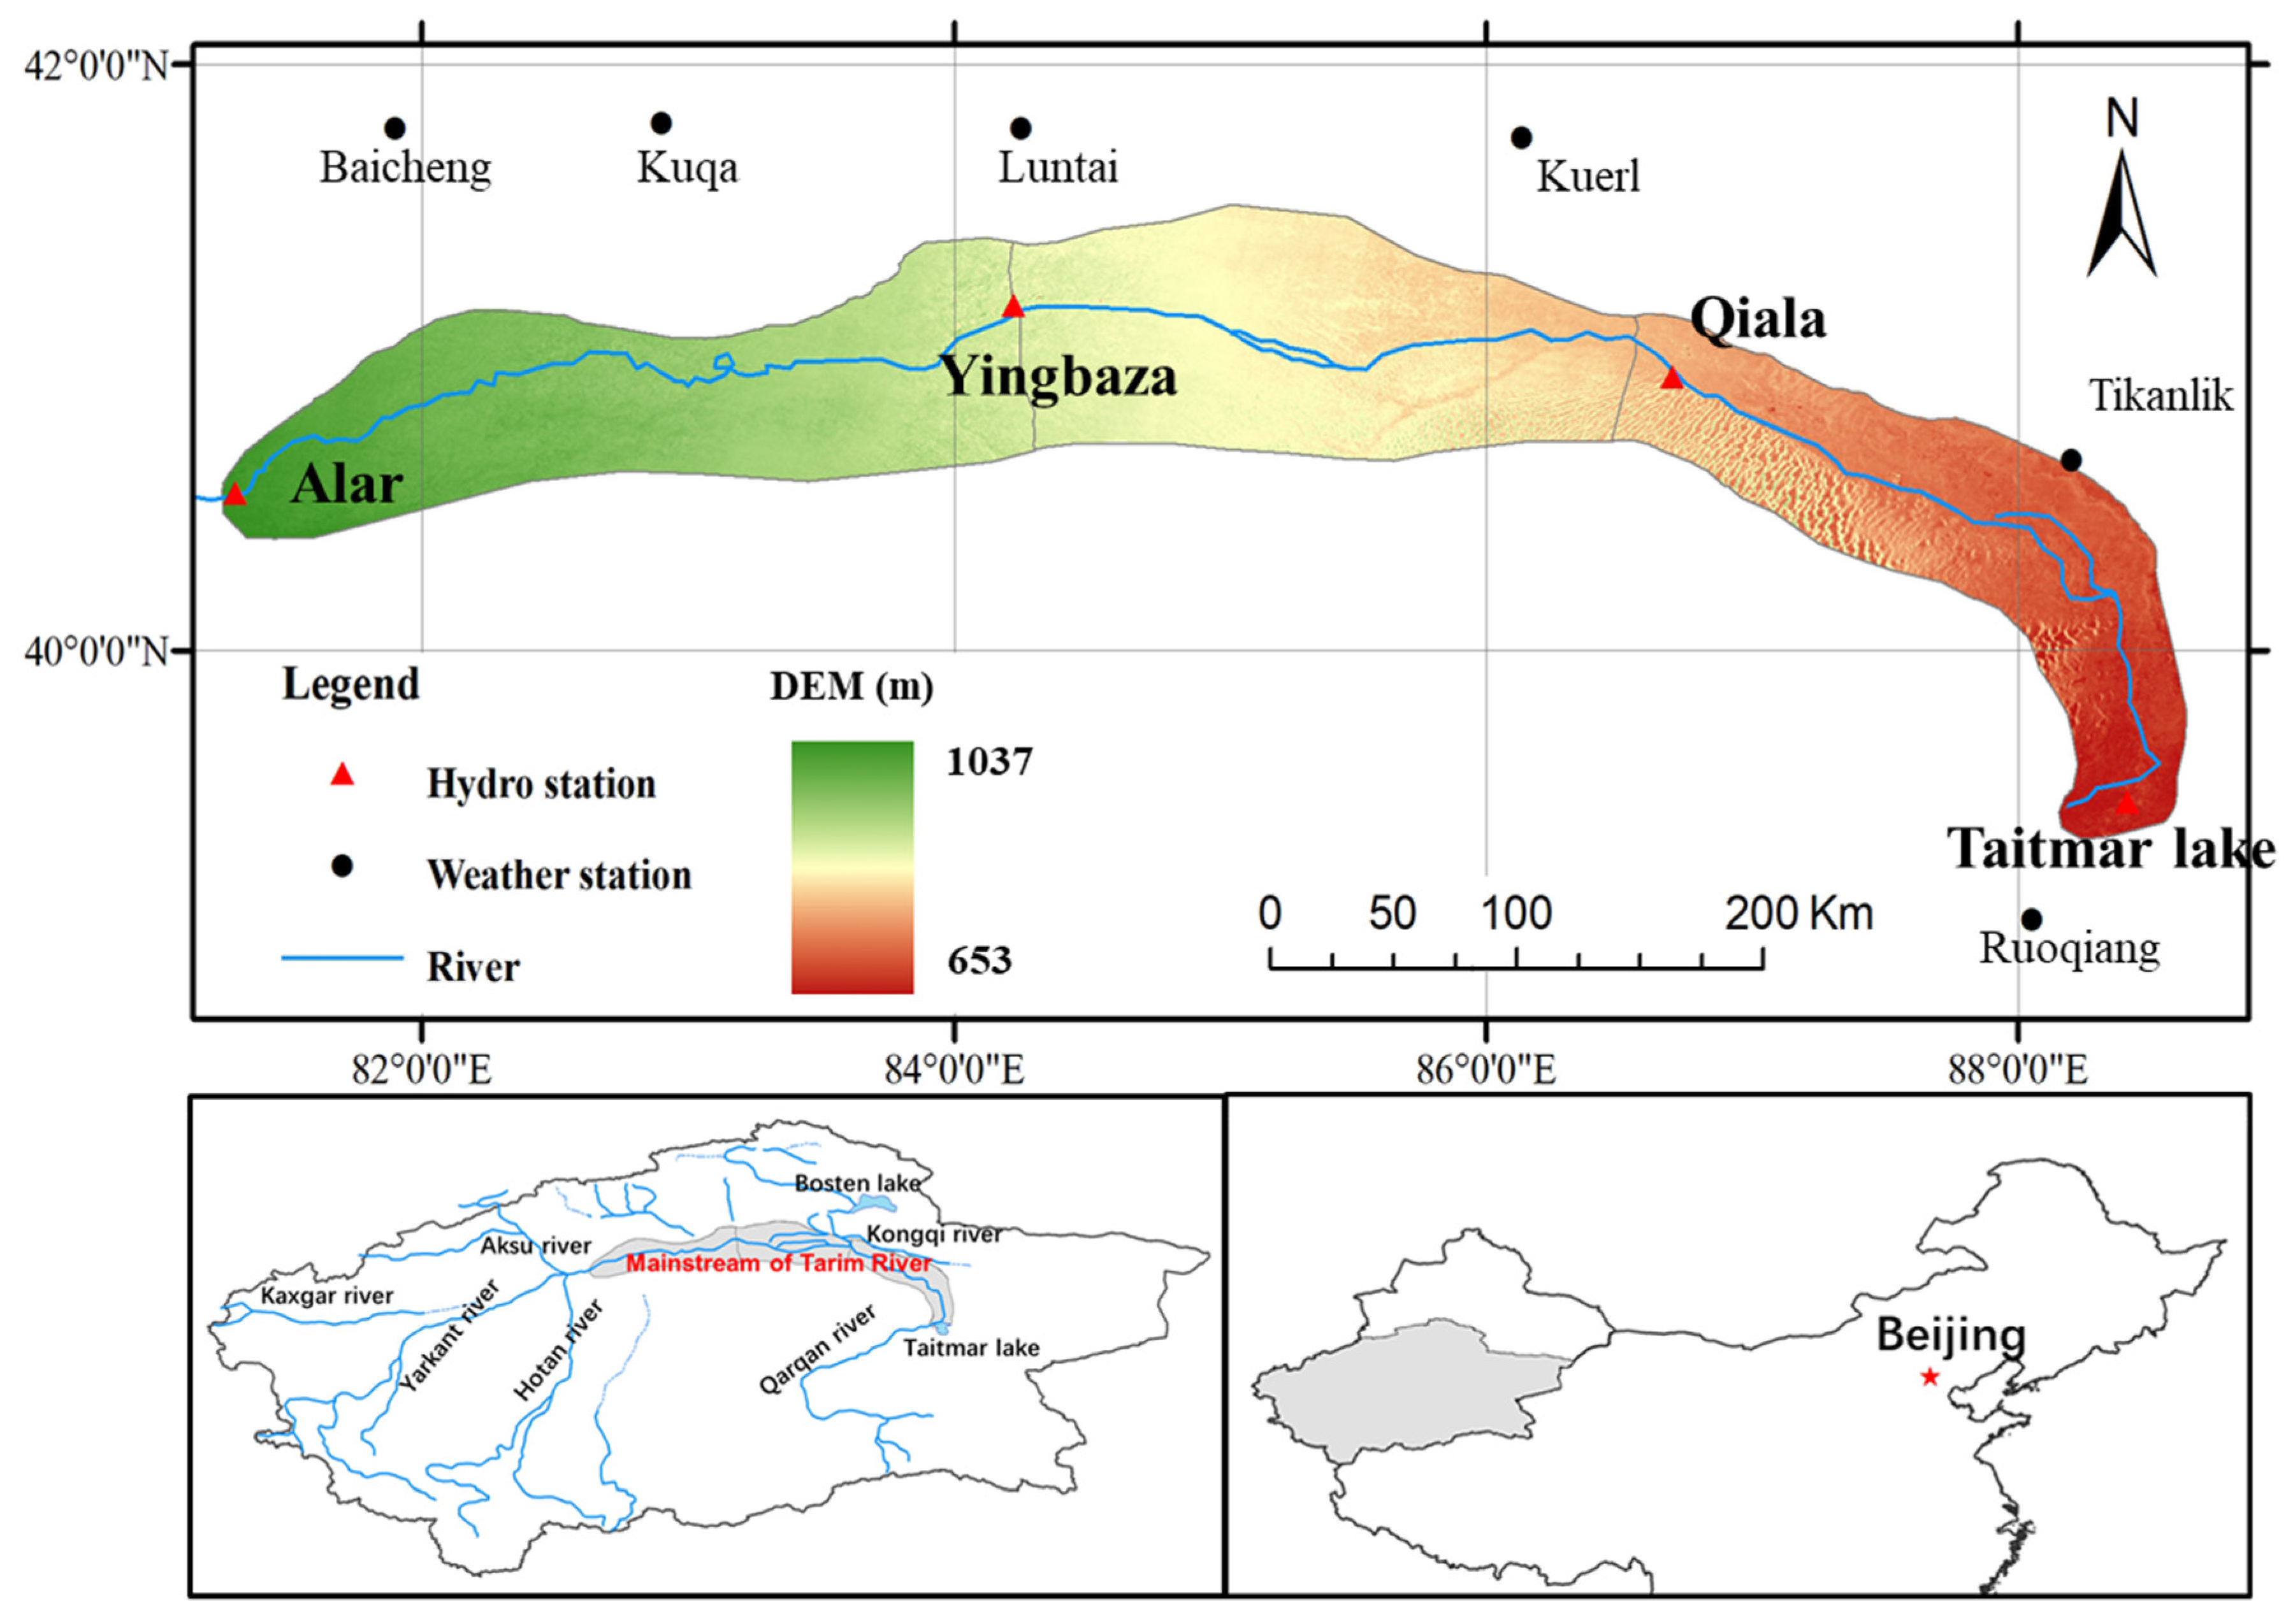
2.1. Study Area

The length of the Tarim River mainstream is 1321 km from Alar to Taitmar Lake. It is defined as the river course below the confluence of the Hotan, Yarkand, and Aksu Rivers, and the river basin covers an area of 4.31 × 10⁴ km2. The basin had an annual mean temperature of 10.97 °C, an annual average rainfall of 57.21 mm, and an annual pan evaporation of 2422 mm from 1959 to 2015. The river’s mainstream is divided into a 447-km upstream section from Alar to Yingbazha, a 398-km midstream section from Yingbaza to Qiala, and a 428-km downstream section from Qiala to Taitmar Lake (Figure 1). Soil and water resources are unevenly distributed among the upstream, midstream, and downstream reaches of the basin.
The annual average river inflow from the confluence is 4.543 × 10⁹ m3/yr, which has decreased under the influence of climate change and human activities. In the warm continental and extremely drought-prone desert climatic region, agriculture (rather than industry) is the dominant economic activity in the Tarim Basin. The crops given priority for irrigation, in descending order, are cotton, grain, forest, and orchard areas. More than half of the total irrigation area is planted with cotton. The water demands of crops range from 4000 m3/ha to 6000 m3/ha, with a much higher demand for rice at 13,500 m3/ha. However, the rice area covers only 0.5–1.0% of the total irrigation area. Other than crops, trees, shrubs, and woody plants are the main vegetation types distributed throughout the basin [33].

2.2. Data Sources

Hydrological data included the annual streamflow of 3 hydrological stations (Alar, Yingbaza, and Qiala) for the period from 1957–2015, and data were collected by the Tarim Watershed Management Bureau and the Aksu Hydrologic Bureau. The Alar (AL) gauge station measures the total runoff volume of the Tarim River that flows into the upper reaches, while the Yingbaza (YBZ) and Qiala (QL) gauge stations measure the runoff volume flowing into the middle and lower reaches, respectively. Furthermore, the difference between AL and YBZ (AL-YBZ) is the water volume that has been consumed by the upstream basin, and the difference between YBZ and QL (YBZ-QL) is the streamflow consumption of the midstream basin. After the downstream basin, little or no water flows into Taitmar Lake (without a gauge station), and the streamflow has mostly been consumed. Since 2000, a certain volume of water has been diverted (WD) from the Kongque River to the lower Tarim River by the Ku–Ta Channel. Therefore, QL+WD is the water consumption in the downstream basin. Climate data were provided by the National Climatic Center, China Meteorological Administration (http://data.cma.cn/ (accessed on 6 December 2021)). The annual temperature, precipitation, and evaporation from 20-cm pans data from 1957–2015 were obtained from seven observation stations along the mainstream Tarim River. The Alar, Baicheng, and Kuqa stations were selected to represent the conditions in the upstream area of the basin. The Luntai and Kuerl stations were selected to represent the conditions in the midstream area, and the Tikanlik and Ruoqiang stations were selected to represent the conditions in the downstream portion of the basin. The locations of all stations are shown in Figure 1.
Landsat TM remote sensing images from 1970, 1980, 1990, 2000, 2005, 2008, 2010, 2013, and 2015 were used as the basic data that were provided by the Resource and Environment Data Cloud platform (http://www.resdc.cn (accessed on 15 April 2021)). All satellite data were georeferenced using nearest-neighbour resampling to Krasovsky_1940_Albers coordinates system. After geometric correction and georeferencing, the average location errors in the images are less than 50 m [27]. The land-use and cover change (LUCC) dataset, with a spatial resolution of 30 m × 30 m, was combined with the results of an investigation carried out to classify the land-use coverage according to the National Land Use Classification system and identify the composition and change information of the landscape categories. Land use was classified into the following six categories: farmland, woodland, grassland, water area, residential land, and unused land. A linear interpolation method was developed to simulate the dynamics of land-use change [34].

2.3. Trend Analysis

The trends in streamflow and climate parameters were analysed using the following two methods: linear regression and the Mann–Kendall (MK) test [35]. Annual data for the period, from 1957–2015, for the gauge stations at AL, YBZ, and QL were analysed separately to assess the average annual streamflow and streamflow consumption. In the linear regression analysis, the slope of the regression line and the standard error of slope were estimated. The MK test was used to detect trends in the evolution of hydrometeorological series based on the statistical significance (p-values). The significance of trends was denoted by one star (*) when p < 0.05 and by two stars (**) when p < 0.01.

2.4. Quantifying the Impacts of Climate and Human Activity

Generalized additive models (GAMs) were used to examine the relationships among climate, human activity, and streamflow consumption depth over the period from 1970–2015. GAMs [36] allow nonlinear relationships to be specified in the form of a few link functions between the response and explanatory variables. The GAM was expressed as follows:
g ( μ ) = β 0 + i = 1 k f i ( x i )   ( μ = E [ Y x ] )
where g ( μ ) is the link function, β 0 is the constant (intercept), x i is the ith explanatory variable, f i ( x i ) is the smoothing function, and k is the total number of explanatory variables. The f i ( x i ) value is estimated to select the smoothing parameters using the penalized least square method (Equation (2)).
min { R S S + k = 1 p λ k × [ f k ( x ) ] 2 d x
where λ k is the smoothing parameter, and RSS is the residual sum of squares.
The GAM for quantifying the effects on streamflow consumption caused by changes in climate and land-use was established as follows:
F o r m u l a ( Streamflow   consumption ) ~ 1 k f i ( L a n d u s e i ) + f ( Q i n f l o w ) + 1 k f i ( C l i m a t i c   f a c t o r i )
Family = Gaussian   ( link = identify ,   anova ( test = T   and   F ) )
The contribution rate (CR) of climate change and human activities to streamflow consumption can be obtained by the proportion of the deviance explained by the GAM [37], as follows:
C R = 1 R D N D            
where ND is the deviance for a model with just a constant term, and RD is the deviance of the fitted model.
The GAM analysis was performed using S-PLUS 8.0 software. The fitting degree of the model after the factors were added was tested stepwise using the Akaike information criterion (AIC) [37], for which a smaller AIC value indicates a better model fit. The F test was employed to evaluate the significance of factors and their nonlinear CR to any nonparametric effect.

3. Results and Discussion

3.1. Trends of Hydrological and Climatic Variables

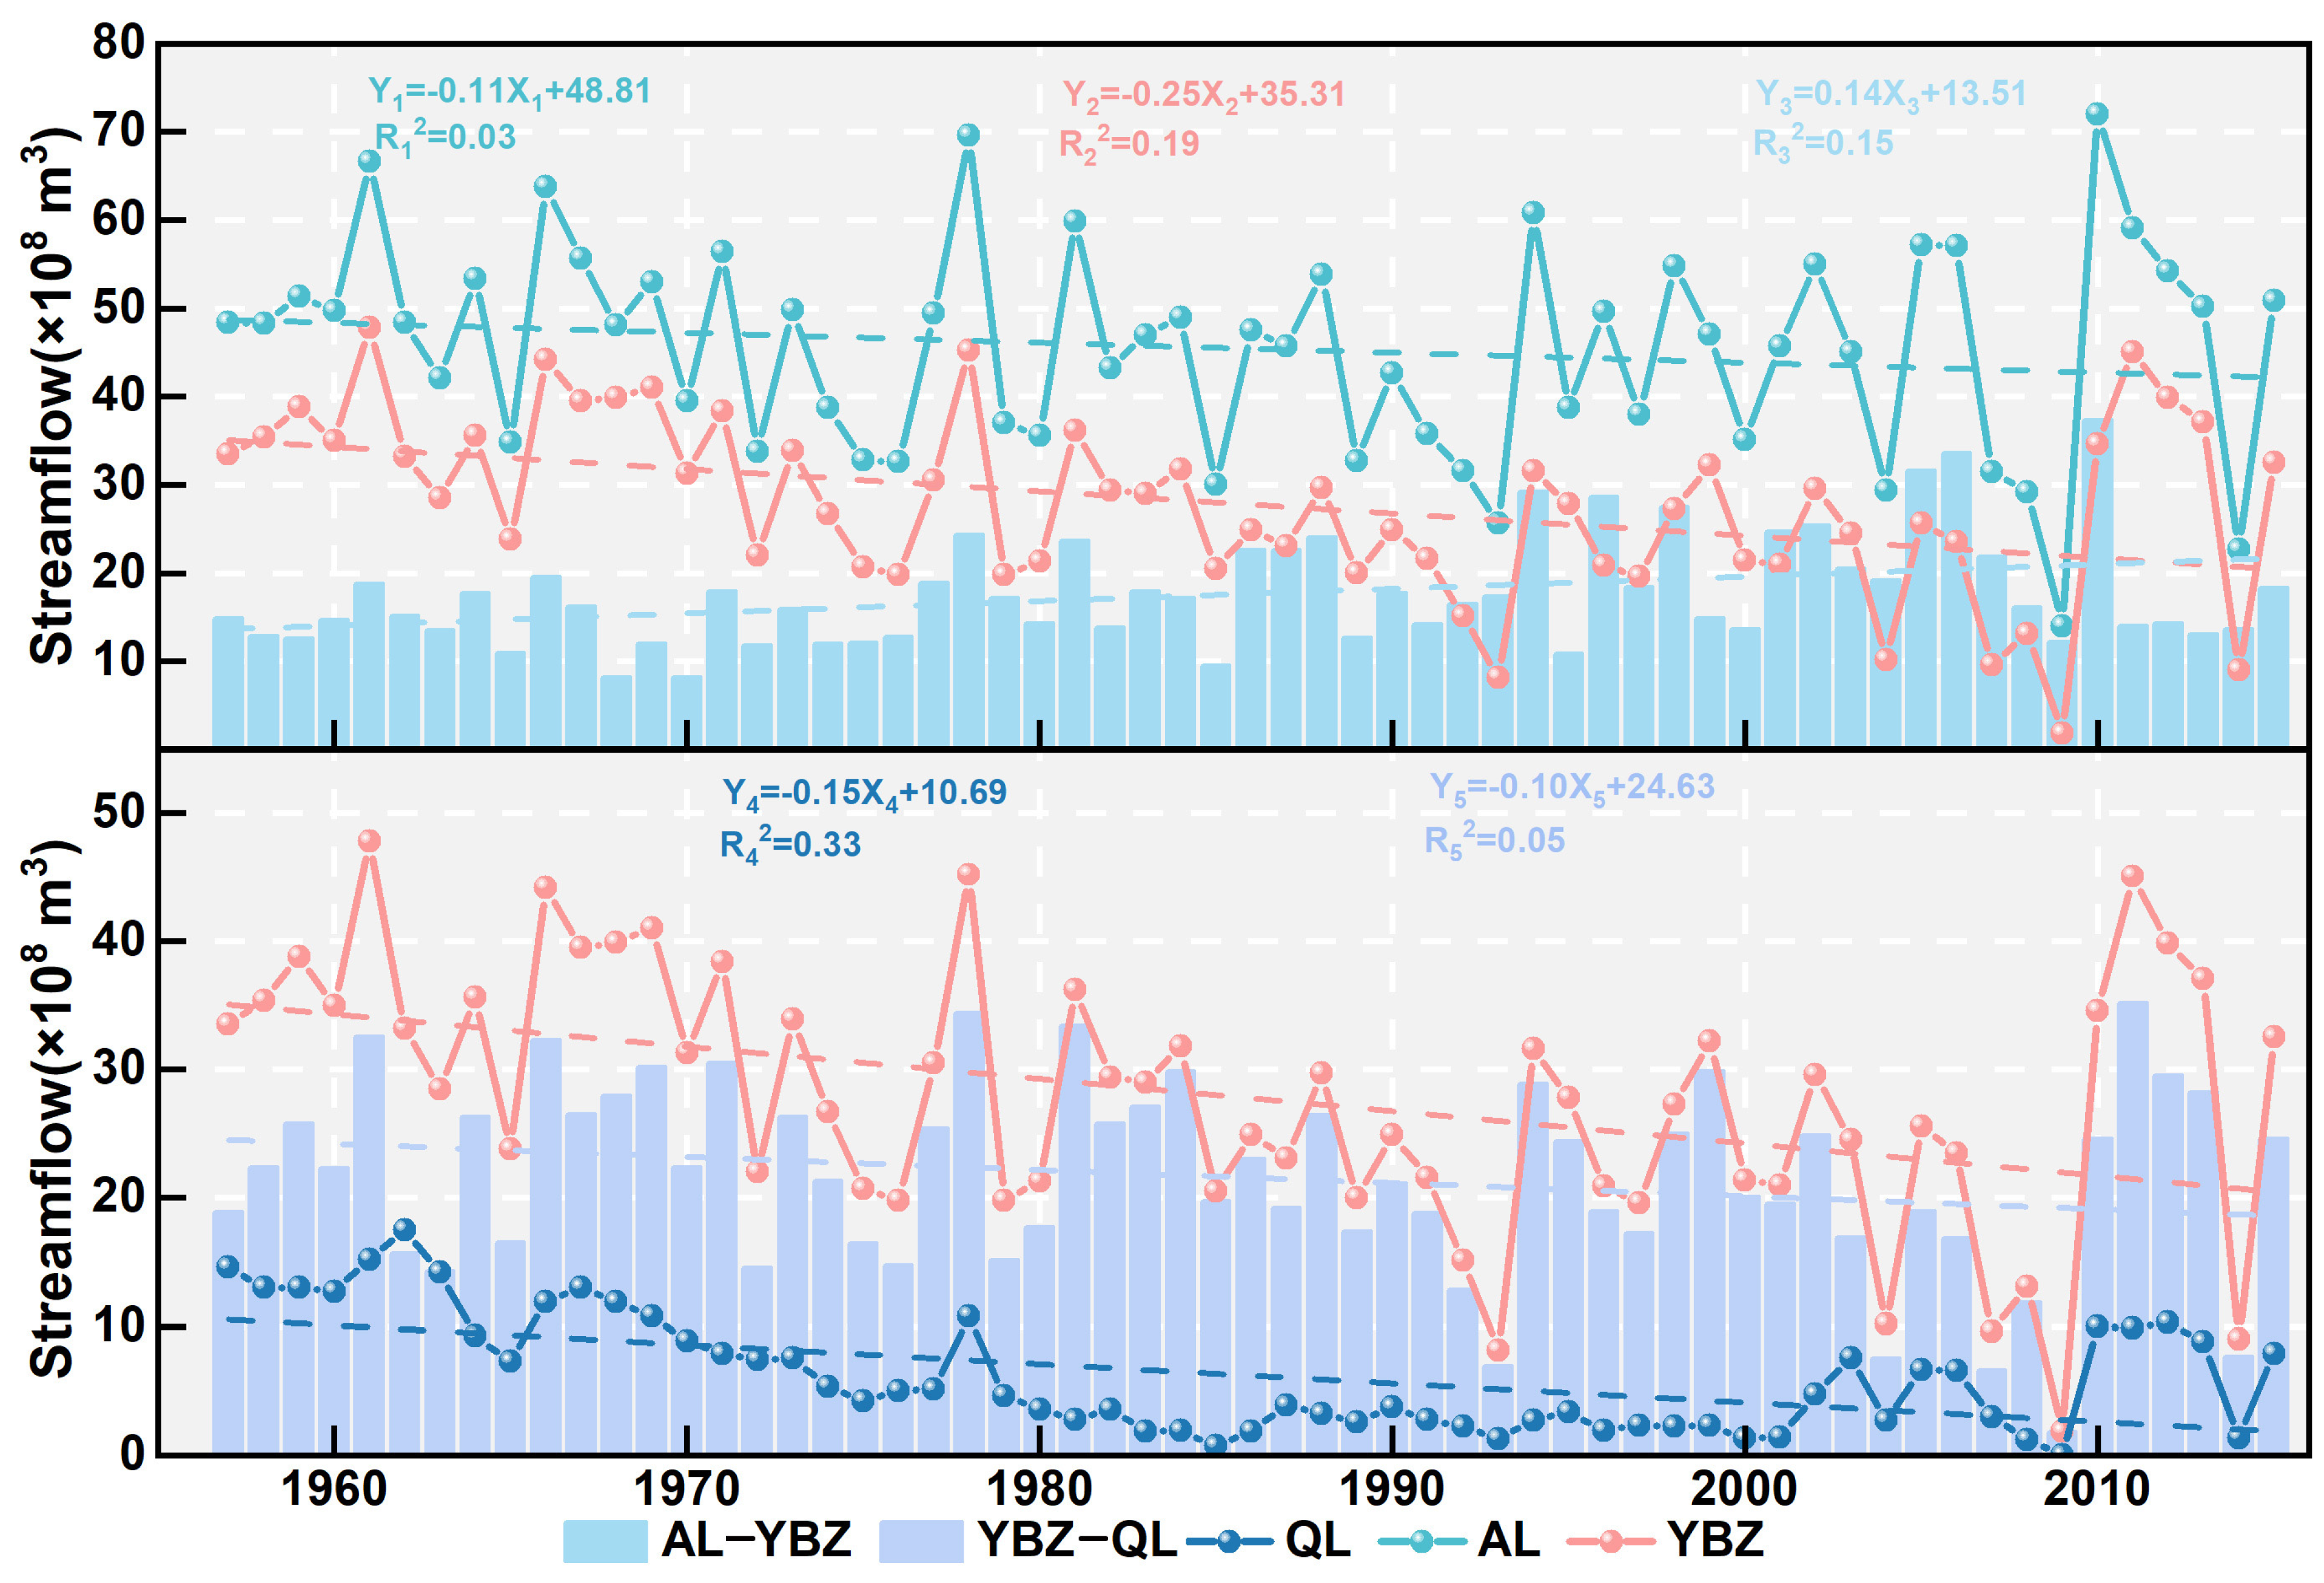
3.1.1. Changes in River Flow

The results of the MK test and linear trends in runoff and streamflow consumption are shown in Table 1 and Figure 2. The two methods provided similar estimations of the change in streamflow. The annual trends in streamflow were all negative, with significant changes in the midstream and downstream regions and non-significant changes in the upstream region during the observation period from 1957–2015. Streamflow consumption increased in the upstream region; consequently, consumption in the midstream and downstream regions decreased (Figure 2).
The streamflow decreased at a rate of 1.11 × 10⁷ m3/yr at Alar station, 2.52 × 10⁷ m3/yr at Yingbazha station, and 1.50 × 10⁷ m3/yr at Qiala station from 1957 to 2015. The data were split into two periods (1970–2000 and 2000–2015) to quantify the streamflow changes over time. The trends in streamflow and streamflow consumption from the period (1970–2000) were the same as those in the period 1957–2015, while the trends were different from 2000–2015. The interannual variability of runoff became more irregular after 2000 due to the implementation of a comprehensive control project on the Tarim River.

3.1.2. Changes in Precipitation and Temperature

The significance of trends in precipitation and temperature for the period of 1957–2015 is shown in Table 1. The annual trend in precipitation was positive and highly significant in the upstream region according to linear regression, moderately significant in the downstream region, and non-significant in the midstream region (Table 1). Similar results were found when using the MK test as follows: there was a strong increasing trend in the upstream region, a lower level of significance in the midstream region, and a moderate increasing trend in the downstream portion of the basin.
The annual trend in temperature was also determined to be positive (i.e., increasing) using both methods of analyses. A moderate increasing trend was found in the midstream region by the MK test, and non-significant trends were detected in the upstream and downstream regions. However, the linear model test indicated a strong increasing trend in both the upstream and downstream portions of the basin, with a lower level of significance in the midstream region.

3.1.3. Changes in Evaporation

The variation tendency of evaporation in 20-cm evaporation pans was studied using observations from the most recent 50 years. The results indicated that the evaporation variation followed a decreasing trend from 1957 to 2015. According to the MK test, the annual evaporation followed a significant, but negative, trend in the upstream and downstream regions, but a non-significant trend in the midstream region. The results indicated a strong decreasing trend in evaporation (at a rate of 36.7 mm per decade) in the upstream region and much slower decreasing trends at rates of between 6.7 mm and 4.8 mm per decade in the midstream and downstream regions, respectively, according to the linear model test.

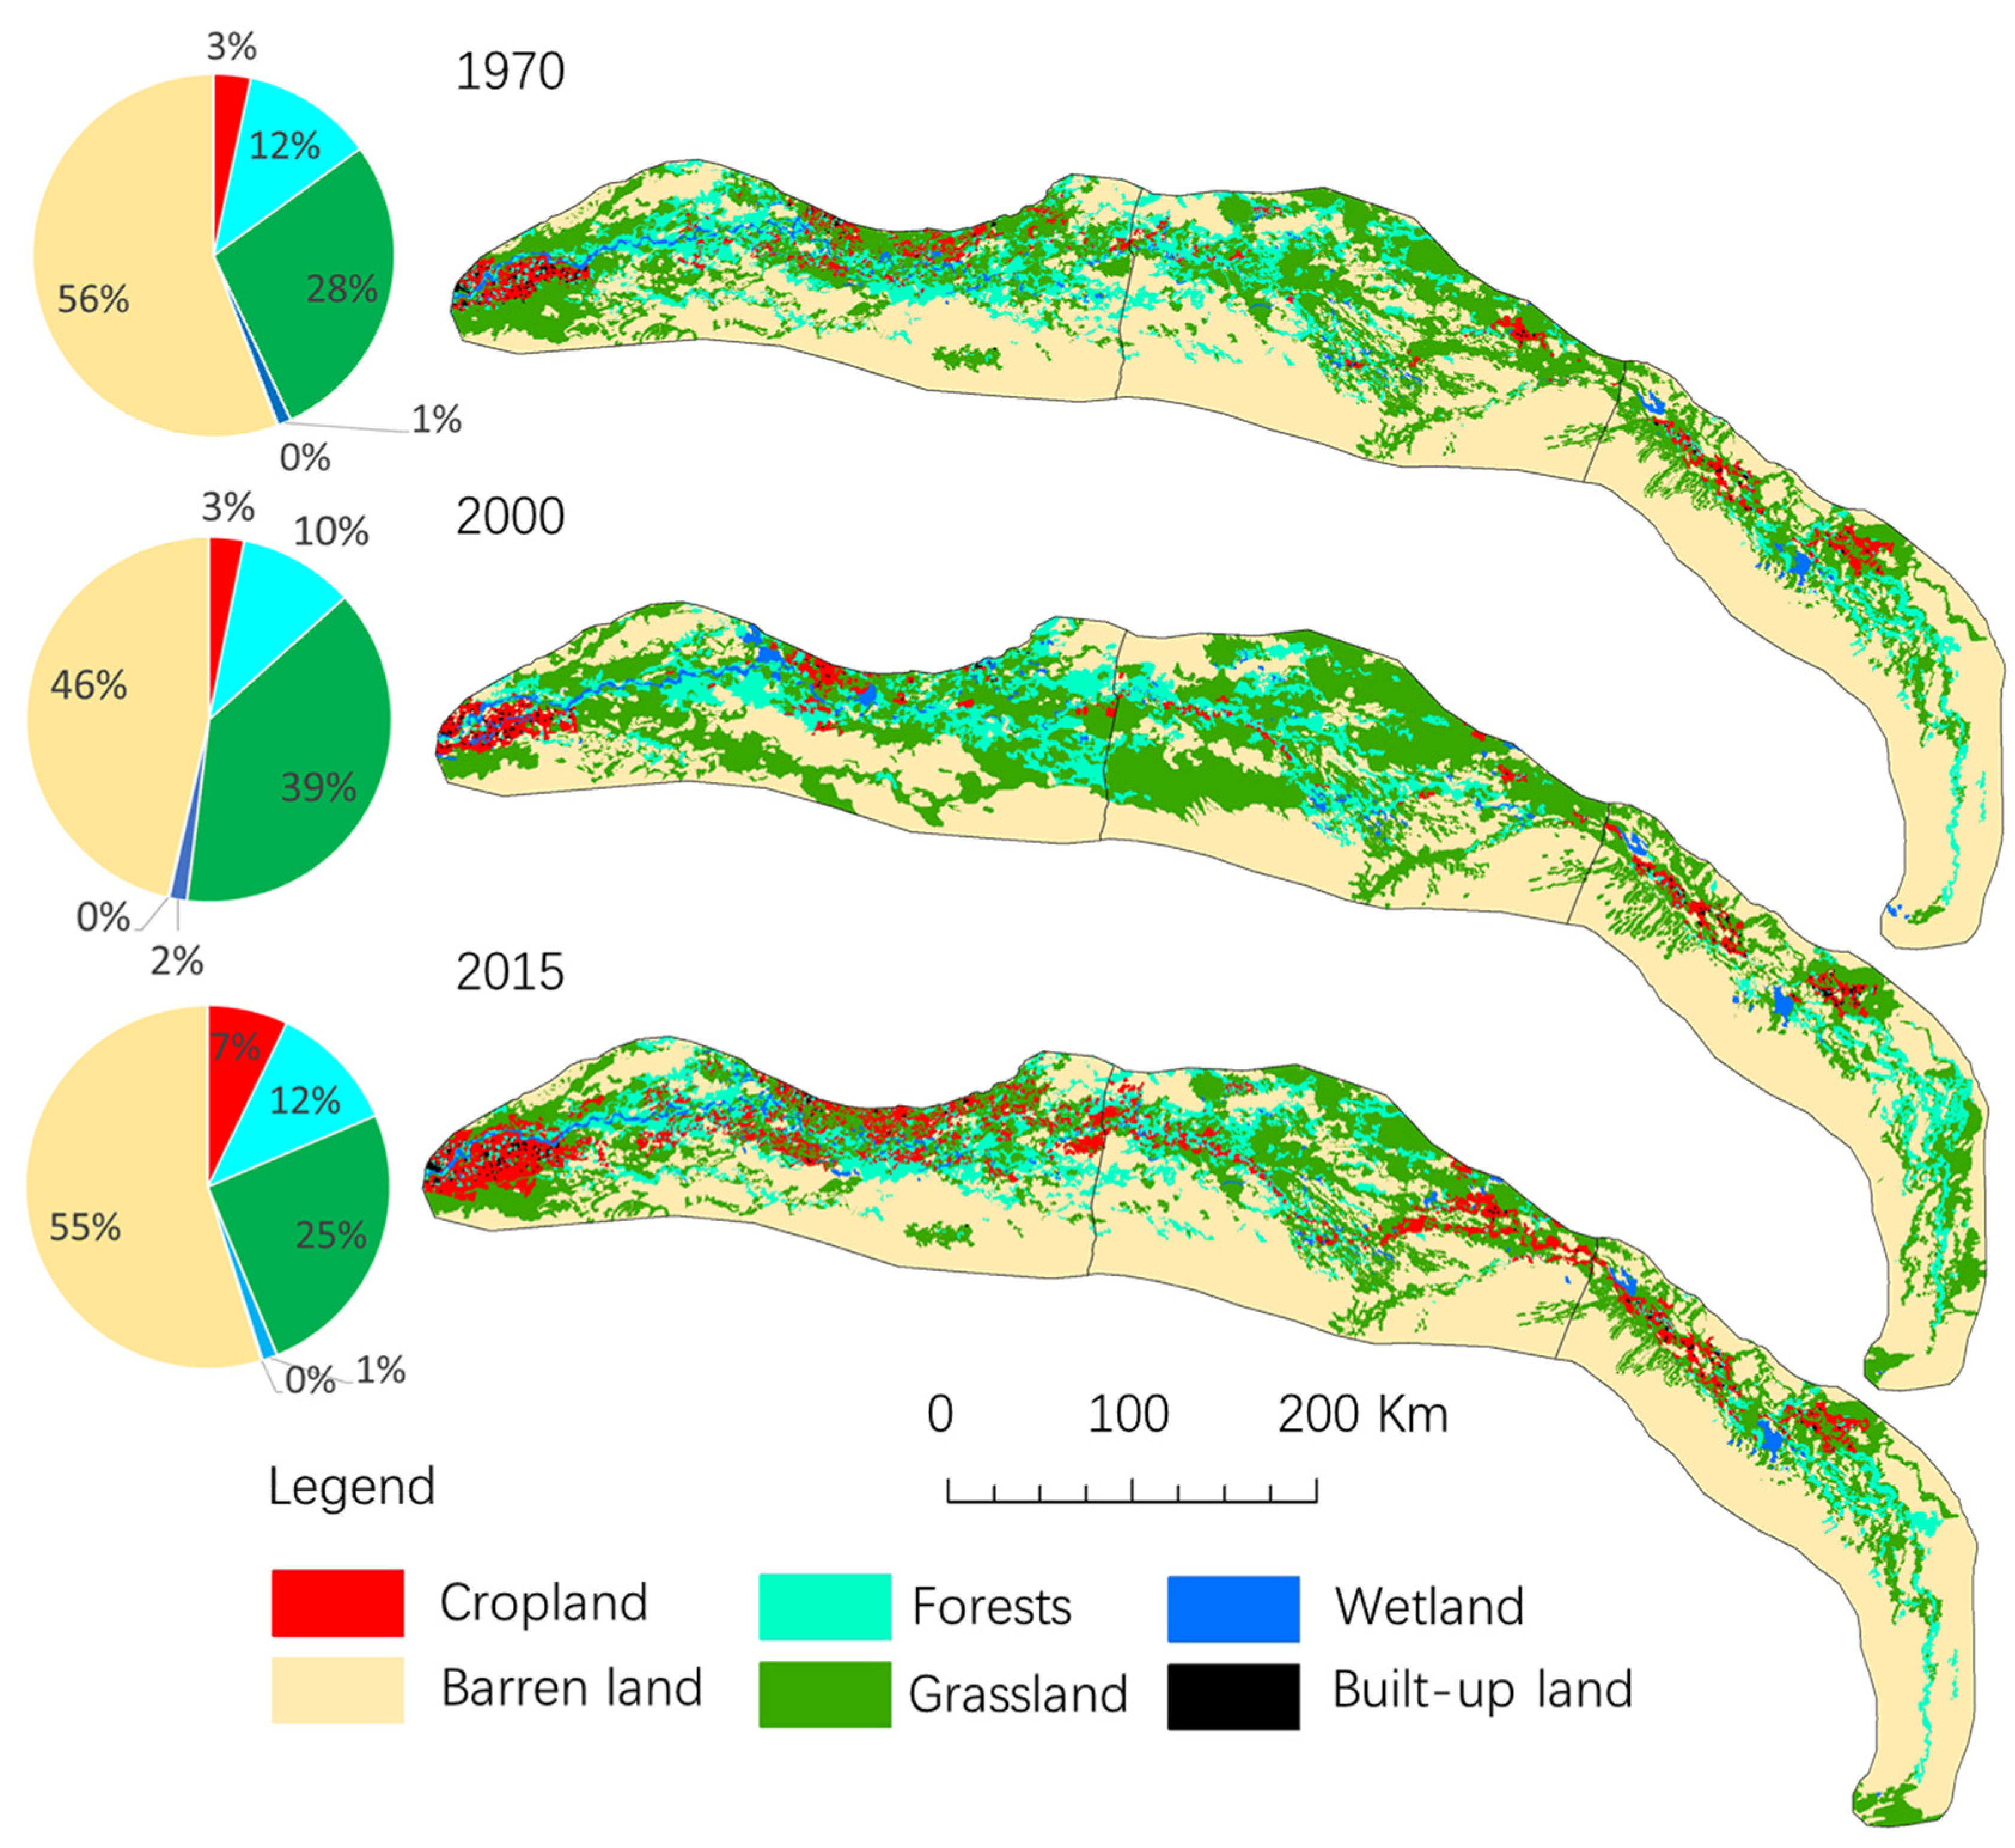
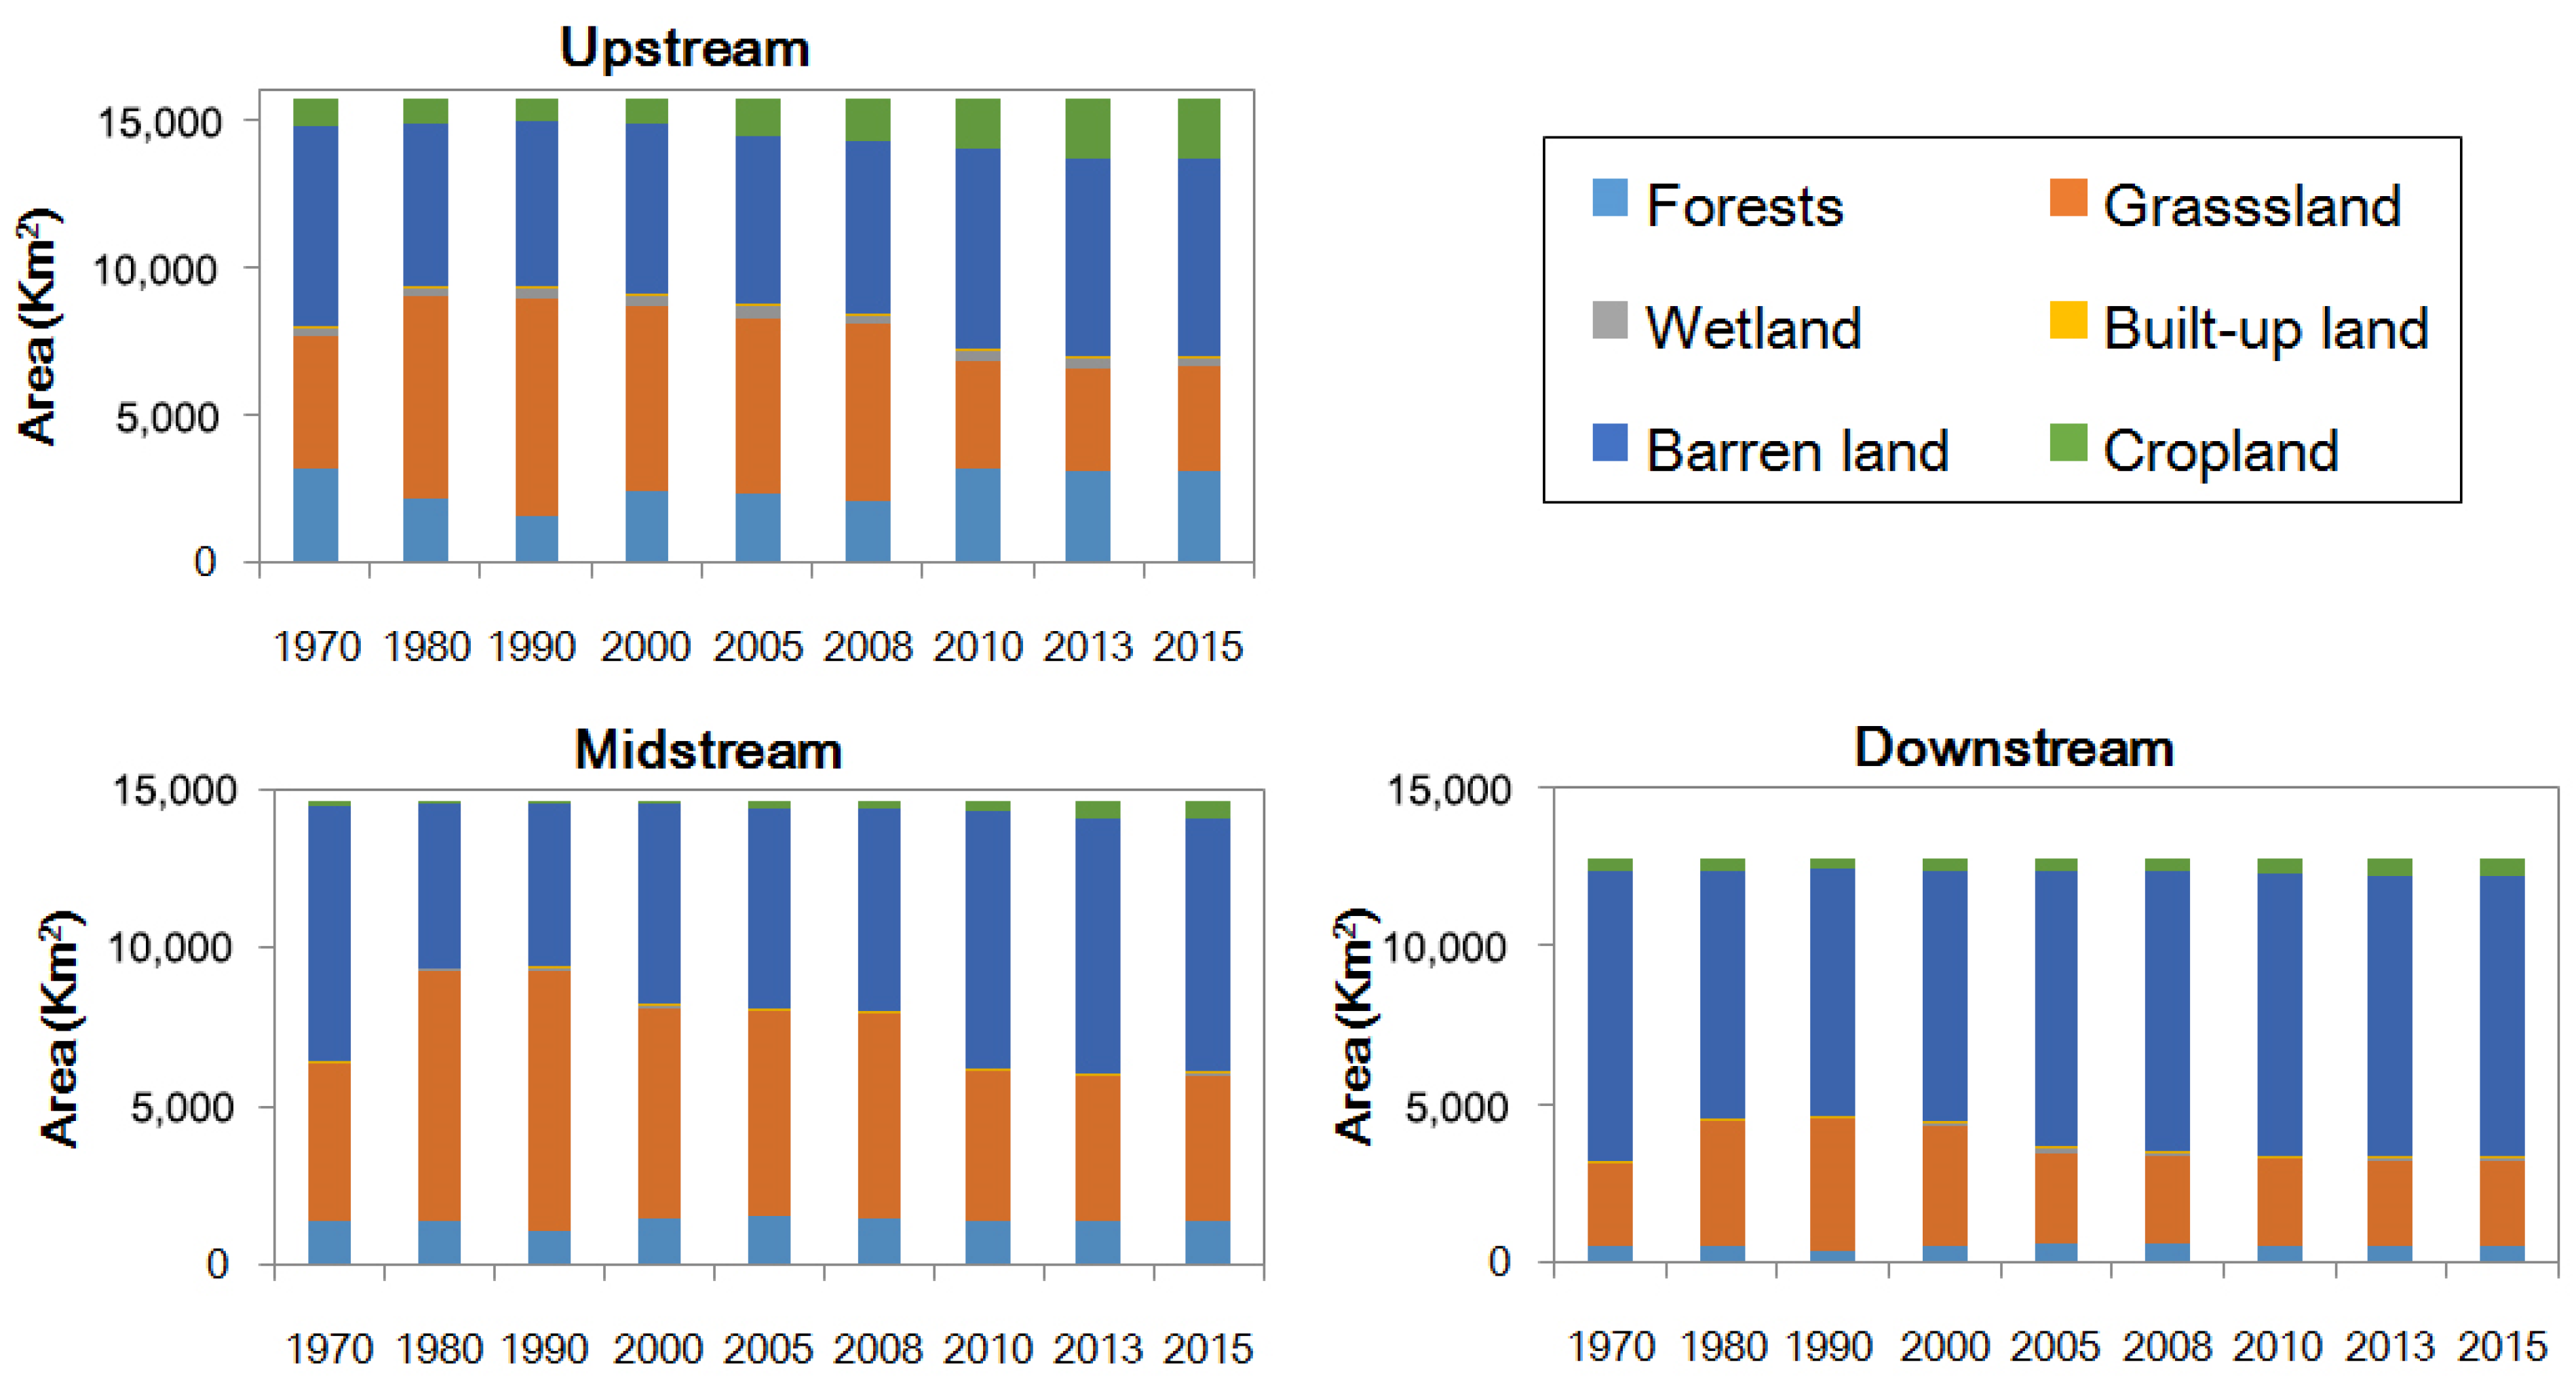
3.2. Land-Use Changes in the Mainstream Tarim River Basin

The area percentage of each land-use type in 1970, 2000, and 2015, is shown in Figure 3. The land-use changes in the Tarim River basin from 1970 to 2015 consisted mainly of the expansion of cropland and built-up land. The changes in the forest, grassland, and barren land areas had opposite trends in the first 30 years, compared to those in the last 15 years. The forest area decreased by 2%, the grassland area increased by 11%, and the barren land area decreased by 10% from 1970 to 2000; in contrast, the forest area increased by 2%, the grassland area decreased by 14%, and the barren land increased by 9% from 2000 to 2015. There was no obvious change in wetland area in 1970, 2000, and 2015 (Figure 3).
From 1970 to 2015, the cropland area increased by 1639 km2, of which 67% occurred in the upstream region of the basin, and 25% occurred in the midstream region (Figure 4). The built-up land increased by 95% and 429% in the upstream and midstream regions, respectively, and decreased by 40% in the downstream region from 1970 to 2015. From 1970 to 1990, the forest area decreased, and the grassland area increased. From 1990 to 2015, the forest area increased, and the grassland area decreased. The barren land was mainly distributed in the downstream region, accounting for 40% of the total barren land area, followed by the midstream region, accounting for 32%, and 28% was in the upstream region. A total of 68% of the wetland area is located in the upstream region, and this value increased by 48% during 1970–2005 and decreased by 31% during 2005–2015.

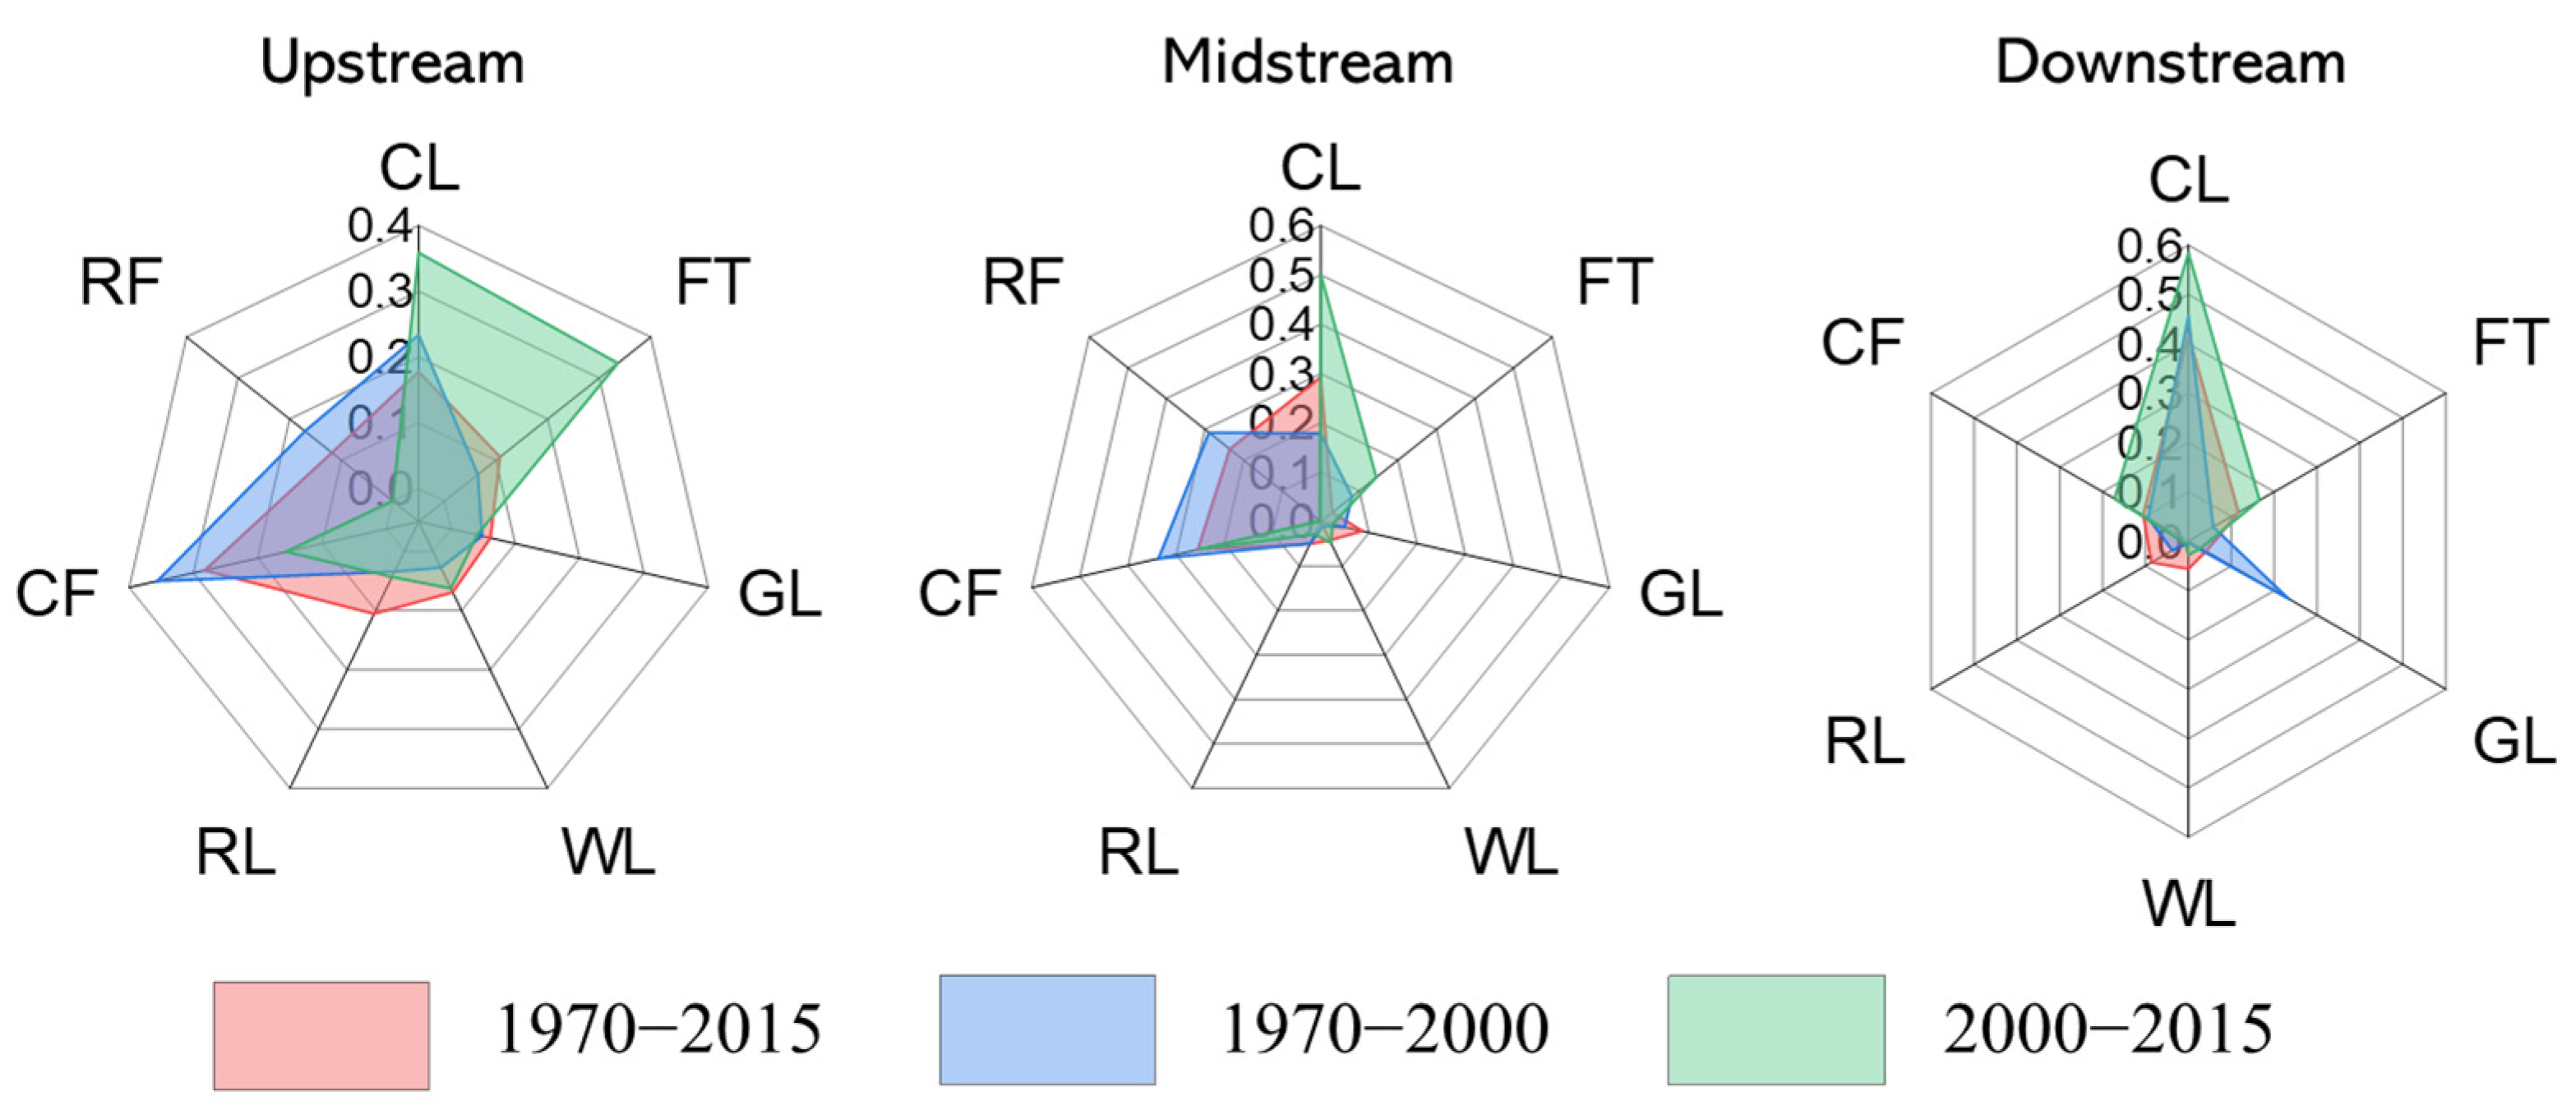
3.3. Effects of Climate and Land-Use Changes on Streamflow Consumption Processes

The change in the streamflow in the Tarim River basin mainly depends on the confluence inflow as well as natural and human-induced water consumption. Natural streamflow consumption includes flooding, infiltration, and evaporation; human-induced streamflow consumption arises from land-use changes and hydraulic engineering water control practices.
The GAMs described in Equation (3) were built to estimate the relationship between streamflow consumption and environmental factors for the upstream, midstream, and downstream portions of the basin. Table 2 shows the model results from 1970 to 2015. The CRs for the total deviation in streamflow consumption in the upstream, midstream, and downstream regions were 92.4%, 99.2%, and 82.5%, respectively. For streamflow consumption in the upstream region, LUCC accounted for the largest portion (52.2%), followed by climatic change (28.3%) and inflow runoff Qal (11.8%). Streamflow consumption in the midstream area was mainly influenced by LUCC (50.1%), climatic change (25.5%), and inflow runoff Qybz (23.6%). In the downstream region, the inflow runoff (Qql) was not considered as a GAM factor because the runoff at Qiala station was almost entirely consumed. Consequently, in the downstream portion of the basin, the relationship between streamflow consumption and environmental factors was mainly influenced by LUCC (72.0%) and climatic change (10.5%).
According to the AIC, as the influence of a factor increases, its AIC value decreases, indicating that the model-fitting degree gradually improves. The F test can be used to test the significance of model terms. It can be seen that two variables (cropland and forests) in the upstream area, four variables (cropland, forests, residential land, and temperature) in the midstream area, and three variables (cropland, forests, and evaporation) in the downstream area show statistically significant interactions at p = 0.05 (Table 2).
Figure 5 shows the contributions of climate change and human activities to streamflow consumption during 1970–2000, 2000–2015, and 1970–2015. The main factors controlling the changes in streamflow consumption differed in the different periods. From the historical period (1970–2000) to the recent period (2000–2015), the CR of cropland increased from 23.4% to 35.9% in the upstream region, from 17.9% to 50.1% in the midstream region, and from 45.7% to 58.4% in the downstream region, respectively. The effect of cropland area changes on streamflow consumption increased from the upstream region to the downstream region. The CR of runoff decreased during the two periods. The CR of the built-up land increased in the upstream region and decreased in the midstream and downstream regions. Overall, the effect of human interventions on streamflow consumption was greater than the impact of climate change. Land-use change represents the main type of human intervention and is an important driving force for direct and indirect influences on hydrologic processes [38,39].
Compared with the traditional regression method, GAMs are not only major factors that determine the contribution of each factor to the predictive strength of a model, but also determine the interaction effect of multiple factors [40]. The results from the present study are somewhat different and show that the relationship between streamflow consumption and land-use change is indirect and mainly due to irrigation and ecological water use.

4. Conclusions

The long-term variations in streamflow, its consumption, land-use, and associated climate change in the mainstream Tarim River basin were analysed by using the MK and linear regression methods. The interactions of land-use and climate on streamflow consumption were quantified by GAMs. During the past 45 years, the streamflow in the mainstream has decreased significantly. The streamflow consumption has shown an increasing trend in the upper reaches and a decreasing trend in the middle and lower reaches. The expansion of croplands, growth in urban areas, and other land-use changes were the primary reasons causing the decreased streamflow in the middle and lower reaches, and increased streamflow consumption in the upper reaches. The streamflow consumption in the middle and lower reaches decreased, and this change could be attributed to the decreased inflow. The expanding agricultural area directly led to an increase in water consumption in the irrigation area.
This study used a data-driven approach combined with a quantitative analysis to evaluate the available hydroclimatic and land-use data to identify changes in streamflow and streamflow consumption. The results are useful for understanding the changing processes of the hydrological cycle and driving factors of runoff change and can serve as a reference for regulating policies accordingly so that rivers can be restored to a better level and ecosystems may benefit from it. Overall, the individual impacts of climate change and human activities are necessary for water resource planning and management in arid inland river basins.

Author Contributions

Conceptualization, F.S. and C.Z.; methodology, F.S.; software, Y.W.; validation, X.L., X.M. and C.Z.; formal analysis, Y.W.; investigation, F.S. and X.L.; resources, C.Z.; data curation, F.S.; writing—original draft preparation, F.S.; writing—review and editing, J.Z. and X.M.; visualization, X.M.; supervision, C.Z.; project administration, C.Z.; funding acquisition, F.S. All authors have read and agreed to the published version of the manuscript.

Funding

This research was funded by the NSFC Project (42171041, U1903116) and West Light Foundation of Chinese Academy of Sciences (2021-XBQNXZ-007).

Institutional Review Board Statement

Not applicable.

Informed Consent Statement

Not applicable.

Data Availability Statement

Not applicable.

Acknowledgments

The data acquisition and processing in this article were strongly supported and guided by Shixin Wu and Jian Yue at the Xinjiang Institute of Ecology and Geography.

Conflicts of Interest

The authors declare no conflict of interest.

References

  1. Ye, X.C.; Zhang, Q.; Liu, J.; Li, X.H.; Xu, C.Y. Distinguishing the relative impacts of climate change and human activities on variation of streamflow in the Poyang Lake catchment, China. J. Hydrol. 2013, 494, 83–95. [Google Scholar] [CrossRef]
  2. Gao, G.; Fu, B.; Wang, S.; Liang, W.; Jiang, X. Determining the hydrological responses to climate variability and land use/cover change in the loess plateau with the budyko framework. Sci. Total Environ. 2016, 557–558, 331–342. [Google Scholar] [CrossRef] [PubMed]
  3. Neupane, R.P.; Kumar, S. Estimating the effects of potential climate and land use changes on hydrologic processes of a large agriculture dominated watershed. J. Hydrol. 2015, 529, 418–429. [Google Scholar] [CrossRef]
  4. Nosetto, M.D.; Jobbágy, E.G.; Brizuela, A.B.; Jackson, R.B. The hydrologic consequences of land cover change in central Argentina. Agr. Ecosyst. Environ. 2012, 154, 2–11. [Google Scholar] [CrossRef]
  5. Tian, H.; Lu, C.; Chen, G.; Xu, X.; Liu, M.; Ren, W.; Tao, B.; Sun, G.; Pan, S.; Liu, J. Climate and land use controls over terrestrial water use efficiency in monsoon Asia. Ecohydrology 2011, 4, 322–340. [Google Scholar] [CrossRef]
  6. Morán-Tejeda, E.; Zabalza, J.; Rahman, K.; Gago-Silva, A.; López-Moreno, J.I.; Vicente-Serrano, S.; Lehmann, A.; Tague, C.L.; Beniston, M. Hydrological impacts of climate and land-use changes in a mountain watershed: Uncertainty estimation based on model comparison. Ecohydrology 2015, 8, 1396–1416. [Google Scholar] [CrossRef]
  7. Pankaj, D.; Ashok, M. Separating the impacts of climate change and human activities on streamflow: A review of methodologies and critical assumptions. J. Hydrol. 2017, 548, 278–290. [Google Scholar]
  8. Wheater, H.S.; Mathias, S.A.; Li, X. Groundwater Modelling in Arid and Semi-Arid Areas; Cambridge University Press: New York, NY, USA, 2010; pp. 11–19. [Google Scholar]
  9. Costa, A.C.; Foerster, S.; de Araújo, J.C.; Bronstert, A. Analysis of channel transmission losses in a dryland river reach in north-eastern Brazil using streamflow series, groundwater level series and multi-temporal satellite data. Hydrol. Processes 2013, 27, 1046–1060. [Google Scholar] [CrossRef] [Green Version]
  10. Hu, Y.; Duan, W.; Zou, S.; Pmka, B. An integrated assessment of runoff dynamics in the amu darya river basin: Confronting climate change and multiple human activities, 1960–2017. J. Hydrol. 2021, 603, 126905. [Google Scholar] [CrossRef]
  11. Gokool, S.; Riddell, E.S.; Nel, J.M.; Raubenheimer, R.; Strydom, T.; Swemmer, A.; Chetty, K.T. Quantifying the contribution of riparian total evaporation to streamflow transmission losses: Preliminary investigations along the Groot Letaba river. Phys. Chem. Earth Parts A/B/C 2019, 114, 102805. [Google Scholar] [CrossRef]
  12. Yan, Y.; Yang, Z.; Liu, Q. Nonlinear trend in streamflow and its response to climate change under complex ecohydrological patterns in the Yellow River Basin, China. Ecol. Model. 2013, 252, 220–227. [Google Scholar] [CrossRef]
  13. Yang, S.L.; Shi, B.; Fan, J.; Luo, X.; Tian, Q.; Yang, H.; Chen, S.; Zhang, Y.; Zhang, S.; Shi, X.; et al. Streamflow decline in the yellow river along with socioeconomic development: Past and future. Water 2020, 12, 823. [Google Scholar] [CrossRef] [Green Version]
  14. Dong, W.; Cui, B.; Liu, Z.; Zhang, K. Relative effects of human activities and climate change on the river runoff in an arid basin in northwest China. Hydrol. Processes 2014, 28, 4854–4864. [Google Scholar] [CrossRef]
  15. Lin, B.; Chen, X.; Yao, H.; Chen, Y.; Liu, M.; Gao, L. Analyses of landuse change impacts on catchment runoff using different time indicators based on swat model. Ecol. Indic. 2015, 58, 55–63. [Google Scholar] [CrossRef]
  16. Zhang, H.; Xue, L.; Yang, C.; Chen, X.; Zhang, L.; Wei, G. Dynamic assessment on the landscape patterns and spatio-temporal change in the mainstream of Tarim river. In Proceedings of the IOP Conference Series Earth and Environmental Science, Banda Aceh, Indonesia, 26–27 September 2018; Volume 108, p. 032058. [Google Scholar] [CrossRef] [Green Version]
  17. Zhao, F.; Zhang, L.; Xu, Z.; Scott, D.F. Evaluation of methods for estimating the effects of vegetation change and climate variability on streamflow. Water Resour. Res. 2010, 46, W03505. [Google Scholar] [CrossRef]
  18. Li, X.; Zhang, Y.; Guo, F.; Gao, X.; Wang, Y. Predicting the effect of land use and climate change on stream macroinvertebrates based on the linkage between structural equation modeling and bayesian network. Ecol. Indic. 2018, 85, 820–831. [Google Scholar] [CrossRef]
  19. Bai, Y.; Ochuodho, T.O.; Yang, J. Impact of land use and climate change on water-related ecosystem services in Kentucky, USA. Ecol. Indic. 2019, 102, 51–64. [Google Scholar] [CrossRef]
  20. Zuo, D.P.; Xu, Z.X.; Wu, W.; Zhao, J.; Zhao, F.F. Identification of streamflow response to climate change and human activities in the Wei River Basin, China. Water Resour. Manag. 2014, 28, 833–855. [Google Scholar] [CrossRef]
  21. Guo, Y.; Li, Z.; Amo-Boateng, M.; Deng, P.; Huang, P. Quantitative assessment of the impact of climate variability and human activities on runoff changes for the upper reaches of Weihe River Stochastic Environ. Res. Risk Assess. 2014, 8, 333–346. [Google Scholar] [CrossRef]
  22. Yang, H.; Yang, D. Derivation of climate elasticity of runoff to assess the effects of climate change on annual runoff. Water Resour. Res. 2011, 47, W07526.12. [Google Scholar] [CrossRef]
  23. Ning, T.; Li, Z.; Liu, W. Separating the impacts of climate change and land surface alteration on runoff reduction in the jing river catchment of China. Catena 2016, 147, 80–86. [Google Scholar] [CrossRef]
  24. Zhao, J.; Huang, S.; Huang, Q.; Wang, H.; Leng, G. Detecting the dominant cause of streamflow decline in the loess plateau of China based onthe latest budyko equation. Water 2018, 10, 1277. [Google Scholar] [CrossRef] [Green Version]
  25. Tomer, M.D.; Schilling, K.E. A simple approach to distinguish land-use and climate-change effects on watershed hydrology. J. Hydrol. 2009, 376, 24–33. [Google Scholar] [CrossRef]
  26. Rigby, R.A.; Stasinopoulos, D.M. Generalized additive models for location, scale and shape. J. Appl. Stat. 2005, 54, 507–554. [Google Scholar] [CrossRef] [Green Version]
  27. Zhao, R.F.; Chen, Y.N.; Shi, P.J.; Zhang, L.H.; Pan, J.H.; Zhao, H.L. Land use and land cover change and driving mechanism in the arid inland river basin: A case study of Tarim River, Xinjiang, China. Environ. Earth Sci. 2013, 68, 591–604. [Google Scholar] [CrossRef]
  28. Tao, H.; Gemmer, M.; Bai, Y.; Su, B.; Mao, W. Trends of streamflow in the tarim river basin during the past 50years: Human impact or climate change? J. Hydrol. 2011, 400, 1–9. [Google Scholar] [CrossRef]
  29. Ling, H.; Guo, B.; Zhang, G.; Xu, H.; Deng, X. Evaluation of the ecological protective effect of the “large basin” comprehensive management system in the Tarim river basin, china. Sci. Total Environ. 2019, 650, 1696–1706. [Google Scholar] [CrossRef]
  30. Yang, F.; Xue, L.; Wei, G.; Chi, Y.; Yang, G. Study on the dominant causes of streamflow alteration and effects of the current water diversion in the Tarim river basin, China. Hydrol. Processes 2018, 32, 3391–3401. [Google Scholar] [CrossRef]
  31. Chen, Y.N.; Li, W.H.; Xu, C.C.; Hao, X.M. Effects of climate change on water resources in Tarim River Basin, Northwest China. J. Environ. Sci. 2007, 19, 488–493. [Google Scholar] [CrossRef]
  32. Chen, Y.N.; Xu, C.; Hao, X.M.; Li, W.H.; Chen, Y.P.; Zhu, C.G.; Ye, Z. Fifty-year climate change and its effect on annual runoff in the Tarim River Basin, China. Quat. Int. 2009, 208, 53–61. [Google Scholar]
  33. Guo, H.; Jiapaer, G.; Bao, A.; Li, X.; Huang, Y.; Ndayisaba, F.; Meng, F. Effects of the Tarim river’s middle stream water transport dike on the fractional cover of desert riparian vegetation. Ecol. Eng. 2017, 99, 333–342. [Google Scholar] [CrossRef]
  34. Wang, G.X.; Liu, J.Q.; Kubota, J.; Chen, L. Effects of land-use changes on hydrological processes in the middle basin of the Heihe River, northwest China. Hydrol. Processes 2007, 21, 1370–1382. [Google Scholar] [CrossRef]
  35. Kendall, M.G. Rank Correlation Methods; Charles Griffin: London, UK, 1975; p. 202. [Google Scholar]
  36. Hastie, T.J.; Tibshirani, R.J. Generalized Additive Models; Chapman & Hall/CRC: London, UK, 1990. [Google Scholar]
  37. Wood, S.N. Generalized Additive Models: An introduction with R; Chapman & Hall/CRC: Boca Raton, FL, USA, 2006. [Google Scholar]
  38. Boulain, N.; Cappelaere, B.; Séguis, L.; Favreau, G.; Gignoux, J. Water balance and vegetation change in the Sahel: A case study at the watershed scale with an eco-hydrological model. J. Arid. Environ. 2009, 73, 1125–1135. [Google Scholar] [CrossRef]
  39. Hietel, E.; Waldhardt, R.; Otte, A. Analysing land-cover changes in relation to environmental variables in Hesse, Germany. Landsc. Ecol. 2004, 19, 473–489. [Google Scholar] [CrossRef]
  40. Peng, D.M.; Shi, F.Z.; Zhao, C.Y.; Ye, B.S. Factors controlling the spatial variability of surface soil particles using GLM and GAM. Stoch. Env. Res. Risk Assess. 2014, 29, 27–34. [Google Scholar] [CrossRef]
Figure 1. Schematic diagram of the mainstream Tarim River basin.
Water 14 00392 g001
Figure 2. Surface water diversion from the upper reaches to the lower reaches of the Tarim River from 1957–2015.
Water 14 00392 g002
Figure 3. Land-use and area percentages in the mainstream Tarim River basin in 1970, 2000, and 2015.
Water 14 00392 g003
Figure 4. Land-use change in the mid-downstream Tarim River basin from 1970 to 2015.
Water 14 00392 g004
Figure 5. The contributions of climate change and human activities to streamflow consumption during 1970–2000, 2000–2015, and 1970–2015. (CL: Cropland, FT: Forests, GL: Grassland, WL: Wetland, BL: Built-up land, RF: Runoff, CF: Climatic factors: precipitation, temperature, and evaporation.).
Water 14 00392 g005
Table 1. Significance of climatic and hydrological variables for the period 1957–2015 (MK: Z value is the standard normal variate for the Mann–Kendall test; LM: β value is the slope of the regression line; Sig. is the p-value for the linear model test.
Time
Period
FactorsUpstreamMidstreamDownstream
MKLMMKLMMKLM
ZβSig.ZβSig.ZβSig.
1957–2015P1.850.610.00 **0.670.340.061.750.310.02 *
T0.980.030.00 **2.23 *0.010.071.310.020.00 **
E20 cm−2.45 *−3.670.00 **−0.79−0.670.65−2.14 *−0.480.68
S−1.11−0.110.11−2.13 *−0.250.00 **−4.34 **−0.150.00 **
SC1.190.140.00 **−0.12−0.100.01*−4.26 **−0.150.00 **
1970–2000P0.150.830.071.170.820.110.26−0.040.92
T0.710.020.04 *1.290.04 *0.00 **1.380.030.00 **
E20 cm0.400.020.990.23−6.920.03 *−0.210.370.89
S−0.38−0.060.79−1.02−0.270.07−3.11 **−0.200.00 **
SC1.590.210.06−0.15−0.070.58−2.94 **−0.200.00 **
2000–2015P0.21−0.510.720.19−0.140.900.400.740.53
T−0.08−0.020.460.670.002 **0.930.47−0.020.53
E20 cm0.98−3.030.571.6612.040.100.50−6.050.43
S0.180.170.85−0.060.680.341.060.310.12
SC0.19−0.500.26−0.940.360.500.780.310.12
Note: * and ** delineate significance at 0.05 and 0.01 significance level, respectively; P: Precipitation; T: Temperature; E20 cm: The evaporation of the 20 cm evaporate pan; S: streamflow; SC: streamflow consumption.
Table 2. Analysis of deviance for GAMs fitted to the streamflow consumption data.
Model FactorsResidual Degrees of FreedomResidual DevianceProportion of Total Deviance ExplainedAIC ValuePr(F)
UPMIDDOWNUPMIDDOWNUPMIDDOWNUPMIDDOWNUPMIDDOWN
Initial status45454580,269.5124,538.124,265.7
Cropland41414165,973.088,074.314,099.017.8%29.3%41.9%470.9484.2399.90.04 *0.00 **0.04 *
Forests37373757,316.184,363.311,265.528.6%32.3%53.6%466.4484.2391.60.05 *0.04 *0.04 *
Grassland33333352,365.673,586.310,263.934.8%40.9%57.7%464.3479.9389.30.110.070.49
Wetland29292946,810.268,332.58901.541.7%45.1%63.3%461.1478.5384.70.650.700.17
Residential Land25252538,336.562,087.16803.652.2%50.1%72.0%453.9476.1374.40.570.01 **0.09
Precipitation21212132,667.050,826.25795.059.3%59.2%76.1%448.6468.9369.00.200.070.55
Temperature17171725,134.136,759.65649.268.7%70.5%76.7%438.5456.0369.80.150.04 *0.50
Evaporation13131315,635.730,284.84246.580.5%75.7%82.5%423.5449.1358.70.060.070.02 *
Qin(runoff)9996132.7942.5——92.4%99.2%——392.2291.5——0.130.12——
“——” indicates data were not included in the calculation of the variables. * and ** delineate significance at 0.05 and 0.01 significance level, respectively.
Publisher’s Note: MDPI stays neutral with regard to jurisdictional claims in published maps and institutional affiliations.

