Article

Sustainability of the Water-Energy-Food Nexus in Caribbean Small Island Developing States

by
Zachary S. Winters
1,2,*,
Thomas L. Crisman
1 and
David T. Dumke
3
1
School of Geosciences, University of South Florida, Tampa, FL 33620, USA
2
Geospatial, Mapping, and Survey Services, Dewberry, 1000 N Ashley Dr #801, Tampa, FL 33602, USA
3
Office of Global Perspectives and International Initiatives, University of Central Florida, Orlando, FL 32816, USA
*
Author to whom correspondence should be addressed.
Water 2022, 14(3), 322; https://doi.org/10.3390/w14030322
Submission received: 29 October 2021 / Revised: 11 January 2022 / Accepted: 13 January 2022 / Published: 22 January 2022

Abstract

:
The sustainability of small island developing states (SIDS) of the Caribbean is fragile because of island size and topography, limited resources, population growth, natural disasters, and climate change. Current and projected sustainability in 2050 were assessed within the framework of the water–energy–food (WEF) nexus for 10 of 16 SIDS with the best databases. Values for each WEF sector below either Falkenmark indicators or regional averages were considered unsustainable (failing) for that sector. Overall, SIDS were considered unsustainable if they failed at least two of three sectors. Projected water sustainability for 2050 was based on population growth and climate change effects on precipitation and per capita water availability. All SIDS failed the food sector, and four failed the energy sector. Water was considered the ultimate control for long-term sustainability. Five SIDS currently fail the water sector, but all but the largest two SIDS are likely to fail this sector by 2050. The role of poor governance and associated lack of long-term planning for population growth, disasters, and climate change, adaptative management strategies, infrastructure investment with an emphasis on nature-based solutions, decentralized energy grids emphasizing renewable energy, and local food production are clearly impediments for reaching sustainability goals for Caribbean SIDS.

1. Introduction

The three primary factors controlling the sustainability of ecosystems and societies (water, energy, food) have been incorporated into the WEF nexus, an important paradigm for decision-makers to assess sustainability and implement policy [1]. Castillo and Crisman [2] envisioned water, energy, and food as the spokes of a wheel that are joined together with health as the hub, with economics as the rim. Weitz et al. [3] stated that the nexus supports the 17 Sustainable Development Goals (SDGs) set by the United Nations by ensuring cost-effective, efficient, and sustainable resource use that incorporates adaptive management practices to adjust WEF to respond to short- and long-term resource fluctuations and human utilization [2,4].
Since its inception in 2011, the WEF nexus has evolved to emphasize models that both strengthen the understanding of each WEF sector and identify and quantify interrelationships among sectors and their sensitivity to outside forcing functions [5,6,7,8,9,10]. National [11,12,13] and intra-national regional [14,15,16] Nexus models have been developed, but one model does not fit all situations, and model development must be based on extensive databases and interdisciplinary approaches [9,10].
Most developing nations lack sufficient temporal and spatial quantitative data to construct WEF nexus models [8], and less rigorous approaches must be taken to provide broader overviews of nexus components and their interactions. Small islands are likely to be the most sensitive to changes in the WEF nexus despite the often-great diversity of landscapes relative to their limited area. Sadly, the great inter-island variability in resources and demographics is ignored, and the islands are lumped into a single category, covering thousands of square kilometers, as is done for Oceania [17] and the Caribbean [18]. With overall limited resources, the resilience of small islands to changes in the WEF nexus is controlled at the landscape/watershed level [19,20,21]. There is a very short lag time between the imbalance in the nexus and a collapse in ecosystem and societal services. Adaptive management based on continuous monitoring of WEF components is critical [8,17,19,22].
Small island developing states (SIDS) were recognized in 1992 at the United Nations Conference on Environment and Development in Rio de Janeiro, Brazil, as a special category of countries based on their unique social, environmental, and development issues [23], including small size, remoteness, susceptibility to climate change and biodiversity loss, and limited resource base. A total of 58 SIDS has been identified—38 UN members and 20 non-UN members/associate members of regional commissions from three global regions: the Pacific (67%), the Caribbean (25%), and the Atlantic Ocean/Indian Ocean/South China Sea (8%). The total land area of global SIDS is 117,902 km2, with a population of approximately 65 million [24].
The 28 SIDS in the Caribbean basin include three coastal continental countries (Belize, Guyana, Suriname) with a landmass of 29,190 km2 and a population of 3 million; the population is low but very dense (110 people/km2), especially along low-lying coasts [24]. Islands are either volcanic in origin with great relief and narrow coastal plains or sedimentary in origin and low lying.
Overall, 7% of the land in Caribbean SIDS is under 5 m elevation, and only 6% of the land is arable. Geology and geography set the stage for stark contrasts in the ability of individual SIDS to meet sustainability goals. Energy needs are supplied mostly by fossil fuel plants locally or regionally, and hydropower meets nearly 50% of regional electricity needs [25].
Water is the most important component governing the WEF nexus, and water resources vary greatly among Caribbean SIDS, reflecting the orographic influence of mountains to produce high rainfall on windward slopes and drought or deserts on leeward slopes. In general, the lower the relief of an island, the lower the ability to store rainfall and the greater the likelihood of it experiencing chronic water shortages. Aquifers are either absent or poorly developed, especially on islands with igneous geology. Precipitation is the dominant source of water resources for Caribbean SIDS, with both 90% of agriculture and nearly 50% of regional electricity supplied by hydropower dependent on rainfall [25]. Apart from reservoirs on the largest islands, most SIDS depend on intact forests on interior slopes for short-term water storage and abatement of downstream floods, but rainfall patterns are dynamically related to annual wet and dry seasons and the interannual difference in the frequency and intensity of El Nino/La Nina and hurricanes.
Water security is the most pressing issue in Caribbean SIDS. All countries of the Caribbean have agreed to meet the 17 UN SDGs, which integrate economic and social development with environmental sustainability by 2030 [26], but Sarni [27] warned that meeting SDG #6 to “ensure availability and sustainable management of water and sanitation for all” will require radical changes in water management practices if there is any likelihood of success.
Projected impacts of long-term climate change on Caribbean SIDS are potentially dire and lead to regional unsustainability. We took a conservative approach and selected changes to 2050 for all climate change parameters even if publications projected farther into the future. We felt that longer projections suffer from increasing uncertainty. Despite model differences and some degree of differential impacts across the basin, average annual temperatures are expected to rise 1°C to 5 °C for Caribbean SIDS, with the greatest warming in the Greater Antilles [28]. Mycoo [29] noted that although Caribbean SIDS have often implemented innovative climate change adaptation strategies, strategy reassessment will be required should mean annual temperature exceed 1.5 °C.
The Caribbean basin Is expected t” exp’Iience a significant decrease in precipitation overall [28], including 10–30% over the Greater Antilles and Eastern Caribbean subregions and 10% in Trinidad [30]. Decreased rainfall during the summer rainy season will not meet expected water demand and not be offset by projected increased rainfall during the winter dry season unless infrastructure is built to store water.
This study incorporates the WEF nexus to assess both the current sustainability of 10 Caribbean SIDS and the likely responses to projections of climate change by 2050. Sustainability for water, energy, and food was analyzed separately to include key parameters relating to resource availability to meet human needs. Each WEF component was then deemed to be failing or meeting sustainability conditions for each nation, and an overall sustainability score was calculated from the average of the three separate scores.

2. Materials and Methods

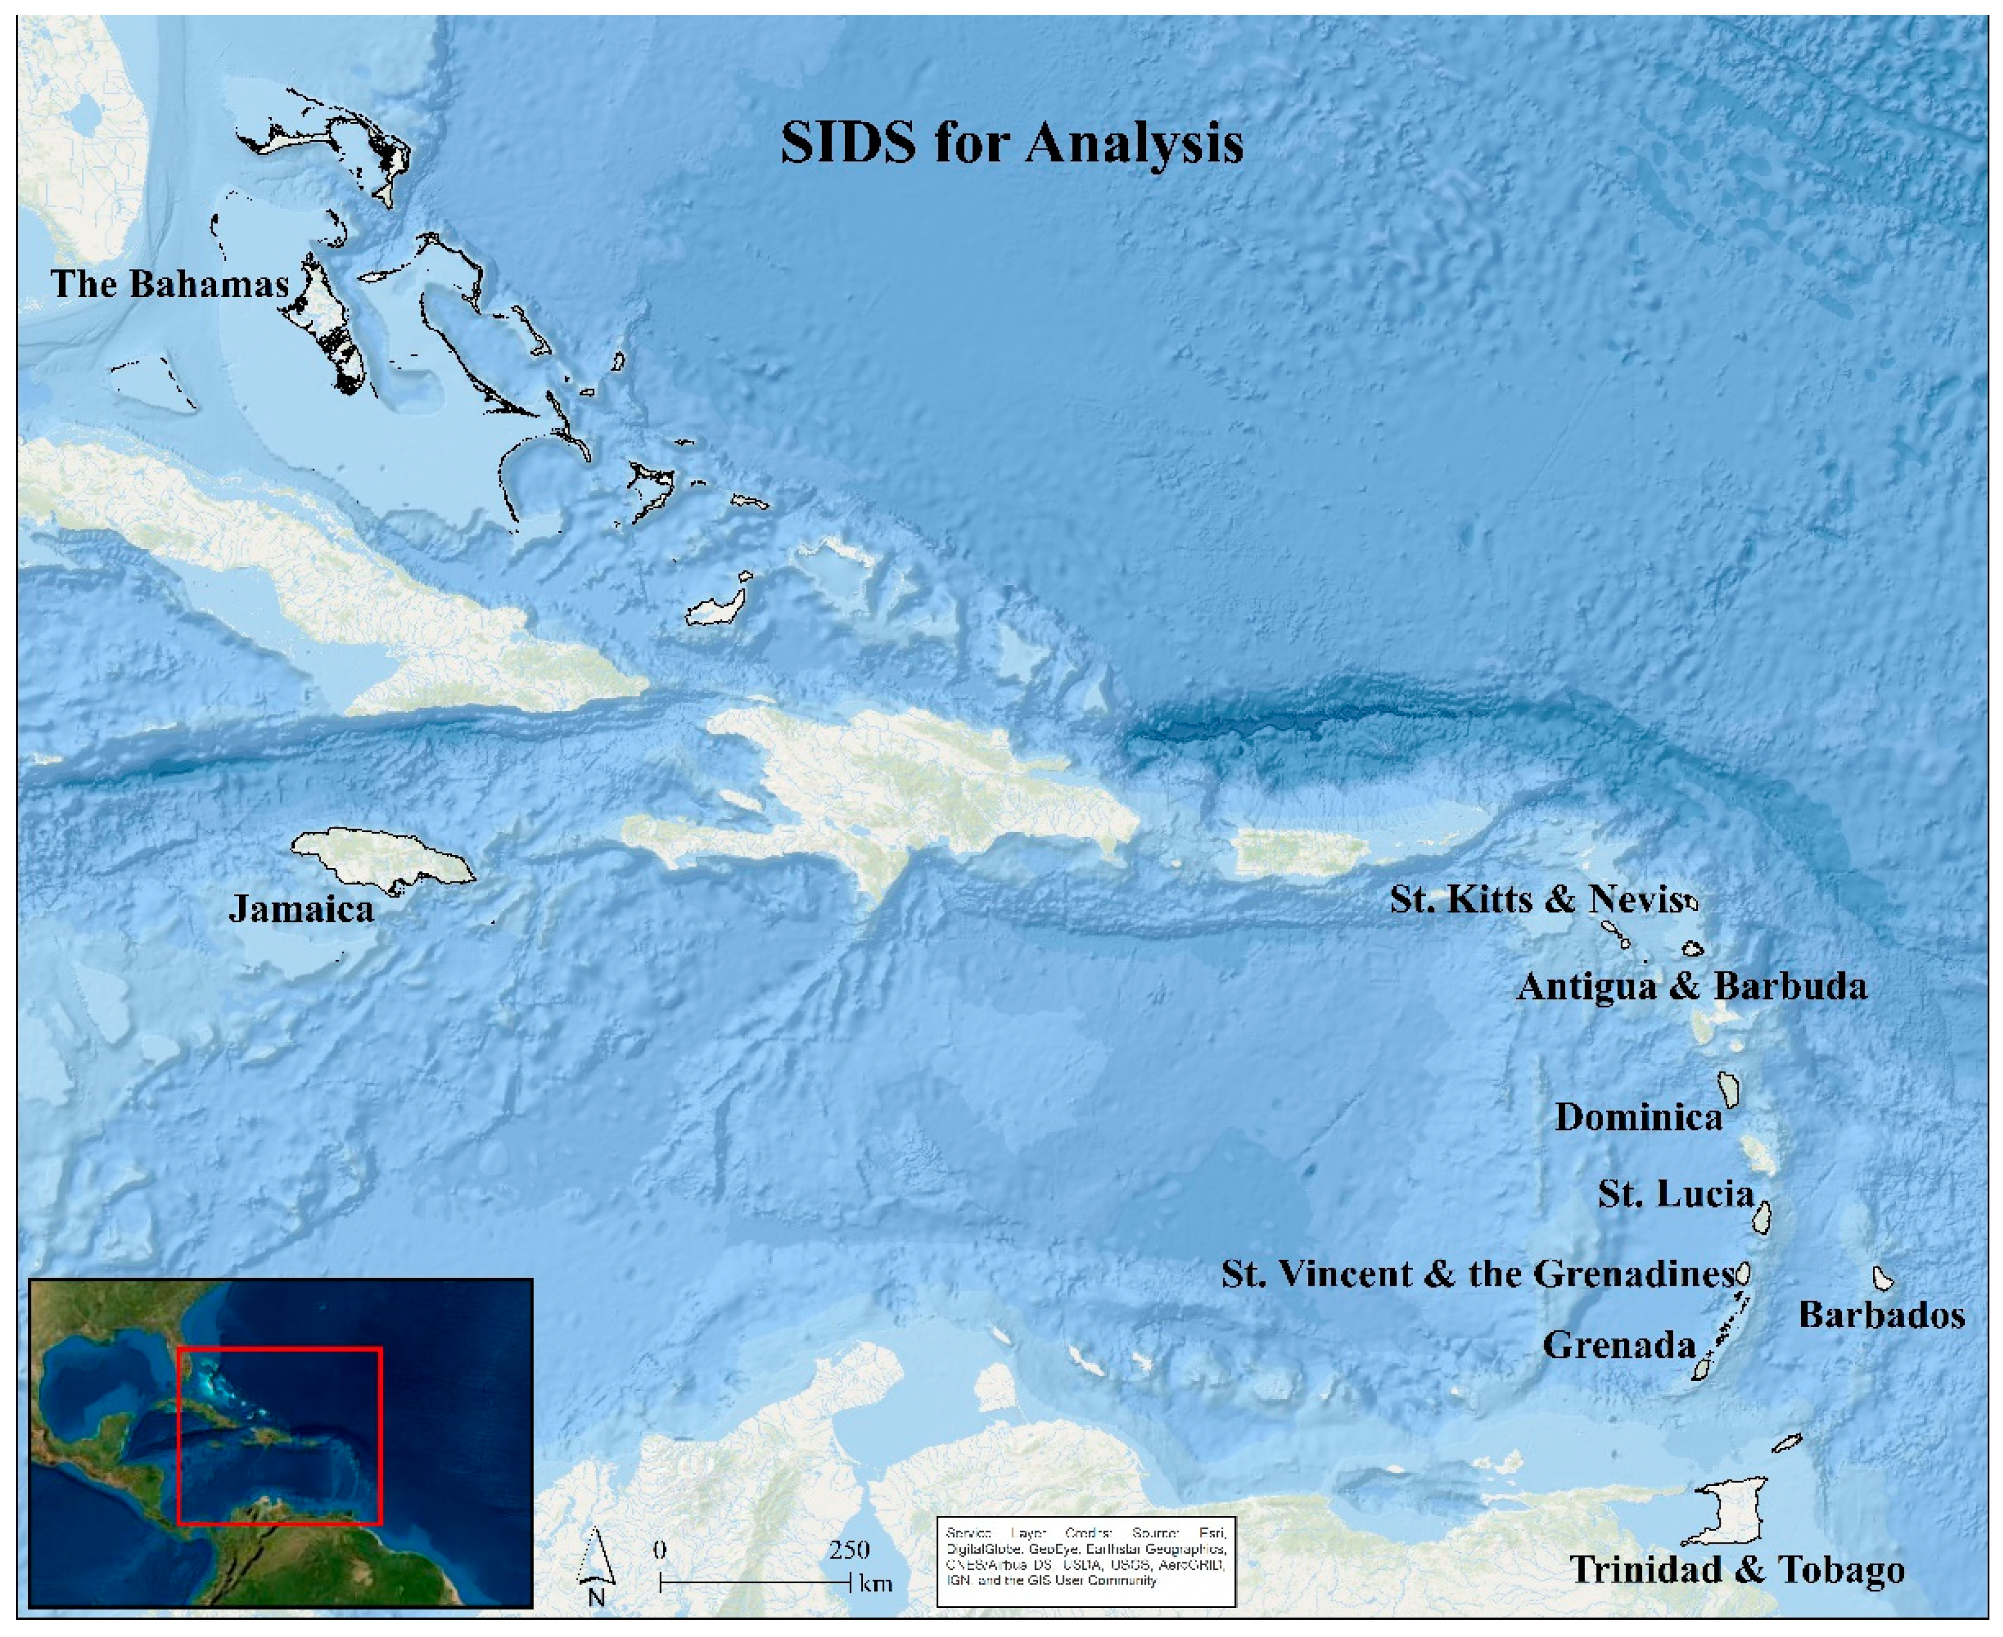
2.1. Study Sites and Physical Characteristics

Ten of the sixteen Caribbean SIDS from across the basin for which there were sufficient data for analysis for WEF parameters were included in this study (Figure 1). Surface areas ranged from 261 km2 (St. Kitts and Nevis) to nearly 14,000 km2 (Bahamas), maximum elevation from 64 m (Bahamas) to 2256 m (Jamaica), and agricultural area from 60 km2 (St. Kitts and Nevis) to 4550 km2 (Jamaica) (Table 1). Most countries had populations under 1 million; however, values ranged from around 53,000 (St. Kitts and Nevis) to 3 million (Jamaica). Gross domestic product (GDP) ranged from 800,000,000 (Dominica) to approximately 43 billion (Trinidad and Tobago).

2.2. Current WEF Nexus and Island Sustainability

Renewable freshwater resources (m3/year), water produced by desalination (m3/year), and per capita water use (m3/year) data [32] were compiled for each country from the FAO AQUASTAT database [33], and population data were compiled for each SIDS from the CIA World Factbook [31] to calculate water availability per capita (m3/capita/year) and total water use per year (m3/year).
Two water availability indicators were then calculated: the WHO Required Water Availability (7.3 m3/capita/year) [34] and Falkenmark Water Stress Indicator [35]. The latter measures water scarcity based on annual freshwater availability per capita thresholds at the country level [32], which are water quantities necessary for human societal needs. Falkenmark water scarcity indicators are widely used to assess water security for countries [36] and recognize three levels of water availability: water stress (1700 m3/capita/year), water scarcity (1000 m3/capita/year), and absolute water scarcity (<500 m3/capita/year). Nations in the water stress category do not reach thresholds required for agricultural, domestic, and industrial uses, while those in the water scarcity range of 500 and 1000 m3/capita/year fail to meet basic freshwater demands of their population and are in danger of slipping into “absolute water scarcity” and experiencing constant water shortages and nation-wide restrictions on water use.
Previous authors and the World Bank have indicated that the Falkenmark index is a useful and straightforward measure of water scarcity when observing water data at a country level, although the index fails to consider societal and geographic differences between countries [32,37,38]. Due to the lack of sufficient available data in the Caribbean SIDS, the Falkenmark index was chosen as the measure of water scarcity for individual SIDS.
Energy data for each country included World Bank indicators of population access to electricity, power losses, and renewable energy consumption [39]. Access-to-electricity values for each country were compared with Latin America and Caribbean (LAC) and world values. Data for power losses and renewable energy production, where available, were compared with LAC and global values. A “fail” was given to SIDS that did not meet LAC averages for electricity access and world averages for power loss and renewable energy consumption.
Data for food resources included food supply variability, dietary energy supply adequacy, cereal import dependency ratio, and annual estimates of undernourishment based on reports of the Food and Agriculture Organization of the United Nations [40]. Average dietary energy supply, cereal import dependency ratio, and food supply variability for each SIDS were compared with LAC and world averages.
Evaluation of sustainability under current conditions (pass or fail) for individual SIDS consisted of two stages. First, the sustainability of each WEF component was based on resource base versus human demand, then overall sustainability of the SIDS was based on the average of the three WEF scores. Countries that failed most parameters for either energy or food sectors then failed that sector. For the water sector, Falkenmark indicators were used to identify water stress for each country and designation of pass/fail for the water sector. Individual country sectors that met or exceeded the Caribbean values in the energy and food sectors or maintained values above Falkenmark indicators for the water sector were classified as “pass” for that sector and were not analyzed further. Although sectors are measured individually, each contributes to the WEF nexus via the intrinsic linkages between each sector [1]; therefore, by failing one, other sectors are negatively impacted. In this study, failing multiple categories of the WEF nexus indicates a failure to be sustainable under measured conditions.

2.3. Projected Climate Change Impacts on Sustainability by 2050

The sustainability of the WEF Nexus in each SIDS to 2050 was assessed relative to projected populations and climate change impacts. Population was modeled using growth estimates from the CIA World Factbook [31] and combined with precipitation rate changes [30] to calculate water use in 2050. Determination of pass/fail for each WEF parameter followed the methodology described for current sustainability.

3. Results and Discussion

3.1. Current WEF Nexus and Island Sustainability
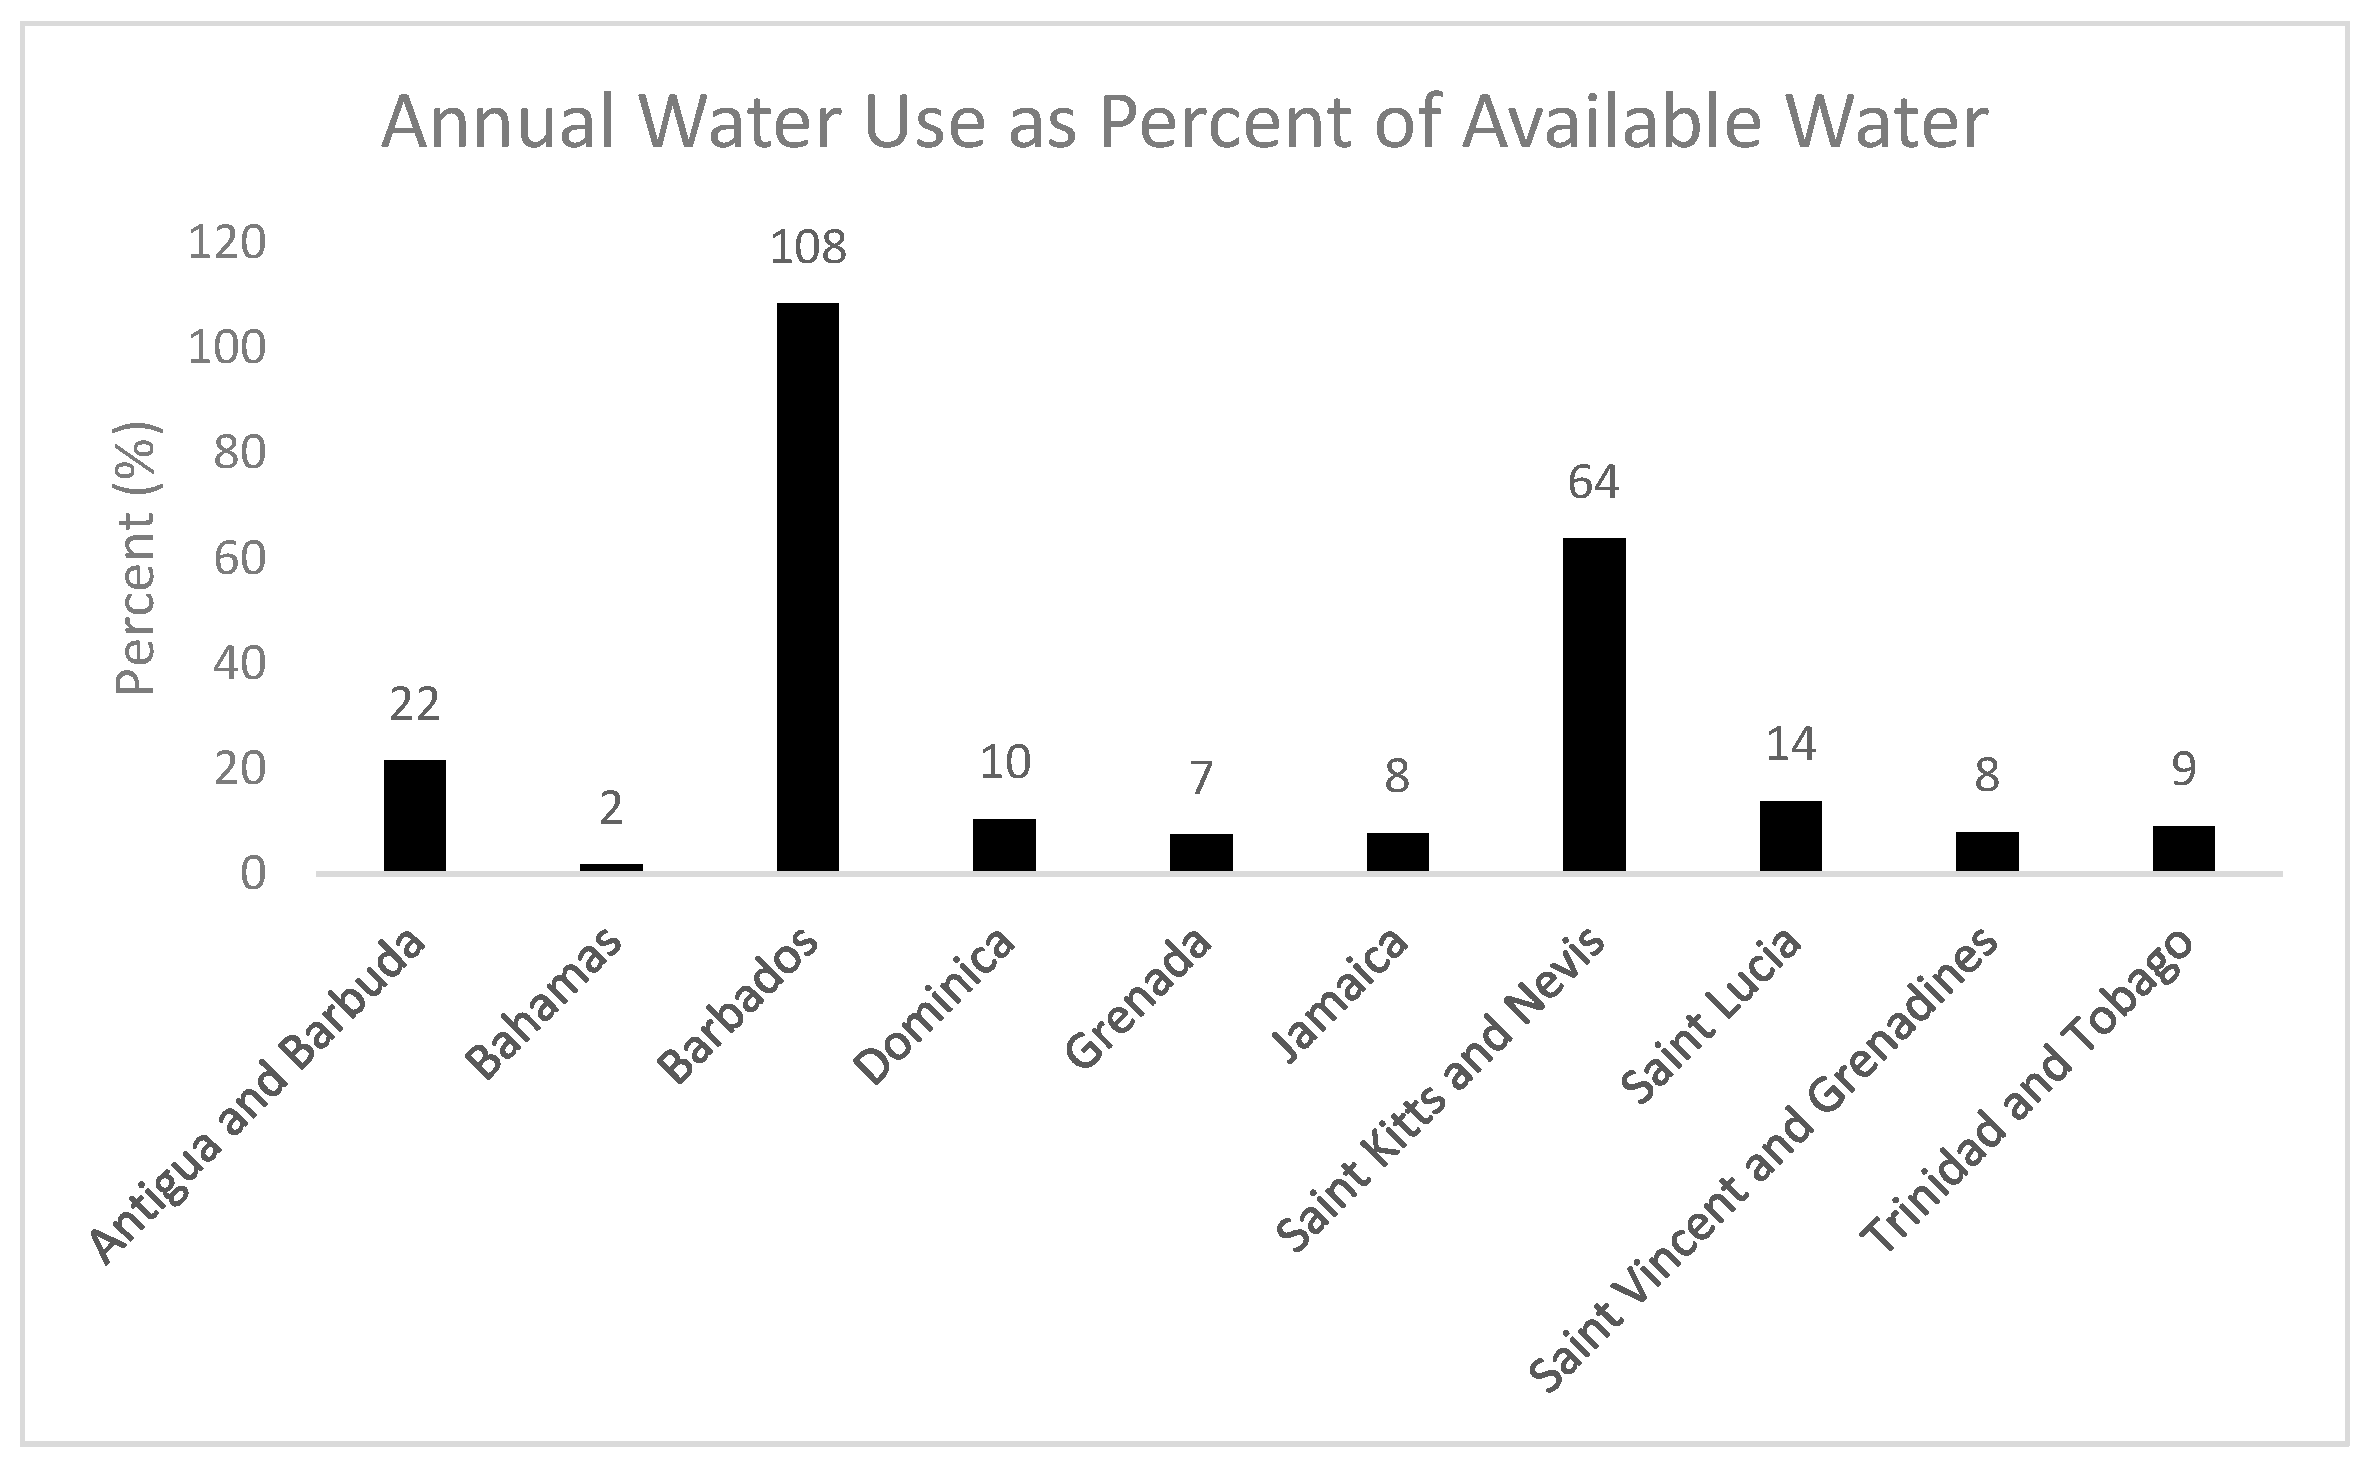
3.1.1. Water

Annual available water for individual Caribbean SIDS (Figure 2) was based on FAO calculations of renewable annual freshwater resources, combining the average flow of rivers, rainfall, and aquifer recharge from precipitation. Although evapotranspiration was not included in the FAO database, this likely had minimal impact on our calculations because of the general lack of surface water for most of the islands of this study.
All islands in this study met the WHO minimum available water requirement (7.3 m3/capita/year). Six nations, including the two largest of this study (Jamaica and Trinidad and Tobago), have adequate available water, but three (Antigua and Barbuda, Barbados and St Kitts and Nevis) were in the absolute water scarcity category of the Falkenmark index, and St. Vincent and the Grenadines was within the water scarcity category. The water supply for St. Vincent, which is dependent on surface water, was destroyed by the La Soufriere volcano eruption of 2021, pushing the island into the absolute water scarcity category at least for the near term. All four failed to meet the minimum available water value of 1700 m3/capita/year.
Desalination plants are operational in Antigua and Barbuda, the Bahamas, Barbados, Jamaica, St. Kitts, St. Vincent and the Grenadines, and Trinidad and Tobago and contribute significantly to their available water base [41], but their contribution to annual water availability was not included in the FAO database. Although St. Kitts and Nevis changed from absolute water scarcity to water-scarce for the Falkenmark indicator when the contribution of desalinated water was included, the designation of pass or fail did not change for any Caribbean SIDS (Table 2).
Falkenmark indicators, while valuable, do not completely account for the special conditions of Caribbean SIDS. There are pronounced wet and dry seasons in the Caribbean, and both El Nino/La Nina cycles and interannual differences in hurricane paths and intensity can bias generalized calculations of annual water availability. Although small, many Caribbean islands display major differences in water availability depending on which side of the mountains is evaluated; this is associated with rain shadow effects, with windward being humid and leeward arid. There are also cultural differences in water use between countries, in part a reflection of poverty and access to water resources.
Annual water use was compared to available water resources for each Caribbean SIDS (Figure 3). Except for Antigua and Barbuda, Barbados, and St. Kitts and Nevis, all Caribbean SIDS of this study, regardless of size, use less than 20% of annual available water. St. Kitts and Nevis is using 64% of its annual renewable water, while Barbados has a deficit of 8%, associated with the over-pumping of groundwater. Both countries also were characterized as “absolute water scarcity” (Figure 2), potentially leading to a loss of water security for both. St. Vincent and the Grenadines, while experiencing water scarcity, used only a fraction of the available water (8%) prior to complete water system breakdown following the eruption of the La Soufriere volcano on St. Vincent in 2021.
The lack of agreement between the degree of water stress/insecurity (Figure 3) and the percent of available water utilized (Figure 4) for the 10 Caribbean SIDS is attributed to aging infrastructure and water access for island populations [42]. Although most of the SIDS claim that both rural and urban populations have access to improved water supplies [43] (Table 3), the water supply system of Miches, Dominican Republic, is considered typical of the reality of water supplies on many Caribbean islands [44]. As common on many islands, the source of municipal water for Miches is a mountain stream, with a small dam to feed the water into a pipe that delivers water via gravity to a storage tank just above the town. It is then chlorinated to some degree and gravity-fed into the town. The more affluent families have storage tanks on top of their houses that they fill when municipal water is flowing; thus, daily water volume decreases downhill to a point that the low-lying areas of the town rarely receive water in their homes.
Prior to 2010, poor people in Miches, most of whom lived above the water storage tank and thus lacked access to the gravity-based municipal system, obtained water by rainwater collection at their homes, collecting leakage that flowed across the ground from the rusting storage tank for the town, or sending children to beg at downhill homes for water. If they were not successful by the time they reached the low-lying area of town, they filled their containers with contaminated river water and returned home. Only after the water situation and governmental indifference were exposed was a new tank suddenly installed in 2010. While improving water delivery for the downhill town, the poor lost a water supply provided by the leaking tank [44].
The Miches experience is similar to that in many other Caribbean SIDS [41]. Grenada, St Vincent and Grenadines, and Dominica fail to meet water demand during the dry season because of low stream flow, with Dominica losing 50% loss of its water supply. Intact and effectively managed mountain forests are critical for both retaining water into the dry season and maintaining a base flow in streams and reducing peak flows during the wet season, resulting in slope and channel erosion and flooding downstream. Unfortunately, deforestation of mountain slopes for agriculture and forest products above water intake pipes in streams, as observed at Miches, Dominican Republic, after 2009, is a major management issue throughout the Caribbean. Upper watershed mismanagement has resulted in coastal urban areas in both St. Lucia and Trinidad and Tobago experiencing major flooding, sediment deposition, and overall reduced water flow during the dry season [41], and recent catastrophic damage to watersheds in St. Vincent by volcanic ash and fires in 2021 has contaminated stream-sourced water supplies and increased downstream flooding and sedimentation.
UNICEF/WHO [43] also reported that over 90% of rural and urban areas in all Caribbean SIDS of this study had improved wastewater treatment (Table 4). This is in stark contrast to Pan American Health Organization findings that 85% of waste enters the Caribbean Sea untreated, 51% of households lack any kind of sewer connection, and only 17% are connected to adequate collection and treatment systems [41]. Cesspools are the most usual form of wastewater “treatment” in both rural and urban areas, where wastewater is simply stored until it can be pumped out for treatment elsewhere. Such systems are rarely monitored by governments and leach into groundwater or discharge into streams during floods.
Cashman [41] listed the key challenges to water sustainability in Caribbean SIDS as a general lack of data, frequent inability to access the existing data, neglect of planning for water resources, and lack of progress on national water policies. Antiquated and poorly maintained infrastructure in Barbados, for example, results in 40% loss of municipal water from broken pipes and leakage and increased likelihood of contamination from wastewater sources. Major driving forces affecting SIDS water sustainability are increasing urbanization on coastal areas, antiquated or missing infrastructure, economic and environmental impacts of rapidly expanding tourism, projected climate change impacts, and mismanagement of inland mountain ecosystems for water conservation. Crisman et al. [42] noted that while water resources and the environment in general in Puerto Rico are resilient to catastrophic events such as Hurricane Maria, sustainability is threatened by failed infrastructure and governance.
Discrepancies for water availability and quality in the Caribbean SIDS hinder the assessment of short and long sustainability of water resources to meet societal and environmental requirements. In addition to data availability, part of the problem results from definitions and perceptions of human acceptance levels for often inadequate supply and quality. Health is often forgotten in discussions of water sustainability. It is critical that safe and adequate water is available in both rural and urban areas throughout the year at locations that do not put an undue burden on populations to obtain them. Water is a basic human right that must be honored. All Caribbean SIDS currently experience periodic, seasonal, or looming problems for water sustainability, but Antigua and Barbuda, Barbados, St. Kitts and Nevis, and St. Vincent and the Grenadines currently fail in the sustainability of the water sector.

3.1.2. Energy

Both the Caribbean basin and Latin America provided electricity to 97% of their populations in 2018 compared to the global average of 87% [30]. All Caribbean SIDS of this study exceeded the world average for national electricity access of populations (98% versus 90%), and only Grenada (95%) was slightly below the LAC average of 97% [30]. Access must be viewed in the context of societal acceptance of planned or periodic outages.
Electric distribution grids in Caribbean SIDS are mostly centralized and considered antiquated and inadequate by current standards [42]. The global average for electric power losses in distribution grids in 2014 was 8% of total output, whereas the LAC average was double that (16%) [30]. Power loss for three Caribbean SIDS, Antigua and Barbuda (24%), Jamaica (27%), and St. Kitts and Nevis (19%) greatly exceeded global and LAC values and were considered failing in this parameter, but the remaining seven SIDS of this study together met the global value (7.5% average) and are considered passing.
Most Caribbean SIDS rely on fossil fuel imports to power local generation plants (Table 5). The great variability in the percent of total imports comprised of petroleum, in part, reflects the availability of petroleum reserves locally and the importation of electric energy from other SIDS. Renewable energy (geothermal facilities, onshore wind farms, solar power) account for less than 10% of power generation for Caribbean SIDS, except for Dominica, which generated 28% of its domestic needs by hydroelectric in 2015, thus meeting or exceeding LAC (28%) and global (18%) averages [30].
Caribbean SIDS were categorized as failing in the energy sector if they failed in two or more energy parameters (Table 6). Antigua and Barbuda, Grenada, Jamaica, and St. Kitts and Nevis failed the energy sector due in part to distribution losses and low renewable energy output. Centralized power grids are extremely sensitive to natural disasters, including hurricanes and earthquakes [42], and the only hope for power sustainability is to promote decentralized power grids with greater reliance on alternative electric generation, especially solar.

3.1.3. Food

The FAO [45] reported that Caribbean SIDS are extremely reliant on food imports, with individual islands facing high trade costs and an inability to meet food safety and quality thresholds. Imports often exceed 80% of the total food supply even if, as in the case of Puerto Rico, there is sufficient land to produce the bulk of the food required [42]. Although there has been a gradual reduction in the percent of the Caribbean basin population suffering from chronic undernourishment since 2000, the value of 18% was approximately double that of America (5%) and Central America (6%) in 2018 [40]. It is not clear, however, the extent to which these values reflect the lack of agricultural land, funds to import food, or an inadequate food distribution network.
Average dietary energy supply adequacy (ADESA) is the theoretical threshold food supply needed by a nation to feed its population adequately and is expressed as a percent of available calorie supply to daily population needs. Three Caribbean SIDS (Antigua and Barbuda, Grenada, St. Lucia) failed to meet minimum daily calorie needs for their populations by 1–7% in 2016–2018, signaling potential food insecurity.
Food production across the Caribbean region has been declining since the 1980s [45,46]. SIDS often have limited agricultural land and are forced to rely on food imports. Cereal import dependency is an indicator used by FAO to understand the relationship of imported cereals to produced cereals. Globally, nations export approximately 1% of their cereal production, but all Caribbean SIDS imported 100% of their cereal needs, thus increasing their susceptibility to food insecurity issues. Finally, all Caribbean SIDS of this study experience daily instability in their daily and annual food supply annually. In 2013, the global average variability in daily calories per capita was 6 kcal/capita/day, while all Caribbean SIDS greatly exceeded this, with daily values ranging from 19 kcal/capita/day (St. Vincent and the Grenadines) to 102 kcal/capita/day (Antigua and Barbuda), suggesting food insecurity.
A final food sector score for each SIDS was based on the three parameters: food adequacy, cereal import, and food supply variability (Table 7). SIDS that failed for two or more food parameters were classified as failing for the food sector (Table 8). While most SIDS had adequate food supplies, all failed both cereal import and food supply variability and, thus, were classified as failing the food sector.

3.1.4. Current WEF Sustainability

Final classifications for each WEF sector were combined for individual Caribbean SIDS (Table 8) to determine overall sustainability. Over half of the SIDS failed at least two sectors of the WEF and were deemed to lack sustainability under current conditions. Only 3 of the 10 SIDS (Bahamas, Dominica, and Trinidad and Tobago) failed one sector (food, as did all SIDS) and were considered currently sustainable. The remaining seven SIDS failed at least two sectors and were categorized as unsustainable, including two SIDS that failed all three sectors (Antigua and Barbuda, St. Kitts and Nevis).

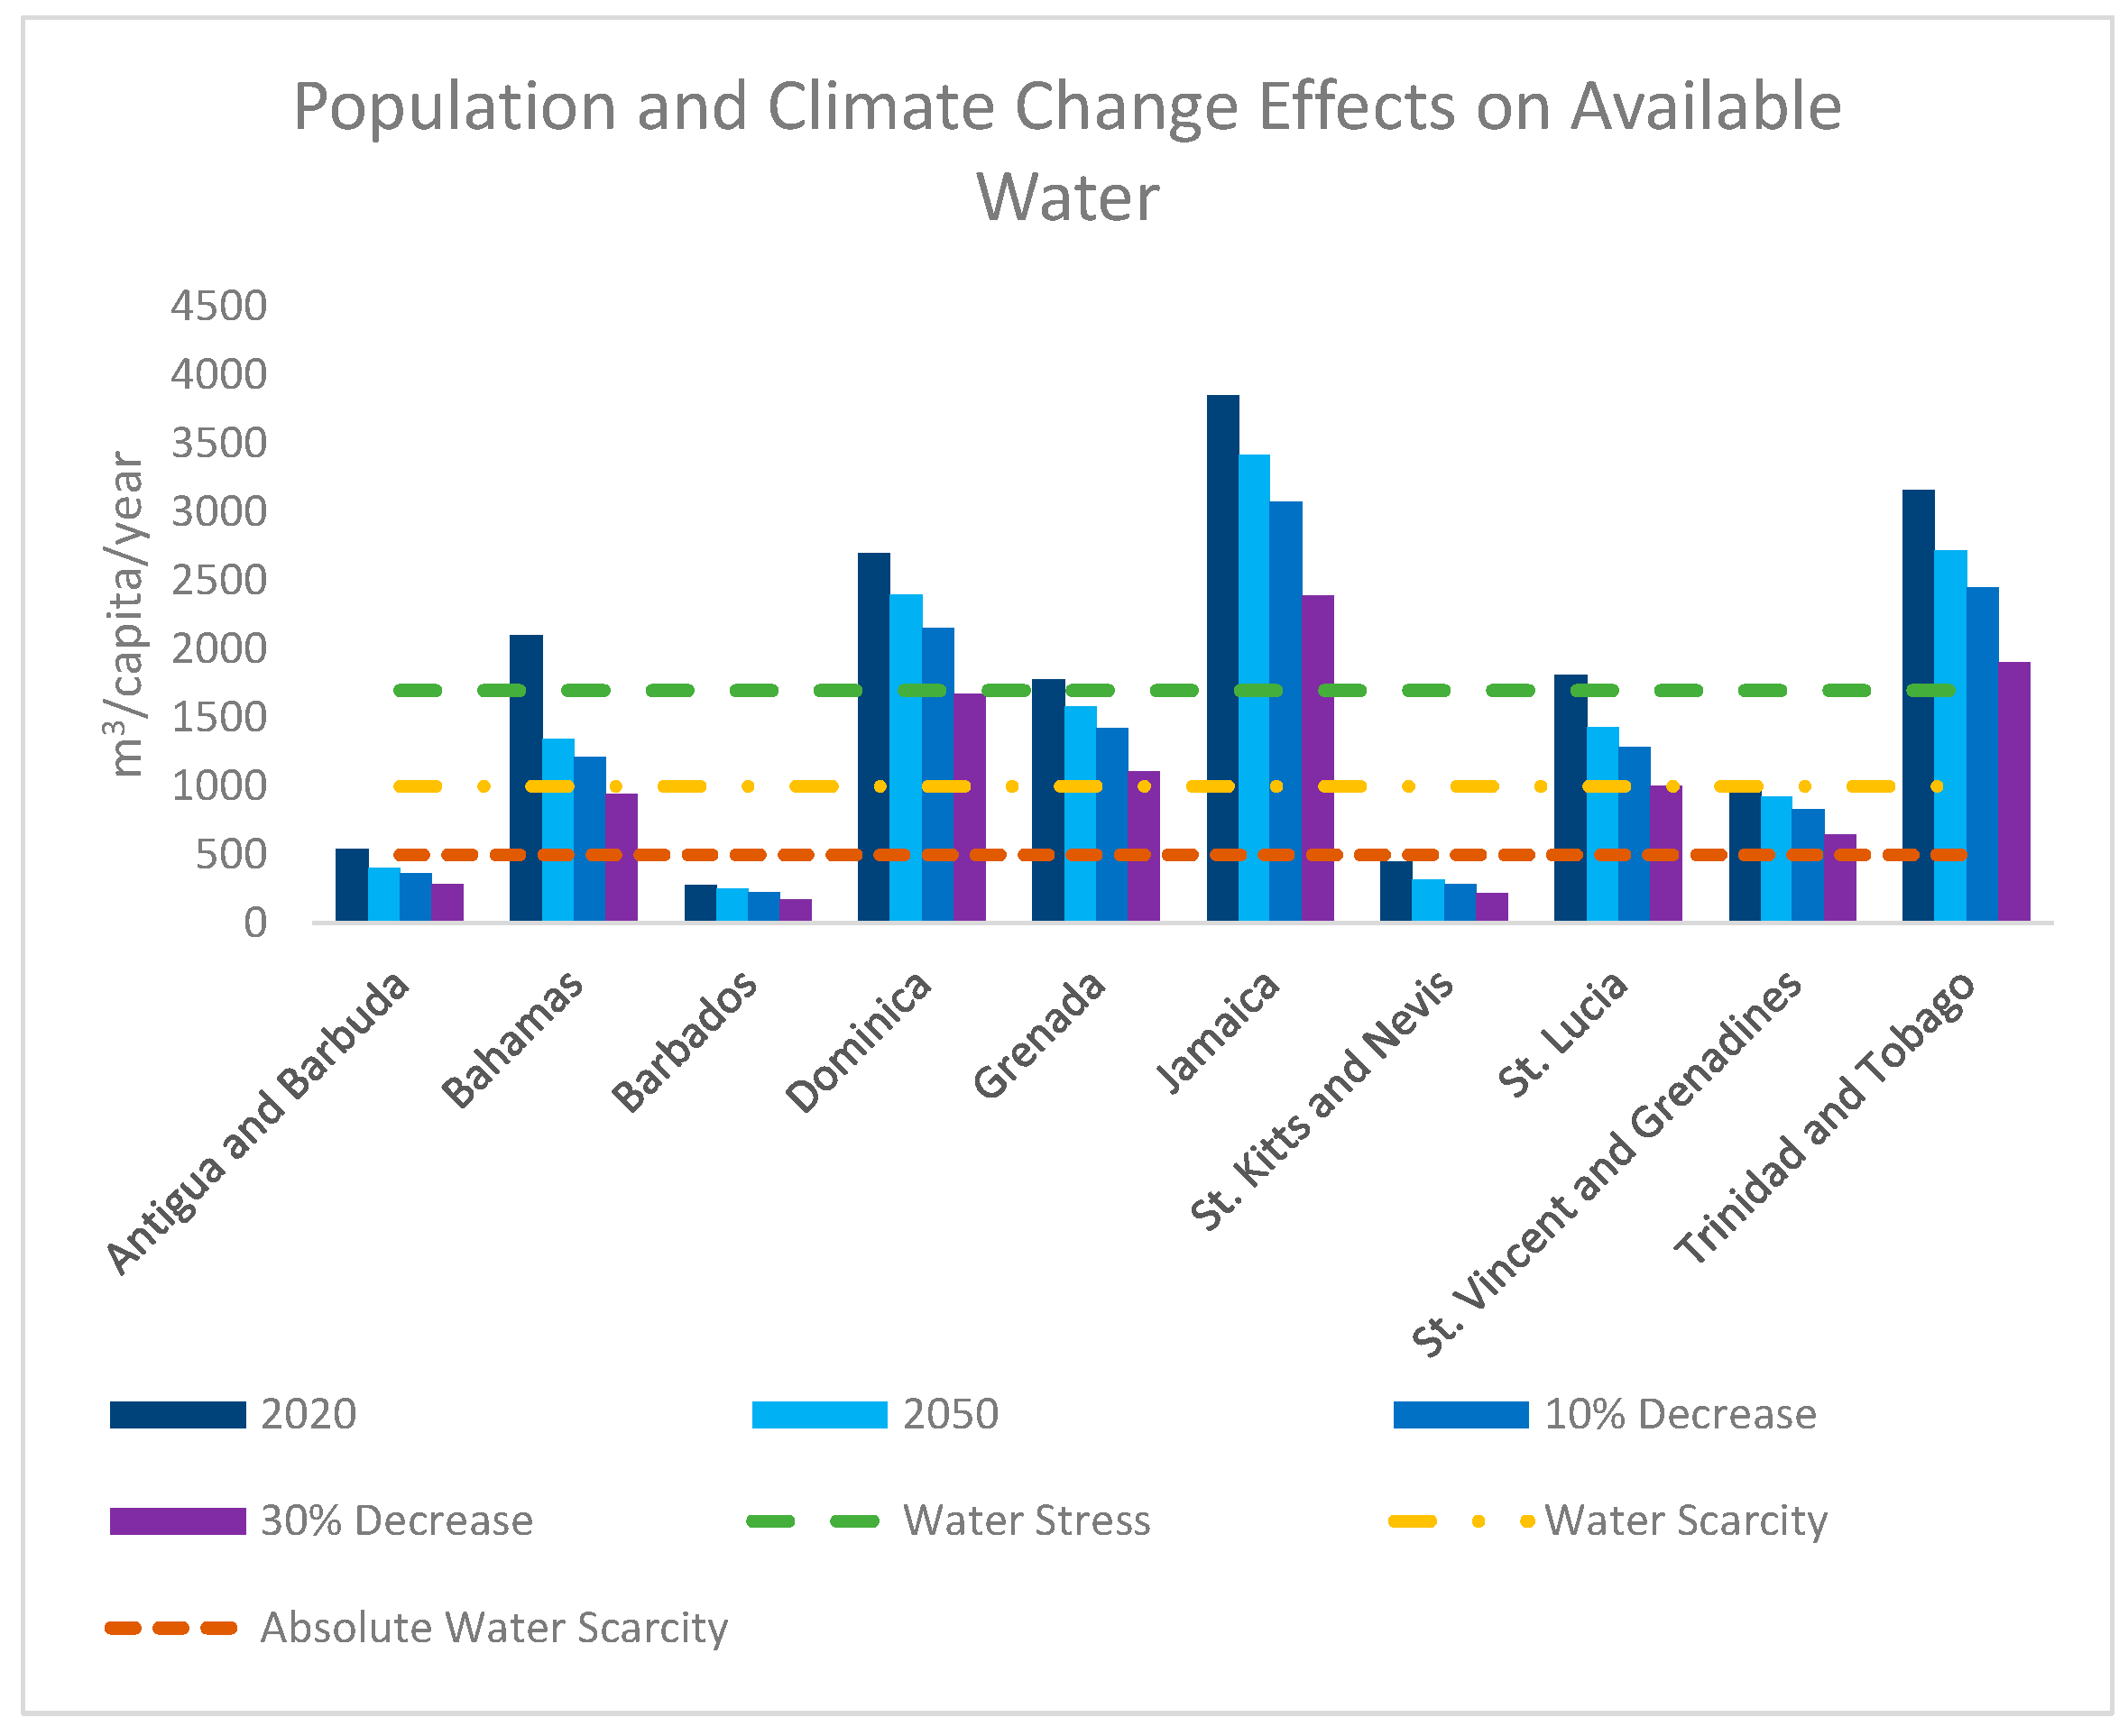
3.2. Projected Climate Change Impacts on Water Sustainability by 2050

Water availability estimates for each SIDS in 2050 were calculated using population growth rates for 2020 from the CIA World Factbook [31] (mean 0.67% increase per year, range 0.2–1.2) and current water use per capita, which were then compared with 2020 values and Falkenmark indicators (Figure 4). Two of the three highest population growth rates were for Antigua and Barbuda and St. Kitts and Nevis, both currently with serious water insecurity. The Bahamas has the highest population growth rate (1.5%) and is projected to display the greatest change in water security, slipping from sustainable into water stress by 2050, as will Grenada and St. Lucia, currently borderline sustainable.
Precipitation is projected to decrease by 10–30% over the Greater Antilles and eastern Caribbean, with Trinidad and Tobago experiencing a 10% decrease [30]. As precipitation has the greatest impact on water availability, conservative estimates of a 10–30% decreased water availability were assumed for the Caribbean basin by 2050. The two precipitation scenarios were then added to projected population growth rates to estimate the overall impact on Falkenmark indicators (water stress, water scarcity, and absolute water scarcity) for each Caribbean SIDS (Figure 4).
With a 10–30% decrease in available water from reduced precipitation, three of six SIDS currently above Falkenmark indicators (Bahamas, Grenada, St. Lucia) would become water-stressed. The two largest islands, Jamaica and Trinidad and Tobago, are projected to remain highly sustainable for water even with a 30% decline in annual precipitation. Dominica will also remain sustainable except under the 30% decline scenario. Unfortunately, Antigua and Barbuda, Barbados, and St. Kitts and Nevis are projected to become even more water-insecure by 2050 than they are currently.
In 2020, all 10 SIDS failed the food sector, four failed energy, and five failed water, resulting in seven failing two of the three sectors and being classified as unsustainable (Table 8). Two additional SIDS (Bahamas, Dominica) will fail the water sector by 2050, with only the two largest islands (Trinidad and Tobago, Jamaica) passing water sustainability (Table 9). Human demands on water resources for this study were considered conservative and did not include seasonal pressures from tourists and foreign retirees, especially in the dry season. However, they did not consider the potential expansion of desalination for water supply to increase water availability.
Nine of the ten Caribbean SIDS will be unsustainable in the WEF nexus. Only Jamaica has the potential of remaining sustainable under the conservative estimates of this study. There is great potential that many of the SIDS can return to sustainability in currently failed sectors, especially in decentralized power grids relying on alternative energy sources, infrastructure and adaptive management plans for water resources, and innovative measures to increase locally sourced food in both rural and urban areas. The key to a sustainable future is responsible government, as demonstrated for Puerto Rico [42].

3.3. Governance and SIDS Sustainability

On the whole lacking, the nations of the Caribbean face significant challenges in maintaining infrastructure, enforcing the rule of law, controlling corruption, providing services, and growing economies. Collectively, these shortcomings impair the ability of Caribbean governments to implement sustainable, long-term development strategies, undermine resiliency, and, as discussed earlier, lead to WEF nexus vulnerability. Given the small size and limited resources of many island nations, there is a tendency—attributable to budget and capacity constraints—to respond to rather than address systemic problems. There is a reluctance, because of cost and political will, to fully embrace solutions to strengthen the legs of the WEF stool. That said, there remains an opportunity to better prepare SIDS for climate change by enhancing regional cooperation and coordination through organizations such as CARICOM; aid from larger foreign partners, especially the United States, which has increasingly supported sustainability, especially alternative energy sources; and financial and capacity support from international institutions such as the Inter-American Development Bank.
In recent decades, the expansion of democracy to most of the Caribbean region has been a positive development that, if sustainable, will induce increased accountability, a necessary prerequisite of good governance. In fact, with the exception of Cuba, an authoritarian regime, and Haiti, which is essentially a failed state, the Caribbean basin is democratic today. In 2020 alone, Guyana, Suriname, the Dominican Republic, and Belize successfully held elections that resulted in a peaceful transfer of power, while several other states held elections deemed free and fair, resulting in incumbents retaining power [47].
Caribbean governance challenges fall into two broad categories: the historical context and capacity/performance limitations. Caribbean SIDS have colonial histories, the legacy of which is that the foundation of governments was not to meet the needs of its citizens. Second, the governments themselves have limited financial and technical resources, especially data collection, which makes it difficult for SIDS to adapt to climate change and prepare for extreme weather [48]. Of course, by failing to invest upfront, the cost of recovery after hurricanes, volcanoes, and other natural disasters increases exponentially.
History and geography contribute directly to governance challenges. Caribbean SIDS were colonies, with governments designed to serve European colonial rulers, and later the United States, which has long played the role of regional suzerain. Moreover, the Caribbean region’s demographics, economic development, and ultimate government structures were also shaped—largely adversely—by slavery, exploitive agricultural policies, often unbalanced trade arrangements, global ideological conflicts, and, more recently, tourism. It bears mentioning that most Caribbean nations have only secured independence recently, including the smallest nation, St. Kitts and Nevis, in 1983. Newly independent nations, some incredibly small with limited resources, not only lack capacity and financial wherewithal but, in many cases, still seek a good governance formula. Accountability through the ballot box is an encouraging development, but by no means has it yet equated to WEF security.
Haiti, Cuba, and the Dominican Republic have been independent for much longer periods of time than their neighbors, but all have histories replete with authoritarian rule, instability, and US military occupation. All have had endemic corruption. Additionally, each has experienced natural disasters that have led directly to political instability; instability, in turn, led to governmental failure to protect the WEF nexus and ultimately resulted in political change—the most glaring example being the 2010 earthquake in Haiti, which killed up to 300,000 people and left 1.5 million people displaced, nearly 33,000 of whom were still displaced as of January 2020 [49].
Haiti’s history is as inspiring as it is tragic. Winning its independence from France in 1802, Haiti was essentially shunned by the international community for decades, which had profound implications on governance. The government was starved for money, and it contributed to a culture of corruption that has endured to the present. Why the exclusion? The United States saw the first black republic as an existential threat to slavery and the plantation system of the South [50]. Britain invaded Haiti and later saw it a threat to its colonial holdings and the plantation system elsewhere in the Caribbean, which produced sugar and other agricultural products—and huge revenue—for the Empire. France eventually recognized Haiti, but the price of recognition was that despite winning its independence, Port-Au-Prince was forced to pay a massive indemnity that distorted economic development for decades. The more starved for cash, the less efficient the government. Later, foreign intrigue and debt led to a lengthy American occupation; the Americans essentially perpetuated a plantation system and worked to dismantle the informal, community-based governance structure that then existed on the island [51]. Haitian agriculture has traditionally been geared toward export markets rather than internal needs. The plantation system resulted in deforestation—a problem acknowledged but not addressed in Haiti’s first constitution [51]. The infrastructure is antiquated, and while foreign assistance has periodically been used to meet needs, it has provided short-term relief rather than longer-term sustainable development. Tourism has generated income in the past, but government volatility has essentially destroyed the industry.
The collapse of Haiti’s tourism industry serves as an example to other tourism-dependent nations of the region. Tourism is always vulnerable to political unrest, natural disaster, global economic cycles, and—as seen in the past year—pandemics. The International Monetary Fund found significant economic contraction amongst Caribbean nations in 2020, with several declining by over 15% [52].
Then, there is the example of Puerto Rico, where WEF nexus vulnerabilities are directly tied to governance. Under Puerto Rico’s “commonwealth” status, which, at its core, is colonial, there is confusion as to whom—Washington, San Juan, or municipalities—is ultimately responsible for making, funding, and implementing decisions. This lack of clarity, perhaps more than any other factor, led to a prolonged economic downturn, bankruptcy, deterioration of critical infrastructure, loss of population, and a shrinking tax base, with no viable path to recovery long before the devastating hurricanes of September 2017. Puerto Rico has been, and remains, extremely vulnerable to natural disasters and the effects of climate change [42].
Understanding why Puerto Rico is vulnerable is illustrative of problems throughout the Caribbean—perhaps even more so because the commonwealth is larger in size and population than most of its neighbors and, for better and worse, tied to the United States politically. At the time of American occupation in 1898, Puerto Rico had an agriculture-based economy. The economy suffered greatly when crop prices dropped, particularly during the Great Depression. This led Washington and, after quasi-independence in 1950, Puerto Rican political leaders to explore other economic development options—centered on industrialization and building modern infrastructure [53]. Even with protectionist policies such as the Jones Act impeding growth, these development plans succeeded in growing the economy and raising human development indicators. For example, average income, adjusted for inflation, rose from USD 718 in 1960 to USD 28,704 in 2013 [53].
However, Puerto Rico’s growth stopped abruptly when Washington eliminated tax incentives and the island had to compete on the global marketplace with nations offering cheaper labor and overhead costs. As explained by Crisman et al. [42], Puerto Rico lost half its manufacturing jobs over a 20-year period ending in 2017 [54] and was also hit harder by the Great Recession of 2008 than Americans living stateside. Puerto Ricans emigrated in mass numbers to the U.S. mainland, resulting in a reduced tax base, insolvency at the central and local government levels, deteriorating infrastructure, and a reduction in the quantity and quality of services. Collectively, this left the island highly vulnerable to the hurricanes that devasted Puerto Rico in September 2017.
Cashman [41], among others, cites a laundry list of governance strengths and weaknesses, as well as opportunities for betterment, in the Caribbean water sector; the findings can be applied the other WEF components too. On the negative side of the ledger, the region has both aging infrastructure and an aging population. The water sector is underfunded, data is sparse, economic growth is low, and costs of adapting to climate change are high. On the positive side, living standards are rising, the political economy is more stable than in the past, and there is regional consensus that more must be done to combat climate change [41]. Finally, lingering in the past is the continued involvement of the United States in the region. The US has been a malevolent force at times but has the potential to provide largess to address all aspects of the WEF nexus. Indeed, Washington can provide high levels of assistance from the public and private sectors to respond to or prepare for crisis.
As with the physical environment, there is great diversity in the history of governance among Caribbean SIDS. Clearly, the historical context of each island has had a profound impact on the capacity and performance of governance to manage the WEF nexus. Individual sectors of the nexus are usually the mandate of separate government departments, and policymakers do not understand how multiple issues derive from one environmental driver [19,55]. There is a critical need to develop robust monitoring and reporting systems for the Caribbean SIDS that are capable of recognizing the individuality of each island as well as being able to implement adaptive management approaches, especially cost-effective nature-based solutions, to meet imbalances in the WEF nexus before tipping points are reached, beyond which sustainability will collapse [9,23,56]. The land areas of most SIDS are so small and resources so limited that there is no room for trial and error in management.
The message is clear for Puerto Rico [42] and the current assessment of Caribbean SIDS that both environment and human communities are resilient while infrastructure and governance are not. Governments are either unwilling to change or lack robust, reliable data to make decisions. Communities are willing to step up to meet climate challenges but need information and analytical tools. The private sector must play a greater role in ensuring SIDS nexus sustainability. Local economies are evolving from agriculture-based economies to international tourism. For the latter to be economically sustainable, the private sector must work with governments to reduce pressure on limited local resources, reduce dependence on the importation of fuel, food, and, often, water, while increasing environmental services to local populations.

4. Conclusions

Small island developing states (SIDS) have several factors that hinder their long-term sustainability, including small size, extensive low topography, limited resources, expanding populations, and vulnerability to natural disasters and climate change. Current and long-term (2050) sustainability of 10 of 16 Caribbean SIDS with the best databases, although still inadequate, was assessed within the framework of the water, energy, food (WEF) nexus. Each WEF sector was analyzed for several sustainability indicators and averaged to estimate current sustainability; then, an overall WEF sustainability classification was developed, whereby each SIDS had to be sustainable in two of three sectors to be sustainable overall. All 16 SIDS failed the food sector, five failed water, and four failed energy. Only three SIDS were considered sustainable in 2020: Bahamas, Dominica, and Trinidad and Tobago.
Water security was estimated for 2050 based on projections for climate-change-related precipitation and population growth. All but the largest two SIDS (Jamaica, Trinidad and Tobago) are expected to fail the water sector by 2050. There is no evidence that any of the SIDS will become sustainable for the food sector, but switching to alternative energy sources, especially solar and decentralized power grids, shows great potential for energy sustainability for many. Still, all SIDS will fail in at least two sectors and be classified as unsustainable by 2050.
Water is the most important sector of the WEF nexus for the Caribbean SIDS and the most susceptible to population demographics and climate change. Climate change has already begun to affect Caribbean SIDS, with the eastern Caribbean experiencing a record-breaking drought in 2020 [57].
The Bahamas was sustainable for the water sector in 2020, but with the highest population growth rate, over double the SIDS average, it is projected to fail in the water sector by 2050. Like many of the other SIDS, the population growth of the Bahamas is likely greatly affected by the influx of expatriates for second homes and retirement properties, especially during the dry season when water resources are most stressed. The recent shift from subsistence and export agriculture to tourist-based economies throughout the Caribbean, especially in the Bahamas, has increased infrastructure demands and pressure on the WEF nexus, associated with high numbers of land-based and tourist ship visitors.
Currently, tourism is considered a net extractor of water resources [58] and a progenitor to development that leads to overall stressed natural environments in SIDS [59]. Water demand by tourism in the Caribbean was approximately one-third that of domestic use, and tourists in Barbados consumed four times as much water per capita as residents [47]. It was also noted that resorts were not paying their fair share for their domestic water use, and tourist wastewater and solid waste production were straining local infrastructure. With reliance on intact ecosystems, sustainable tourism centered around agritourism and ecotourism has become an increasingly popular tourist travel objective [60] and has great potential to add to local economies while conserving valuable natural resources and ecosystems [61].
Apparent disagreements in our data analyses for water and agriculture raise some troubling issues. In 2020, water use was less than 15% of available resources for seven SIDS, but three SIDS were considered as having absolute water scarcity; three were considered water-stressed and only four were considered water-secure. Over 90% of rural populations in Caribbean SIDS were listed as having access to improved water and sanitation, while the reality is that cesspools are the main wastewater solution in most areas. For agriculture, food imports for SIDS are reported at or near 100%, while available land for food production is not utilized.
In an assessment of natural and human systems in Puerto Rico after Hurricane Maria, Crisman et al. [42] found that natural-systems (water, geology, forests) local communities were extremely resilient to disturbance, while governance and infrastructure were not and failed. Data are scarce for many parameters and often omit important factors such as seasonal differences in resources and human demand. There is a general lack of long-term planning, disaster preparedness, and implementation of adaptive management strategies to balance the WEF nexus. There is an immediate need to focus on decentralized, alternative energy production and a shift from traditional engineering approaches to infrastructure to greater reliance on nature-based solutions, such as constructed wetlands, which are highly effective treatment options with less expense and long-term life. Finally, supply chains for food demands must be shortened to return to increased agricultural production locally, including greater emphasis on urban agriculture.

Author Contributions

Conceptualization, Z.S.W. and T.L.C.; Data curation, Z.S.W.; Formal Analysis, Z.S.W. and T.L.C.; Investigation, Z.S.W. and T.L.C.; Methodolody, Z.S.W. and T.L.C.; Visualization, Z.S.W.; Writing—original draft, Z.S.W., T.L.C. and D.T.D.; Writing—review and editing, Z.S.W., T.L.C. and D.T.D. All authors have read and agreed to the published version of the manuscript.

Funding

This research received no external funding.

Institutional Review Board Statement

Not applicable.

Informed Consent Statement

Not applicable.

Data Availability Statement

Not applicable.

Acknowledgments

The authors have no additional acknowledgment.

Conflicts of Interest

The authors declare no conflict of interest.

References

  1. Keairns, D.; Darton, R.; Irabien, A. The Energy-Water-Food Nexus. Annu. Rev. Chem. Biomol. Eng. 2016, 7, 239–262. [Google Scholar] [CrossRef]
  2. Castillo, R.M.; Crisman, T.L. The Role of Green Infrastructure in Water, Energy, and Food Security in Latin America and the Caribbean: Experiences, Opportunities and Challenges. Discussion Paper IDB-DP 00693; Inter-American Development Bank: Washington, DC, USA, 2019. [Google Scholar]
  3. Weitz, N.; Nilsson, M.; Davis, M. A nexus approach to the post-2015 agenda. SAIS Rev. Int. Aff. 2014, 34, 37–50. [Google Scholar] [CrossRef]
  4. Miralles-Wilhelm, F. Development and application of analytical tools in support of water-energy-food nexus planning in Latin America and the Caribbean. Water Monogr. 2014, 2, 76–85. [Google Scholar]
  5. Albrecht, T.R.; Crootof, A.; Scott, C.A. The water-energy-food nexus: A systematic review of methods of nexus assessment. Environ. Res. Lett. 2018, 13, 043002. [Google Scholar] [CrossRef]
  6. Zhang, C.; Chen, X.; Li, Y.; Ding, W.; Fu, G. Water-energy-food nexus: Concepts, questions and methodologies. J. Clean. Prod. 2018, 195, 625–639. [Google Scholar] [CrossRef]
  7. Simpson, G.B.; Jewitt, G.P.W. The development of the water-energy-food nexus as a framework for achieving resource security: A review. Front. Environ. Sci. 2019, 7, 8. [Google Scholar] [CrossRef] [Green Version]
  8. Stylianopoulou, K.G.; Papapostolou, C.M.; Kondili, E.M. Water-energy-food nexus: A focused review on integrated methods. Environ. Sci. Proc. 2020, 2, 46. [Google Scholar] [CrossRef]
  9. Purwanto, A.; Susnik, J.; Suryadi, F.X.; de Fraiture, C. Water-energy-food nexus: Critical review, practical applications, and prospects for future research. Sustainability 2021, 13, 1919. [Google Scholar] [CrossRef]
  10. Susnik, J.; Staddon, C. Evaluation of water-energy-food (WEF) nexus research: Perspectives, challenges, and directions for future research. J. Am. Water Resour. Assoc. 2021, 20, 1–10. [Google Scholar]
  11. Wang, Q.; Li, S.; He, G.; Li, R.; Wang, X. Evaluating sustainability of water-energy-food (WEF) nexus using an improved matter-element extension model: A case study of China. J. Clean. Prod. 2018, 202, 1097–1106. [Google Scholar] [CrossRef]
  12. Wicaksono, A.; Kang, D. Nationwide simulation of water, energy, and food nexus: Case study in South Korea and Indonesia. J. Hydro-Environ. Res. 2019, 22, 70–87. [Google Scholar] [CrossRef]
  13. Wicaksono, A.; Jeong, G.; Kang, D. Water-energy-food nexus simulation: An optimization approach for resource security. Water 2019, 11, 667. [Google Scholar] [CrossRef] [Green Version]
  14. Zeng, X.T.; Zhang, J.L.; Yu, L.; Zhu, J.X.; Li, Z.; Tang, L. A sustainable water-food-energy plan to confront climatic and socioeconomic changes using simulation-optimization approach. Appl. Energy 2019, 263, 743–759. [Google Scholar] [CrossRef]
  15. Zheng, X.; Zhao, J.; Wang, D.; Kong, X.; Zhu, Y.; Liu, Z.; Dai, W.; Huang, G. Scenario analysis of a sustainable water-food nexus optimization with consideration of population-economy regulation in Beijing-Tianjin-Hebei region. J. Clean. Prod. 2019, 228, 927–940. [Google Scholar] [CrossRef]
  16. Daohan, H.; Guijun, L.; Chengshuang, S.; Qian, L. Exploring interactions in the local water-energy-food nexus (WEF-Nexus) using a simultaneous equations model. Sci. Total Environ. 2020, 703, 135034. [Google Scholar]
  17. Moghadam, E.S.; Sadeghi, S.H.R.; Zarghami, M.; Delavar, M. Water-energy-food nexus as a new approach for watershed resources management: A review. Environ. Resour. Res. 2019, 7, 129–136. [Google Scholar]
  18. Mahlknecht, J.; Gonzalez-Bravo, R. Measuring the water-energy-food nexus: The case of Latin America and the Caribbean Region. Energy Procedia 2018, 153, 169–173. [Google Scholar] [CrossRef]
  19. Simpson, G.B.; Berchner, M. Measuring integration towards a water-energy-food nexus. Water Wheel 2017, 16, 22–23. [Google Scholar]
  20. Wolde, Z.; Wei, W.; Likessa, D.; Omari, R.; Ketema, H. Understanding the impact of land use and land cover change on water-energy-food nexus in the Gidabo watershed, eastern African Rift Valley. Nat. Resour. Res. 2021, 30, 2687–2702. [Google Scholar] [CrossRef]
  21. Sadagehi, S.H.; Moghadam, E.S. Integrated watershed management vis-à-vis water-energy-food nexus. In The Water-Energy-Food Nexus; Muthu, S.S., Ed.; Springer: Berlin/Heidelberg, Germany, 2021; pp. 69–96. [Google Scholar]
  22. Ding, K.J.; Gunda, T.; Hornberger, G.M. Prominent influence of socioeconomic and governance factors on the food-energy-water nexus in sub-Saharan Africa. Earths Future 2019, 7, 1071–1087. [Google Scholar] [CrossRef] [Green Version]
  23. United Nations (UN). Integrated Management and Sustainable Development of Coastal and Marine Areas, Including Exclusive Economic Zones. In Report of the United Nations Conference on Environment and Development, Rio de Janeiro, Brazil, 3−14 June 1992; United Nations: New York, NY, USA, 1995. [Google Scholar]
  24. United Nations Conference on Trade and Development (UNCTAD). If SIDS Were a Country. In Development and Globalization: Facts and Figures 2021. Available online: https://dgff2021.unctad.org/if-sids-were-a-country/ (accessed on 18 October 2021).
  25. Miralles-Wilhelm, F.; Munoz-Castillo, R. An Analysis of the Water-Energy-Food Nexus in Latin America and the Caribbean Region: Identifying Synergies and Tradeoffs through Integrated Assessment Modeling. Int. J. Eng. Sci. 2018, 7, 8–24. [Google Scholar]
  26. Biermann, F.; Kanie, N.; Kim, R.E. Global governance by goal-setting: The novel approach of the UN Sustainable Development Goals. Curr. Opin. Environ. Sustain. 2017, 26, 26–31. [Google Scholar] [CrossRef]
  27. Sarni, W. The Case for Green Infrastructure in LAC: Conclusions from Stockholm World Water Week 2018. Policy Brief N IDB-PB-318; InterAmerican Development Bank: Washington, DC, USA, 2019. [Google Scholar]
  28. Cashman, A.; Nurse, L.; John, C. Climate change in the Caribbean: The water management implications. J. Environ. Dev. 2010, 19, 42–67. [Google Scholar] [CrossRef]
  29. Mycoo, M.A. Beyond 1.5 °C: Vulnerabilities and adaptation strategies for Caribbean Small Island Developing States. Reg. Environ. Chang. 2018, 18, 2341–2353. [Google Scholar] [CrossRef] [Green Version]
  30. Hall, T.C.; Sealy, A.M.; Stephenson, T.S.; Kusunoki, S.; Taylor, M.A.; Chen, A.A.; Kitoh, A. Future climate of the Caribbean from a super-high-resolution atmospheric general circulation model. Theor. Appl. Climatol. 2013, 113, 271–287. [Google Scholar] [CrossRef]
  31. The World Factbook. Available online: https://www.cia.gov/the-world-factbook/ (accessed on 10 October 2020).
  32. Xu, H.; Wu, M. Water Availability Indices—A Literature Review. ANL/ESD-17/5; Argonne National Laboratory: Chicago, IL, USA, 2017.
  33. FAO. AQUATSTAT. Available online: https://www.fao.org/aquastat/statistics/query/index.html (accessed on 5 October 2020).
  34. Water Sanitation and Health. Available online: https://www.who.int/teams/environment-climate-change-and-health/water-sanitation-and-health/environmental-health-in-emergencies/humanitarian-emergencies#minimum-quantity-water-needed (accessed on 1 October 2020).
  35. Falkenmark, M. The massive water scarcity now threatening Africa: Why isn’t it being addressed? Ambio 1989, 18, 112–118. [Google Scholar]
  36. Cosgrove, W.J.; Rijsberman, F. World Water Vision: Making Water Everybody’s Business; Earthscan Publications Ltd.: London, UK, 2000. [Google Scholar]
  37. Brown, A.; Matlock, M.D. A Review of Water Scarcity Indices and Methodologies; The Sustainability Consortium, University of Arkansas: Fayetteville, NC, USA, 2011. [Google Scholar]
  38. Gunda, T.; Benneyworth, L.; Burchfield, E. Exploring water indices and associated parameters: A case study approach. Water Policy 2015, 17, 98–111. [Google Scholar] [CrossRef] [Green Version]
  39. The World Bank Database. Available online: https://databank.worldbank.org/home.aspx (accessed on 15 September 2020).
  40. FAOSTAT. Available online: https://www.fao.org/faostat/en/#data (accessed on 15 September 2020).
  41. Cashman, A. Water security and services in the Caribbean. Water 2014, 6, 1187–1203. [Google Scholar] [CrossRef] [Green Version]
  42. Crisman, T.L.; Dumke, D.; Rivera, F.I.; Santiago-Pimentel, L. Resilience of environment, infrastructure, communities and governance in Puerto Rico after Hurricane Maria and the need for community empowerment to develop decentralized, nature-based solutions to sustainability. J. Environ. Manag. 2021, 19, 11–23. [Google Scholar]
  43. UNICEF; WHO. Progress on Drinking Water and Sanitation: 2012 Update; UNICEF and World Health Organization: New York, NY, USA, 2012; pp. 1–57.
  44. Crisman, T.C. Observational data, 2020. (Unpublished work).
  45. FAO; CDB. Study on the State of Agriculture in the Caribbean; FAO and CDB: Rome, Italy, 2019; p. 212p. [Google Scholar]
  46. Pemberton, C. Agricultural Development and Employment in the Caribbean: Challenges and Future Prospects; International Labour Organization: Port of Spain, Trinidad, 2005. [Google Scholar]
  47. Sullivan, M.P.; Beitel, J.S.; DeBruyne, N.F.; Meyer, P.J.; Seelke, C.R.; Taft-Morales, M.; Villarreal, M.A. Latin America and the Caribbean: US Policy and Issues in the 116th Congress; Congressional Research Service: Washington, DC, USA, 2021.
  48. Scobie, M. Accountability in climate change governance and Caribbean SIDS. Environ. Dev. Sustain. 2018, 20, 769–787. [Google Scholar] [CrossRef] [Green Version]
  49. CNN. Haiti Earthquake Fast Facts. Available online: https://www.cnn.com/2013/12/12/world/haiti-earthquake-fast-facts/index.html (accessed on 20 October 2021).
  50. Herring, G.H. From Colony to Superpower; Oxford University Press: New York, NY, USA, 2008. [Google Scholar]
  51. Dubois, L. Haiti: The Aftershocks of History; Henry Holt and Company: New York, NY, USA, 2012. [Google Scholar]
  52. Sullivan, M.P.; Meyer, P.J. Latin America and the Caribbean: Impact of COVID-19; Congressional Research Service: Washington, DC, USA, 2021.
  53. Dizney-Flores, Z. The Development Paradox. NACLA Rep. Am. 2018, 50, 163–169. [Google Scholar] [CrossRef]
  54. Chandra, A.; Marsh, T.; Madrigano, J.; Simmons, M.M.; Abir, M.; Chan, E.W.; Ryan, J.; Nanda, N.; Zieler, M.D.; Nelson, C. Health and Social Services in Puerto Rico before and after Hurricane Maria; Homeland Security Operational Analysis Center: Santa Monica, CA, USA, 2020.
  55. Susnik, J.; Vamvakeridou-Lyroudia, L.S.; Baumert, N.; Kloos, J.; Renaud, F.G.; La Jeunesse, I.; Mabrouk, B.; Savic, D.A.; Kapelan, Z.; Ludwig, R.; et al. Interdisciplinary assessment of sea-level rise and climate change impacts on the lower Nile Delta, Egypt. Sci. Total Environ. 2015, 503–504, 279–288. [Google Scholar] [CrossRef]
  56. Lawford, R.G. A design for a data and information service to address the knowledge needs of the water-energy-food (W-E-F) nexus and strategies to facilitate its implementation. Front. Environ. Sci. 2019, 7, 56. [Google Scholar] [CrossRef] [Green Version]
  57. Peter, S. Worsening Water Crisis in the Eastern Caribbean. Available online: https://eos.org/articles/worsening-water-crisis-in-the-eastern-caribbean (accessed on 22 September 2020).
  58. Emmanuel, K.; Spence, B. Climate change implications for water resource management in Caribbean tourism. Worldw. Hosp. Tour. Themes 2009, 1, 252–268. [Google Scholar] [CrossRef]
  59. Robinson, D.; Newman, S.P.; Stead, S.M. Community perceptions link environmental decline to reduced support for tourism development in small island states: A case study in the Turks and Caicos Islands. Mar. Policy 2019, 108, 103671. [Google Scholar] [CrossRef]
  60. Maharjan, S.K.; Dangol, D.R. Agritourism education and research in Nepal. J. Agric. Res. Technol. 2018, 14, 1–5. [Google Scholar] [CrossRef]
  61. Breiby, M.A.; Duedahl, E.; Øian, H.; Ericsson, B. Exploring sustainable experiences in tourism. Scand. J. Hosp. Tour. 2020, 20, 335–351. [Google Scholar] [CrossRef] [Green Version]
Figure 1. Caribbean SIDS included in this study.
Water 14 00322 g001
Figure 2. Renewable annual freshwater volume available to each country on a per capita basis. Dashed lines are the Falkenmark indicators used to indicate water stress, water scarcity, and absolute water scarcity. Not displayed is the WHO requirement of water per capita, 7.3 m3/capita/year. Data from WHO and FAO AQUASTAT [33,34].
Water 14 00322 g002
Figure 3. Water use as a percent of available water (annual renewable freshwater) for Caribbean SIDS. Includes water for agriculture (irrigation, livestock, and aquaculture), domestic supply, and industry. Data from FAO [40].
Water 14 00322 g003
Figure 4. Available water for each SIDS for 2020 and 2050 based on current population growth rates and water use. The 2050 values were then recalculated to reflect 10% and 30% reduction in rainfall associated with climate change. All values were then related to Falkenmark indicators of 1700 m3/capita/year (water stress), 1000 m3/capita/year (water scarcity), and 500 m3/capita/year (absolute water scarcity).
Water 14 00322 g004
Table 1. Demographic and physical characteristics of Caribbean SIDS included in this study. Data obtained from the CIA World Factbook [31].
CountryPopulationGDP (USD)Surface Area (km2)Agricultural Area
(km2)
Highest Elevation (m)
Antigua and Barbuda95,8822,398,000,00044291402
Bahamas332,63412,060,000,00013,90019564
Barbados293,1315,218,000,000430140336
Dominica74,027783,000,0007512611447
Grenada112,2071,634,000,000344111840
Jamaica2,812,09026,060,000,00010,99145502256
St. Kitts and Nevis53,0941,550,000,000261601156
St. Lucia165,5102,542,000,000616107948
St. Vincent and Grenadines101,8441,265,000,0003891001234
Trinidad and Tobago1,215,52742,850,000,0005128544940
Table 2. Renewable freshwater and desalinated water resources for each country. Addition of desalinated water resulted in a minor change from renewable freshwater on a per capita basis. Data from FAO AQUASTAT [33].
CountryRenewable Freshwater (m3/Capita/Year)Natural and Desalinated Water Availability (m3/Capita/Year)Difference (m3/Capita/Year)
Antigua and Barbuda54261674
Bahamas2104212622
Barbados27331138
Dominica270127010
Grenada178217820
Jamaica384938490
St. Kitts and Nevis45251462
St. Lucia181318130
St. Vincent and Grenadines9829886
Trinidad and Tobago3159319839
Table 3. Water supply of urban and rural populations across the Caribbean. Data from UNICEF/WHO [43].
CountryUrban Population (%)Water Supply
UrbanRural
Unimproved (%)Improved (%)Unimproved (%)Improved (%)
Antigua and Barbuda895951189
Bahamas842981486
Barbados4401000100
Dominica67496496
Grenada39298793
Jamaica522981288
St. Kitts and Nevis32199199
St. Lucia28298595
St. Vincent and Grenadines49N/AN/A793
Trinidad and Tobago14298793
Table 4. Water sanitation for urban and rural populations. Data from UNICEF/WHO [43].
CountryUrban Population (%)Water Sanitation
UrbanRural
Unimproved
(%)
Improved
(%)
Unimproved
(%)
Improved
(%)
Antigua and Barbuda89298298
Bahamas84298298
Barbados4401000100
Dominica67496892
Grenada39496397
Jamaica523971189
St. Kitts and Nevis32298298
St. Lucia28199793
St. Vincent and Grenadines49595595
Trinidad and Tobago14397793
Table 5. Petroleum imports compared with total imports (USD) for each SIDS during 2018.
CountryPetroleum Imports (USD)—2018Total Import (USD)—2018Petroleum as Percent of Total
Antigua and Barbuda230,190,000955,000,00024%
Bahamas2,220,800,0006,920,000,00032%
Barbados378,130,0001,650,000,00023%
Dominica9,968,800295,000,0003%
Grenada5,842,300200,000,0003%
Jamaica915,859,0004,400,000,00021%
St. Kitts and Nevis25,786,000246,000,00010%
St. Lucia1,632,308,9001,910,000,00085%
St. Vincent and the Grenadines46,000,000393,000,00012%
Trinidad and Tobago1,122,100,0004,710,000,00024%
Table 6. Energy sector scoring for each parameter as well as the final classification for each country. Countries are considered failing if they fail in two or more parameters.
Energy Parameters Pass or Fail
CountryAccessLossesRenewableFinal Classification
Antigua and BarbudaPassFailFailFail
BahamasPassPassFailPass
BarbadosPassPassFailPass
DominicaPassPassPassPass
GrenadaFailPassFailFail
JamaicaPassFailFailFail
St. Kitts and NevisPassFailFailFail
St. LuciaPassPassFailPass
St. Vincent and the GrenadinesPassPassFailPass
Trinidad and TobagoPassPassFailPass
Table 7. Final classification of the food sector for SIDS. All failed, with the possible exception of St. Kitts and Nevis, which lacked data on cereal imports.
Food Parameters Pass or Fail
CountryAdequacyCereal ImportFood Supply VariabilityFinal Classification
Antigua and BarbudaFailFailFailFail
BahamasPassFailFailFail
BarbadosPassFailFailFail
DominicaPassFailFailFail
GrenadaFailFailFailFail
JamaicaPassFailFailFail
St. Kitts and NevisPassN/AFailFail
St. LuciaFailFailFailFail
St. Vincent and the GrenadinesPassFailFailFail
Trinidad and TobagoPassFailFailFail
Table 8. Current WEF sustainability for each Caribbean SIDS based on sustainability assessments of water, energy, and food sectors. Overall sustainability was based on failing two or more sectors.
WEF Sector Summary
CountryWaterEnergyFood
Antigua and BarbudaFailFailFail
BahamasPassPassFail
BarbadosFailPassFail
DominicaPassPassFail
GrenadaPassFailFail
JamaicaPassFailFail
St. Kitts and NevisFailFailFail
St. LuciaFailPassFail
St. Vincent and the GrenadinesFailPassFail
Trinidad and TobagoPassPassFail
Table 9. Water sector sustainability in 2020 and 2050. Values in 2050 assume population growth and precipitation decrease from climate change.
Water Sector Comparison
CountryWater—2020Water—2050
Antigua and BarbudaFailFail
BahamasPassFail
BarbadosFailFail
DominicaPassFail
GrenadaPassFail
JamaicaPassPass
St. Kitts and NevisFailFail
St. LuciaFailFail
St. Vincent and the GrenadinesFailFail
Trinidad and TobagoPassPass
Publisher’s Note: MDPI stays neutral with regard to jurisdictional claims in published maps and institutional affiliations.

