Article

Energy Consumption and Carbon Footprint of Greek Wastewater Treatment Plants

by
Nikos Goliopoulos
,
Daniel Mamais
*,
Constantinos Noutsopoulos
,
Argyri Dimopoulou
and
Christos Kounadis
Sanitary Engineering Laboratory, Department of Water Resources and Environmental Engineering, School of Civil Engineering, National Technical University of Athens, 5 Iroon Polytechniou, Zografou, 15780 Athens, Greece
*
Author to whom correspondence should be addressed.
Water 2022, 14(3), 320; https://doi.org/10.3390/w14030320
Submission received: 23 December 2021 / Revised: 18 January 2022 / Accepted: 20 January 2022 / Published: 21 January 2022
(This article belongs to the Special Issue Carbon Neutrality and Wastewater Treatment)

Abstract

:
Wastewater treatment plants (WWTPs) exhibit significant energy consumption and produce large amounts of Greenhouse Gas emissions (GHG emissions). Energy efficiency and reduction in GHG emissions in WWTPs have become important issues, especially in view of the climate crisis. The core objective of this work is to assess the energy and carbon footprint of Greek WWTPs and to propose methods to improve energy efficiency and reduce GHG emissions. Data were collected from 31 Greek WWTPs with an average treatment capacity between 250 and 3,650,000 population equivalents (PE). The total population served by the 31 WWTPs was over 6,000,000, which is more than half of the population in Greece with access to WWTPs. Based on the results, the annual average energy consumption for small, medium and large WWTPs equals 137 kWh/PE, 48 kWh/PE and 32 kWh/PE, respectively. Accordingly, annual average GHG emissions, both biogenic and non-biogenic in small, medium and large WWTPs are equal to 207 kgCO2e/PE, 144 kgCO2e/PE and 89 kgCO2e/PE, respectively. Annual average on-site GHG emissions are equal to 56.5 kgCO2e/PE, while the average off-site GHG emissions account for 16.9 kgCO2e/PE. Based on the results, acceptable and attainable targets for WWTPs energy consumption and GHG emissions are proposed.

1. Introduction

WWTPs are traditionally designed to achieve effluent requirements and prevent pollution of receiving water bodies. However, during the last few years, energy-saving and energy efficiency are progressively becoming more urgent issues, mainly due to the problems associated with the climate crisis [1]. In view of this pressure, the wastewater industry is urged to face such challenges by adopting more sustainable practices such as the reduction in energy consumption and greenhouse gases emissions [2]. Accordingly, efforts to provide services to 2.3 billion people who lack access to basic sanitation services require the integration of energy consumption and climate policies [3] on a worldwide scale.
WWTPs are important energy consumers with an estimated 3–4% share of total U.S. electricity consumption attributed to the water industry [4]. For Beijing WWTPs, energy consumption accounts for 4–6% of the total energy consumption [5]. According to Vergara-Araya et al. [6], the energy consumption of conventional activated sludge treatment systems varies between 0.27 and 1.89 kWh/m3. The average annual energy consumption in WWTPs in the USA is approximately 29 kWh/PE, ranging from 16 to 71 kWh/PE [7]. According to Jonasson [8], average annual energy consumption in the UK, Swedish and Austrian WWTPs equals 38 kWh/PE, 42 kWh/PE and 23 kWh/PE, respectively, while comparable values were reported by [9] for five Nordic WWTPs (31–47.2 kWh/PE). Furthermore, as reported by Krampe [10], the annual specific energy consumption of 11 WWTPs in South Australia ranged from 30 to 120 kWh/PE with an average value of 60 kWh/PE. These values are quite similar to the German Guide Manual, which sets an objective for annual energy optimization of approximately 20–30 kWh/PE, based on the size of the WWTP [10]. Average annual specific energy consumption in Greek WWTPs ranges between 15 and 86 kWh/PE, with an average value of 38.4 kWh/PE [11]. As reported by Mamais et al. [11], medium WWTPs serving 15,000–100,000 PE have higher per capita energy consumption (44 kWh/PE) than larger ones serving more than 100,000 PE (32 kWh/PE).
Energy consumption depends on several factors, such as location, size, the extent of sewer network, treatment configuration, type of aeration, equipment energy efficiency and WWTP overall efficiency [1]. The main energy consumer in a WWTP is aeration. Aeration usually accounts for about 25–60% of the total energy consumption in WWTPs [12]. Energy requirements for aeration depend on the aeration system, with WWTPs with diffusion systems consuming much lower energy, compared to treatment plants using surface aeration systems [11].
It is widely accepted that WWTPs are also a significant source of greenhouse gas emissions (GHG) in the water industry [13]. Specifically, WWTPs directly produce several greenhouse gases, such as carbon dioxide (CO2), nitrous oxide (N2O) and methane (CH4), as a result of the treatment procedure and additionally contribute to CO2 and CH4 emissions through energy consumption [11]. Studies in the US report an average GHG emission value of 0.38 kgCO2e/m3 [14]. Annual GHG emissions, range between 7 and 108 kgCO2e/PE for 16 Scandinavian WWTPs [15] and 33–38 kgCO2e/PE in Romania WWTPs [16]. According to a previous study focusing on moderate and large WWTPs, the annual GHG emissions from Greek WWTPs ranged between 61 and 161 kgCO2e/PE [11]. The reduction in GHG emissions of WWTPs is crucial, considering that the European Commission has set a target of at least a 55% decrease in GHG emissions by 2030 (European Commission, 2021) [17]. The carbon footprint of a WWTP includes both GHG emissions released from a treatment activity directly and/or indirectly. Direct GHG emissions arise from wastewater collection, treatment and disposal, while indirect GHG emissions are related to electricity supply, transportation of different chemicals or sludge, use of chemicals and additives and disposal of residuals [18].
Recent research highlights that WWTPs loading, which is also linked with the climate crisis, is expected to increase energy consumption by the end of the century [19]. Accordingly, wastewater production is expected to increase globally by 24% and 51% by 2030 and 2050, respectively [20]. Therefore, controlling the energy consumed from wastewater treatment plants is crucial. Improvement of WWTP’s energy footprint can be achieved in many ways, such as selecting appropriate WWTP configuration, improved pumping and aeration efficiency with proper automatic control systems, using renewable sources of energy and supporting within-system generation of energy [21]. In this context, the energy produced through the anaerobic digestion of sludge can be integrated with other renewable sources such as photovoltaic and wind power [22]. Furthermore, potential excess of energy and heat production in WWTPs, which might occur due to the application of these renewable sources, can be potentially employed to supply external energy consumers [23].
Minimizing energy consumption and using low-carbon technologies are significant for mitigating the climate crisis [24]. The benefits from the optimization of WWTP energy efficiency are both environmental and financial. Air pollution and GHG emissions are reduced, energy costs are decreased, new jobs are created, and the market grows, while public health is protected and infrastructure life is extended [25].
The present study aims at presenting a holistic overview of the Greek WWTPs energy consumption and GHG emissions and proposes equations to calculate the acceptable level of energy consumption and GHG emissions based on the capacity of a plant. The study included collecting data on energy consumption from several WWTPs, to evaluate both on-site and off-site GHG emissions and to propose strategies to increase the efficiency that can be implemented to reduce both energy consumption and GHG emissions in WWTPs. To the best of our knowledge, this is the first study with sufficient data to adequately evaluate and derive acceptable and attainable targets for WWTPs energy consumption and GHG emissions based on their capacity.

2. Materials and Methods

Operational data were collected from 31 out of the total 231 WWTPs operating in Greece, with an average treatment capacity ranging from 250 to 3,650,000 PE. The total population served by the 31 WWTPs was over 6,000,000, which is more than half of the population in Greece with access to WWTPs. The WWTPs studied are geographically evenly dispersed, ranging from the district of Macedonia in the north to the island of Crete in the south, as shown in Figure 1.
For each WWTP, the available data included design calculations, drawings, utility bills and a list of equipment with its operational characteristics in order to develop an understanding of the wastewater and sludge treatment processes used and the energy consumption at each treatment stage. Operational data for each WWTP were collected over a 3-year period.
The population served and the treatment method of each plant are presented in Table 1. The 31 WWTPs were divided into the following three categories:
Category 1: Small-sized WWTPs: This category includes 12 small WWTPs with a treatment capacity lower than 10,000 PE. All of these WWTPs applied extended aeration-activated sludge treatment processes;
Category 2: Medium-sized WWTPs: This category includes 12 medium WWTPs with a treatment capacity ranging from 10,000 to 100,000 PE. Most of these twelve WWTPs applied extended aeration activated sludge treatment processes, whereas few had conventional activated sludge wastewater treatment with primary and secondary treatment stages and anaerobic sludge digestion;
Category 3: Large-sized WWTPs: This category includes 7 large WWTPs with a treatment capacity of over 100,000 PE. All WWTPs in this category employed conventional activated sludge process and anaerobic digestion for sludge stabilization.
For each category, energy consumption and GHG emissions were calculated, and equations based on the plant’s capacity were derived. GHG emission calculations included on-site and off-site production of CO2, CH4 and N2O, and the latter two were converted in CO2 equivalent units by multiplying by 23 and 296, respectively [26]. Moreover, GHG emissions were separated as biogenic and non-biogenic. GHG emissions originating from organic matter degradation from biological wastewater treatment, anaerobic sludge digestion, incineration, landfill and land application are considered biogenic (not derived from fossil-fuel-related activities). According to the current Intergovernmental Panel on Climate Change [26], biogenic CO2 emissions should not be included in the national GHG emissions inventory. GHG emissions from energy consumption, chemicals and transportation are considered non-biogenic.
The model applied to calculate GHG emissions was based on the comprehensive approach suggested by Bridle et al. [27]. A detailed presentation of this methodology can be found in Snip [28], whilst an analytical description of the model is presented in [11]. For the GHG emissions calculations, the energy mix of 2019 in Greece was used as presented by the Public Power Corporation. This included 18% energy from coal, 6% from nuclear energy, 8% from oil, 32% from natural gas, 10% from other fossil fuels and 26% from renewable energy [29].
The model calculates both on-site and off-site GHG emissions. On-site GHG emissions are related to the GHG emissions from biotreatment processes, combustion of the biogas for energy production, leakage of the biogas to the atmosphere and chemicals. The GHG emissions from biotreatment processes come from endogenous decay, the Biochemical Oxygen Demand (BOD) oxidation and nitrogen removal. The off-site GHG emissions are related to the sludge disposal/reuse, the use of electric power produced in power plants and the emissions related to the discharged effluent. In more detail, on-site GHG emissions (kg/d) during biological wastewater treatment were estimated by taking into account the following processes:
  • CO2 production from biomass decay;
  • CO2 production from BOD removal and biomass production;
  • CO2 consumption from nitrification;
  • CO2 production from denitrification;
  • Ν2O (in equivalent CO2) production from nitrification and denitrification processes;
  • CO2 production from biogas use for heating and electricity production;
  • CO2 production from biogas leakage to the atmosphere. A biogas leakage of 1% was assumed in this study;
  • CO2 production from chemicals used in the WWTP;
  • Off-site GHG emissions considered in this study were:
  • Net power consumption;
  • Sludge disposal;
  • Discharge to the effluent.

3. Results and Discussion

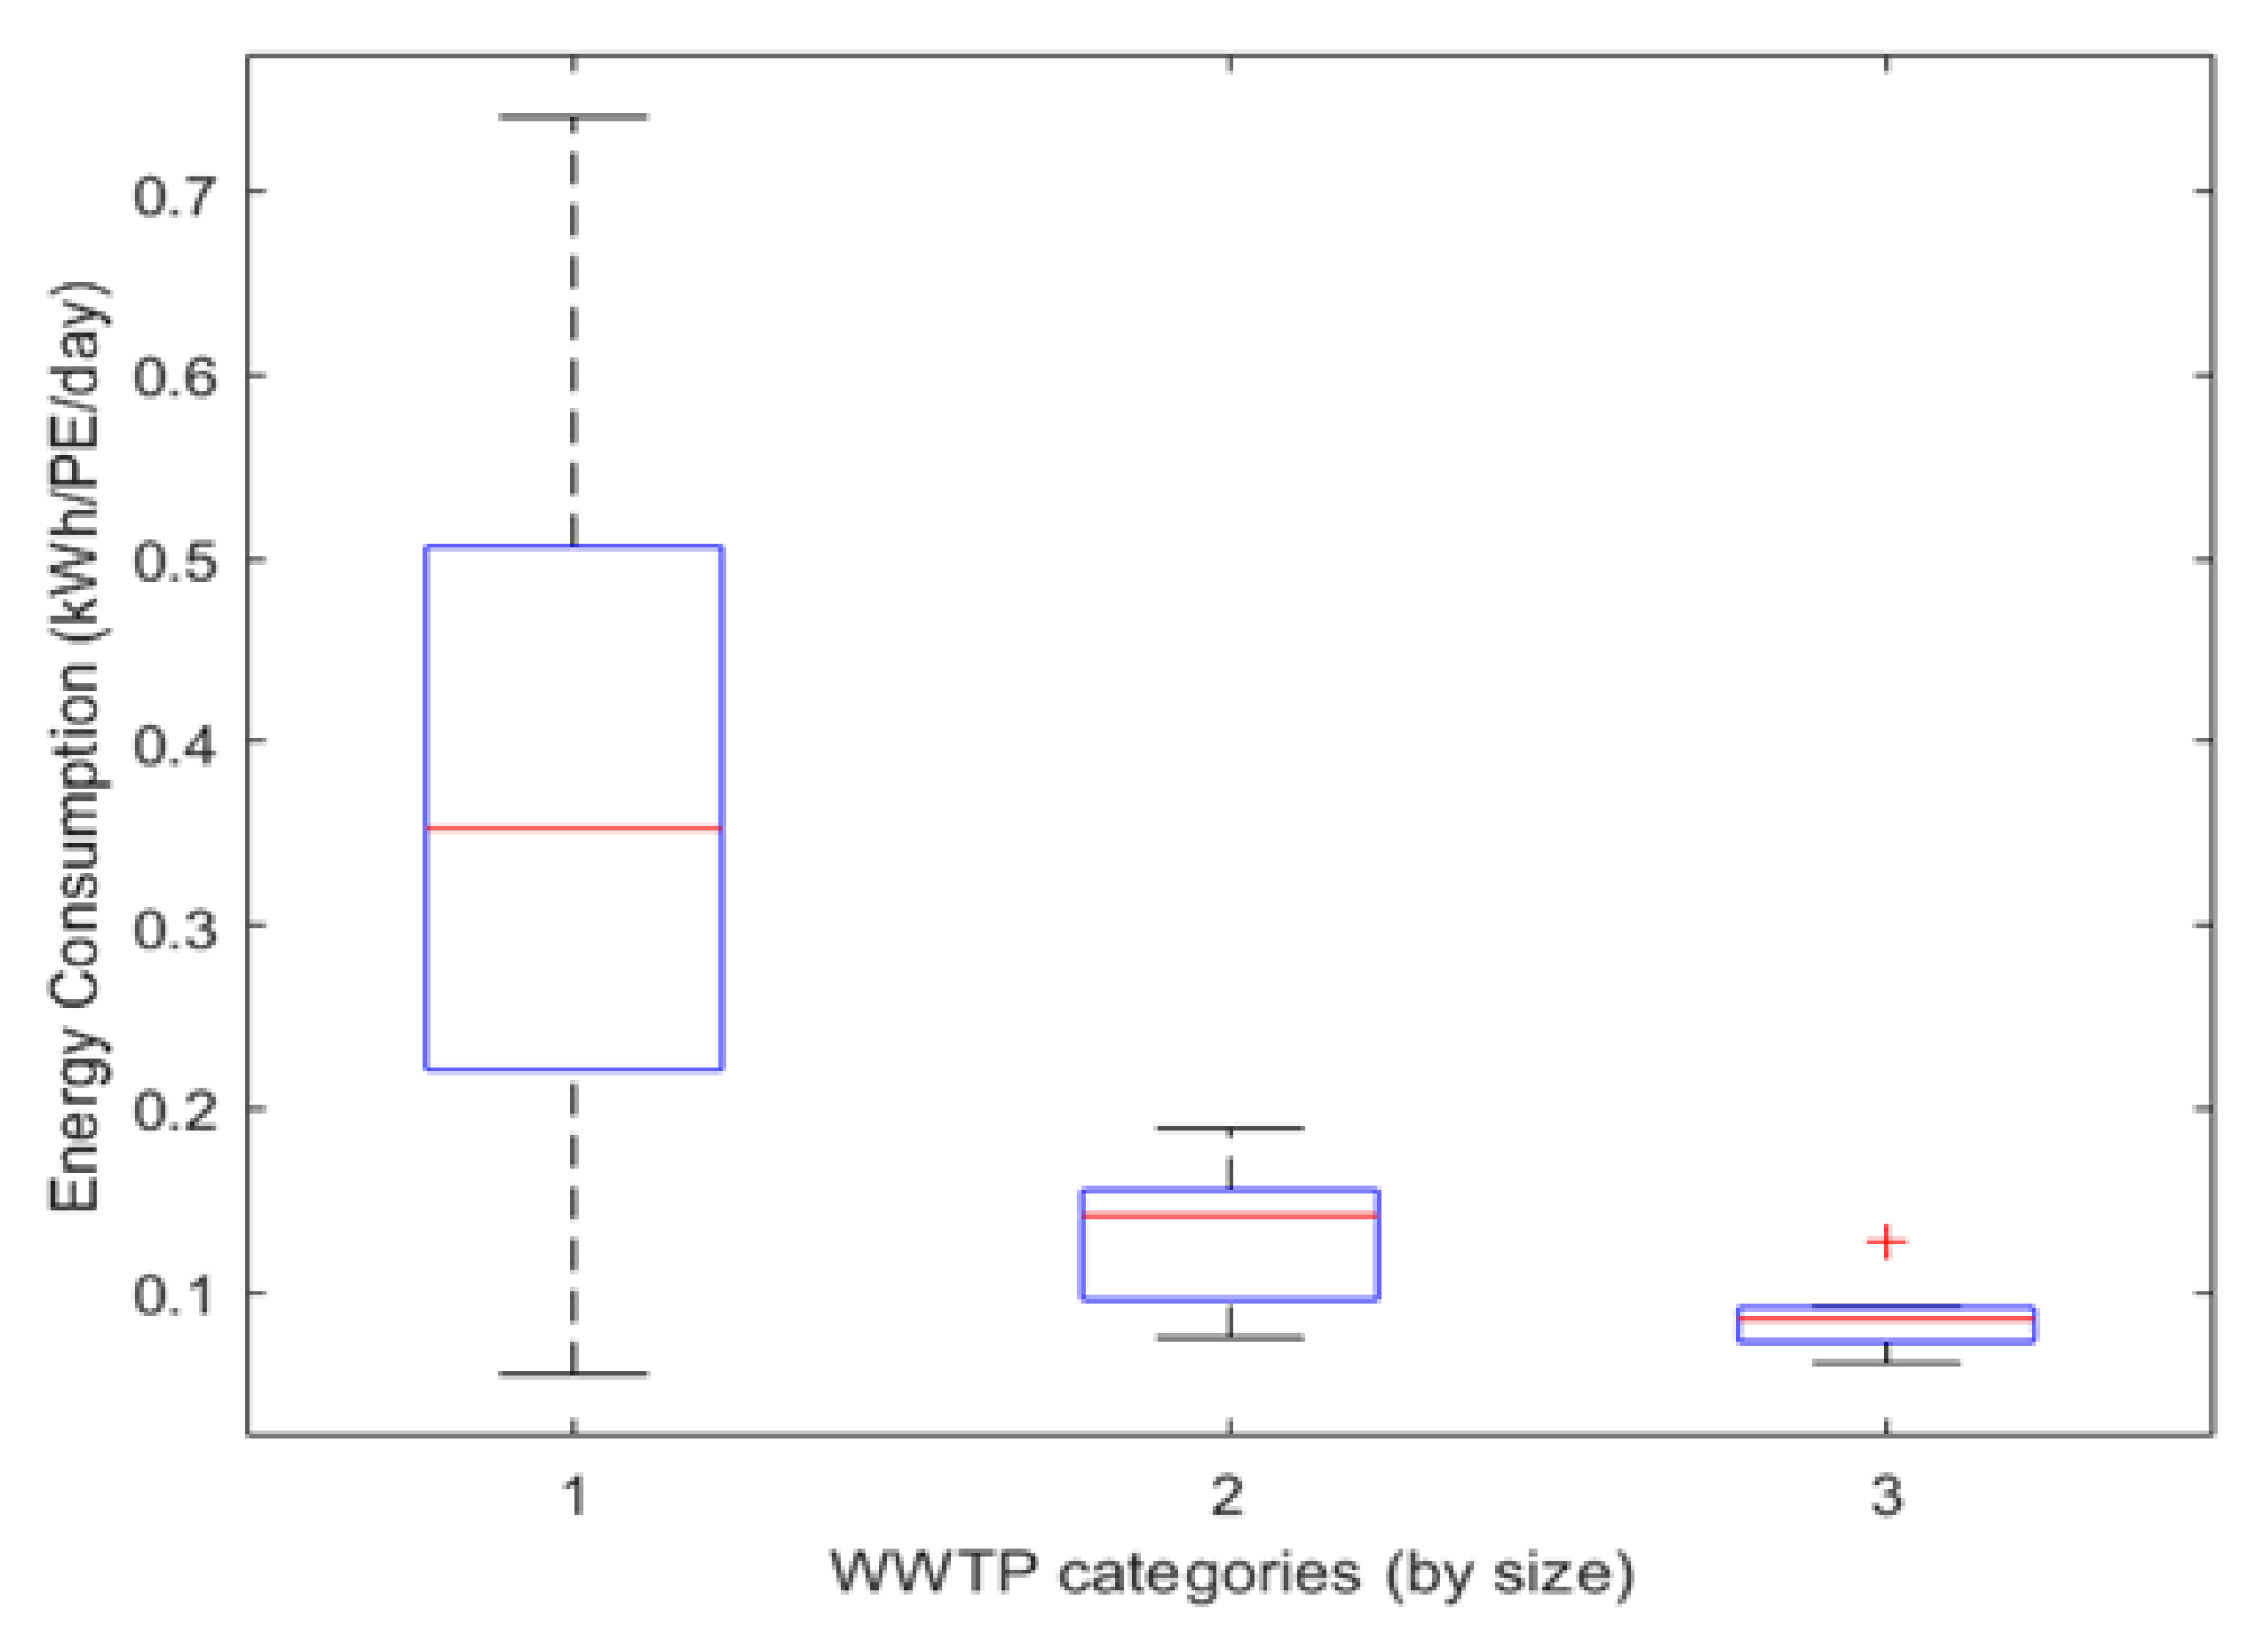
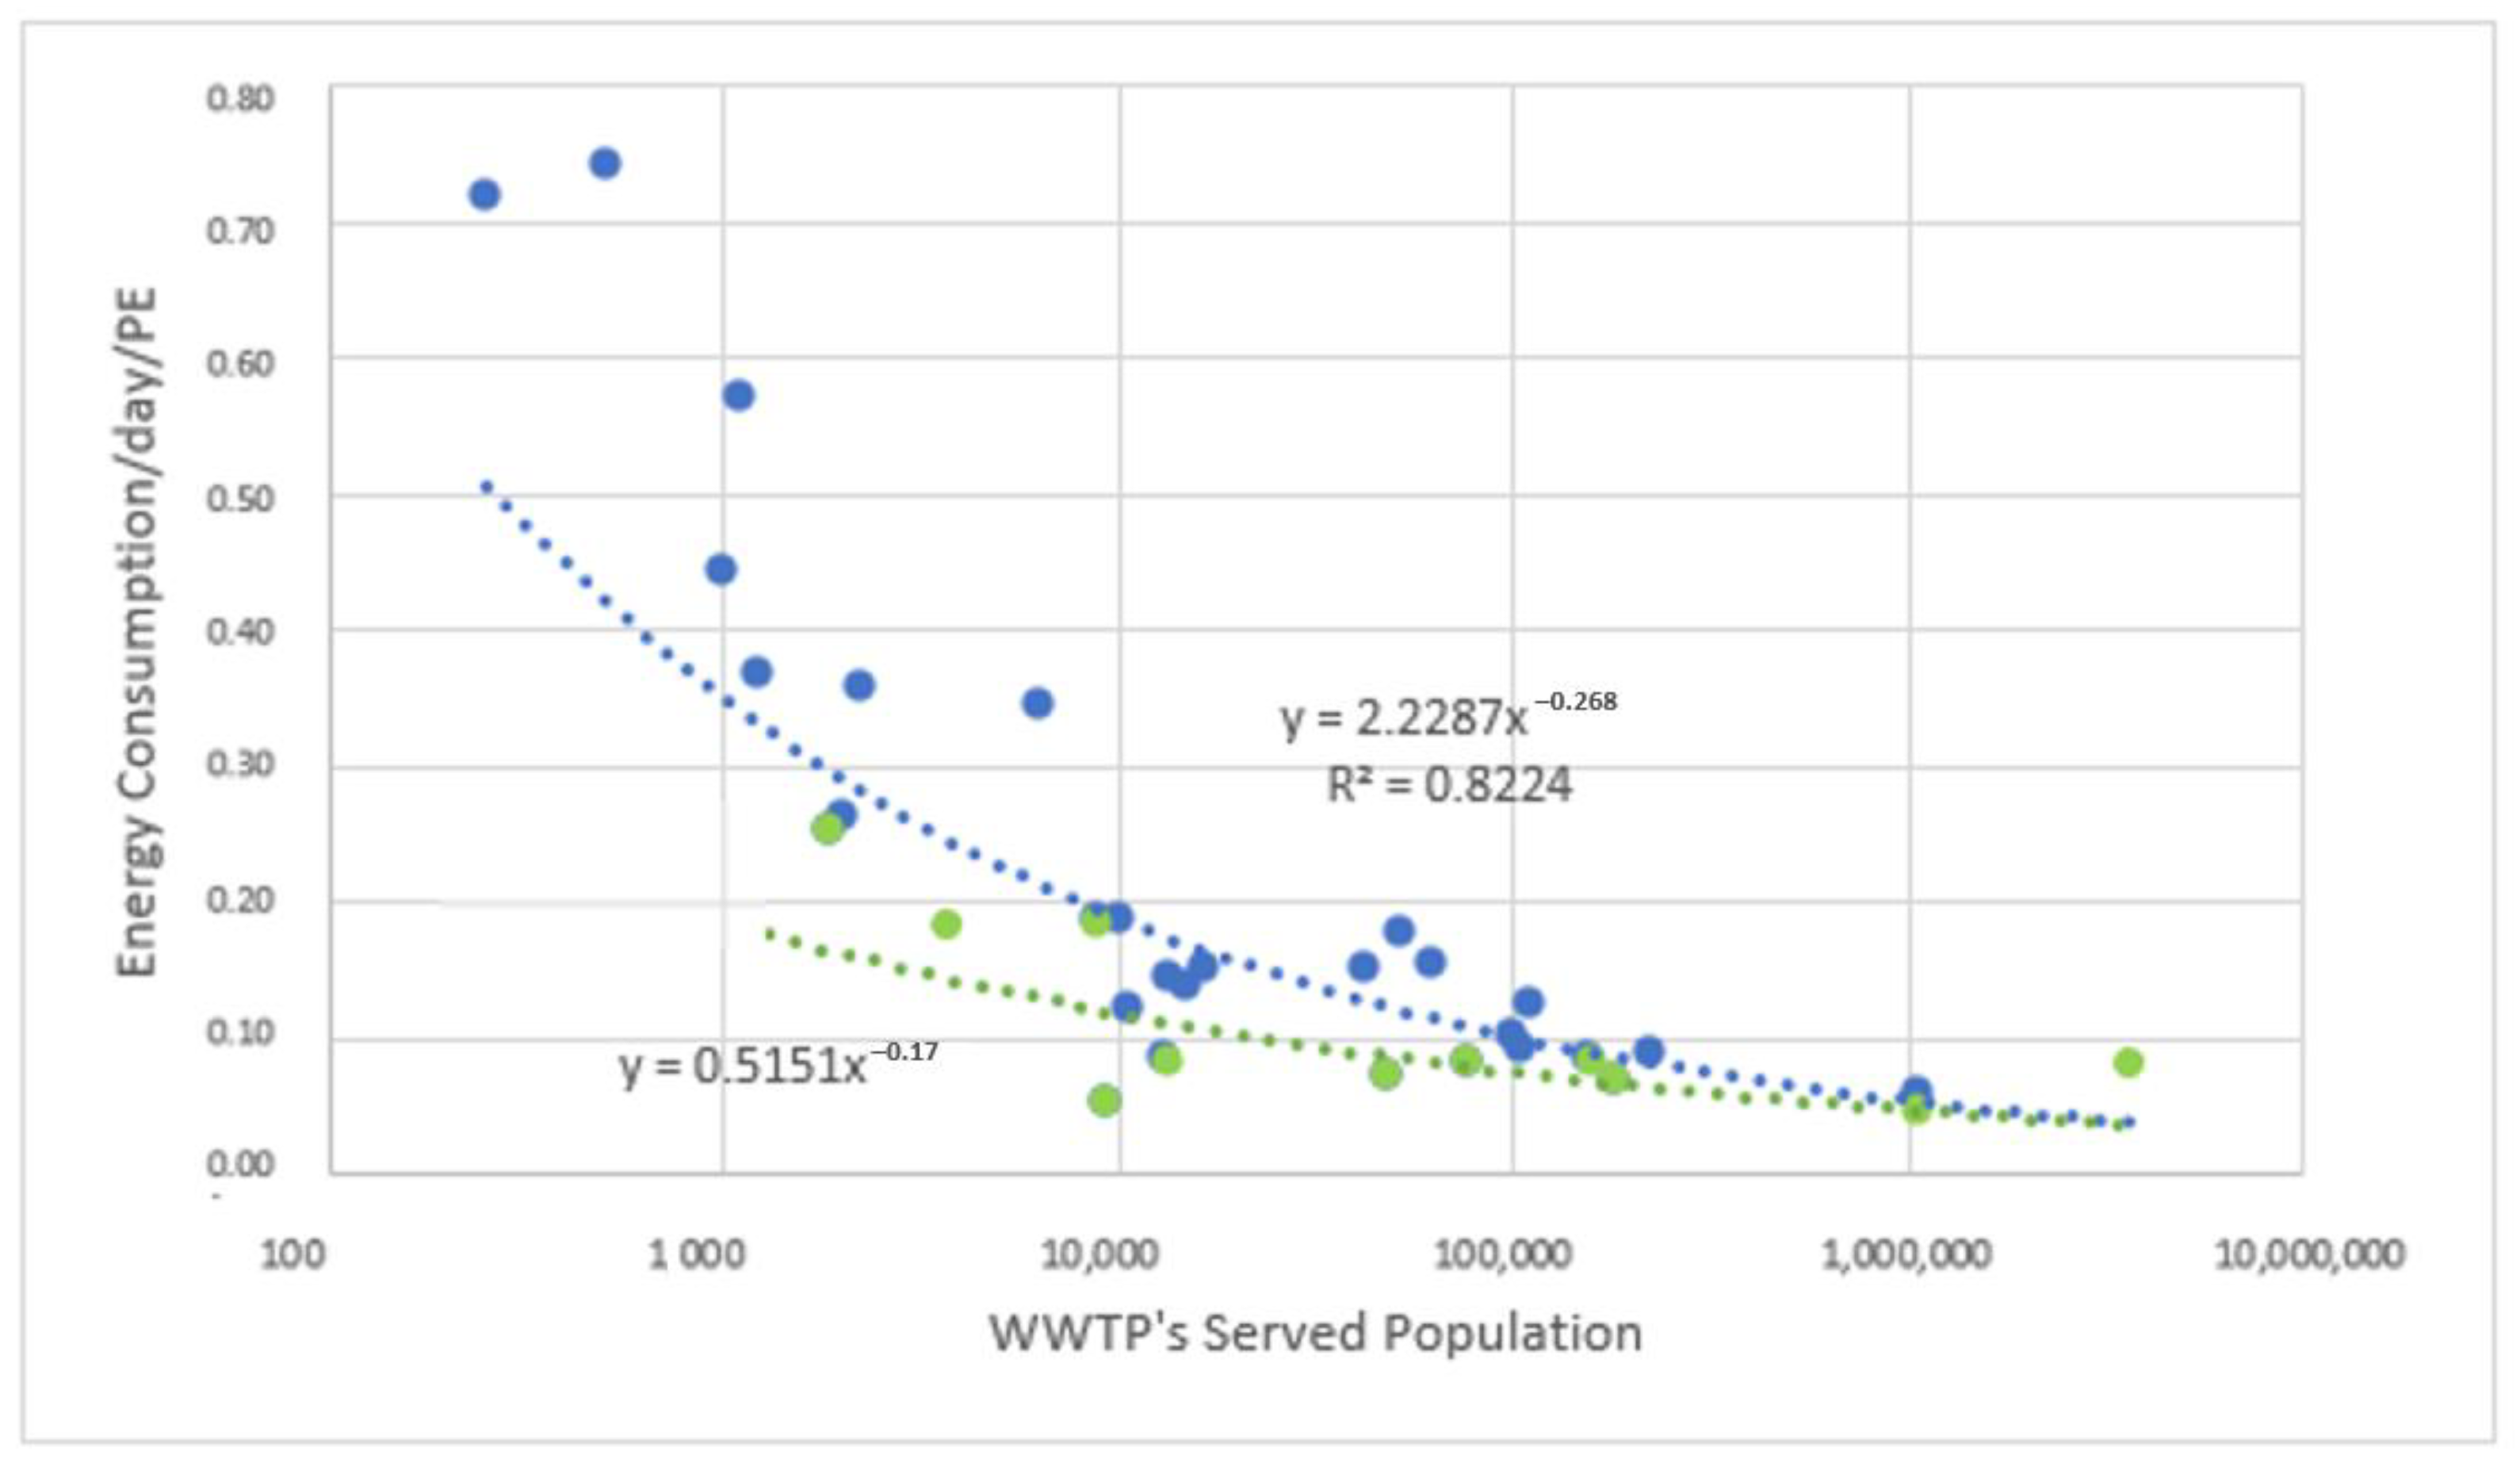
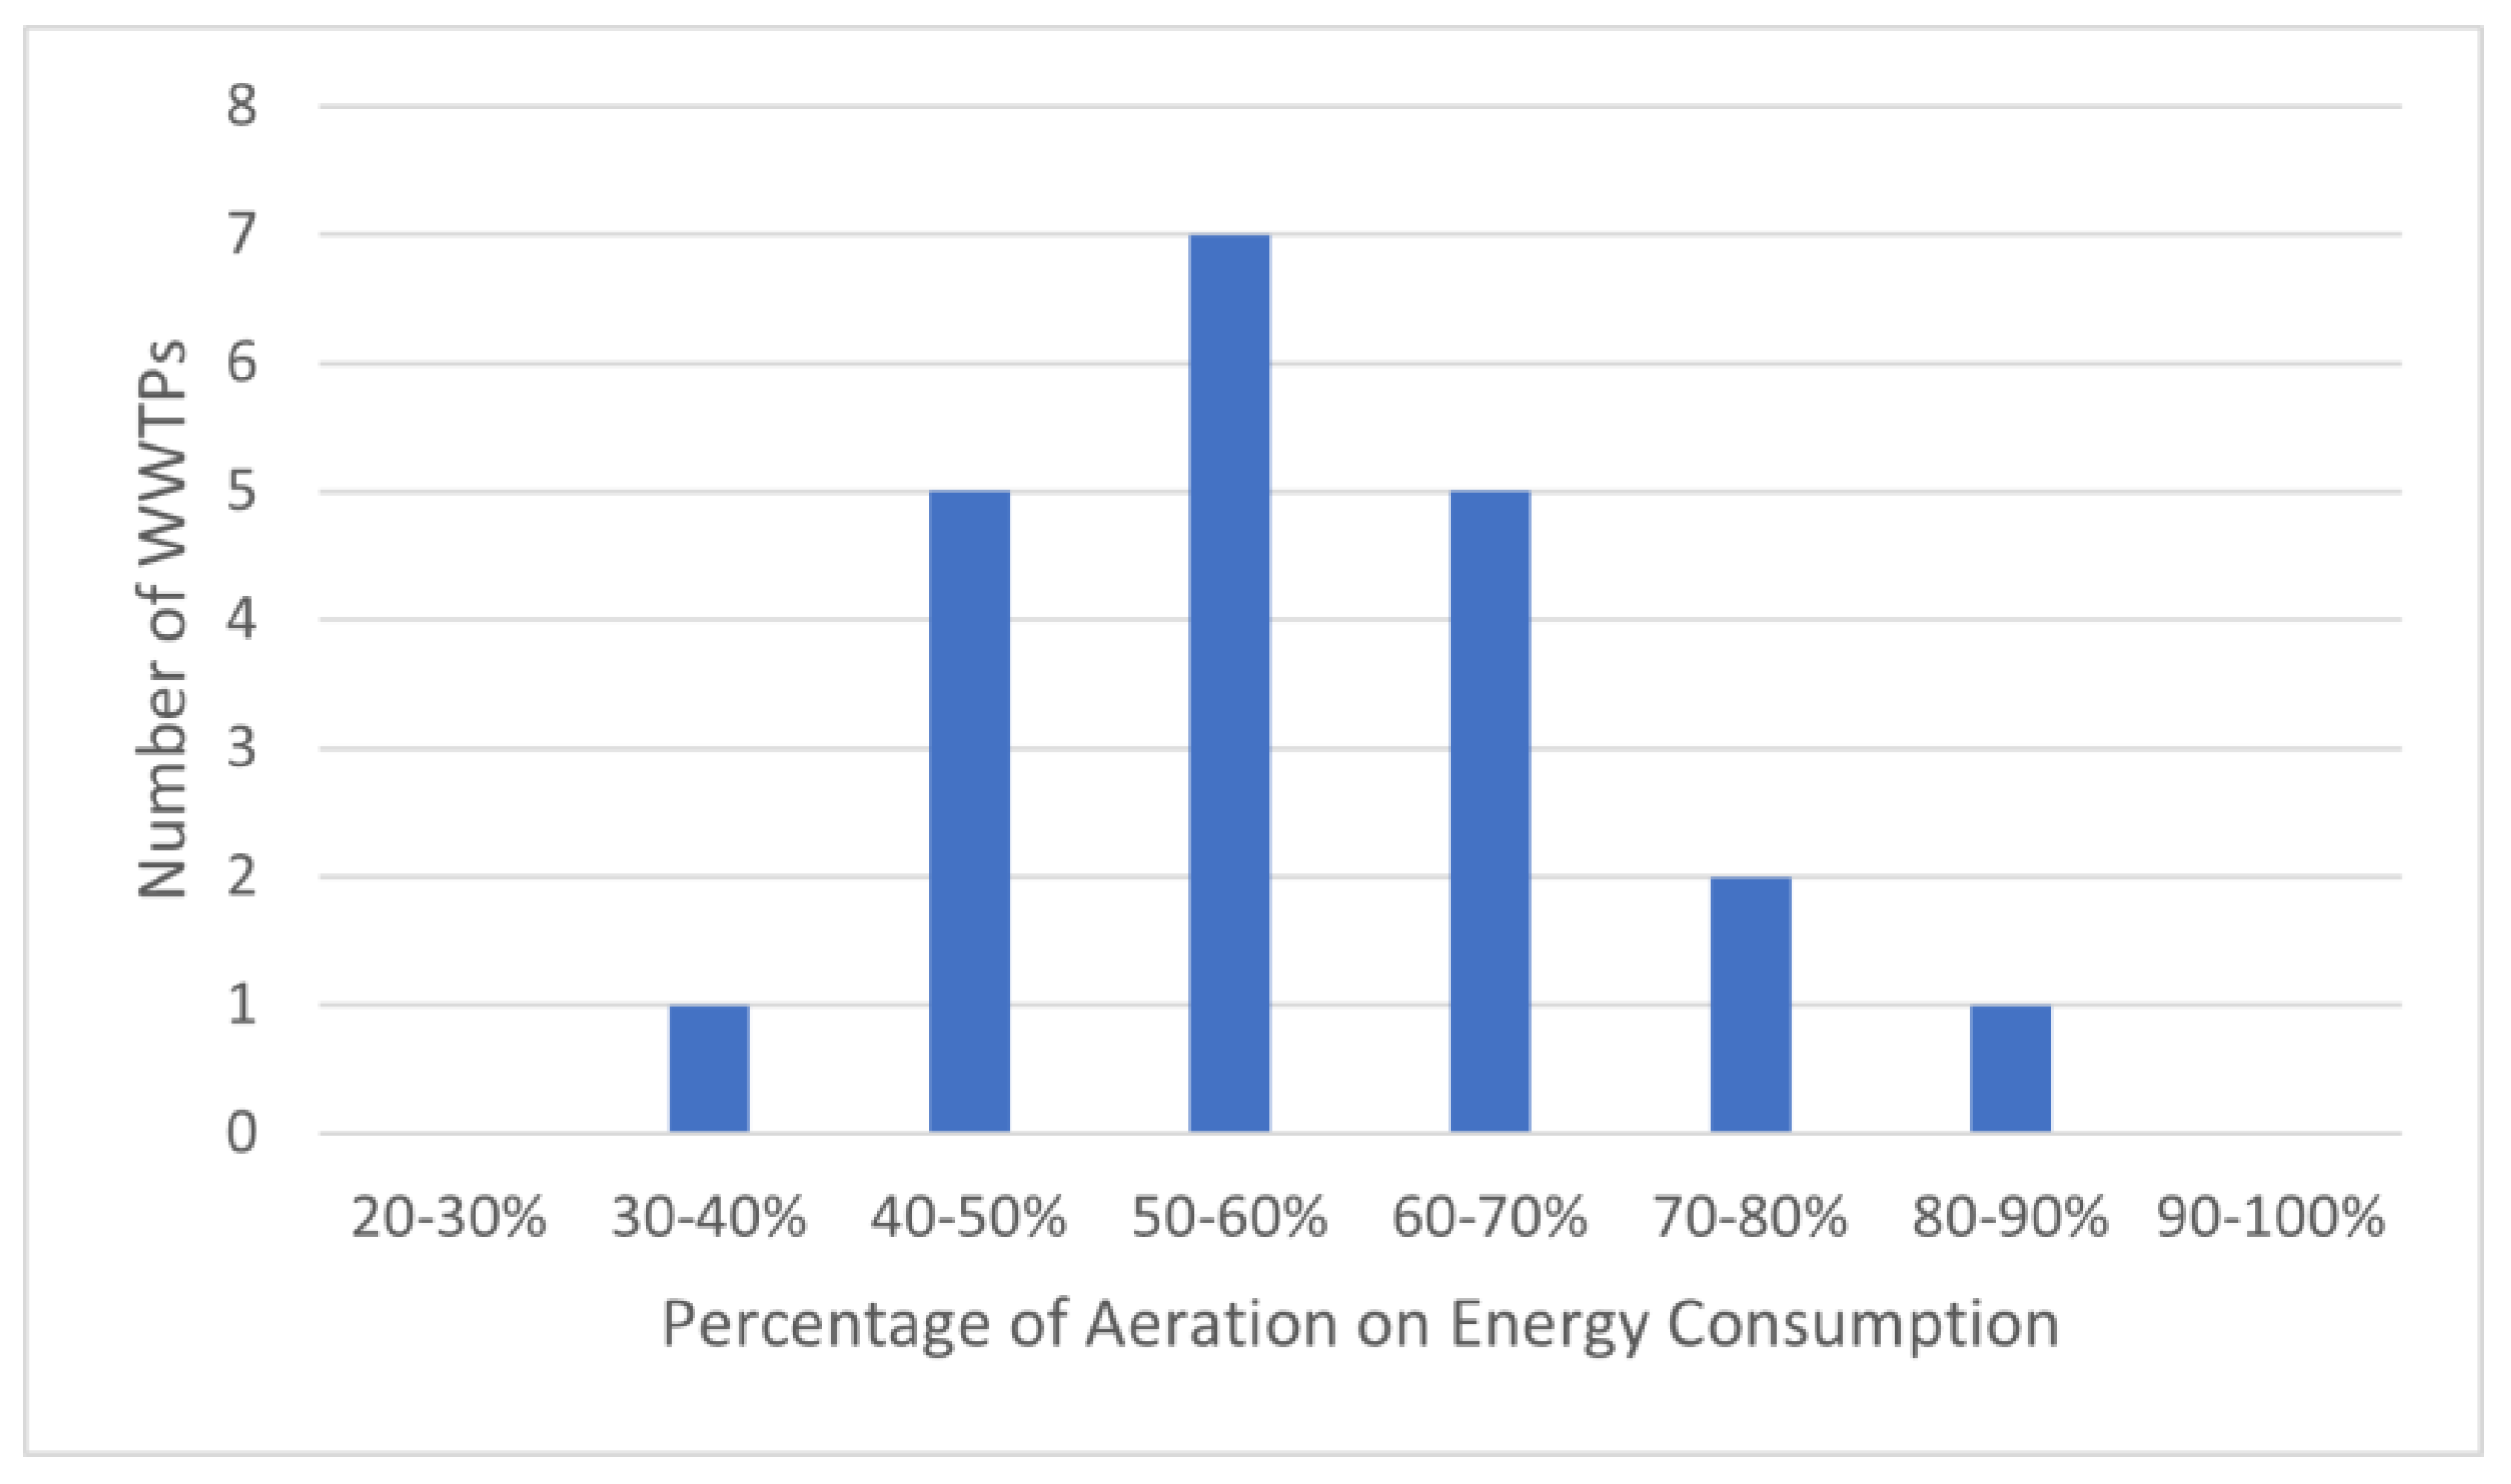
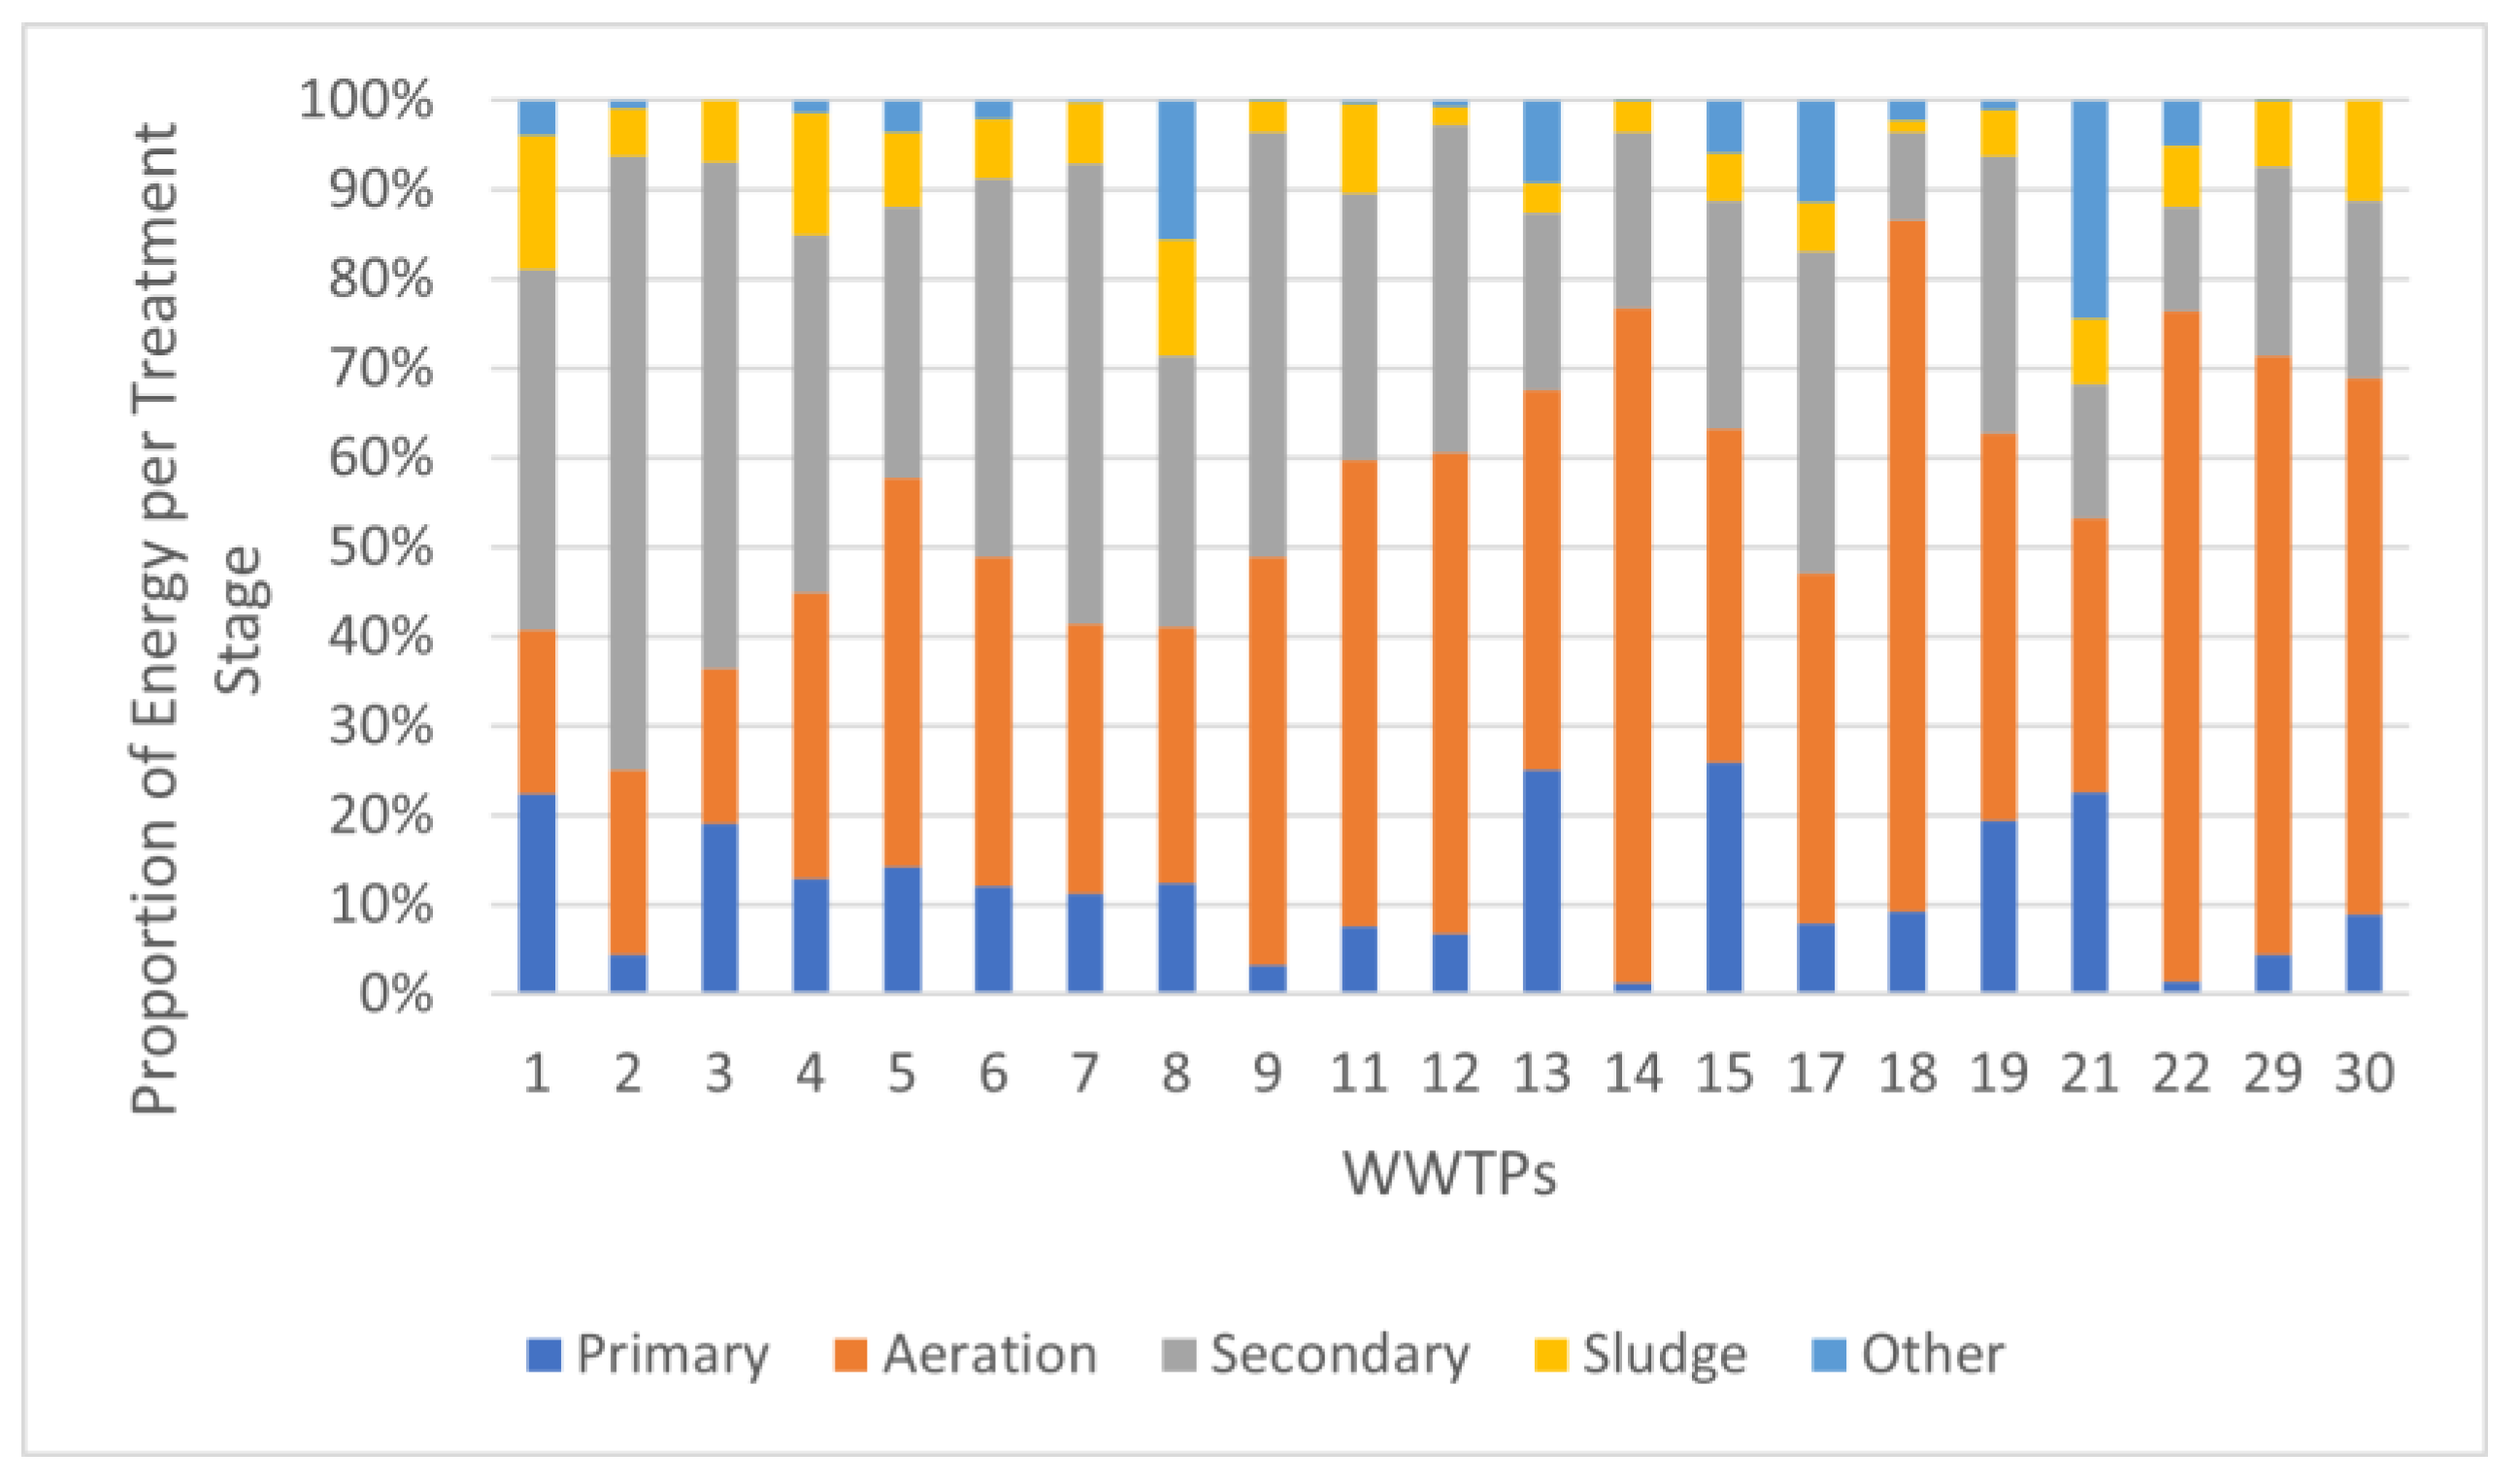
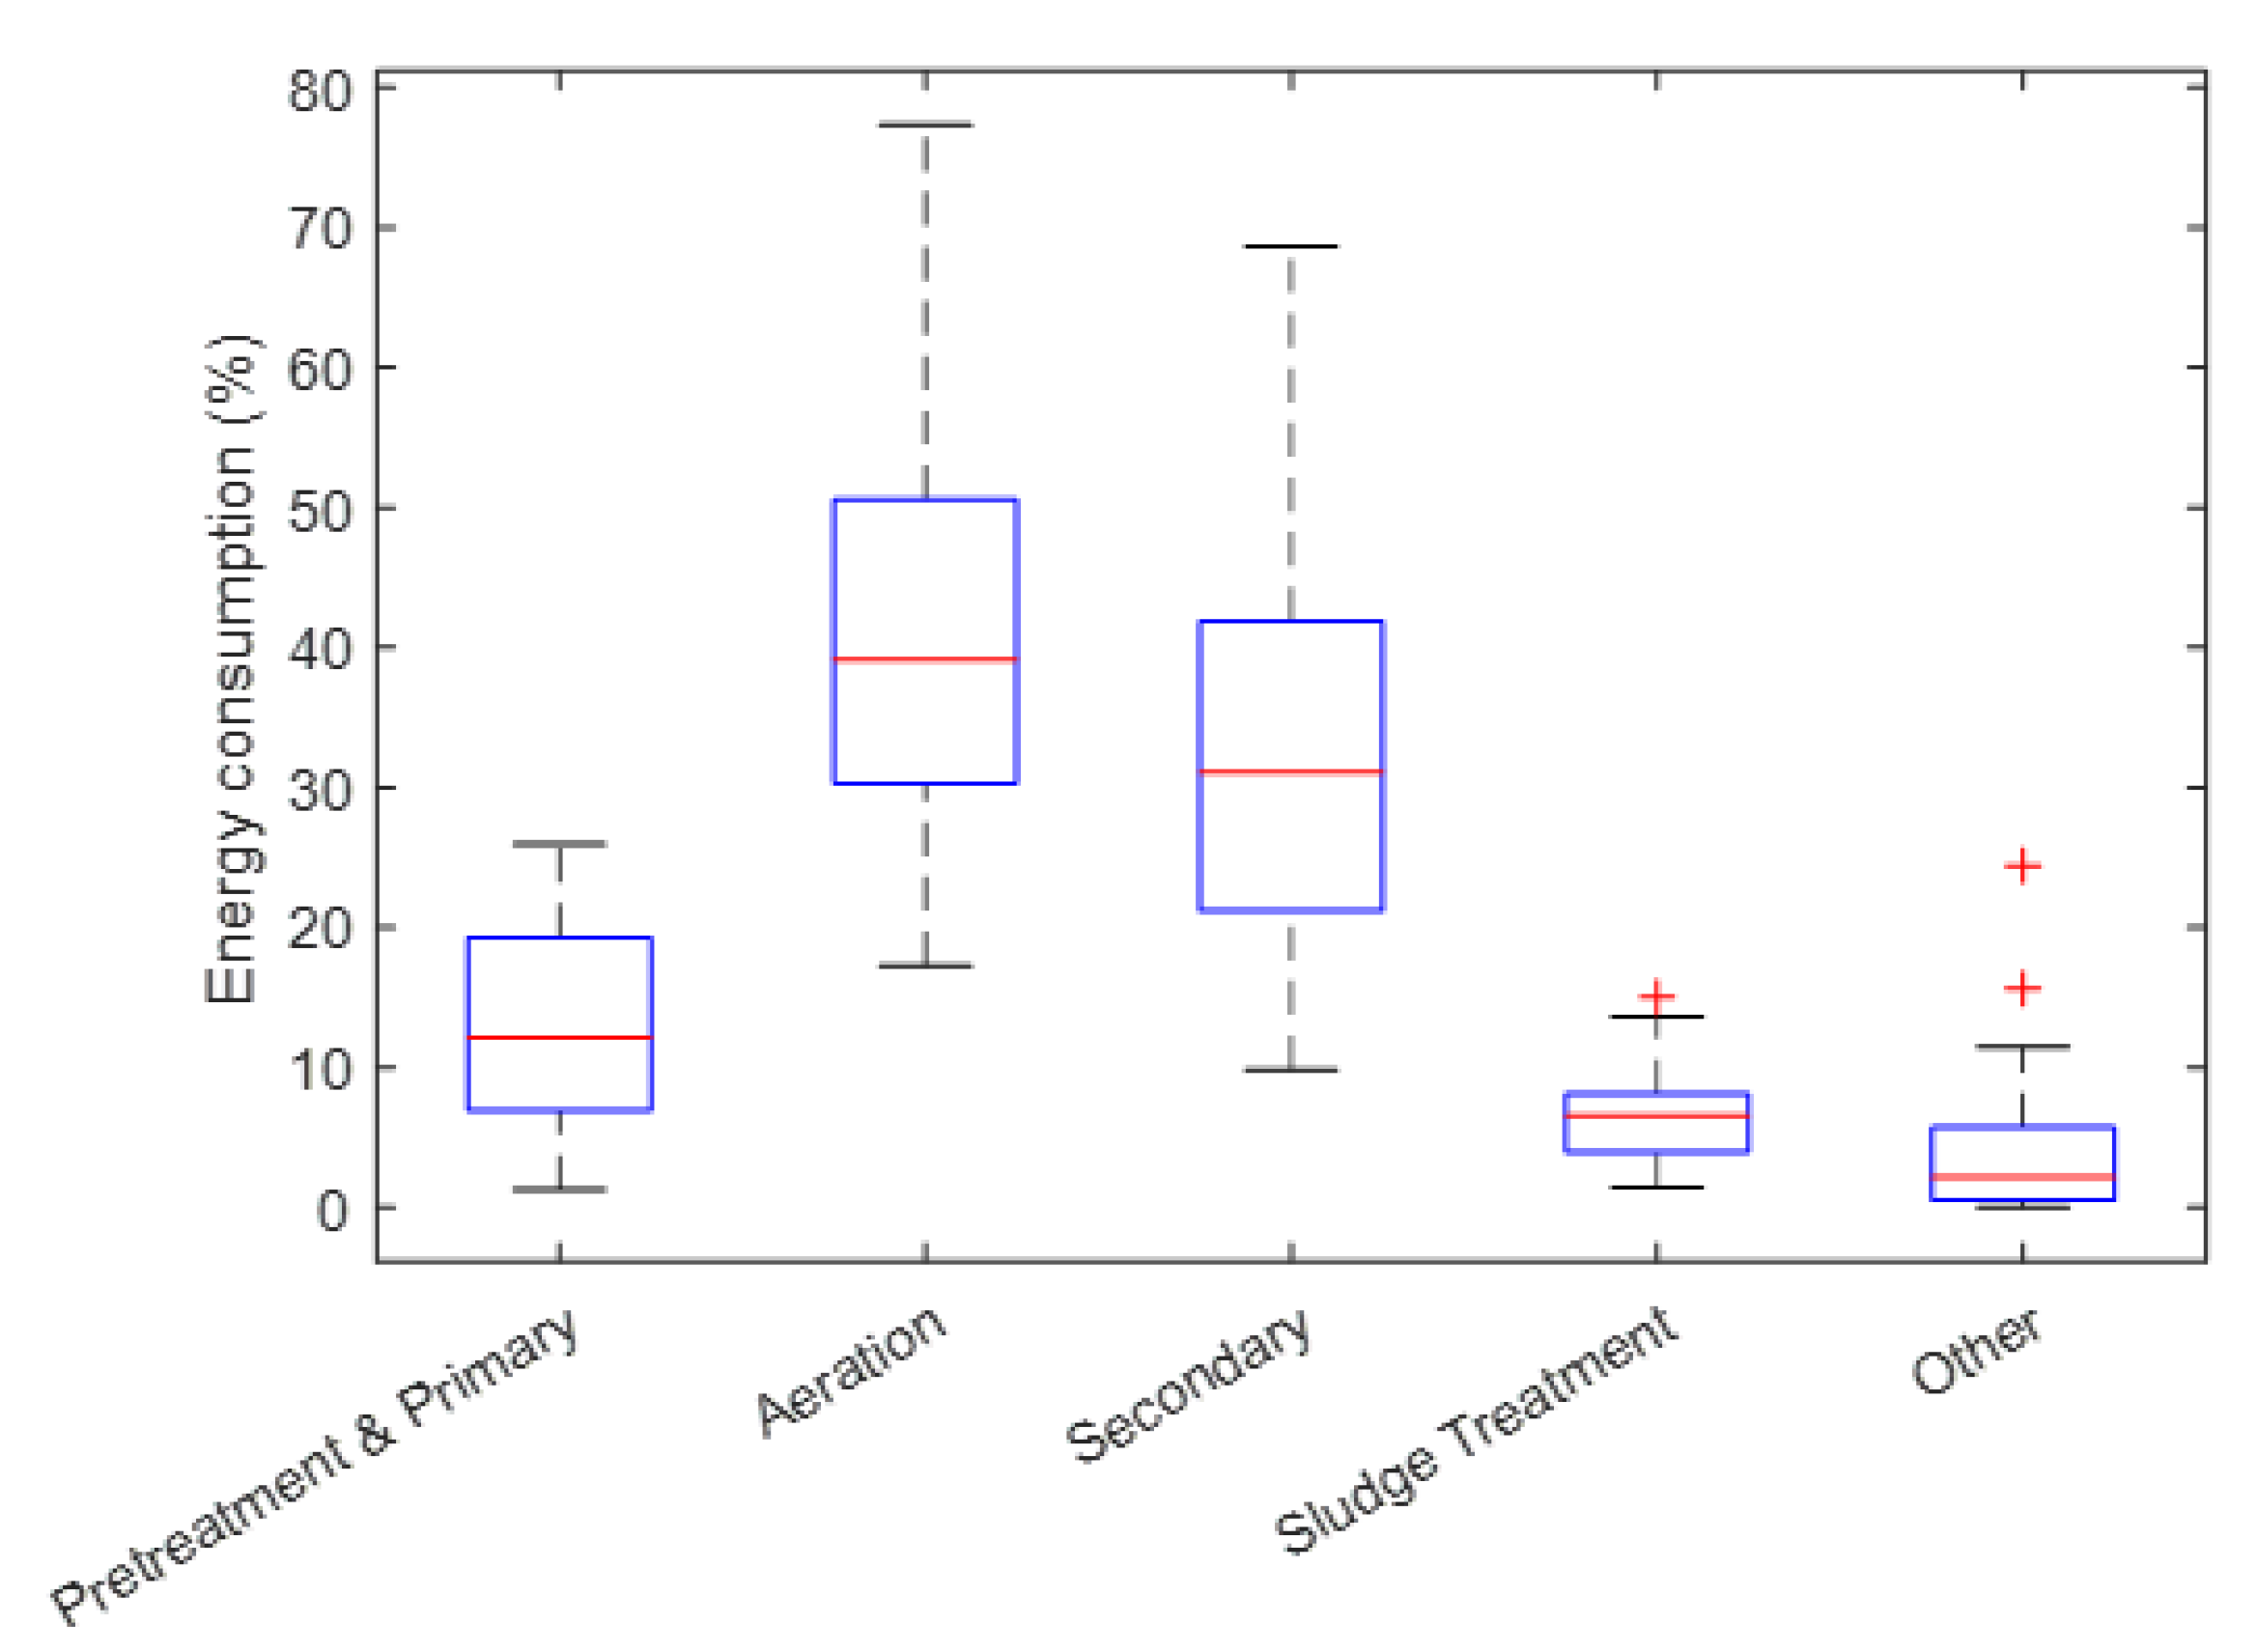
3.1. Energy Consumption
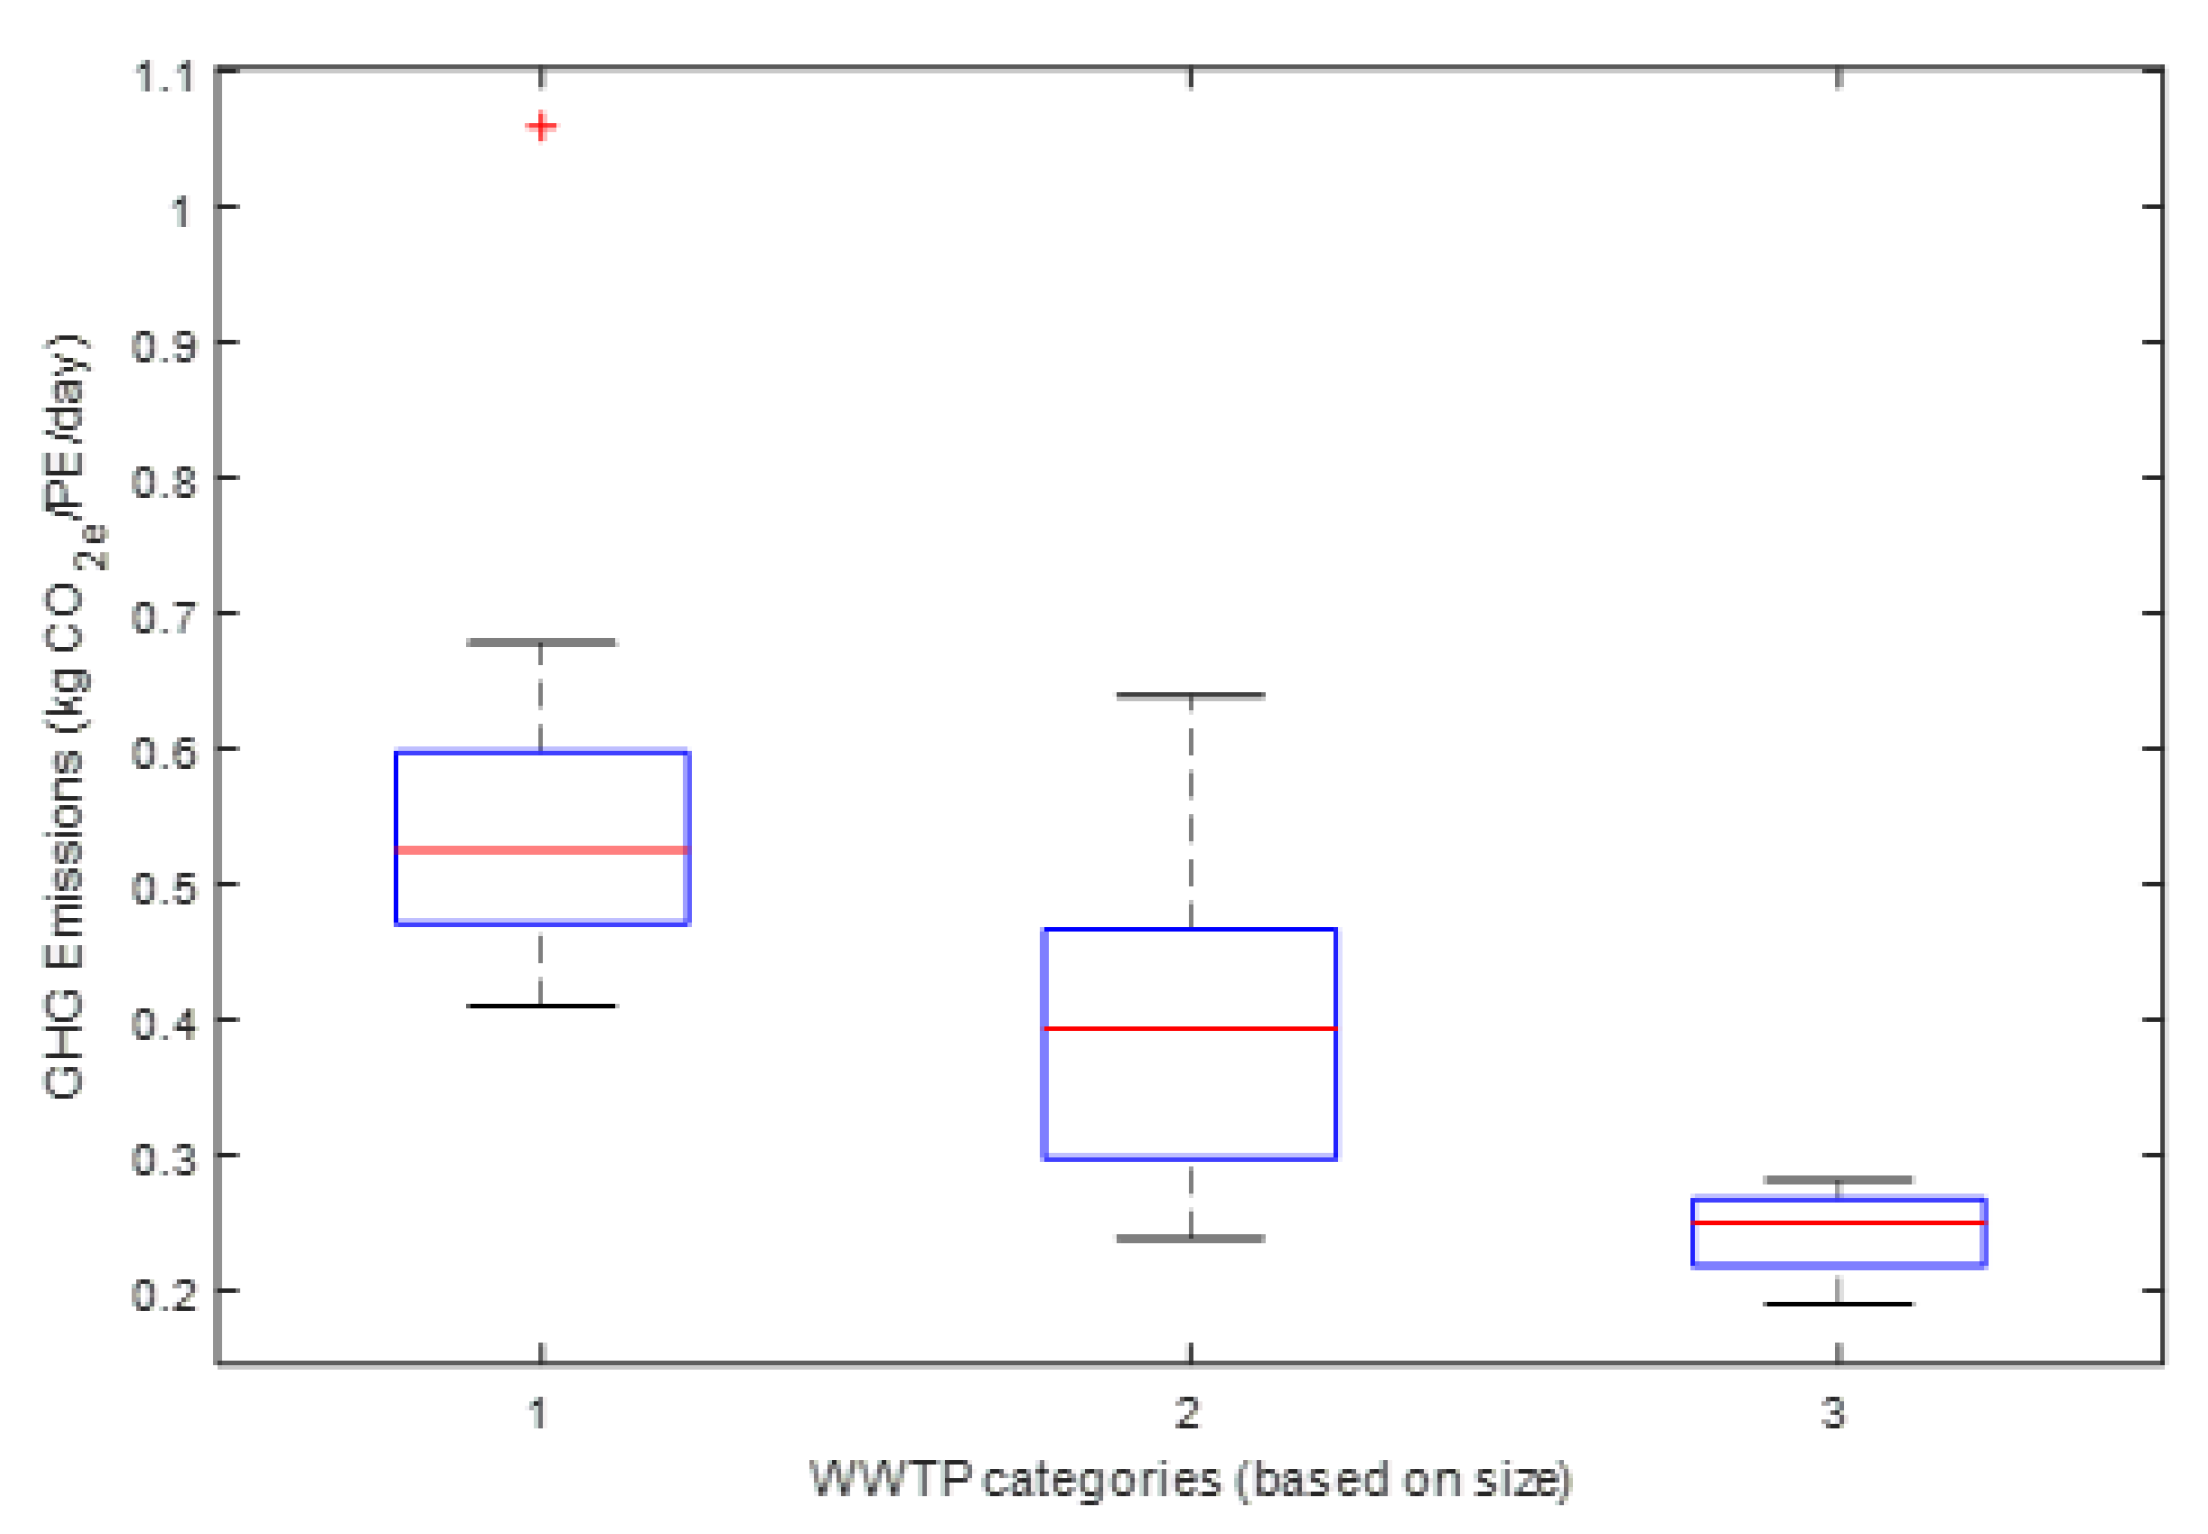
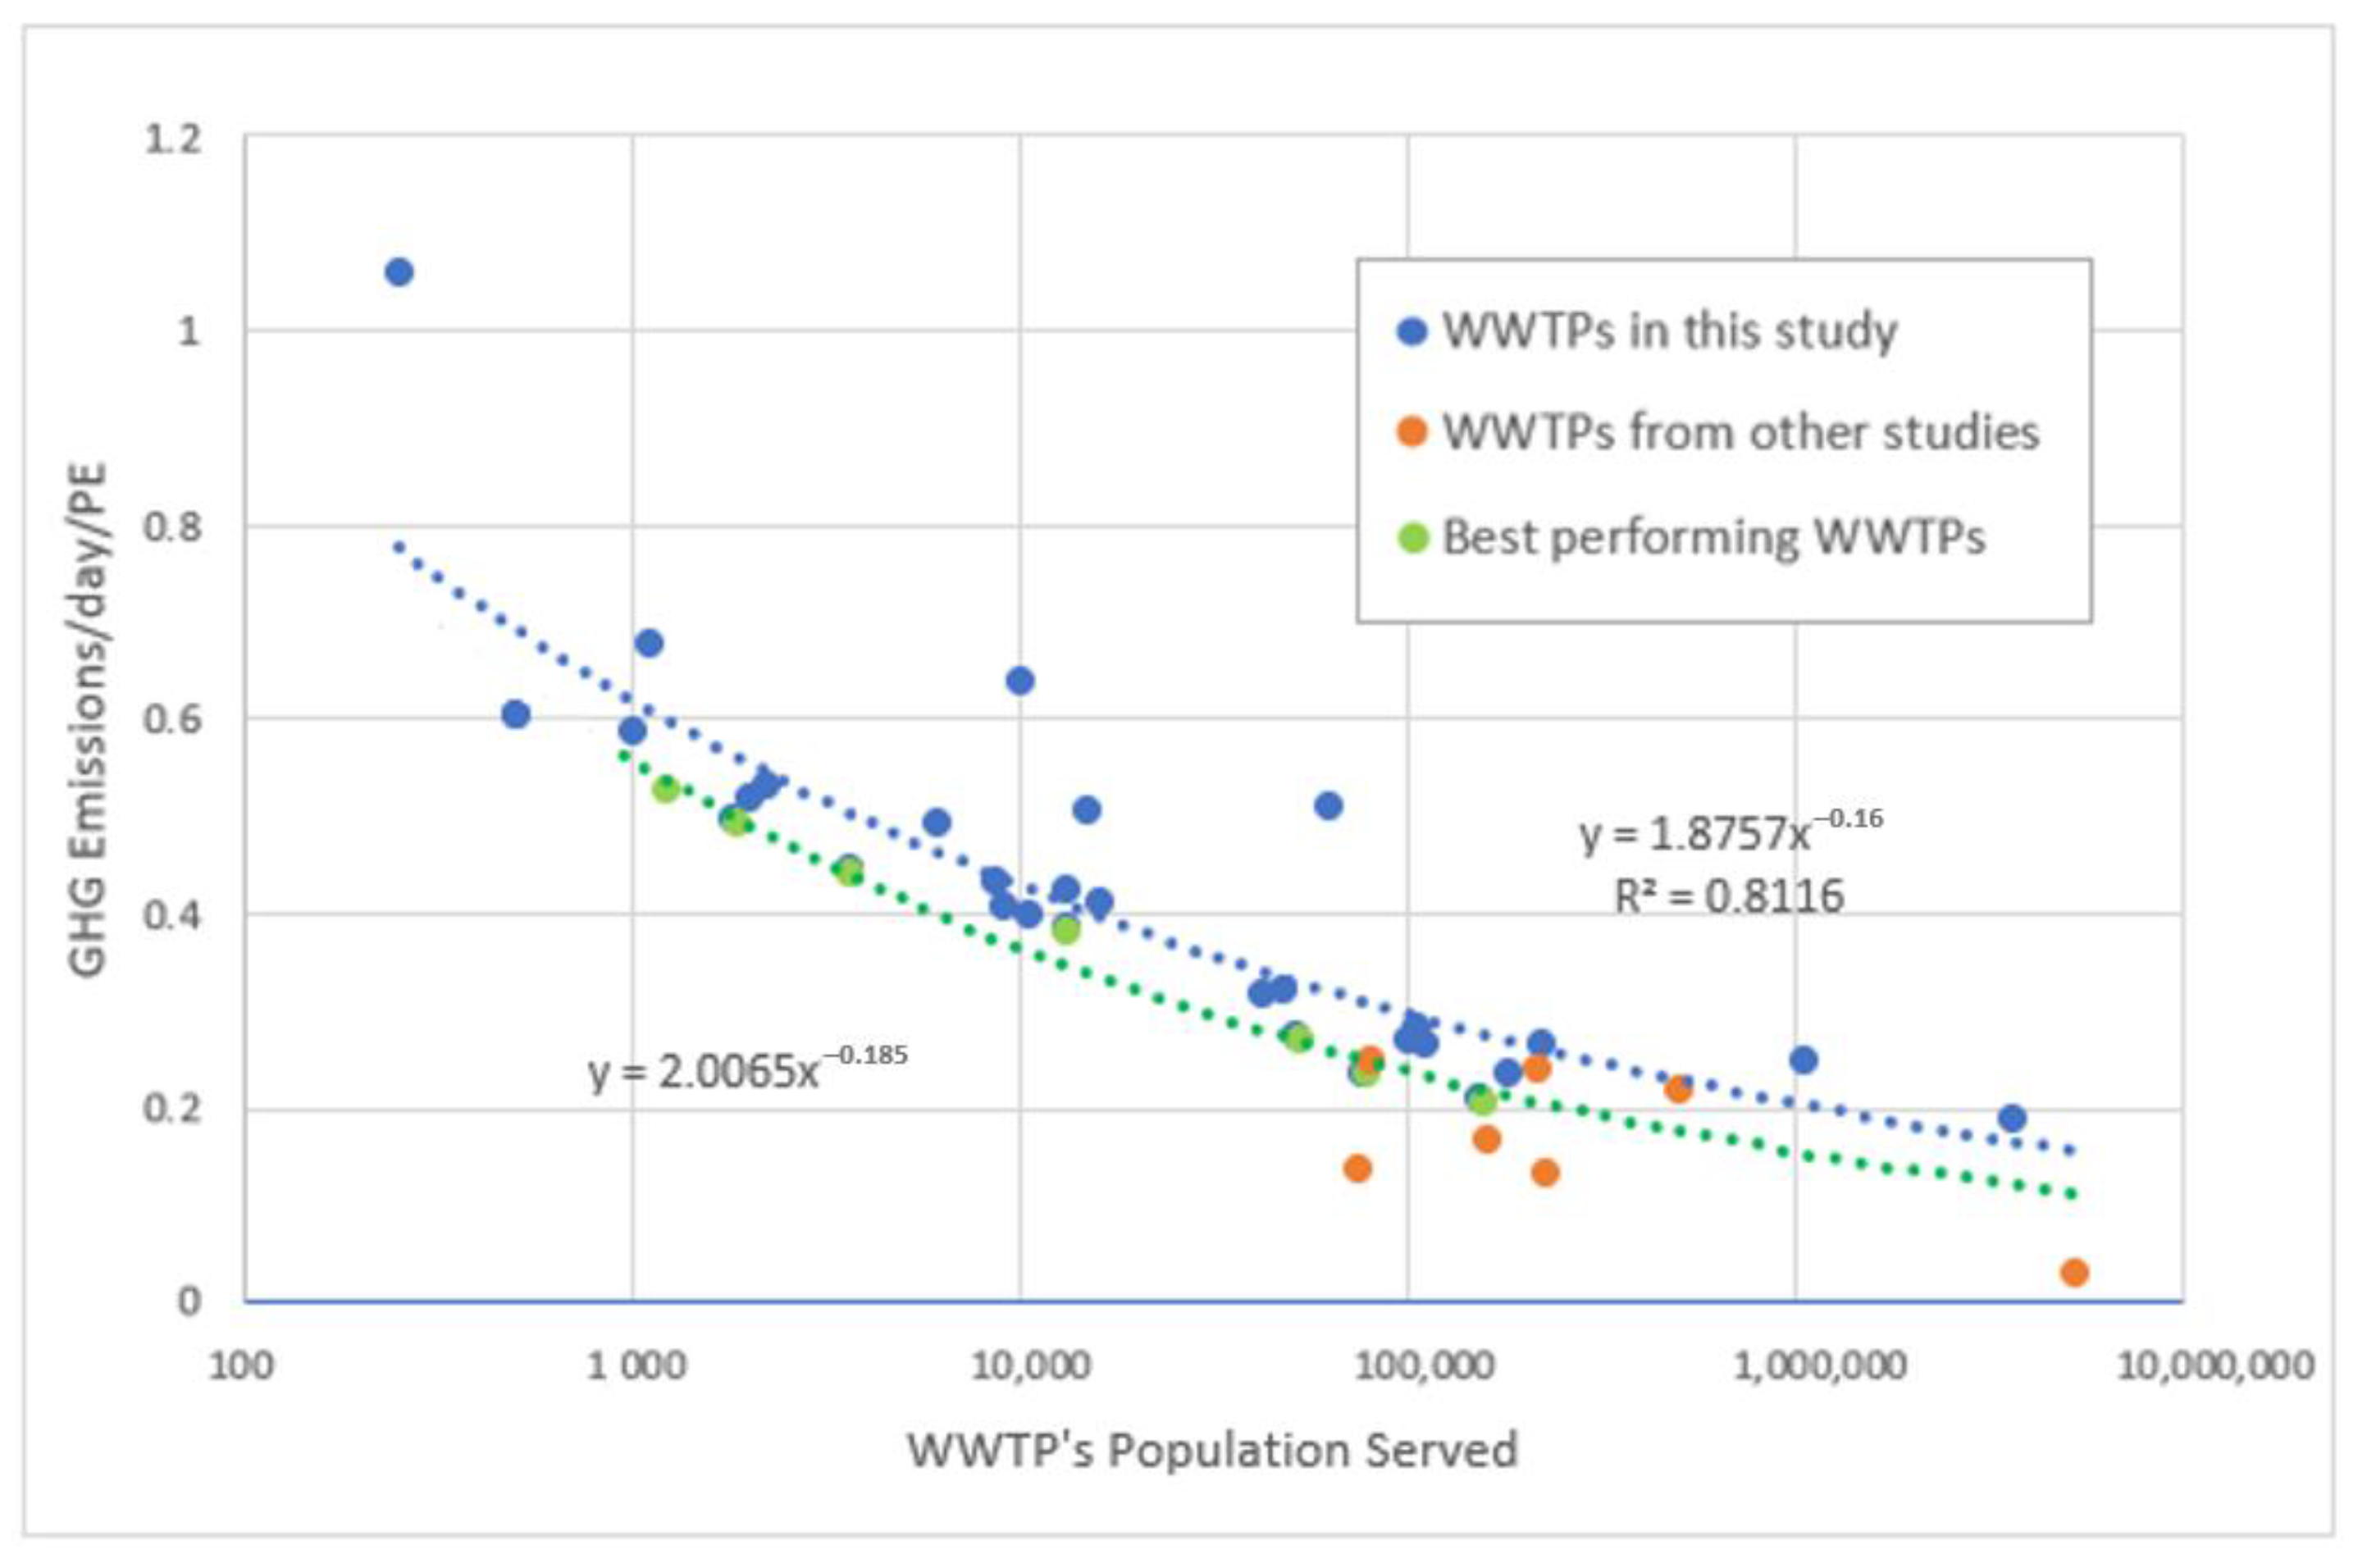
The average daily energy consumption for the WWTPs studied was calculated per PE by adopting a BOD5 load for each PE equal to 60 g/d as defined in the EU Council Directive 91/271/EEC. Average daily energy consumption for small WWTPs is 0.374 kWh/PE (with a standard deviation of 0.204 kWh/PE), for medium WWTPs 0.132 kWh/PE (with a standard deviation of 0.036 kWh/PE) and for large WWTPs 0.087 kWh/PE (with a standard deviation of 0.020 kWh/PE). Furthermore, energy consumption for small, medium and large WWTPs was calculated to be equal to 1.65 kWh/m3, 0.43 kWh/m3 and 0.33 kWh/m3, respectively. The boxplots of daily energy consumption in kWh/PE of small, medium and large Greek WWTPs are presented in Figure 2. An interesting observation is that larger WWTPs have a lower fluctuation in the energy consumption values, while small WWTPs present a higher variation in energy consumption. This was rather expected as the category of small WWTPs includes WWTPs with a variety of treatment capacities that range from 250 to 10,000 PE.
The results illustrate that larger WWTPs with conventional activated sludge treatment and anaerobic digestion consume less energy than smaller ones with extended aeration activated sludge treatment. The average consumption of conventional activated sludge treatment is 0.104 kWh/PE/d, while the average consumption of extended aeration is more than double (0.261 kWh/PE/d). The average annual specific energy consumption of all Greek WWTPs is 32 kWh/PE, a value within the range reported in the literature for WWTPs in Europe and USA [7,30].
Figure 3 represents the daily energy consumption of all WWTPs by size. The equation of the blue line presented in Figure 3 is:
y = 2.2287 x 0.268
where y is the WWTP’s daily energy consumption per capita, and x is the average population served by the WWTP. This equation can be applied for WWPTs with an average treatment capacity in the 500–3,650,000 PE range. The above equation represents the average energy consumption obtained in WWTPs according to their treatment capacity.
Furthermore, based on the available data, the more energy-efficient WWTPs (green symbols in Figure 3) were identified according to their average treatment capacity, and a similar equation was derived for WWTPs operating in the 1000–3,650,000 PE range:
y = 0.5151 x 0.17
where y is the WWTP’s daily energy consumption per capita, and x is the average population served by the WWTP. This equation can be employed to set an energy consumption target for WWTPs serving more than 1000 PE that is attainable without any additional modifications for energy recovery.
Detailed evaluation of energy consumption per treatment stage (Figure 4, Figure 5 and Figure 6) was conducted for 21 out of the 31 WWTPs where all energy and equipment data were available. Figure 4 presents the contribution of aeration to the total energy consumption. As shown in Figure 4, energy consumption for aeration accounts in most cases for 40–70% of the total energy consumption of the WWTPs, thus confirming that aeration is the primary energy consumer among wastewater treatment stages. Specifically, in smaller WWTPs, aeration contribution to the total energy footprint ranges between 60 and 70%, while the respective values for medium and large WWTPs range between 50 and 60% and 40 and 50%. The primary reason for the significantly higher energy consumption due to aeration obtained in small WWTPs is that all small WWTPs operate as extended aeration treatment systems. Similar values are reported by the State of New South Wales and Office of Environment and Heritage State [31], where activated sludge aeration attributes approximately 40–50% of total energy consumption in WWTPs.
The contribution of each treatment stage in the total energy footprint for each WWTP is highlighted in Figure 5 and Figure 6. Based on these data, it is anticipated that the biological treatment (i.e., aeration and secondary treatment) is the primary energy consumption, followed by sludge treatment facilities and primary treatment. These data are comparable with other surveys showing the energy used in each treatment stage [6].
As shown in Figure 6, aeration exerts the highest energy consumption, followed by other secondary treatment processes (i.e., bioreactors mixing, sludge recycling, mixed liquor recirculation, etc.). A promising approach to cope with the increased energy requirements for aeration is the adoption of the demand response (DR) concept [32]. Specifically, wastewater treatment case studies have proven the potential flexibility of WWTPs in aeration and pumping, using built-in redundancy for delaying treatment and sludge processing [33]. Shifting energy consumption from peak to off-peak periods to reduce economic costs for water utilities is crucial for energy-intensive activities such as wastewater treatment.

3.2. GHG Emissions

Daily GHG emissions of the three categories of WWTPs based on size are presented in Figure 7. The average daily GHG emissions for small WWTPs is 0.567 kgCO2e/PE, for medium WWTPs it is 0.393 kgCO2e/PE and for large WWTPs it is 0.244 kgCO2e/PE. In general, larger WWTPs that apply conventional activated sludge wastewater treatment and anaerobic digestion tend to have much lower GHG emissions compared to small WWTPs that operate as extended aeration activated sludge treatment systems. This is to be expected, considering the respective energy consumption results for aeration and sludge stabilization.
Figure 8 represents daily GHG emissions of all WWTPs by size that serves more than 1000 PE.
The equation of the GHG emissions presented in Figure 8 (blue line) is:
y = 1.8757 x 0.16   for   WWPTs   serving   500 3,500,000   PE
where y is the WWTP’s daily GHG emissions per capita, and x is the population served by the WWTP. The above equation represents the average GHG emissions obtained in WWTPs according to their treatment capacity.
Furthermore, based on the available data, the WWTPs performing better in terms of GHG emissions (green symbols in Figure 8) were identified according to their average treatment capacity, and a similar equation was derived for WWTPs operating in the 1000–3,650,000 PE range:
y = 2.0065 x 0.185
where y is the WWTP’s daily GHG emissions per capita, and x is the population served by the WWTP. This equation can be employed to set a GHG emissions target for WWTPs that is attainable without any additional modifications for emissions reduction. This threshold can be adjusted for other countries by changing the energy mix.
The average annual GHG emissions from all Greek WWTPs is 73 kgCO2e/PE, a value that is within the range of values reported in the literature [11,15,16,34]. Average annual on-site GHG emissions are equal to 56.1 kgCO2e/PE, while off-site GHG emissions account for 16.9 kgCO2e/PE. Approximately 30% of the total GHG emissions are related to electrical energy consumption, and thus they can be reduced if renewable energy sources are used.
Figure 8 provides a comparison between the calculated values of this study with the respective ones from other studies for WWTPs with a capacity over 50,000 PE [35,36,37]. Blue and green points represent the GHG emissions of WWTPs of this study, and orange points represent emissions from other studies. It should be underlined that the higher GHG emissions of the present study compared to the values of other studies are mostly attributed to the inclusion of the emissions due to chemical use and effluent disposal in the present study.
The average annual biogenic emissions are equal to 57.8 kgCO2e/PE, while the non-biogenic emissions are equal to 15.6 kgCO2e/PE. Greek energy policy includes the withdrawal of all coal-fired power plants by 2028, and the proportion of renewable energy in the energy mix is set to reach 35% of the total. This will decrease GHG emissions to some extent, especially the off-site emissions of WWTPs, which are related to energy consumption, and further reduction is expected by 2050 when climate neutrality should be achieved according to the European Green Deal [38].
Future research can integrate on-site measurements for GHG emissions, as indirect calculations are not always representative, considering the spatial, temporal and other variations in WWTPs [39]. Furthermore, the life cycle assessment (LCA) application can highlight the environmental impacts of the selected WWTPs and can be used as a tool to find the most efficient operational strategy [40].
Many measures can be taken in order to achieve the goal of energy consumption and GHG emissions reduction. These measures include the establishment of a facility’s energy policy, performing energy audits and identifying energy-consuming activities, the prioritization of energy improvement projects, the definition of key performance indicators (KPIs), as well as the implementation of an energy improvement system and monitoring the results of the management program and, ultimately, its maintenance. The replacement of the existing equipment with new, more energy-efficient equipment and the optimization of the operation can also be important factors towards the improvement of the energy profile of WWTPs [41]. Renewable energy sources can also be implemented successfully in WWTPs [42,43], and green public procurement criteria for the construction and operation of WWTPs should include energy consumption and GHG emissions requirements. Implementation of automatic control can also improve energy consumption and reduce GHG emissions. Moreover, as proven in the current study, the WWTP’s operational priorities and treatment methods can also reduce energy consumption and emissions. This work can provide useful threshold values for both energy consumption and GHG gas emissions reduction without any additional modifications for energy recovery. It should be underlined that the potential chemical energy in municipal wastewater that can be harvested through treatment exceeds the energy consumption of a conventional activated sludge plant by at least a factor of 5. Recently, new emerging configurations of wastewater treatment were proposed that could achieve net energy-neutral or even energy-positive wastewater treatment [44]. These novel processes such as chemically enhanced primary treatment (CEPT), high rate activated sludge process (A/B process), partial nitritation/anammox, bio-solids pretreatment, anaerobic membrane bioreactors (AnMBR), microbial fuel cells, co-digestion of bio-solids, etc., rely on energy recovery from biosolids and wastewater while minimizing energy consumption [45].

4. Conclusions

Studies for the optimization of energy efficiency of WWTPs have been carried out for decades, but the climate crisis is making the reduction in energy consumption and GHG emissions an emergency. Energy efficiency and GHG emissions reduction are a priority for national authorities globally, and wastewater treatment exerts a significant energy demand.
The extended survey of Greek WWTPs shows that smaller WWTPs tend to have higher specific electricity consumption and GHG emissions than larger WWTPs. Equations are derived for calculating target energy consumption and GHG emissions depending on the population served by the treatment plant. The conventional activated sludge WWTPs consume less energy than extended aeration WWTPs.
The energy consumption of aeration stands for 40–70% of the total energy consumption of the WWTP. The WWTPs that include anaerobic digesters are more energy efficient. The results of this study are comparable to energy consumption and GHG emissions values reported in the literature. Average annual energy consumption for small, medium and large WWTPs in Greece equals 137 kWh/PE, 48 kWh/PE and 32 kWh/PE, respectively. The average annual GHG emissions for small, medium and large WWTPs is 207 kgCO2e/PE, 144 kgCO2e/PE and 89 kgCO2e/PE, respectively. Annual average on-site GHG emissions are equal to 56.5 kgCO2e/PE, while average off-site GHG emissions account for 16.9 kgCO2e/PE. Biogenic emissions are equal to 57.8 kgCO2e/PE and the non-biogenic emissions are 15.6 kgCO2e/PE.

Author Contributions

Conceptualization, N.G. and D.M.; Formal analysis, N.G., A.D. and C.K.; Investigation, N.G., A.D. and C.K.; Methodology, N.G., D.M. and C.N.; Software, N.G.; Supervision, D.M.; Validation, D.M. and C.N.; Writing—original draft, N.G.; Writing—review and editing, D.M. and C.N. All authors have read and agreed to the published version of the manuscript.

Funding

This research received no external funding.

Institutional Review Board Statement

Not applicable.

Informed Consent Statement

Not applicable.

Data Availability Statement

The data presented in this study are available within the article. For any additional data the corresponding authors may be contacted.

Conflicts of Interest

The authors declare no conflict of interest.

References

  1. Gu, Y.; Li, Y.; Li, X.; Luo, P.; Wang, H.; Wang, X.; Wu, J.; Li, F. Energy self-sufficient wastewater treatment plants: Feasibilities and challenges. Energy Procedia 2017, 105, 3741–3751. [Google Scholar] [CrossRef]
  2. Tolkou, A.K.; Zouboulis, A.I. Effect of climate change in WWTPs with a focus on MBR infrastructure. Desalination Water Treat. 2016, 57, 2344–2354. [Google Scholar] [CrossRef]
  3. Dickin, S.; Bayoumi, M.; Giné, R.; Andersson, K.; Jiménez, A. Sustainable Sanitation and gaps in global climate policy and financing. Npj Clean Water 2020, 3, 24. [Google Scholar] [CrossRef]
  4. Daw, J.; Hallett, K.; DeWolfe, J.; Venner, I. Energy Efficiency Strategies for Municipal Wastewater Treatment Facilities; Technical Report NREL/TP-7A30-53341; National Renewable Energy Lab. (NREL): Golden, CO, USA, 2012.
  5. Simon-Várhelyi, M.; Cristea, V.M.; Luca, A.V. Reducing energy costs of the wastewater treatment plant by improved scheduling of the periodic influent load. J. Environ. Manag. 2020, 262, 110294. [Google Scholar] [CrossRef] [PubMed]
  6. Vergara-Araya, M.; Hilgenfeldt, V.; Peng, D.; Steinmetz, H.; Wiese, J. Modelling to lower energy consumption in a large wwtp in china while optimising nitrogen removal. Energies 2021, 14, 5826. [Google Scholar] [CrossRef]
  7. Stillwell, A.; Hoppock, D.; Webber, M. Energy recovery from wastewater treatment plants in the United States: A case study of the energy-water nexus. Sustainability 2010, 2, 945–962. [Google Scholar] [CrossRef] [Green Version]
  8. Jonasson, M. Energy Benchmark for Wastewater Treatment Processes—A Comparison between Sweden and Austria; Department of Industrial Electrical Engineering and Automation, Lund University: Lund, Sweden, 2007. [Google Scholar]
  9. Balmer, P. Operation costs and consumption of resources at nordic nutrient removal plants. Water Sci. Technol. 2000, 41, 273–279. [Google Scholar] [CrossRef]
  10. Krampe, J. Energy benchmarking of South Australian WWTPs. Water Sci. Technol. 2013, 67, 2059–2066. [Google Scholar] [CrossRef]
  11. Mamais, D.; Noutsopoulos, C.; Dimopoulou, A.; Stasinakis, A.; Lekkas, T.D. Wastewater treatment process impact on energy savings and greenhouse gas emissions. Water Sci. Technol. 2015, 71, 303–308. [Google Scholar] [CrossRef]
  12. O’Conner, K.; Cantwell, J.; Wilson, M.; Bolles, S.; Schmidt, A.; Burgess, J. Evaluation of Energy Conservation Measures for Wastewater Treatment Facilities; EPA: Washington, DC, USA, 2010.
  13. EPA Estimate of Global Greenhouse Gas Emissions from Industrial and Domestic Wastewater Treatment; EPA: Washington, DC, USA, 1997.
  14. Zib, L.; Byrne, D.M.; Marston, L.T.; Chini, C.M. Operational carbon footprint of the U.S. water and wastewater sector’s energy consumption. J. Clean. Prod. 2021, 321, 128815. [Google Scholar] [CrossRef]
  15. Gustavsson, D.J.I.; Tumlin, S. Carbon footprints of scandinavian wastewater treatment plants. Water Sci. Technol. 2013, 68, 887–893. [Google Scholar] [CrossRef] [PubMed]
  16. Wendland, A. Operation Costs of Wastewater Treatment Plants; Employee of Hamburg Public Sewage Company: Ahrensburg, Germany, 2005; Available online: https://cgi.tu-harburg.de/~awwweb/wbt/emwater/documents/slides_c2.pdf (accessed on 22 December 2021).
  17. European Commission 2030 Climate Target Plan. Available online: https://ec.europa.eu/clima/eu-action/european-green-deal/2030-climate-target-plan_el (accessed on 8 November 2021).
  18. Parravicini, V.; Svardal, K.; Krampe, J. Greenhouse Gas Emissions from Wastewater Treatment Plants. Energy Procedia 2016, 97, 246–253. [Google Scholar] [CrossRef] [Green Version]
  19. Khalkhali, M.; Mo, W. The energy implication of climate change on urban wastewater systems. J. Clean. Prod. 2020, 267, 121905. [Google Scholar] [CrossRef]
  20. Qadir, M.; Drechsel, P.; Jiménez Cisneros, B.; Kim, Y.; Pramanik, A.; Mehta, P.; Olaniyan, O. Global and regional potential of wastewater as a water, nutrient and energy source. Nat. Resour. Forum 2020, 44, 40–51. [Google Scholar] [CrossRef] [Green Version]
  21. Howard, G.; Calow, R.; Macdonald, A.; Bartram, J. Climate change and water and sanitation: Likely impacts and emerging trends for action. Annu. Rev. Environ. Resour. 2016, 41, 253–276. [Google Scholar] [CrossRef] [Green Version]
  22. Campana, P.E.; Mainardis, M.; Moretti, A.; Cottes, M. 100% renewable wastewater treatment plants: Techno-economic assessment using a modelling and optimization approach. Energy Convers. Manag. 2021, 239, 114214. [Google Scholar] [CrossRef]
  23. Kollmann, R.; Neugebauer, G.; Kretschmer, F.; Truger, B.; Kindermann, H.; Stoeglehner, G.; Ertl, T.; Narodoslawsky, M. Renewable energy from wastewater—Practical aspects of integrating a wastewater treatment plant into local energy supply concepts. J. Clean. Prod. 2017, 155, 119–129. [Google Scholar] [CrossRef]
  24. Mi, Z.; Guan, D.; Liu, Z.; Liu, J.; Viguié, V.; Fromer, N.; Wang, Y. Cities: The core of climate change mitigation. J. Clean. Prod. 2019, 207, 582–589. [Google Scholar] [CrossRef]
  25. EPA Energy Efficiency in Water and Wastewater Facilities; EPA: Washington, DC, USA, 2013.
  26. Cooper, R.N.; Houghton, J.T.; McCarthy, J.J.; Metz, B. Climate change 2001: The scientific basis. Foreign Aff. 2002, 81. [Google Scholar] [CrossRef]
  27. Bridle, T.; Shaw, A.; Cooper, S.; Yap, K.; Third, K.; Domurad, M. Estimation of greenhouse emissions from wastewater treatment plants. In Proceedings of the IWA World Water Congress, Vienna, Austria, 7–12 September 2008. [Google Scholar]
  28. Snip, L. Quantifying the Greenhouse Emissions of Wastewater Plants. 2010. Available online: https://edepot.wur.nl/138115 (accessed on 22 December 2021).
  29. PPC What Is the Energy Mix in Your Bill? Available online: https://www.dei.gr/el/oikiakoi-pelates/xrisimes-plirofories-gia-to-logariasmo-sas/logariasmos-kai-xrewseis/ti-einai-to-energeiako-migma-sto-logariasmo (accessed on 2 December 2021).
  30. Johansson, J. Risk and Vulnerability Analysis of Interdependent Technical Infrastructures: Addressing Socio-Technical Systems; Lund University, Department of Measurement Technology and Industrial Electric Engineering: Lund, Sweden, 2010. [Google Scholar]
  31. State of New South Wales and Office of Environment and Heritage Energy Efficiency Opportunities in Wastewater Treatment Facilities; 2019. Available online: https://www.environment.nsw.gov.au/resources/business/wastewater-treatment-facilities-energy-efficiency-opportunities-190114.pdf (accessed on 22 December 2021).
  32. Kirchem, D.; Lynch, M.; Bertsch, V.; Casey, E. Modelling demand response with process models and energy systems models: Potential applications for wastewater treatment within the energy-water nexus. Appl. Energy 2020, 260, 114321. [Google Scholar] [CrossRef]
  33. Cottes, M.; Mainardis, M.; Goi, D.; Simeoni, P. Demand-response application in wastewater treatment plants using compressed air storage system: A modelling approach. Energies 2020, 13, 4780. [Google Scholar] [CrossRef]
  34. Flores-Alsina, X.; Corominas, L.; Snip, L.; Vanrolleghem, P.A. Including greenhouse gas emissions during benchmarking of wastewater treatment plant control strategies. Water Res. 2011, 45, 4700–4710. [Google Scholar] [CrossRef] [PubMed]
  35. Wang, H.; Yang, Y.; Keller, A.A.; Li, X.; Feng, S.; Dong, Y.N.; Li, F. Comparative analysis of energy intensity and carbon emissions in wastewater treatment in USA, Germany, China and South Africa. Appl. Energy 2016, 184, 873–881. [Google Scholar] [CrossRef] [Green Version]
  36. Singh, V.; Phuleria, H.C.; Chandel, M.K. Estimation of greenhouse gas emissions from municipal wastewater treatment systems in India. Water Environ. J. 2017, 31, 537–544. [Google Scholar] [CrossRef]
  37. Negi, R.; Chandel, M.K. Analysing water-energy-ghg nexus in a wastewater treatment plant of Mumbai metropolitan region, India. Environ. Res. 2021, 196, 110931. [Google Scholar] [CrossRef] [PubMed]
  38. Wolf, S.; Teitge, J.; Mielke, J.; Schütze, F.; Jaeger, C. The European green deal—More Than climate neutrality. Intereconomics 2021, 56, 99–107. [Google Scholar] [CrossRef]
  39. Yoshida, H.; Mønster, J.; Scheutz, C. Plant-integrated measurement of greenhouse gas emissions from a municipal wastewater treatment plant. Water Res. 2014, 61, 108–118. [Google Scholar] [CrossRef]
  40. Nguyen, T.K.L.; Ngo, H.H.; Guo, W.S.; Chang, S.W.; Nguyen, D.D.; Nghiem, L.D.; Nguyen, T.V. A critical review on life cycle assessment and plant-wide models towards emission control strategies for greenhouse gas from wastewater treatment plants. J. Environ. Manag. 2020, 264, 110440. [Google Scholar] [CrossRef]
  41. Ganora, D.; Hospido, A.; Husemann, J.; Krampe, J.; Loderer, C.; Longo, S.; Moragas Bouyat, L.; Obermaier, N.; Piraccini, E.; Stanev, S.; et al. Opportunities to improve energy use in urban wastewater treatment: A European-scale analysis. Environ. Res. Lett. 2019, 14, 044028. [Google Scholar] [CrossRef]
  42. Yang, X.; Wei, J.; Ye, G.; Zhao, Y.; Li, Z.; Qiu, G.; Li, F.; Wei, C. The correlations among wastewater internal energy, energy consumption and energy recovery/production potentials in wastewater treatment plant: An assessment of the energy balance. Sci. Total Environ. 2020, 714, 136655. [Google Scholar] [CrossRef]
  43. Xu, J.; Li, Y.; Wang, H.; Wu, J.; Wang, X.; Li, F. Exploring the feasibility of energy self-sufficient wastewater treatment plants: A case study in eastern China. Energy Procedia 2017, 142, 3055–3061. [Google Scholar] [CrossRef]
  44. Jenicek, P.; Kutil, J.; Benes, O.; Todt, V.; Zabranska, J.; Dohanyos, M. Energy self-sufficient sewage wastewater treatment plants: Is optimized anaerobic sludge digestion the key? Water Sci. Technol. 2013, 68, 1739–1744. [Google Scholar] [CrossRef] [PubMed]
  45. Liu, Y.; Gu, J.; Zhang, M. A-B Processes: Towards Energy Self-Sufficient Municipal Wastewater Treatment; IWA Publishing: London, UK, 2020. [Google Scholar]
Figure 1. The location of the 31 WWTPs.
Water 14 00320 g001
Figure 2. Energy Consumption by size of WWTP.
Water 14 00320 g002
Figure 3. WWTP Energy Consumption by Population Served.
Water 14 00320 g003
Figure 4. Percentage of Aeration Energy Consumption.
Water 14 00320 g004
Figure 5. Energy Consumption by WWTP treatment phase.
Water 14 00320 g005
Figure 6. Average Proportional Energy Consumption by WWTP treatment phase.
Water 14 00320 g006
Figure 7. GHG emissions by size of WWTP.
Water 14 00320 g007
Figure 8. WWTP GHG Emissions by Population Served.
Water 14 00320 g008
Table 1. WWTP’s population served and treatment method.
GroupsA/aPopulation ServedTreatment MethodNutrient
Removal
Small1250Type 1N
2500Type 1N
31000Type 1N & P
41101Type 1N
51230Type 1N
61850Type 1N & P
72000Type 1N
82209Type 1N & P
93620Type 1-
106215Type 1N & P
118704Type 1-
129123Type 1N
Medium1310,033Type 1N & P
1410,494Type 1N
1513,125Type 1N & P
1613,268Type 1N & P
1715,000Type 1N
1816,243Type 1-
1942,672Type 2N & P
2047,475Type 1N
2152,003Type 2N
2263,167Type 1N & P
2377,278Type 1N & P
2499,760Type 1N
Large25105,421Type 2N
26109,814Type 2N
27155,080Type 2N & P
28180,997Type 2N
29224,517Type 2N
301,050,874Type 3N
313,646,388Type 3N
Type 1: Extended Aeration, sludge thickening and dewatering. Type 2: Conventional Activated Sludge, sludge thickening, anaerobic digestion and dewatering. Type 3: Conventional Activated Sludge, sludge thickening, anaerobic digestion, cogeneration and dewatering.
Publisher’s Note: MDPI stays neutral with regard to jurisdictional claims in published maps and institutional affiliations.

