1. Introduction
Surface water flooding is a significant problem within urban areas during heavy rainfall. Climate change projections suggest such rainfall is likely to increase, and without significant adaptation, in many cities, drainage systems will be unable to cope leading to greater damages [
1,
2]. Future projections show that across Europe, flood average annual losses could increase by 5% to 10%, according to seasonality per decade under a 1.5 °C global warming scenario [
3]. Property exposure to frequent flooding in the UK could increase by 20% with an associated increase in expected annual damage of 25% by 2050 under a 2 °C global warming scenario [
4]. The proportional increase for surface water is considered greater in Scotland than elsewhere in the UK [
5]. In Scotland, there are approximately 210,000 properties at risk of surface water flooding at the 200-year return period (0.5% annual exceedance probability) equating to GBP 310 million of potential annual average damages [
6].
Mapping future climate change scenarios for multiple possible projections is needed to allow adaptation and mitigation planning. Traditionally, national-scale risk mapping is a resource-intensive process, typically requiring detailed hydraulic modelling and hazard mapping. We present an interpolation method to allow quick, cheap calculation of damages at the property level. The method is applied to Scotland to meet the needs of the Scottish Environment Protection Agency (SEPA), but the framework presented could be applied to other regions.
The use of hazard- and risk-based assessments to quantify flooding under various climate scenarios to support the identification of adaptation measures to reduce impacts is a requirement for Member States under the European Union Floods Directive (2007/60/EC). SEPA has a strategic role in delivering the 6-yearly cycles of the Directive as transposed into Scots Law: the Flood Risk Management (Scotland) Act 2009. Pluvial flood hazard mapping [
7,
8] and associated strategic appraisal of flood risk (and potential damages) most recently in the National Flood Risk Assessment (NFRA) 2018 [
6] developed as part of the implementation of the Directive in Scotland are underpinned by rainfall estimates based on the Flood Estimation Handbook (FEH) depth–duration–frequency (DDF) model (FEH99) [
9]. These rainfall estimates have been revised to an updated DDF model, FEH13 [
10]. The updated estimates show a significant increase in short-duration (<6 h), high-frequency rainfall for Scotland, which is typically associated with surface water flooding [
11]. The increase is as much as 69% for some locations; it is caused by both improved hourly rainfall observation data since FEH99 and a new statistical model in FEH13, which allows rainfall estimates across a range of frequencies including those very low frequency events used in reservoir safety cases [
10]. As well as the revised rainfall estimates, new and updated data, such as the revised UK climate change projections, UKCP18, and improved Light Detection and Ranging (LiDAR) coverage, necessitate a wholesale revision of Scottish pluvial flood hazard mapping.
Flood mapping at a national scale is time consuming; the hydraulic modelling which underpins existing Scottish pluvial hazard mapping took place between 2010 and 2013 [
8]. This was initially produced at a broad national scale to inform NFRA 2011 using a simplified two-dimensional (2D) modelling solution, Flood Modeller Fast [
12]. It was expanded with further national-scale modelling [
13] and enhanced with detailed modelling for those 77 catchments across Scotland with the greatest pluvial risk (as identified in NFRA 2011) using a full 2D modelling solution of the shallow water equations, JFlow+ [
14]. These hazard maps, with their fluvial and coastal equivalents, have informed subsequent national risk assessments and flood risk management planning by SEPA as required by the Directive, namely the Flood Risk Management Strategies 2015 and the NFRA 2018.
The new and updated data available for Scotland and typical national flood modelling timescales do not allow an incremental approach to updating existing mapping. Hazard and risk modelling using the revised FEH13 rainfall estimates has been limited to a small number of pilot catchments [
15,
16,
17]. A rapid assessment of the changes would therefore aid Scottish flood risk management decision making. If the impacts can be monetised, the risks can be quantified by developing loss probability curves [
18,
19]. Expected Annual Damages (EAD) values estimate all probable flood losses within a year and are derived from a flood loss probability curve by estimating the economic values of direct and indirect impacts for given event probabilities [
20,
21,
22]. EAD as a risk indicator is a key component in the flood risk management decision-making process [
23].
Interpolation techniques applied to flood loss probability curves at a meso-scale can provide an appropriate and simple approach to estimating such changes. The future flood explorer used in the UK Climate Change Risk Assessments is an example of the application of an interpolation approach where impact curves were produced for calculation areas and used to ‘look up’ impacts on risk metrics for any given return period [
24,
25].
This paper presents an interpolation method applied at a property level using FEH99-derived hazard and risk outputs combined with the revised FEH13 rainfall estimates to determine the impact of changes in rainfall on the number of properties at risk and EAD calculations without the requirement for detailed hydraulic modelling. These methods provide a framework by which flood risk management policy and investment decision makers can rapidly assess the impacts of changes in flood risk science, e.g., new climate change projections in a timely manner. The interpolation techniques are first applied to a pilot case study for which detailed hydraulic modelling outputs were available using both FEH99 and FEH13 to test the reliability of results, before application at a national scale.
2. Materials and Methods
In flood risk, the annual exceedance probability is typically associated with the recurrence interval of a hydrometeorological event, i.e., rainfall (
Figure 1a). The established theoretical approach to quantify the potential financial consequences of such events (
Figure 1) combines hydrology, hydraulics, land use, and economic loss valuation to support these estimations and is common practice [
21,
22,
26]. A rainfall-runoff model establishes the relationship between annual exceedance probability and discharge estimates, which can then be converted into a flood depth via hydraulic modelling (
Figure 1b). A spatial analysis of flood depth with land use information and vulnerability indicators (
Figure 1 c) establishes the associated damages, and the relationship between exceedance probability and damages—the purpose, the resolution, the data quality, and uncertainties varying with the scale of analysis [
20].
The number of discrete events analysed for the EAD calculation is often limited to a few annual exceedance probabilities and a linear interpolation is performed between each damage-exceedance probability point of the curve, high probability, low damages events contributing the most to the EAD [
23]. The discrete annual exceedance probabilities or return periods are often predefined and recommended according to the context.
The interpolation techniques applied in this paper are based on the assumption that the relationship between a pluvial flood depth and a rainfall event can be considered linear between two successive return periods. This relationship can be used to estimate the expected annual damages under new climatic scenarios as illustrated in
Figure 1b. The interpolation approach developed builds on a previous study [
16,
17], which interpolates flood damages for future scenarios from existing model results based on present day extreme rainfall at a model grid cell level. However, in this paper, interpolation is applied considering the flood depth estimated at a property level. In the following equations, the flood depth refers to the flood depth at an individual property. For some properties, the flood depth is only known for the most extreme rainfall event as they are only modelled as flooded once. In such cases, the interpolation is not possible, and the flood depth value is used as an approximate value for the new event.
If the flood depth
is known for two rainfall events (
and
), then the flood depth of a new rainfall event
can be estimated using Equation (1).
where:
= flood depth (m);
= rainfall depth (mm);
= rainfall events;
with: and .
If the new rainfall event
is smaller than the smallest rainfall event modelled, then it is necessary to estimate the potential initial rainfall event flooding point
using Equation (2). If the calculated
value is smaller than the preceding rainfall depth value associated with no property flooding, then this later value is used as
.
where:
Once
is known, the flood depth of a new rainfall event
can be estimated using Equation (3):
The property damages and corresponding Expected Annual Damages are then derived from the new set of flood depths using depth–damage curves.
Working at the property level scale does not permit an assessment of ‘newly flooded’ properties beyond the available modelled flood hazard extents, i.e., properties now potentially at risk due to a revised rainfall scenario but not previously identified as such from previous hazard mapping. ‘Newly flooded’ property might be related to either an increase in existing flood extents or to new areas of flooding in other urban zones. A different approach is required to estimate the increase in exposure due to the increase in the maximum flood extent for low-probability rainfall events. The number of newly flooded properties is estimated by extrapolating from the number of flooded properties at the two largest available return periods (Equation (4)). The extrapolation could be undertaken at any suitable and relevant spatial unit of analysis. This calculation is capped at the total number of properties in each spatial unit to ensure a plausible upper limit to damage estimates. Additional expected annual damages associated with the typical distribution of depth for exposed properties at each return period can then be derived using a Weighted Annual Average Damage (WAAD) Estimate.
where:
The interpolation and extrapolation calculations require, for each property and for each return period, the baseline and new rainfall data, and the baseline flood depth. Depth–damage curves and weighted annual average damages are required to estimate EAD. The total number of properties is also required for the extrapolation. Existing flood hazard mapping and risk analysis, which identify properties at risk and associated flood depths, are required to establish the baseline for use in these analyses. A sample of areas representative of different catchment characteristics should also be modelled under new rainfall data to compare and validate the interpolated and modelled EAD and the resulting loss probability curves.
3. Results
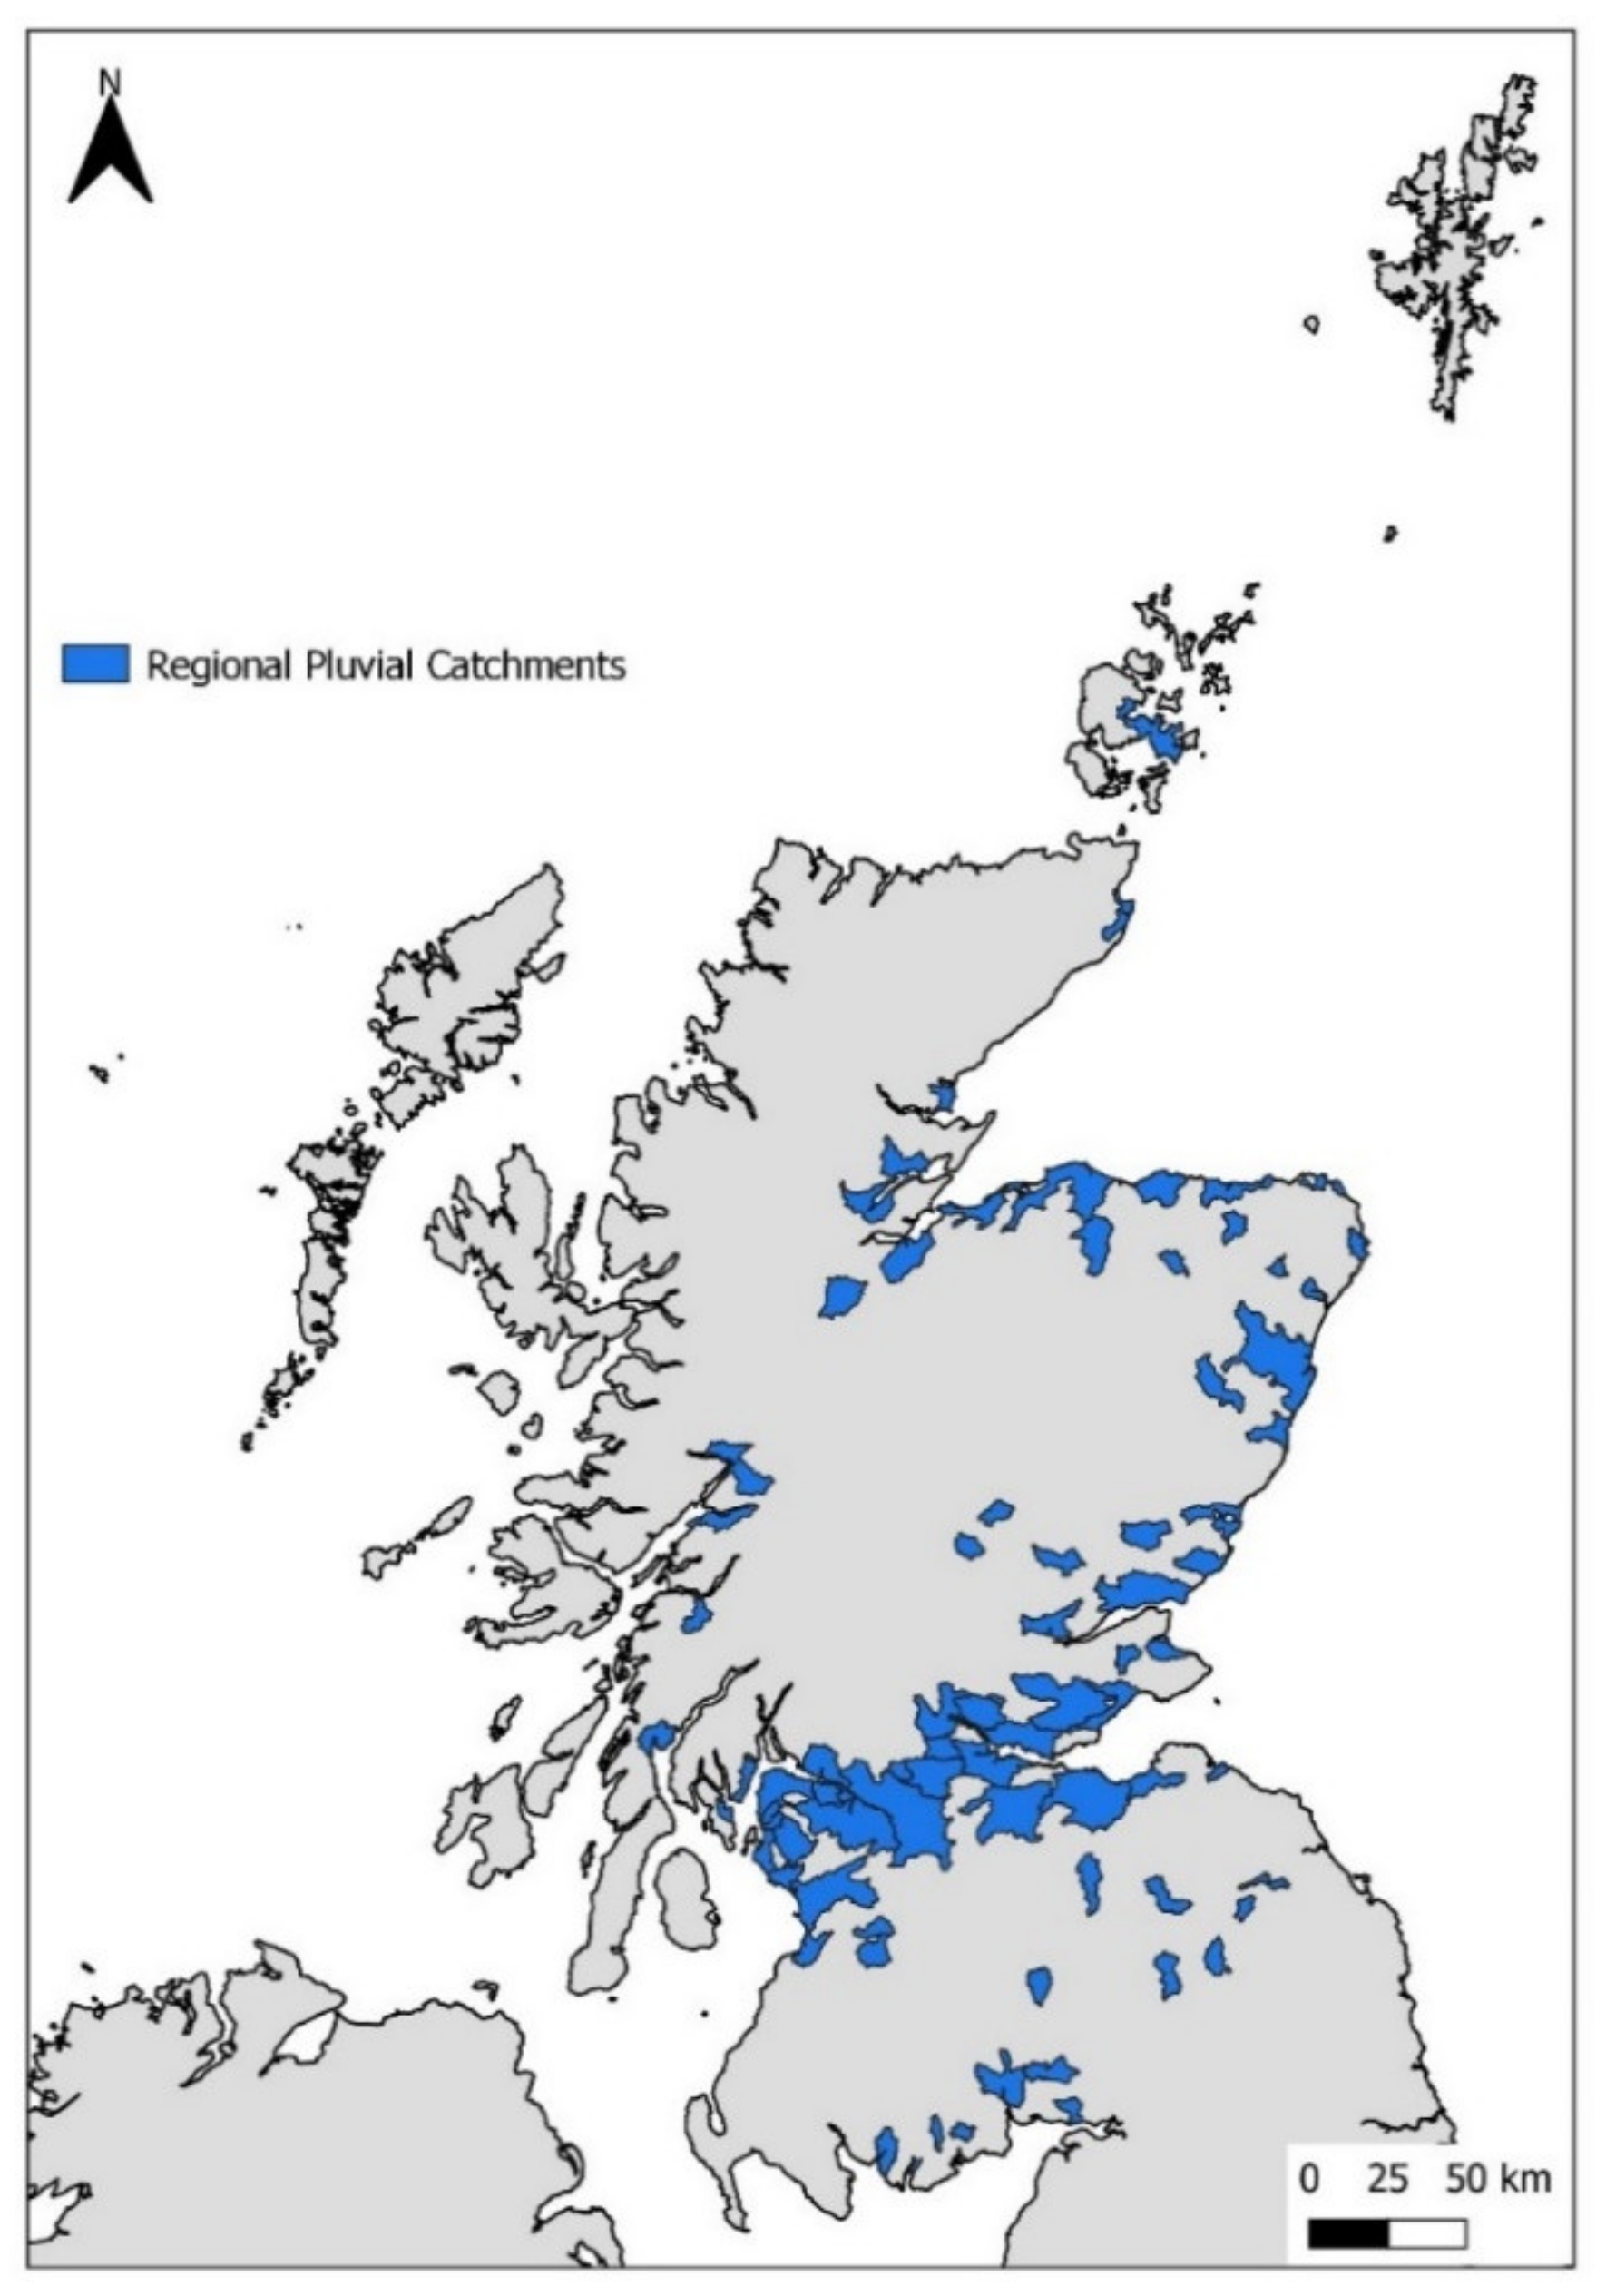
For 77 catchments across Scotland (
Figure 2), pluvial flood hazard data based on detailed 2D hydraulic modelling [
14], property-level flood depths, and EAD values [
6] are available for this study; these are known as ‘Regional Pluvial’ catchments to distinguish them from broadscale national modelling that also exists. Catchment sizes range from 8 km
2 (Kirkcudbright) to 541 km
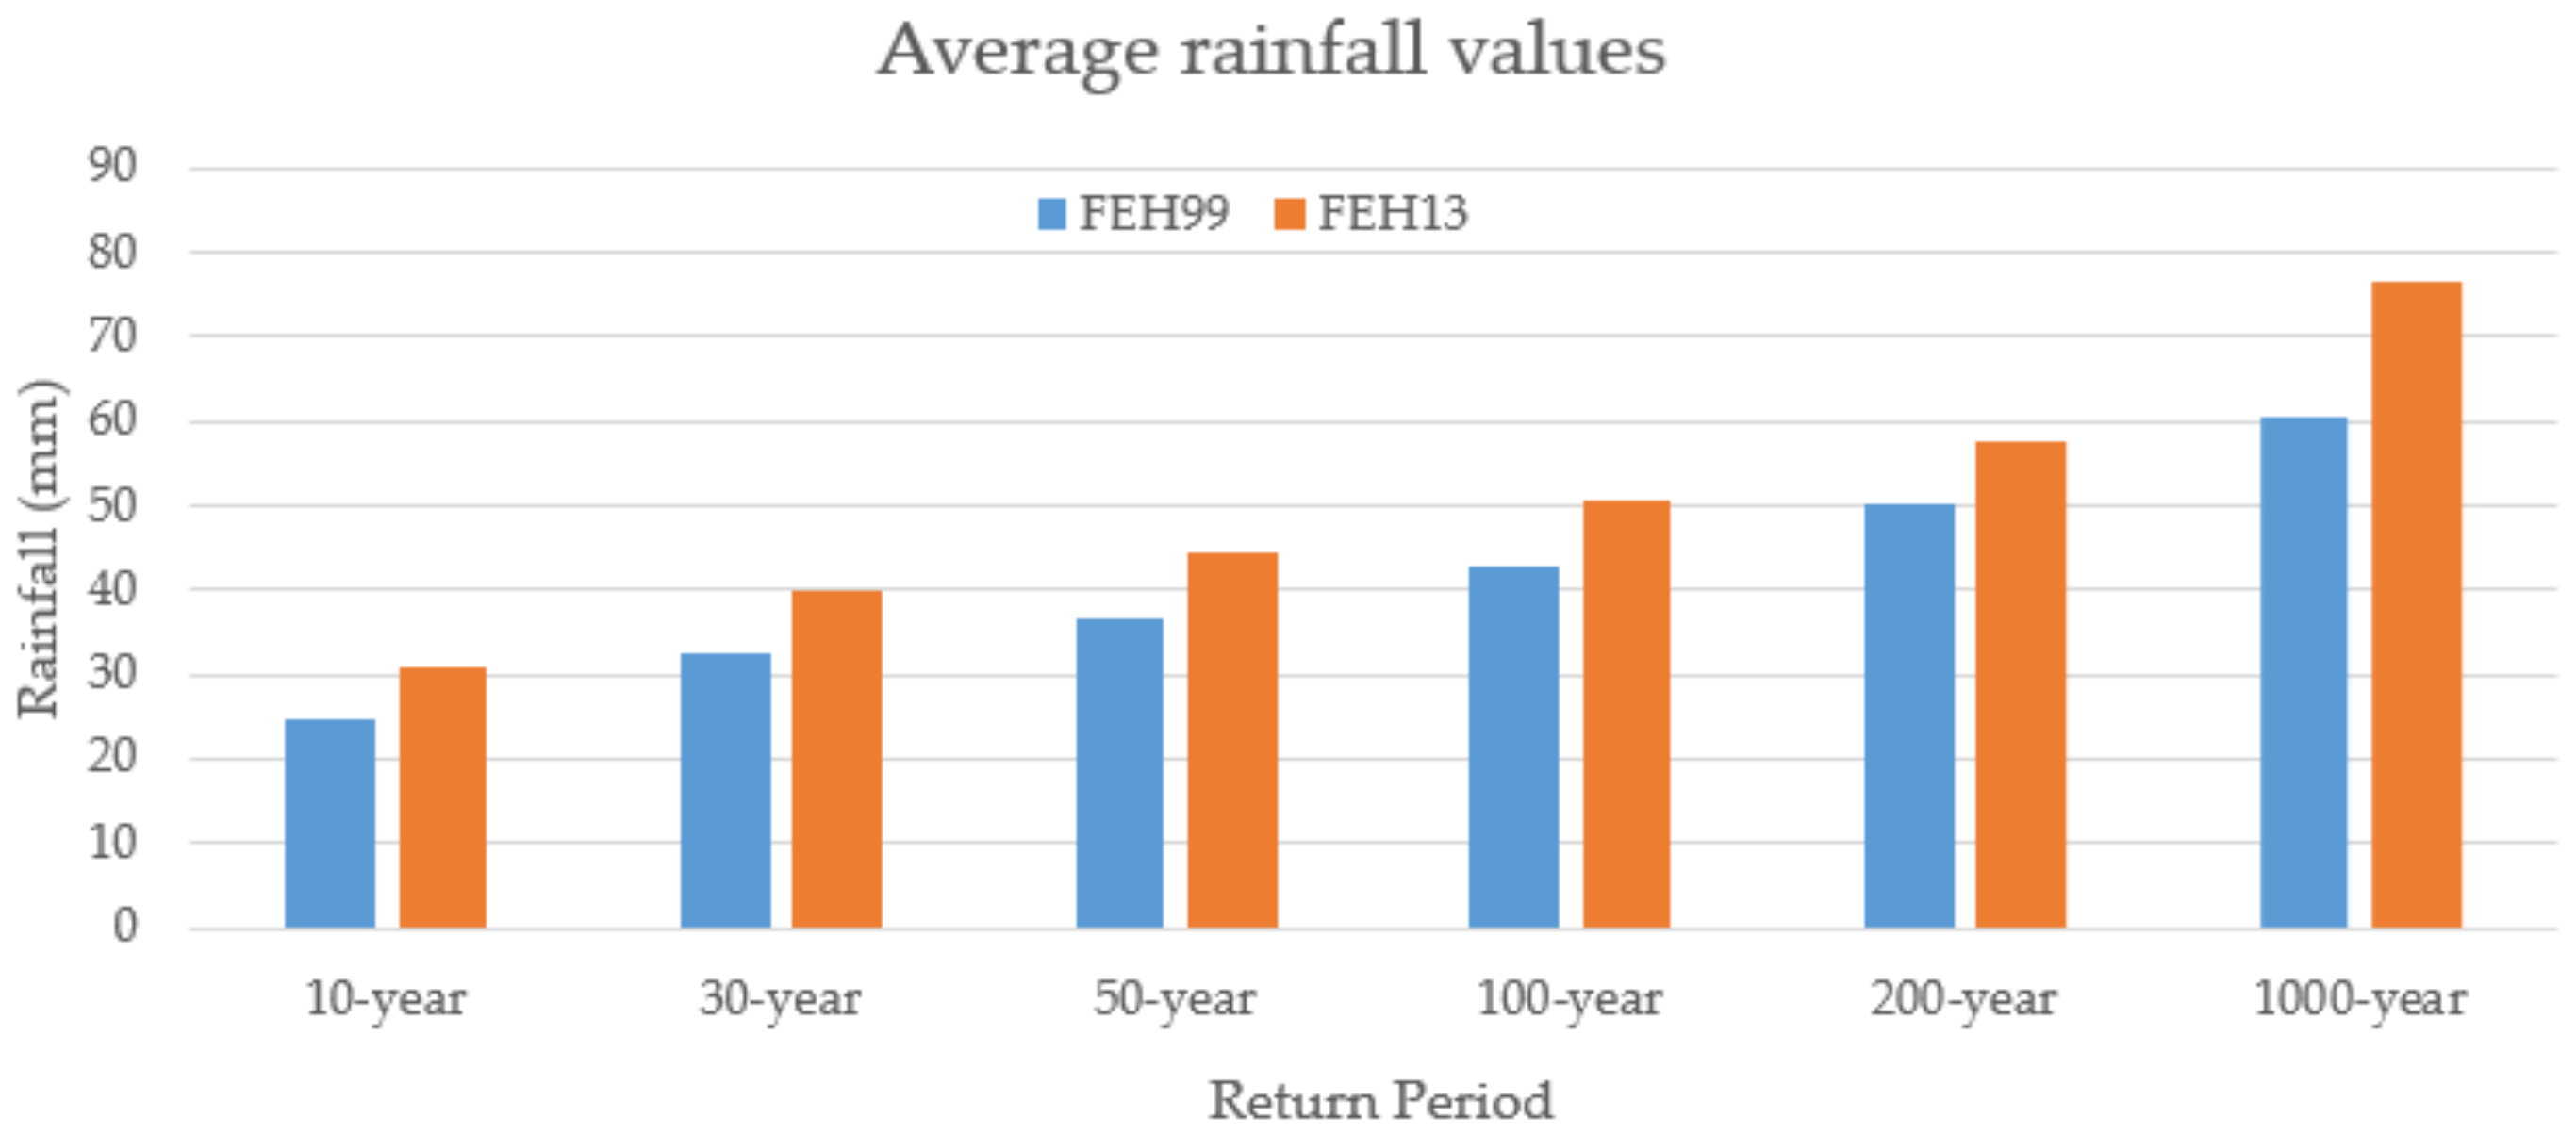
2 (Glasgow East). Modelling results and input rainfall values for the 3 h storm duration were used in the analysis for this paper. The total number of properties identified at risk at the FEH99 10-year return period is 38,425 residential properties and 8371 non-residential properties. The exposure increases to 207,173 and 34,807, respectively, at the FEH99 1000-year return period. The FEH13 dataset indicates a 20% average increase in rainfall associated with exposed properties (
Figure 3). Average rainfall values change from 26.1 mm to 31.6 mm for the 10-year return period and from 52.4 mm to 62.5 mm for the 200-year return period; however, these average values mask considerable variability across Scotland between FEH DDF models.
In the Scottish context, six return periods (10-, 30-, 50-, 100-, 200- and 1000-year), plus at least one climate change scenario, are used consistently in national flooding assessments, policy, and decision making. Exposed properties in the FEH99 hazard data contain a series of up to six rainfall-flood depth points, one per return period. The average flood depth in a 3.54 m buffer zone surrounding a property was used in this calculation for consistency with the approach adopted in the NFRA 2018 methodology for the assessment of pluvial flood risk to properties and derivation of EAD [
6].
Table 1 shows the distribution of FEH99-derived flood depths for residential properties within Regional Pluvial catchments. Surface water flooding exposes properties to shallow depths of water typically less than 0.5 m. It can also be seen that, overall, the percentage of flooded properties only tends to slightly increase to a higher flood depth band with lower frequency return period rainfall events; therefore, it can be assumed that any change in rainfall has minor effects on the flood depth. A similar distribution was observed for non-residential properties.
In Scotland, Capped Average Annual Damages (CAAD) are equivalent to EAD capped by the property values. We will refer to CAAD in this section rather than EAD. Damages are derived from the new set of flood depths using the Multi-Coloured Manual depth–damages curves, which is an appraisal methodology for estimating economic damages to UK properties [
21]. These curves include a range of tangible direct and indirect damages, i.e., properties, vehicles, evacuation as well as intangible damages. A Synthetic Pluvial Annual Average Damage Estimate (SPAADE,
Table 2), which is equivalent to a WAAD, is used to estimate the annual average damage of the ‘newly flooded’ properties. These values have been developed by SEPA as part of the NFRA from detailed pluvial hydraulic modelling to apply in locations where there is insufficient information available on the depth of pluvial flooding from broadscale national modelling [
6].
The interpolation and extrapolation calculations were performed separately using scripts developed in the R language, with separate scripts for residential and non-residential properties. The input files to the scripts provide FEH99 and FEH13 total rainfall depths [
9,
10], property type [
6] and FEH99 flood depth information for each property [
14]. The input files were generated using a GIS to spatially join FEH99 exposed properties, FEH99 rainfall data and the FEH13 rainfall data. Residential and non-residential depth–damage curves [
21] are also used as input files for the interpolation tool, which provides new estimated depth, damages, and CAAD per property. The extrapolation tool applied the SPAADE values to estimate CAAD. The extrapolation outputs are the number of newly flooded properties and CAAD values per grid cell.
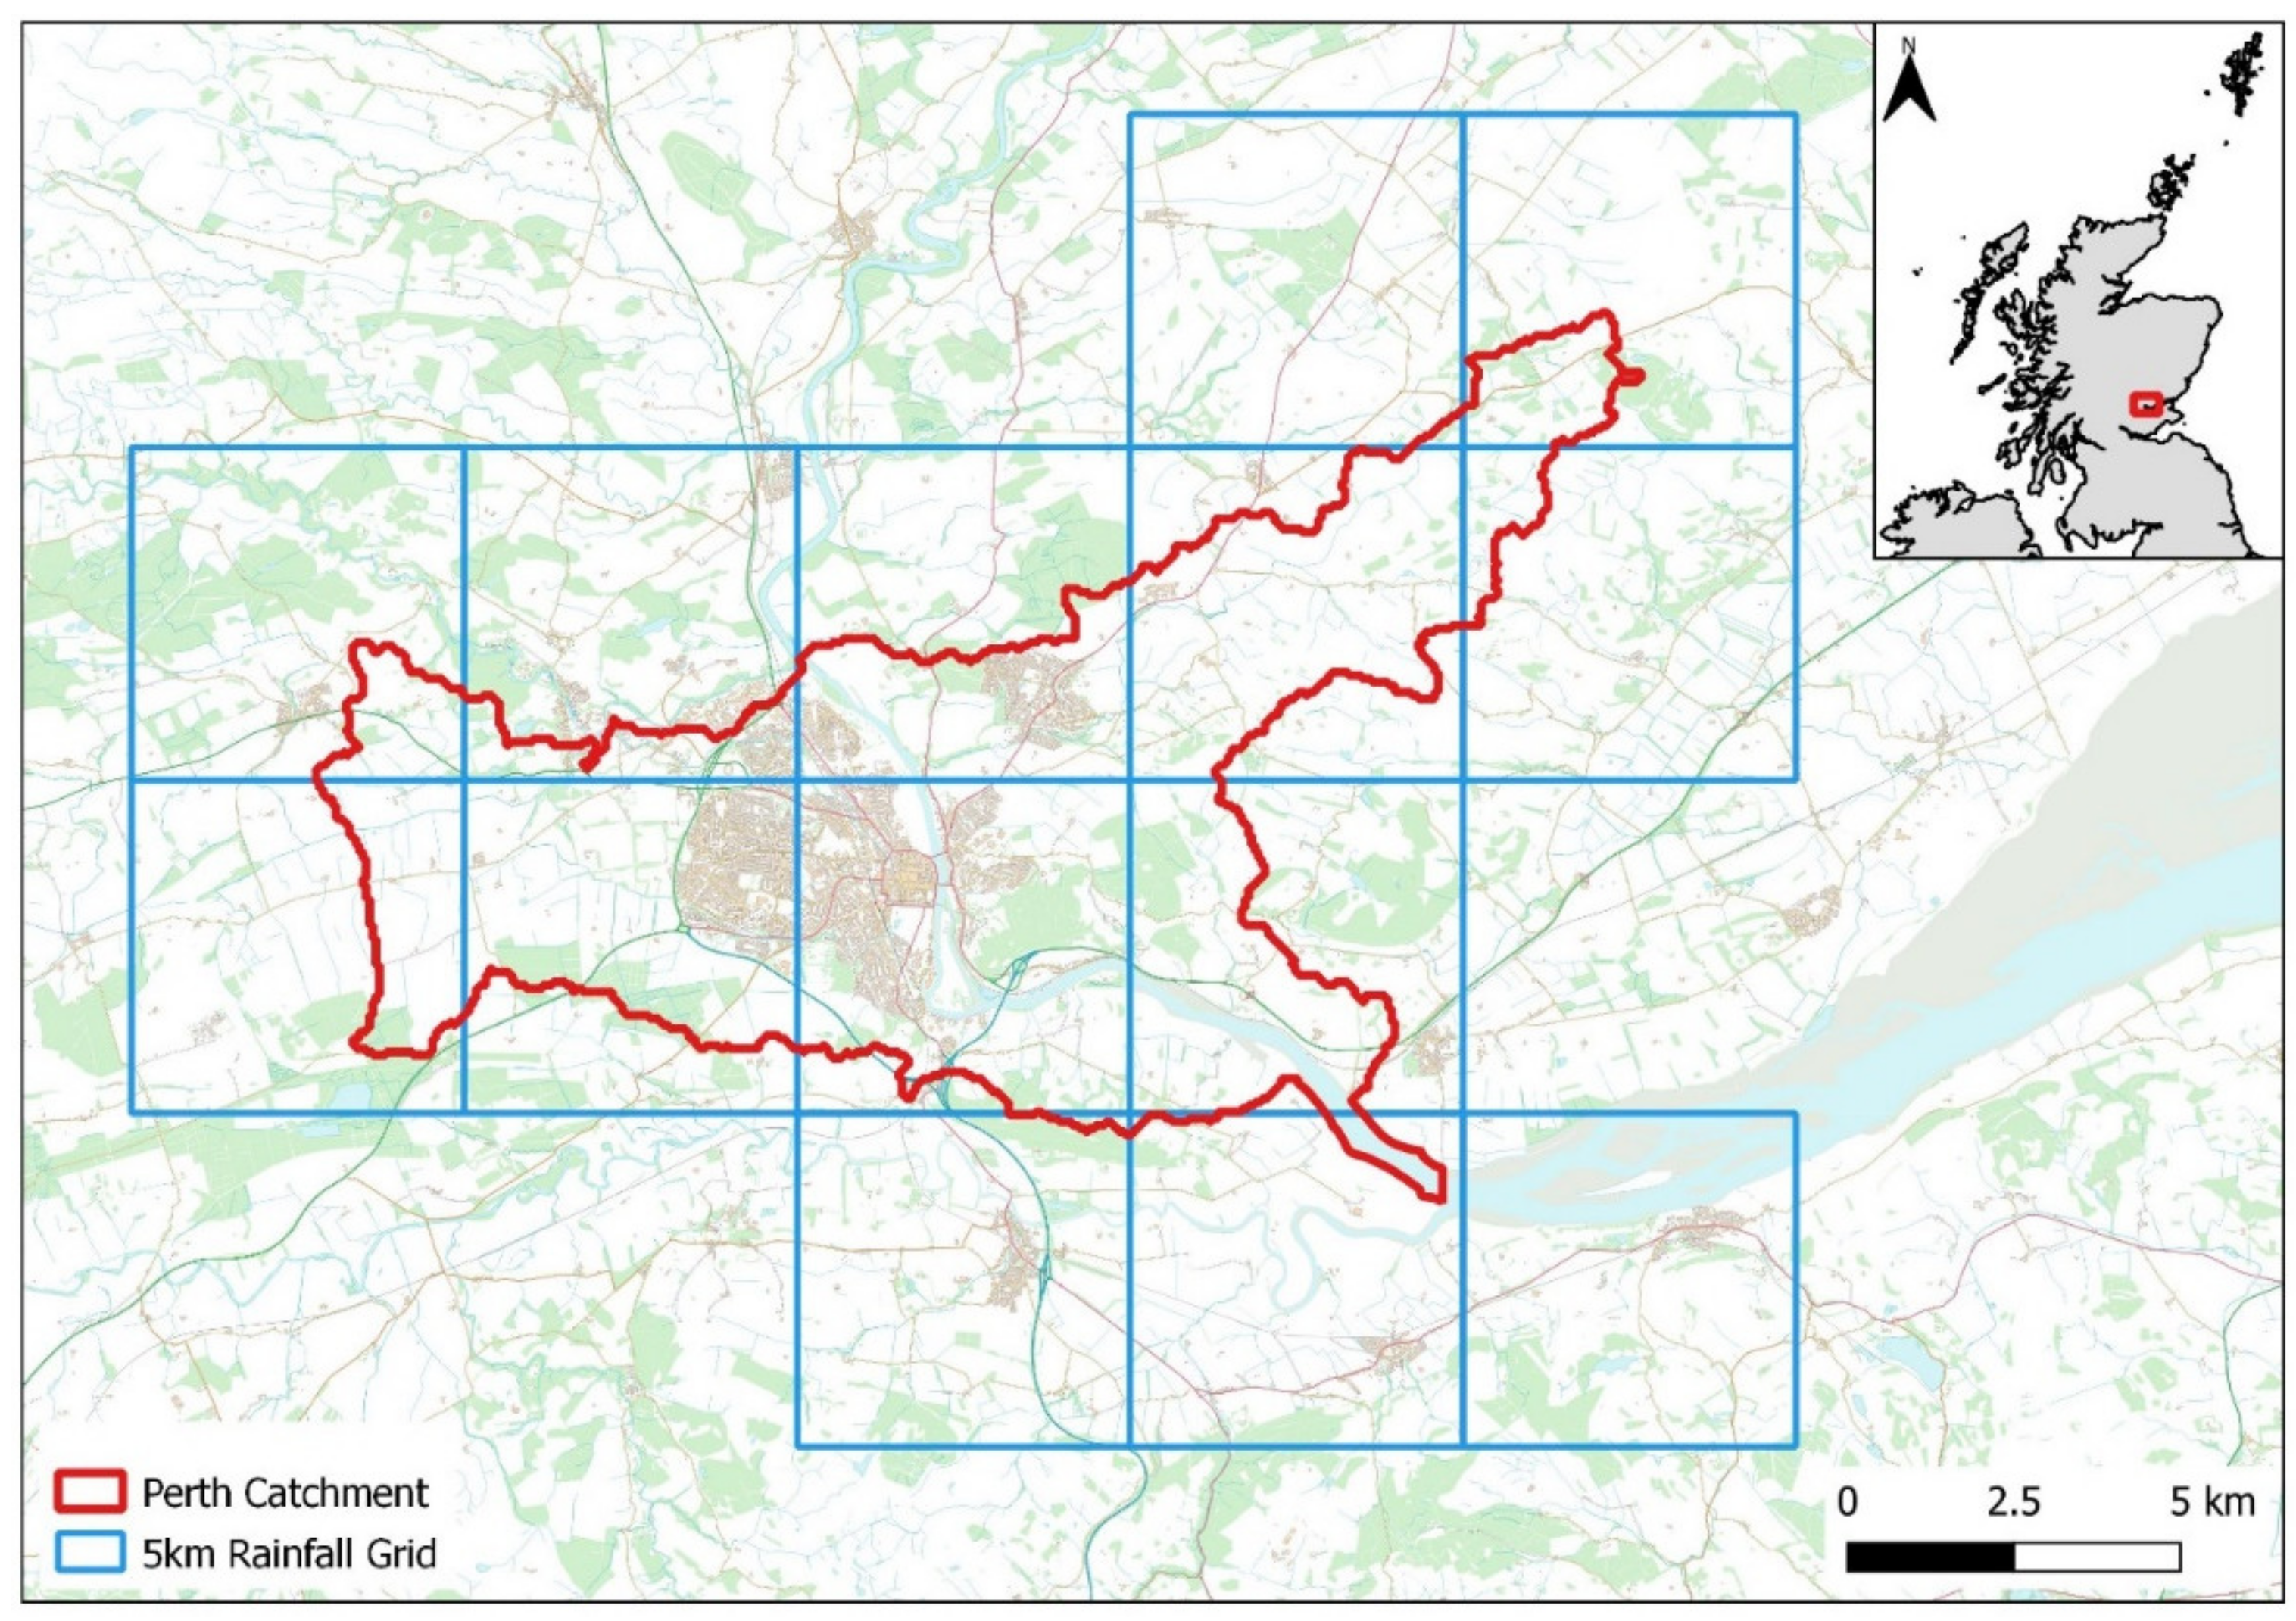
3.1. Perth Catchment
We apply the method to the Perth catchment in Scotland (
Figure 4). This catchment is chosen as detailed 2D hydraulic modelling using the FEH13 rainfall estimates has already been undertaken [
15]; therefore, we can validate our interpolation method. The validation is constrained by the availability of new modelling data.
In the FEH99 hazard data, up to 10% of the residential properties and 7% of the non-residential properties within the catchment are directly exposed to pluvial flooding, with the majority of flooded properties located in the urban centre. The catchment was divided into 14 rainfall grid cells of 5 km by 5 km, which average the underlying 1 km resolution FEH 3 h storm duration rainfall datasets, as there is little spatial variability in rainfall over these distances. In Perth, the average increase in total rainfall depths between FEH99 and FEH13 datasets for comparable return periods and storm durations is 21% (
Figure 5), with generally larger rainfall depths occurring more frequently within the revised dataset. The FEH13 rainfall values for a given return period are generally equivalent to the FEH99 rainfall values of a lower frequency return period up to the 200-year return period, as shown in earlier studies [
10]. For example, the 3 h duration rainfall depth for the FEH99 30-year return period is 32.3 mm; in FEH13, a rainfall depth of 31.5 mm occurs at the 10-year return period for the same event duration. The greatest change in frequency is for the FEH99 100-year return period where the rainfall value is now close to the FEH13 50-year return period. Given this, it is expected that an increase in annual average damages will occur due to the change in frequency of larger rainfall events and, accordingly, an increase in exposure, i.e., properties not previously flooded at any return period are now flooded at low-frequency return periods.
Using FEH99 hazard data, 2604 residential properties and 508 non-residential properties were identified at risk from pluvial flooding. The results presented below combine the outcomes of both interpolation and extrapolation methods.
3.1.1. Residential Properties
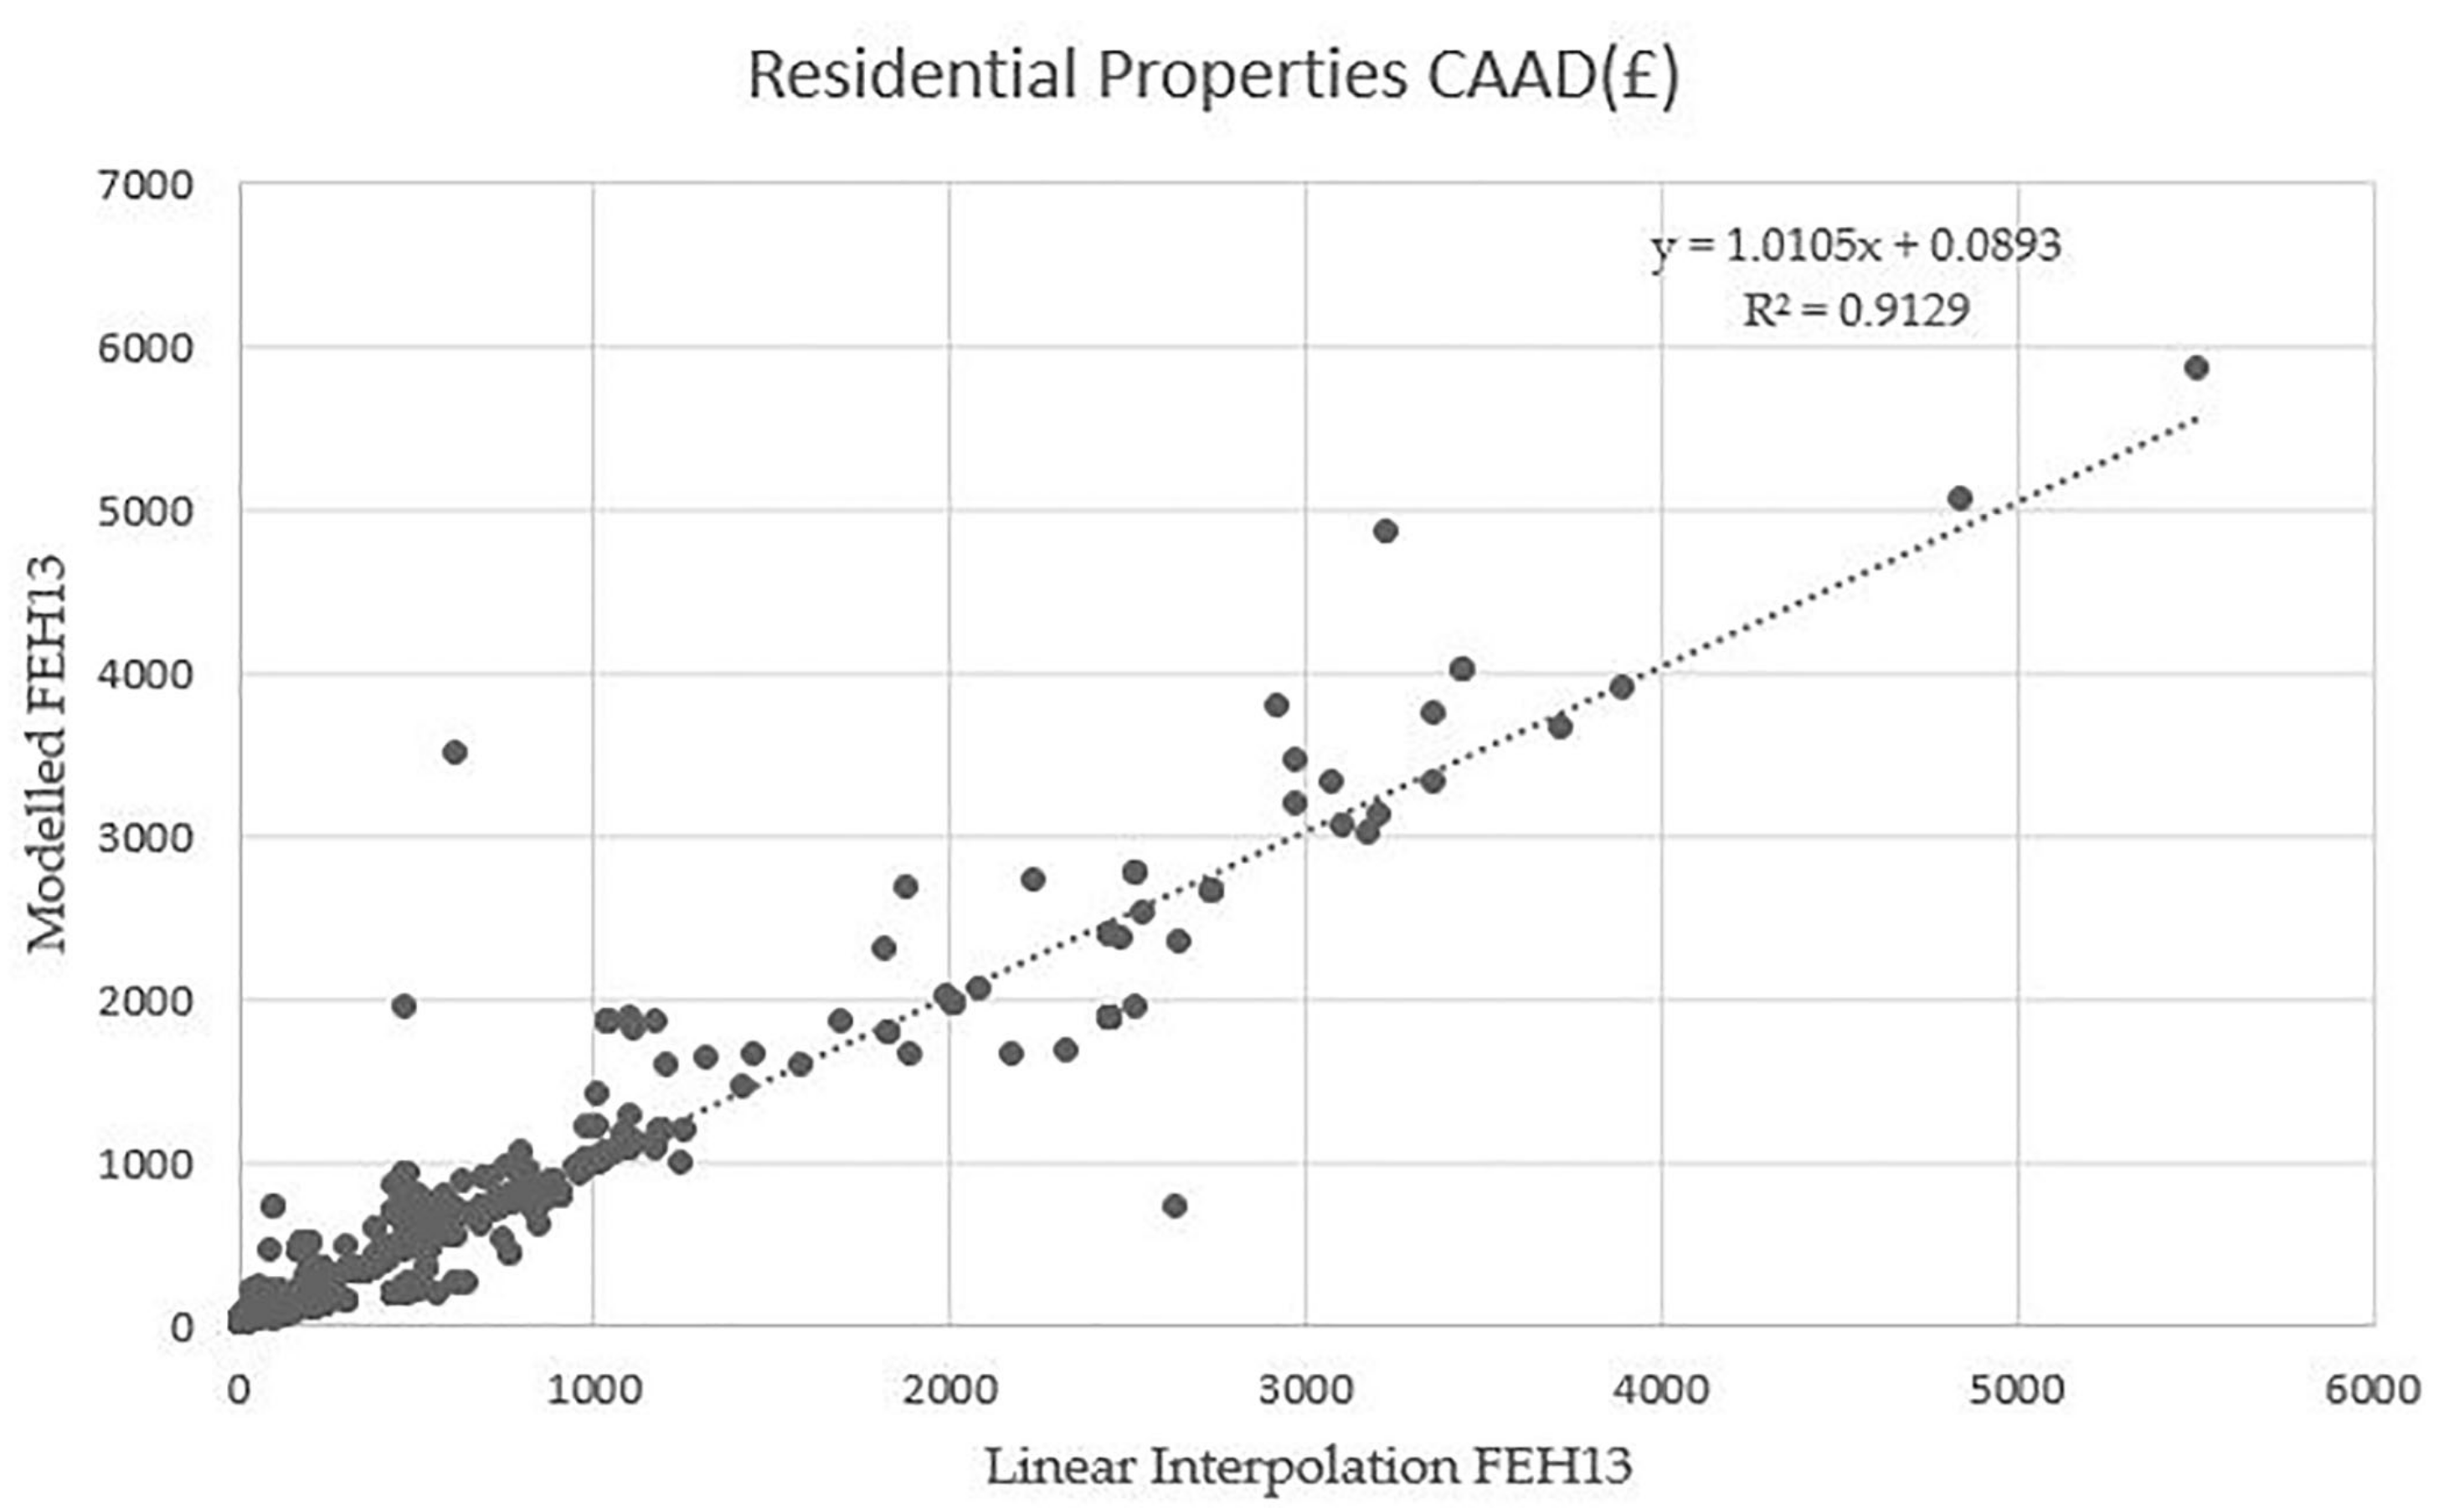
Table 3 shows comparable results for the CAAD calculations between those derived from modelled FEH13 hazard data and those from linear interpolation (combined outcomes) with an increase of 60% and 61%, respectively, compared to FEH99 CAAD values. The linear interpolation method slightly underestimates the CAAD in comparison to those derived from modelled FEH13 data. The linear interpolation underestimates the average CAAD per property by GBP 12. However, a large positive linear association (R
2 = 0.91) with a slope coefficient of 1.01 is obtained between the linear interpolation method and the modelled FEH13 CAAD values, confirming that the linear approach provides a good approximation of the FEH13 residential CAAD (
Figure 6). In the majority of cases, the interpolated CAAD values are expected to be in the range of 0.6–1.2% of the modelled FEH13-derived CAAD values due to the relatively small differences in the depths of water associated with pluvial flooding.
The number of flooded properties is overestimated using the linear interpolation with 223 additional residential properties, identified as flooded compared to modelled FEH13 (
Table 3). If the number of flooded properties per return period is considered (
Table 4), linear interpolation does not correspond as well to those identified from the modelled FEH13 outputs; therefore, we have less confidence in this approach than when using it to calculate CAAD values. It can be seen that the linear interpolation (LI) underestimates the number of flooded properties for the 10-year return period, then overestimates for subsequent return periods.
Comparing the modelled FEH99 and the linear interpolation for different return periods (e.g., 1351 for LI FEH13 30-year return period and modelled FEH99 100-year return period), we see that Equations (2) and (3) cannot precisely capture the rainfall-flood depth at which property level flooding first occurs. FEH99 preceding rainfall value with no property flooding is used as a boundary value in most cases, and this leads to an overestimation of the number of flooded properties. This is particularly the case for the FEH13 100-year return period, as the rainfall depth is only slightly larger than the FEH99 200-year return period (see
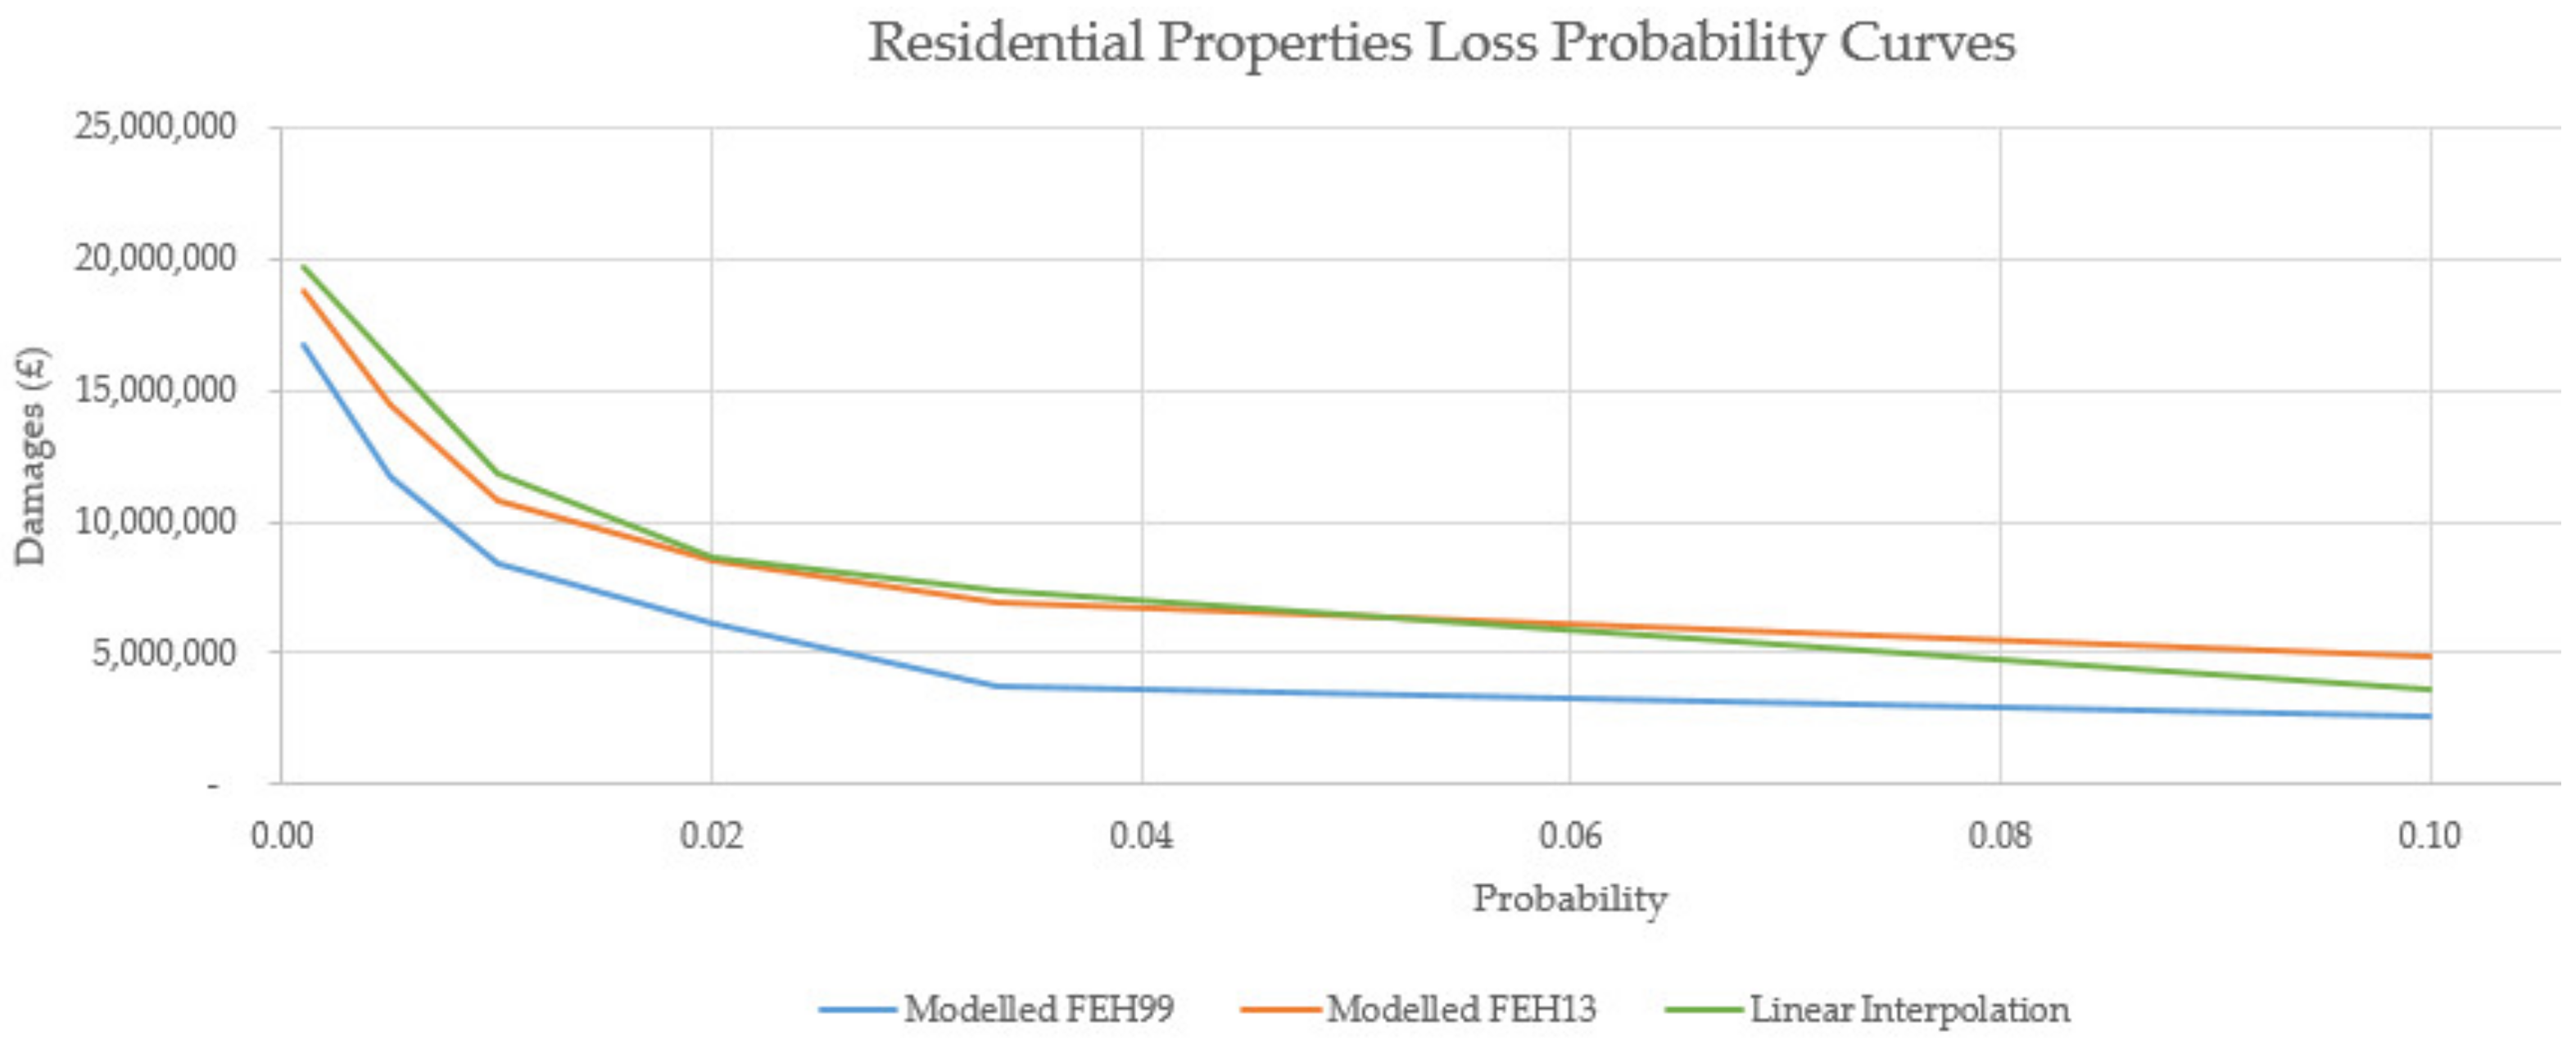
Figure 5). The number of flooded properties at the next return period (i.e., FEH99 1000-year return period) is used as an estimate, whereas the number should be closer to the FEH99 100-year return period count. This means that for an increase of a few millimetres in total rainfall depth, the associated number of flooded properties for this return period may change from 1861 to 2604. From this, it can be considered that the level of uncertainty may vary with the interval between the FEH99 and the FEH13 total rainfall values. This is also the case for the estimation of damages per return period, but the flood depth interpolation refines the assessment when compared to the modelled FEH13 results (
Figure 7). At the 100-year return period, the linear interpolation method reaches the total number of FEH99 flooded residential properties (2604). No additional properties are flooded at the 200-year return period as the FEH13 rainfall value is lower than the largest available modelled FEH99 rainfall value (e.g., 1000-year return period). At the FEH13 1000-year return period, the rainfall depth is greater than the largest available modelled FEH99 rainfall depth; therefore, the extrapolation method was to estimate the additional number of flooded properties.
3.1.2. Non-Residential Properties
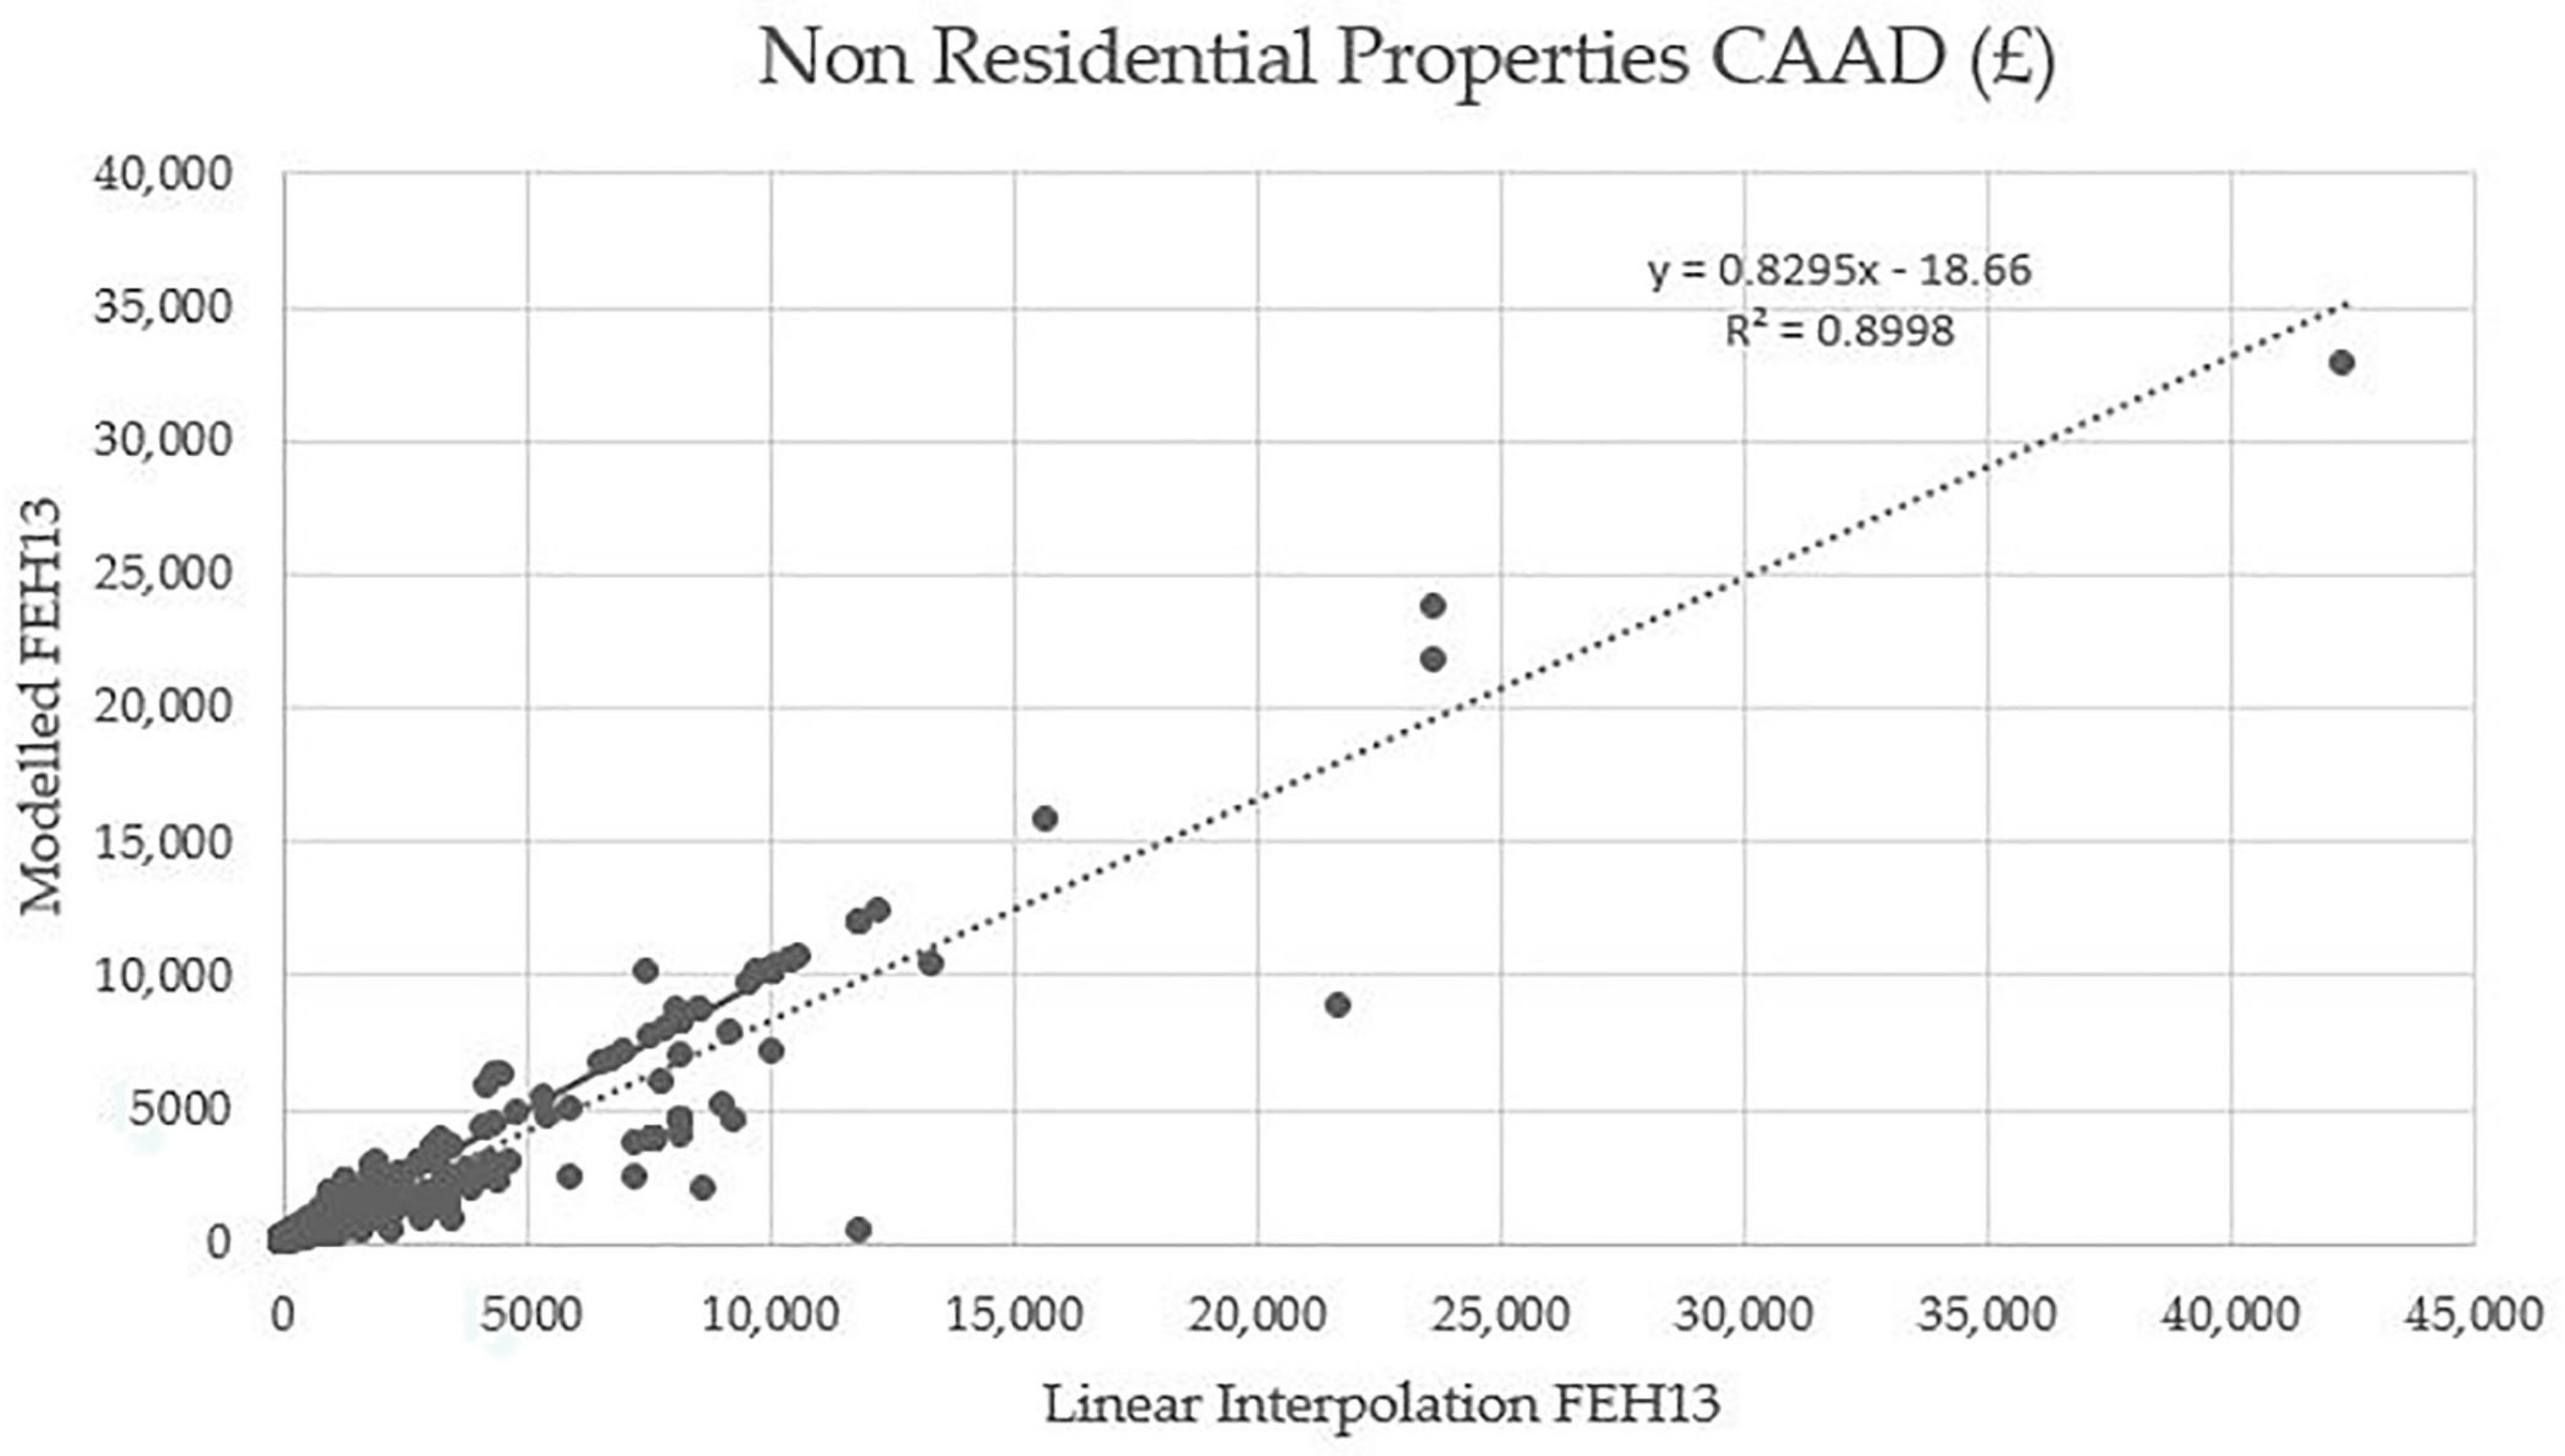
Table 5 shows less comparable results for the non-residential property CAAD calculations between those derived from modelled FEH13 hazard data and those from linear interpolation (combined outcomes) with, respectively, an increase of 43% and of 77% compared to FEH99 CAAD values. The linear interpolation method overestimates CAAD values in comparison to those derived from modelled FEH13 data; the overestimation in CAAD is larger for non-residential properties than those observed for residential properties. An overestimation is also seen for the average CAAD value. Overall, a large positive linear association (R
2 = 0.89) with a slope coefficient of 0.83 is obtained between the linear interpolation method and the modelled FEH13 CAAD values for non-residential properties (
Figure 8). This confirms that the linear approach provides a good approximation of the FEH13 non-residential CAAD. The greater differences in the estimates for non-residential properties compared to residential properties are mainly due to larger CAAD values and losses associated with certain non-residential property types. This is inherent to the non-residential property type, as potential losses vary significantly by flood depth band due to highly variable building footprints and as damages curves are calculated per square metre. For example, one of the outliers which overestimates the modelled FEH13 CAAD by GBP 13,000 is a public building with a large footprint (6271 m
2). This single building contributes 5% of the overall difference. The property, with an associated flood loss of approximately GBP 320,000, is initially flooded at 100- (FEH99), 50- (FEH13) and at 30-year (linear interpolation) return periods, respectively.
Figure 9 shows the differences between CAAD values calculated using the linear interpolation method and the modelled FEH13 hazard data for the 500 m by 500 m grid. In the majority of cases, the interpolated CAAD is expected to be in a range of 0.8–1.2% of the modelled FEH13-derived CAAD value. As with residential properties, some cells have a null ratio, and they cannot be captured by the linear interpolation approach. In comparison to the residential CAAD values, a greater number of cells have high ratio values (>1.6); this is related to the high variability in the type and footprint of non-residential properties. Consequently, there is lower confidence in the use of the interpolation method for non-residential properties compared to residential properties. It is difficult to determine the level of overestimation that may occur when the method is applied to other flood prone areas with different geographic settings during national-scale application.
If the number of flooded properties per return period is considered (
Table 6), the linear interpolation overestimates the number of flooded non-residential properties and a similar pattern to residential properties is observed. As with residential properties, the trend for an initial underestimation of the number of flooded properties at the 10-year return period is followed by an overestimation for subsequent return periods. The comparable numbers between modelled FEH99 and the linear interpolation for different return periods (e.g., 291 for 30-year and 100-year return periods) indicates that Equations (2) and (3) cannot precisely capture the rainfall depth at which flooding first occurs. This leads to higher estimates of loss per return period (
Figure 9).
3.2. National Application
Whilst the application of interpolation and extrapolation methods for the Perth catchment established the feasibility of determining EAD values via these approaches, to support wider decision making or understanding variations due to changing climate scenarios they must be capable of application at the regional and national scale. Flood risk management investment in Scotland is driven centrally with local government provided GBP 42 million per annum by the Scottish Government to implement the Local Flood Risk Management Plans [
27] and intervention measures required by the Directive on the basis of national risk assessments and planning undertaken by SEPA. It is essential that the priorities for each 6-yearly cycle are set on the basis of robust estimates of risk.
When the interpolation and extrapolation methods are applied nationally to all properties within Regional Pluvial catchments, there is an increase of 44% compared to FEH99-derived property CAAD values from GBP 107 to GBP 155 million. Similar increases are observed for residential and non-residential properties with total CAAD values of GBP 72.5 and GBP 82.7 million, respectively (
Table 7). Similar increase ratios for the number of flooded properties are also seen with the largest increase ratios for the 30-year return period. For the 1000-year return period, the number of flooded residential properties increases by 26% and the number of flooded non-residential properties by 23%.
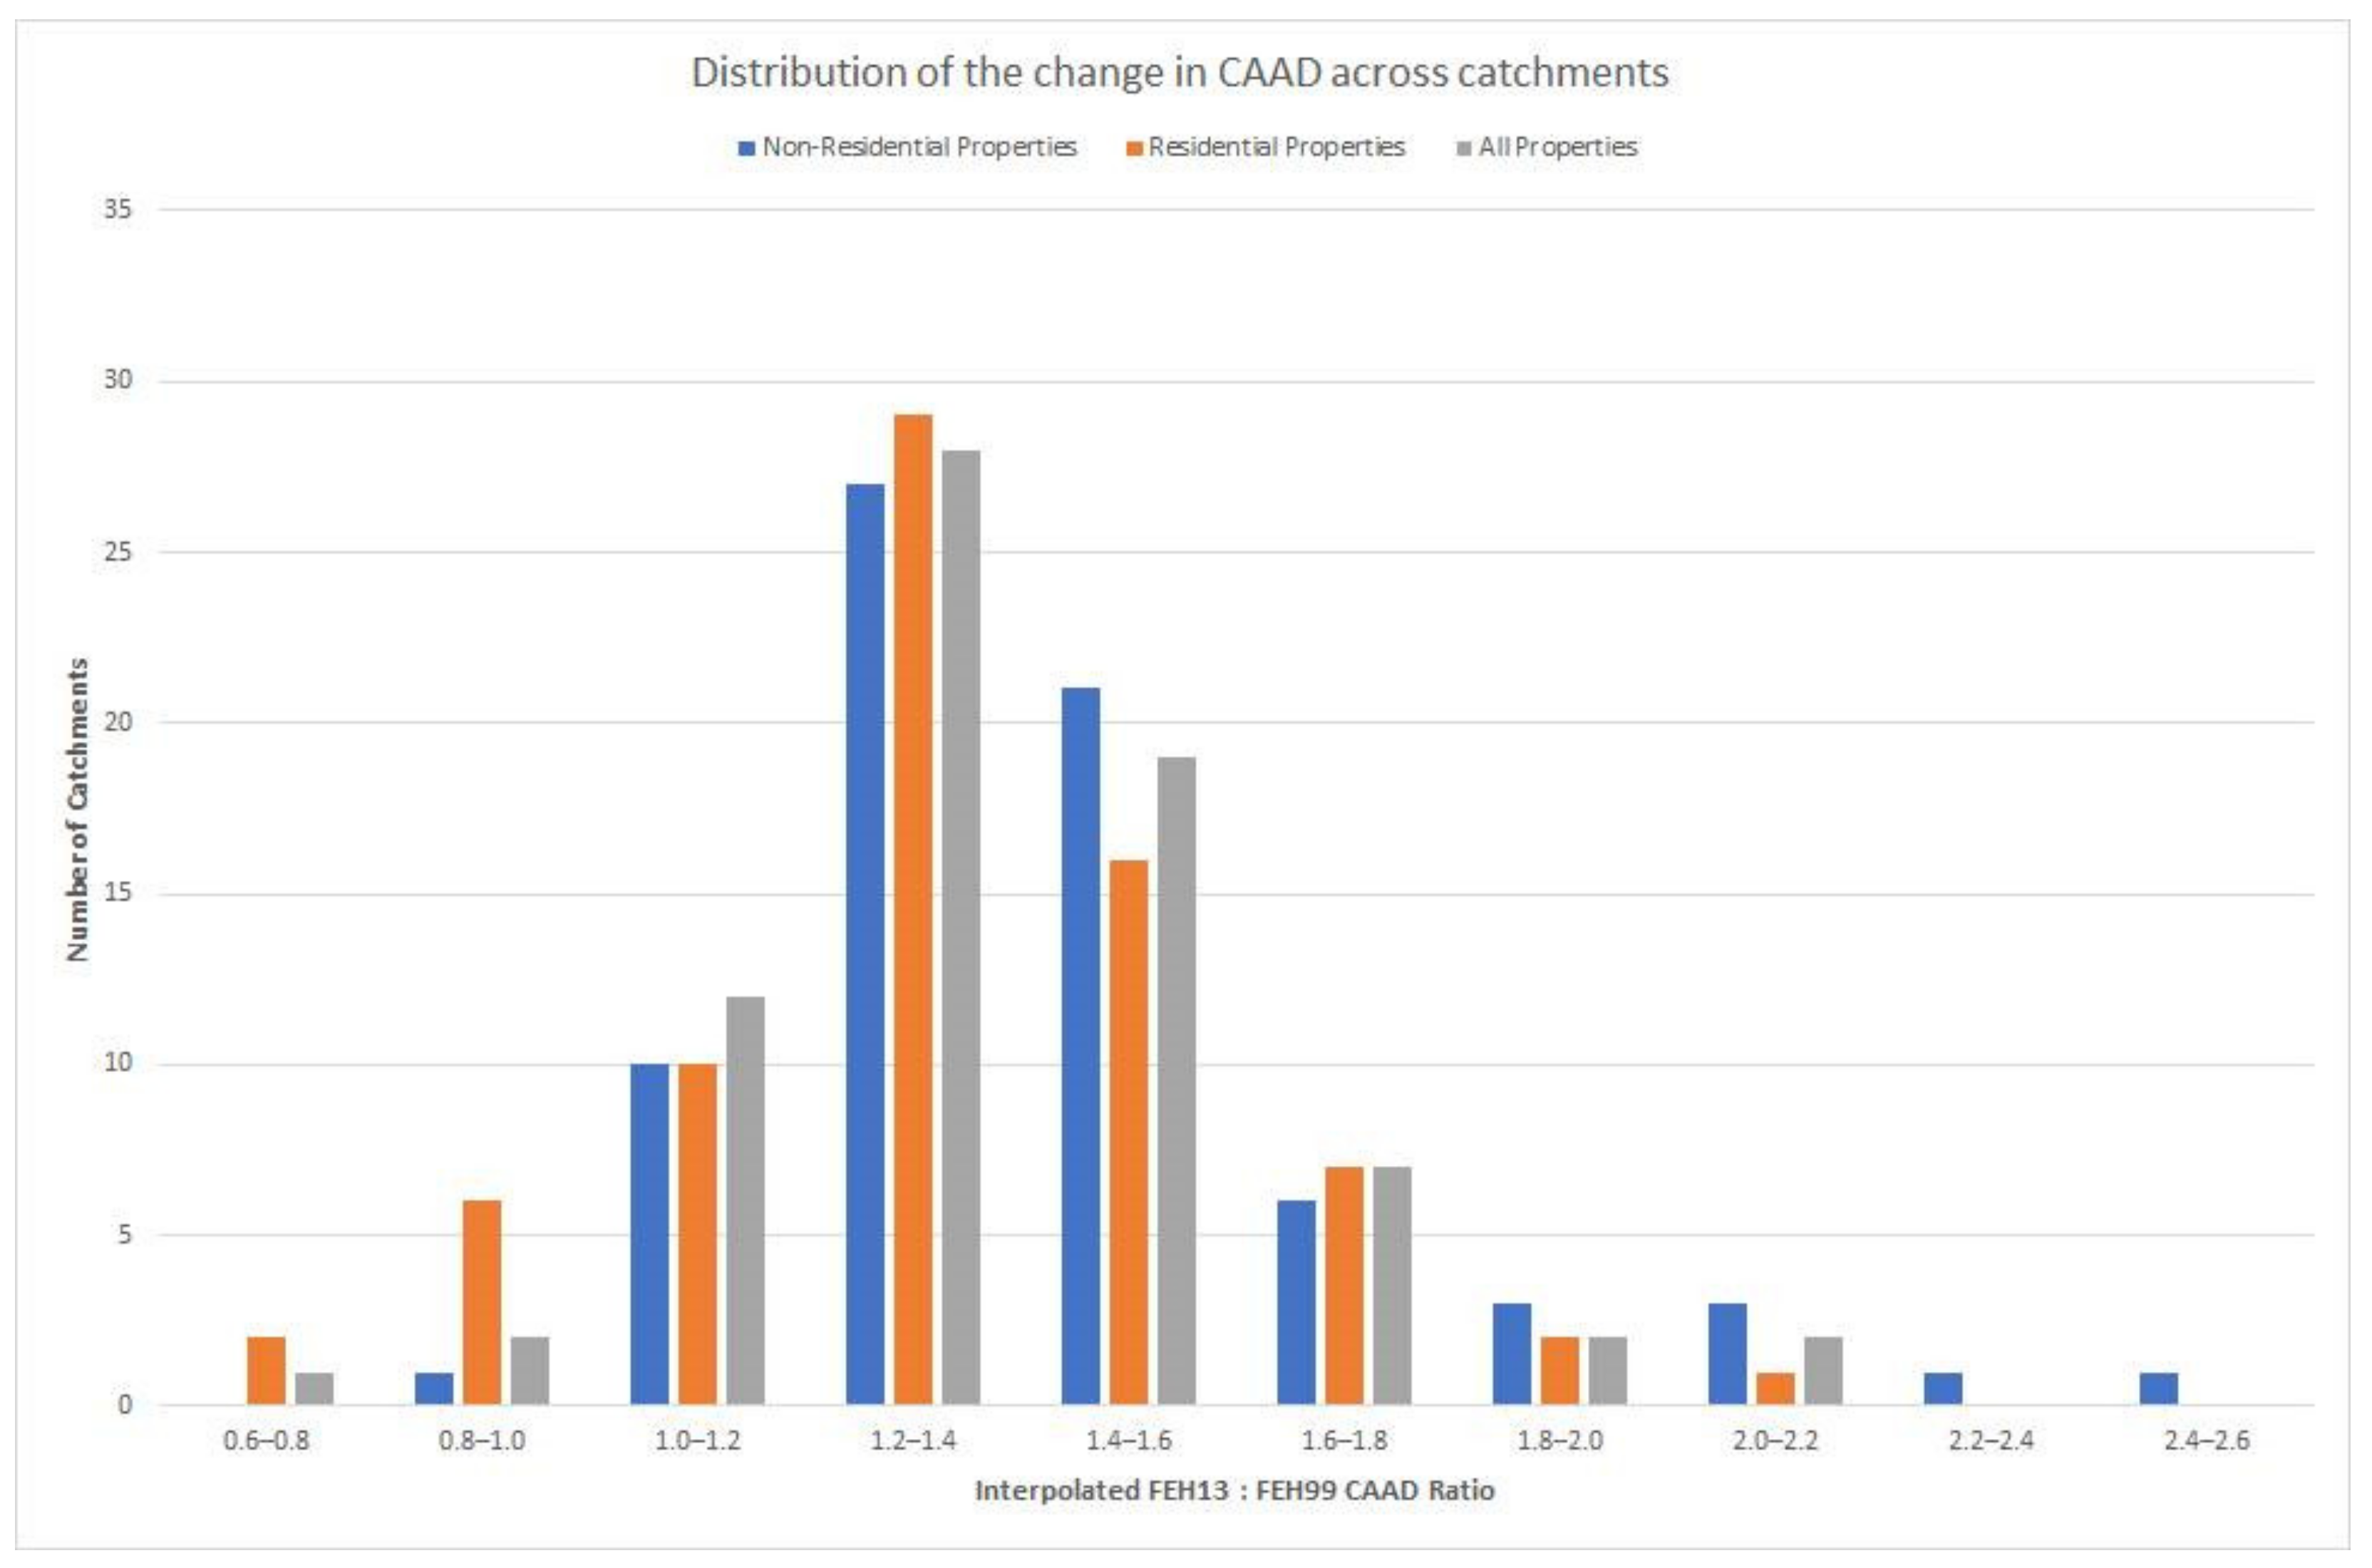
The ratio of change varies by catchment (
Figure 10) with an average value of 1.37 and a standard deviation of 0.23. Some catchments on the west coast (Ballachulish, Taynuilt, and Lochgilphead) show a decrease in their total CAAD values, which can be related to a reduction in FEH13 rainfall estimates compared to FEH99 (
Figure 11). Above average increases in total CAAD values are seen for some North East catchments such as Dornoch and Nairn, particularly for non-residential properties. Both sets of observations for significantly below and above average changes in CAAD values are consistent with expected changes in rainfall estimates between FEH99 and FEH13 DDF models for these locations [
10].
Whilst changes in CAAD are largely related to changes in rainfall estimates, for certain predominately rural catchments, only a decrease in residential property CAAD is observed. This is due to changes in the exposure methodology; whereas all properties are considered to be ‘urban’ in the current approach, in the FEH99-derived risk data, certain properties are considered ‘rural’ and associated with larger damages for vehicles.


