Article

Temp-Spatial Heterogeneity of Water Recharge and Its Stable Mechanisms of the Mountainous Rice Terraces in East Asia Monsoon Region

Faculty of Geography, Yunnan Normal University, Kunming 650500, China
*
Author to whom correspondence should be addressed.
Water 2022, 14(24), 4110; https://doi.org/10.3390/w14244110
Submission received: 25 October 2022 / Revised: 4 December 2022 / Accepted: 10 December 2022 / Published: 16 December 2022
(This article belongs to the Special Issue Isotope Tracers in Watershed Hydrology)

Abstract

:
The paddy field water recharge system and the mechanism of its stability are key scientific issues related to reducing the threat to global food security and enhancing the well-being of humans. In this study, we sampled the field water, precipitation, and groundwater in the Hani terrace areas and measured the values of hydrogen and oxygen stable isotopes. The results indicated that precipitation and groundwater were the main sources of terrace water recharge in the Hani terrace area. Spatially, the terrace areas were divided into rain-fed terraces, which were mainly recharged by precipitation, and spring-fed terraces, where groundwater was the primary source of recharge. Temporally, there were two different recharge periods: the rain-fed season (>70% recharge from precipitation) and the spring-fed season (>30% recharge from groundwater). The temporally alternating recharge periods of the spring-fed and rain-fed seasons and the interconnected spatial distribution of rain-fed and spring-fed types were essential to maintain stable water sources in the Hani terraces. Meanwhile, the spatial heterogeneity of groundwater recharge and the timing of agricultural cultivation adjusted the system to some extent. Rice cultivation will be sustainable if the changes in monsoonal precipitation due to global climate change align with the anthropogenic agricultural cultivation cycle, including land preparation, planting, growing, and harvesting. This is the key reason that the mountainous rice cultivation systems of the Hani terraces have lasted for thousands of years under the influence of the East Asian monsoon.

1. Introduction

Amidst the background of increased precipitation uncertainty caused by global climate change, as well as the ever-increasing anthropogenic socio-economic activities, the availability of freshwater resources for agricultural irrigation, industrial production, and drinking water has become a critical constraint, which greatly affects the stability of the ecosystem, and hence, global food security [1,2]. As a result, the assessment, management, and sustainable use of freshwater resources have received widespread attention from international/regional governments and NGOs [3,4,5,6,7]. Monsoon is an important component of the Earth’s climate system and a major factor in influencing regional environmental conditions. The extreme wet and dry conditions caused by abrupt fluctuations between dry and wet seasons (low vs. heavy rainfall) can adversely affect agricultural productivity, water resources, infrastructure, and human societies [8,9,10]. Rice is the staple food of approximately 3 billion people worldwide, and rice cultivation is predominantly located in the Asian monsoon region. Thus, rice cultivation in the Asian monsoon region affects the livelihood of more than half of the world’s population [11,12,13]. Rice is extremely sensitive to water scarcity, and its cultivation relies heavily on water supply, requiring a seasonal water input (precipitation, irrigation, and groundwater) that is two to three times greater than that for other crops [14,15]. Globally, approximately 27 million hectares of paddy fields are regularly affected by drought-induced water deficits in areas of eastern India, north-eastern Thailand, and Laos [15,16]. A stable supply of water to the paddy fields is an important prerequisite for ensuring regional food security and achieving sustainable development. Therefore, it is critical to obtain complete and accurate hydrological monitoring data regarding the source, quantity, and stability of water supply to paddy fields.
Several hydrological monitoring studies have shown that climate change and human activities have caused rapid changes in hydrological conditions worldwide, leading to shifts in dominant hydrological processes, confounding predictions, and complications in effective management and planning [17,18]. This has caused water resource problems at the basin level that exceed the scope of traditional water management and assessment programmes [19,20]. Surface observations, elemental tracing, and model simulations have been used to understand and analyse the recharge and conversion mechanisms between various water bodies, such as surface water, precipitation, and groundwater in a region/basin. This information has served as a foundation and prerequisite for elucidating the source and proportions of recharge to the irrigation water supply [21,22]. Since the emergence of isotope hydrology, the use of isotope tracing in water environments has provided detailed information for the study of hydrological patterns in watersheds and the identification of hydrological model structures and parameters. It has effectively prevented distortions in the simulation of natural conditions [23,24,25,26], thereby solving many challenges that could not be solved by traditional hydrological observations, experiments, and analyses [27]. Some examples include studies on the interaction between surface water and groundwater within a basin [28], and research on the spatial and temporal variations in groundwater recharge in areas of intense agricultural cultivation [29]. Currently, most research in this area focuses on the use of limited fixed-point observation data in combination with hydrogen and oxygen stable isotope tracing to (1) accurately determine the variations in spatial and temporal patterns [30,31]; (2) determine the recharge relationship and ratios of surface water [32], groundwater, and precipitation at a basin level on various spatial–temporal scales; (3) establish mechanisms of water cycling in a basin based on the corresponding models; (4) identify the water source by mixing analysis [33,34]; and (5) achieve adequate utilisation and management of the water resources in a basin [35].
In the rice terraces of East Asia, irrigation systems with water management functions play an important role in the proper exploitation and utilisation of water resources in the basin and the sustainable development of local agriculture. The Honghe Hani Rice Terraces World Cultural Heritage Site in Yunnan, China, is a typical example of such a system. However, owing to topographic restrictions, these rice fields are generally located on the slopes of a mountain, a highly heterogeneous area. This renders the recharge sources of the rice fields susceptible to the effects of a complex natural environment and intense human activities [29,36,37]. Surprisingly, despite all these adversities, the mountain terraces in East Asia have sustained for more than a thousand years through stable water recharge and sound water management. However, how to accurately estimate the source, quantity, and stability of the water source in mountain terraces under the influence of high-intensity human activities is still a difficult problem to solve, especially for poor mountainous areas where there is a severe lack of field hydrological monitoring data. It is obviously a very effective method to integrate the groundwater, precipitation, and surface water in different mountain farming zones into a hydrological circulatory system, as well as examining the water sources and identifying the hydrological processes by stable hydrogen and oxygen isotope technology. Although it has become increasingly popular to use long-term and high-resolution experimental observations to study the water cycle over time series in medium- and large-scale agricultural river basins [38], studies based on coupled long-term and high-resolution data in areas of high heterogeneity are rare. The results of these studies have been limited by sample quantities, cost considerations, and difficulties in sample site selection on temporal and spatial scales.
In this study, we selected a typical small river basin located in the Honghe Hani Rice Terraces World Cultural Heritage Site in Yunnan, China, as the research site; analysed the hydrogen and oxygen isotope compositions and characteristics of precipitation, terrace water, and groundwater in the terrace area; and further applied isotope mixing models and other analytical methods to (1) determine the main types of water sources for the recharge of terrace water and their relationship with monsoon and human activities; (2) explain the recharge cycle and recharge ratio of terrace water to further determine the stability of terrace water sources; and (3) examine the mechanism of the spatial and temporal stability of terrace water recharge under the influence of monsoon and human activities.

2. Study Area

The study area was located in the Bada area, the core area of the Hani Terraces Cultural Landscape Heritage in Yuanyang County, Yunnan Province (Figure 1). It belongs to the Quanfuzhuang catchment of the upstream tributary of the Malizhai River basin, with the longitude ranging from 102°43′16″ to 102°50′39″ E, and the latitude ranging from 23°5′20″ to 23°13′18″ N. The terrain of the whole catchment is high in the north and low in the south. The catchment is fan-shaped from north to south, covering an area of 13.92 km2. It accounts for 16.73% of the total area of the Malizhai River basin (83.2 km2). The terrace areas of this basin are mainly distributed within an elevation range of 1475–1737 m, covering approximately 40% of the total area of the basin. The terrace fields have been tilled and cultivated for over 1300 years, representing the most significant human activities in the basin. As a result, the hydrological processes within the terrace areas are highly complex.
According to field investigation and the 1:200,000 regional geological report of the Yuanyang area [39], the study area mainly consists of two types: pore aquifer and fissured aquifer. The pore aquifer is the relative aquiclude in the stratum, because of the clay, weak water abundance, and thickness of the stratum between 0.1 m and 10 m. Moreover, the water permeability of the rock with undeveloped joints and cracks is weak, forming a relative aquiclude [29]. In terms of groundwater recharge, precipitation is the most important water recharge source. The runoff discharge and buried depth of groundwater are obviously controlled by the terrain. Generally, groundwater has the characteristics of a short recharge path, on-site recharge, and on-site discharge [40]. As a result, there are many springs outcropping in the study area, and the groundwater samples are also collected in this spring.
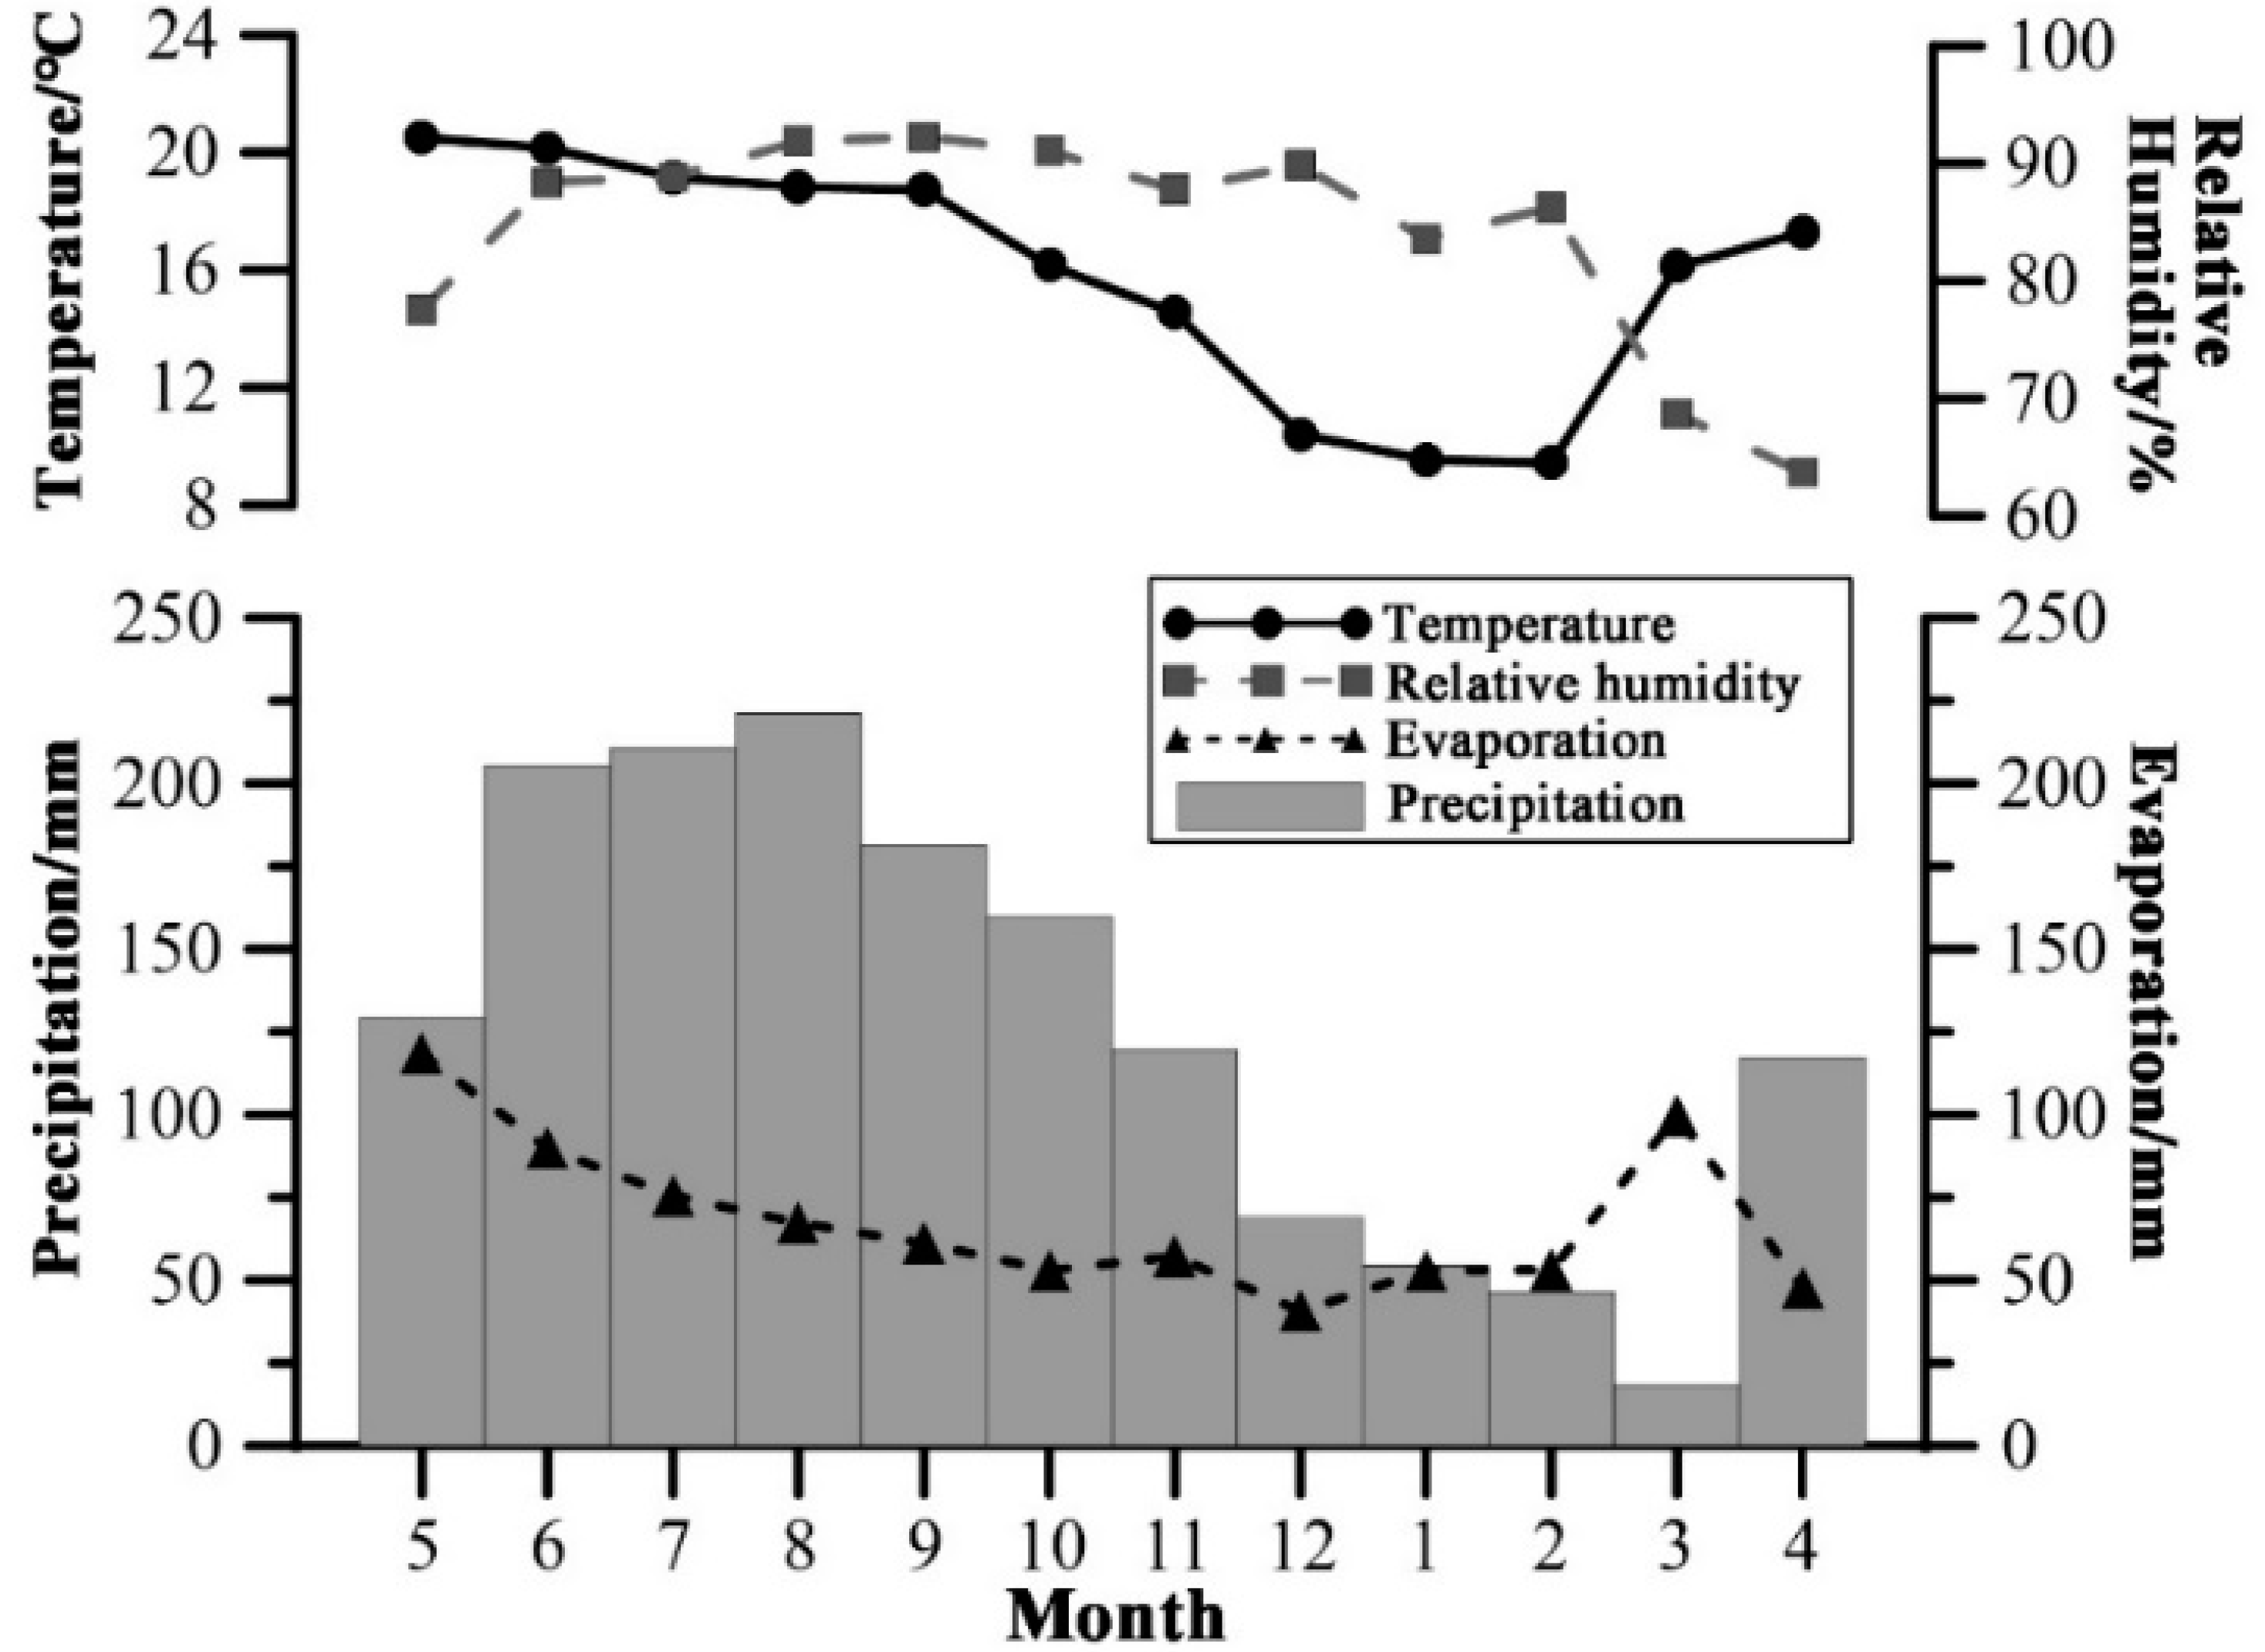
Precipitation in the study area is adequate, with substantial differences in the dry and wet seasons. The meteorological data gathered from the observation stations from May 2015 to April 2016 (Figure 2) showed that the annual precipitation in the study area was 1532.19 mm. Approximately 72% of the total precipitation (1107.26 mm) occurred in the wet season, while the remaining 28% (424.93 mm) occurred during the dry season. The average monthly precipitation was 184.54 mm. The precipitation provided a sufficient and stable supply of water for rice cultivation in the terrace areas. Like precipitation variation, the study area was warmer and wetter in the wet season (temperature of 18.92 °C, relative humidity of 88.32%) than the dry season (temperature of 12.89 °C, relative humidity of 79.96%).

3. Data Sources and Research Methods

3.1. Sample Collection and Testing

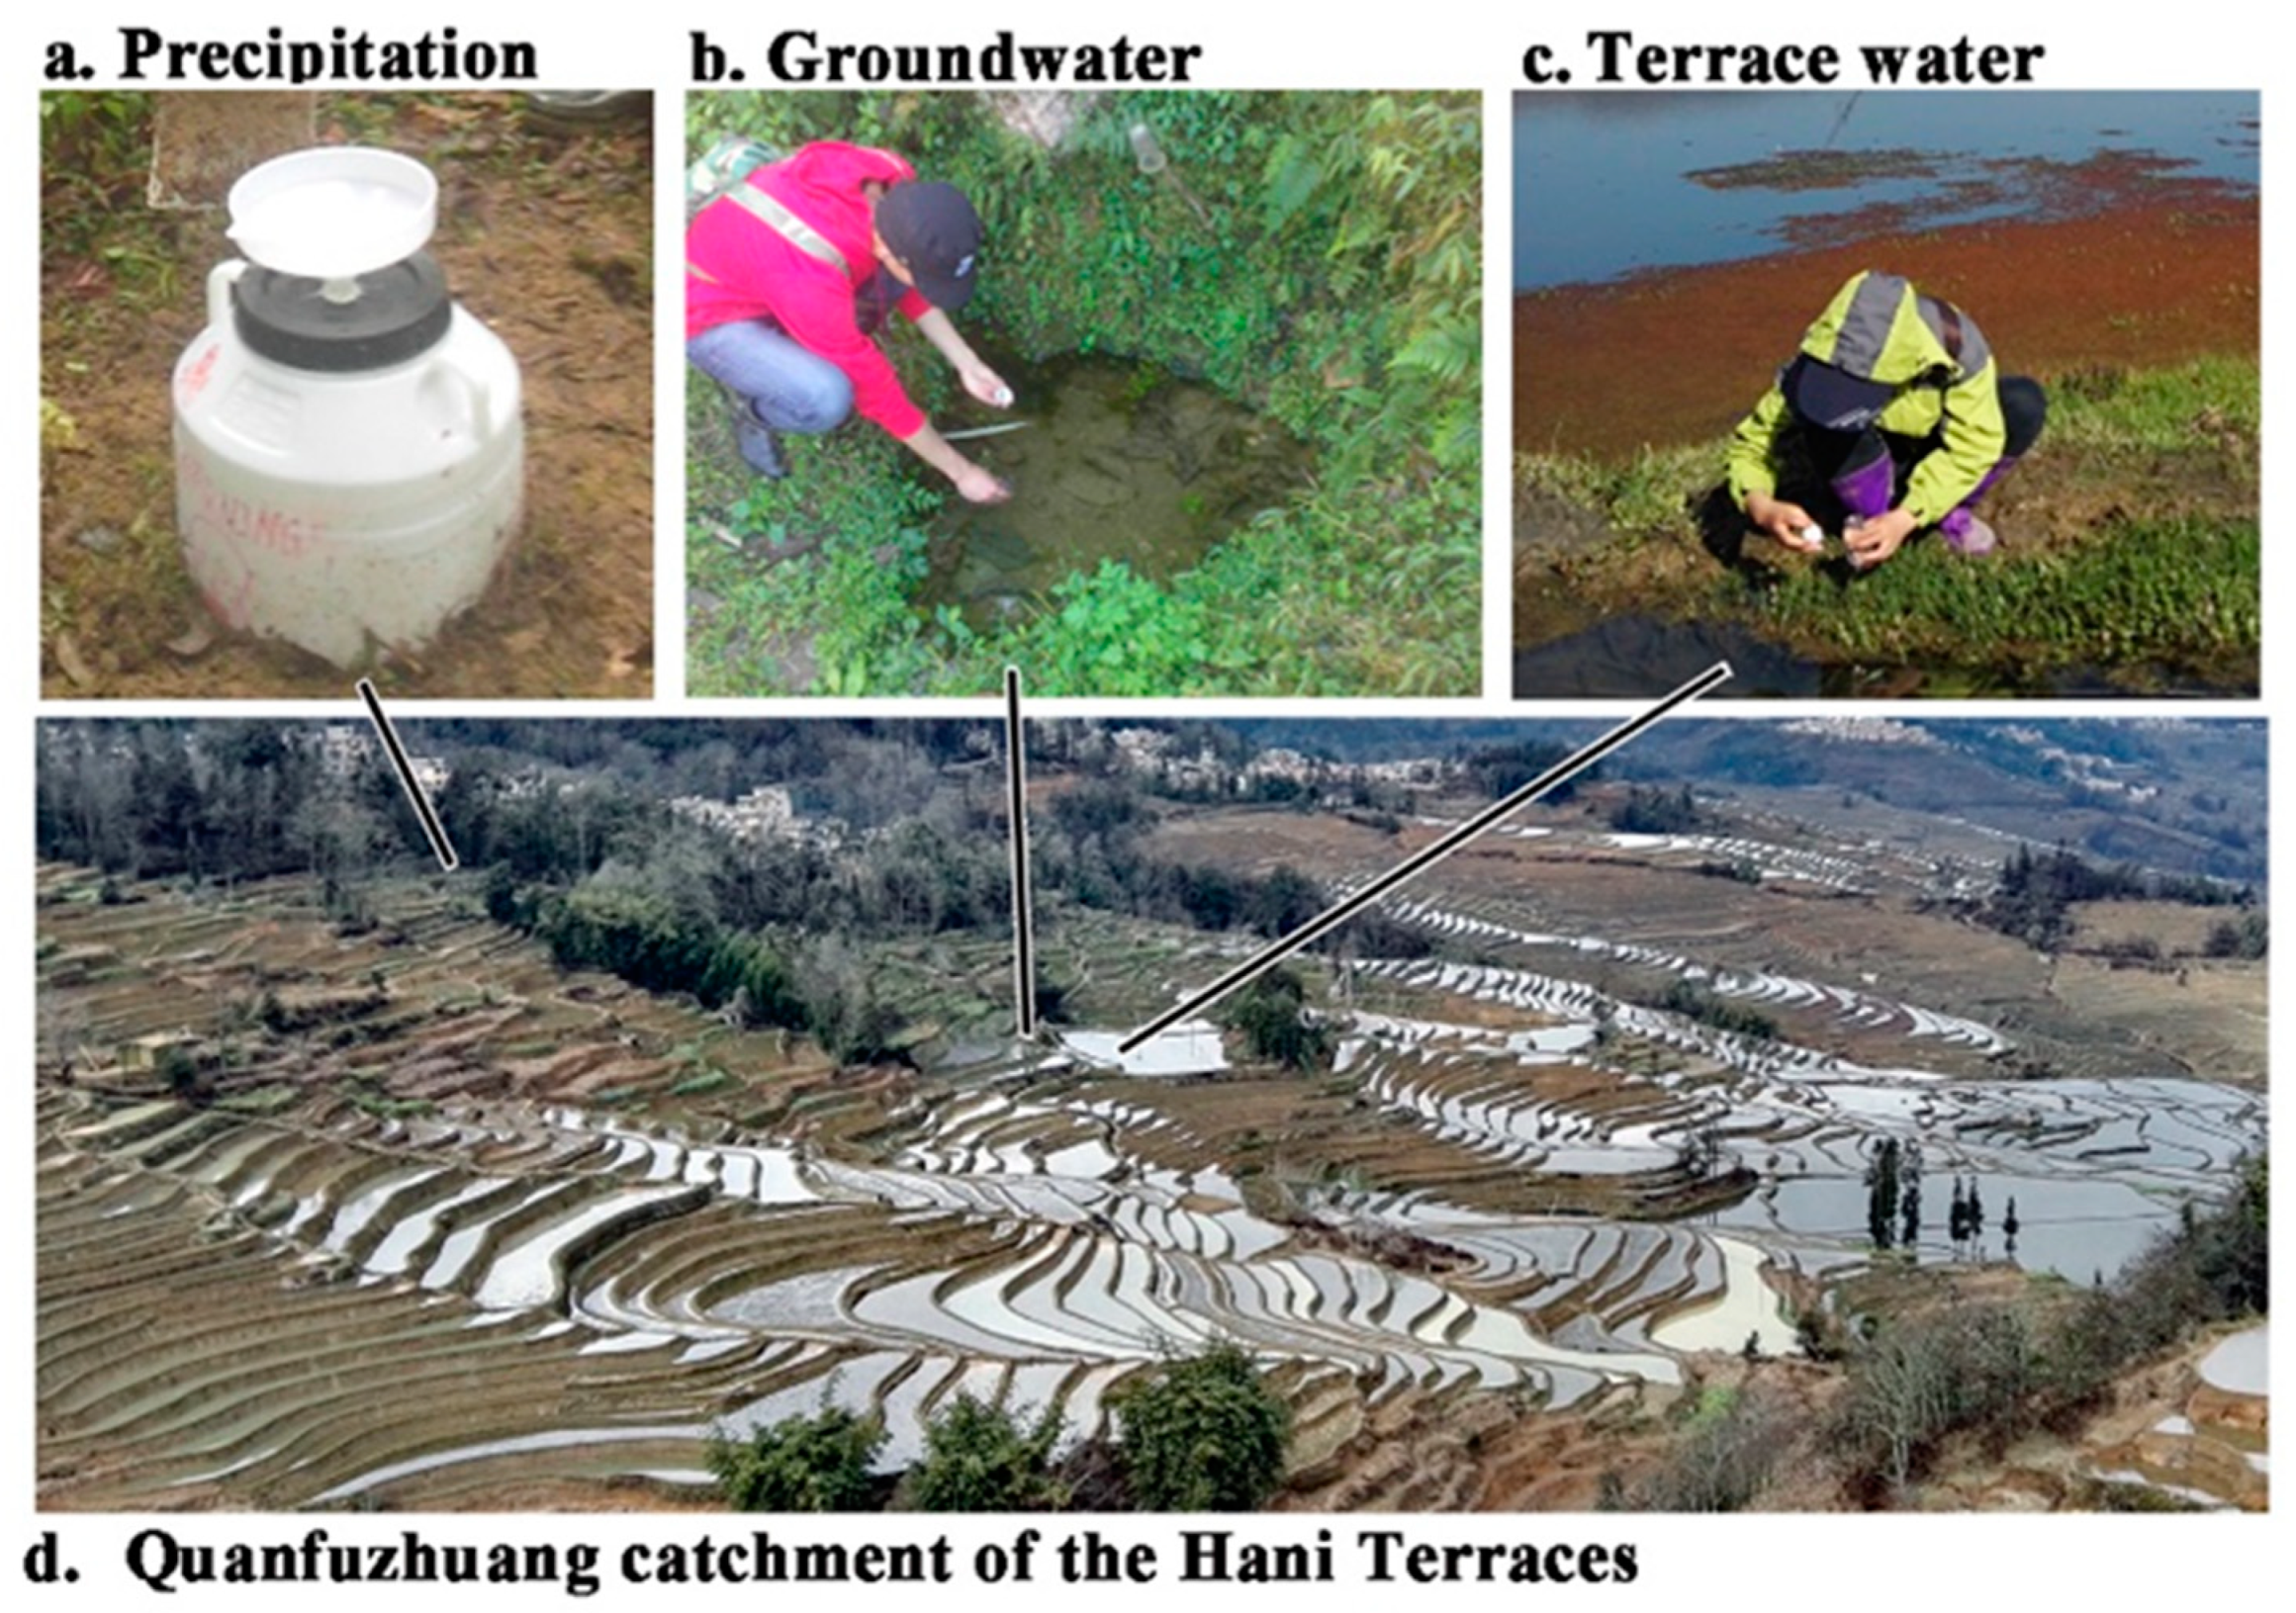
Sampling sites were set along different elevation gradients in the Quanfuzhuang catchment of the Hani Terraces. The elevation ranged from 1500 m to 1800 m, and the elevation difference was 300 m (Figure 1). Samples were collected from May 2015 to April 2016, once a month at all sampling sites, lasting for a year. Ten groundwater sampling sites, ten terrace water sampling sites, and three precipitation sampling sites were established, allowing us to obtain a total of 120 groundwater samples, 120 terrace water samples, and 36 precipitation samples. As shown in Figure 3, all the precipitation samples were collected from 3 reformed rain gauges (Figure 3a), all the groundwater samples were spring water with a slow flow rate (0~0.2 m/s) (Figure 3b), and all the terrace water samples were collected from the rice terrace (Figure 3c).
The hydrogen and oxygen isotope tests were conducted in the Key Laboratory of Plateau Lake Ecology and Global Change, Yunnan Normal University. Using a Picarro L2130-i ultra-high precision liquid water and moisture isotope analyser, the measurement accuracy of 18O and D of the instrument was ±0.1‰ and ±0.5‰, respectively. The final analysis results were expressed by the thousandth difference relative to the Vienna standard mean ocean water (V-SMOW), as follows:
δ D = R D S a m p l e R V S M O W 1 × 1000
δ 18 O = R O S a m p l e R V S M O W 1 × 1000
where RD-sample and RV-SMOW represent the hydrogen stable isotope ratios of R (18O/16O) in the water samples and V-SMOW, respectively; RO-sample and RV-SMOW represent the stable oxygen isotope ratios of R (18O/16O) in the water samples and V-SMOW, respectively.

3.2. Analysis Methods

3.2.1. Statistical Methods

All the statistical analyses were performed using the IBM SPSS Statistics Software version 22 (IBM 295, Böblingen, Germany). In order to determine the δ18O-altitude relationships in groundwater, a one-way ANOVA was used to detect significant differences, followed by Dunnett’s post hoc test. The correlation analyses were performed using Pearson correlation. Statistical significance is displayed in the tables by *, indicating statistical significance at p < 0.05.

3.2.2. Two-Component Isotopic Mixing Model

Based on the two-component isotopic mixing model, the recharge to the terrace water during the year was assessed using the following formulas [41].
f A = δ M I X δ B δ A δ B
f B = 1 f A
where fA is the proportional contribution of the A, fB is the proportional contribution of the B, δMIX is the isotopic value of mixed water A and B, δA is the isotopic value of water A, δB is the isotopic value of water B [41].

3.2.3. Calibration Model

In this study, the isotopic compositions in precipitating and terrace water were calculated using the measured isotopes in precipitation corrected by local evaporation line (LEL), and the calculation for precipitating and terrace water were processed using the Hydrocalculator software [42] (Ver. 1.03, available at http://hydrocalculator.gskrzypek.com (accessed on 5 January 2021)).
f a A = δ A k ε + 1 + k ε +
where δaA is the is the isotopic value of calibrated water A, δA is the isotopic value of water A, k is the adjusting parameter, and ε+ is the equilibrium fractionation factor between the water and vapour. Each parameter was calculated using the Hydrocalculator software.

3.2.4. Assessment of Water Source Stability Based on Drought Index

To maintain the stability and sustainability of the terrace water in the study area, the precipitation in the area should be greater than the evaporation. Hence, we adopted the drought index (K), which was calculated using Penman’s formula, as the key index to measure the stability of water sources in the study area [43,44]. The interval of the index values was adjusted according to the actual conditions found in the study area. The drought index was calculated using the following equation:
K = W 0 R
where K is the drought index; W0 is the evaporation in the region; and R is the synchronous precipitation of the region. K < 0.5 indicates high stability; 0.5 ≤ K ≤ 1 means normal-to-high stability; 1 < K ≤ 1.25 implies normal-to-low stability; and K > 1.25 shows low stability.

4. Results and Analysis

4.1. Characteristic Oxygen Stable Isotope Variations in Precipitation, Groundwater, and Terrace Water

4.1.1. Characteristic Variations of δ18O Values in the Precipitation

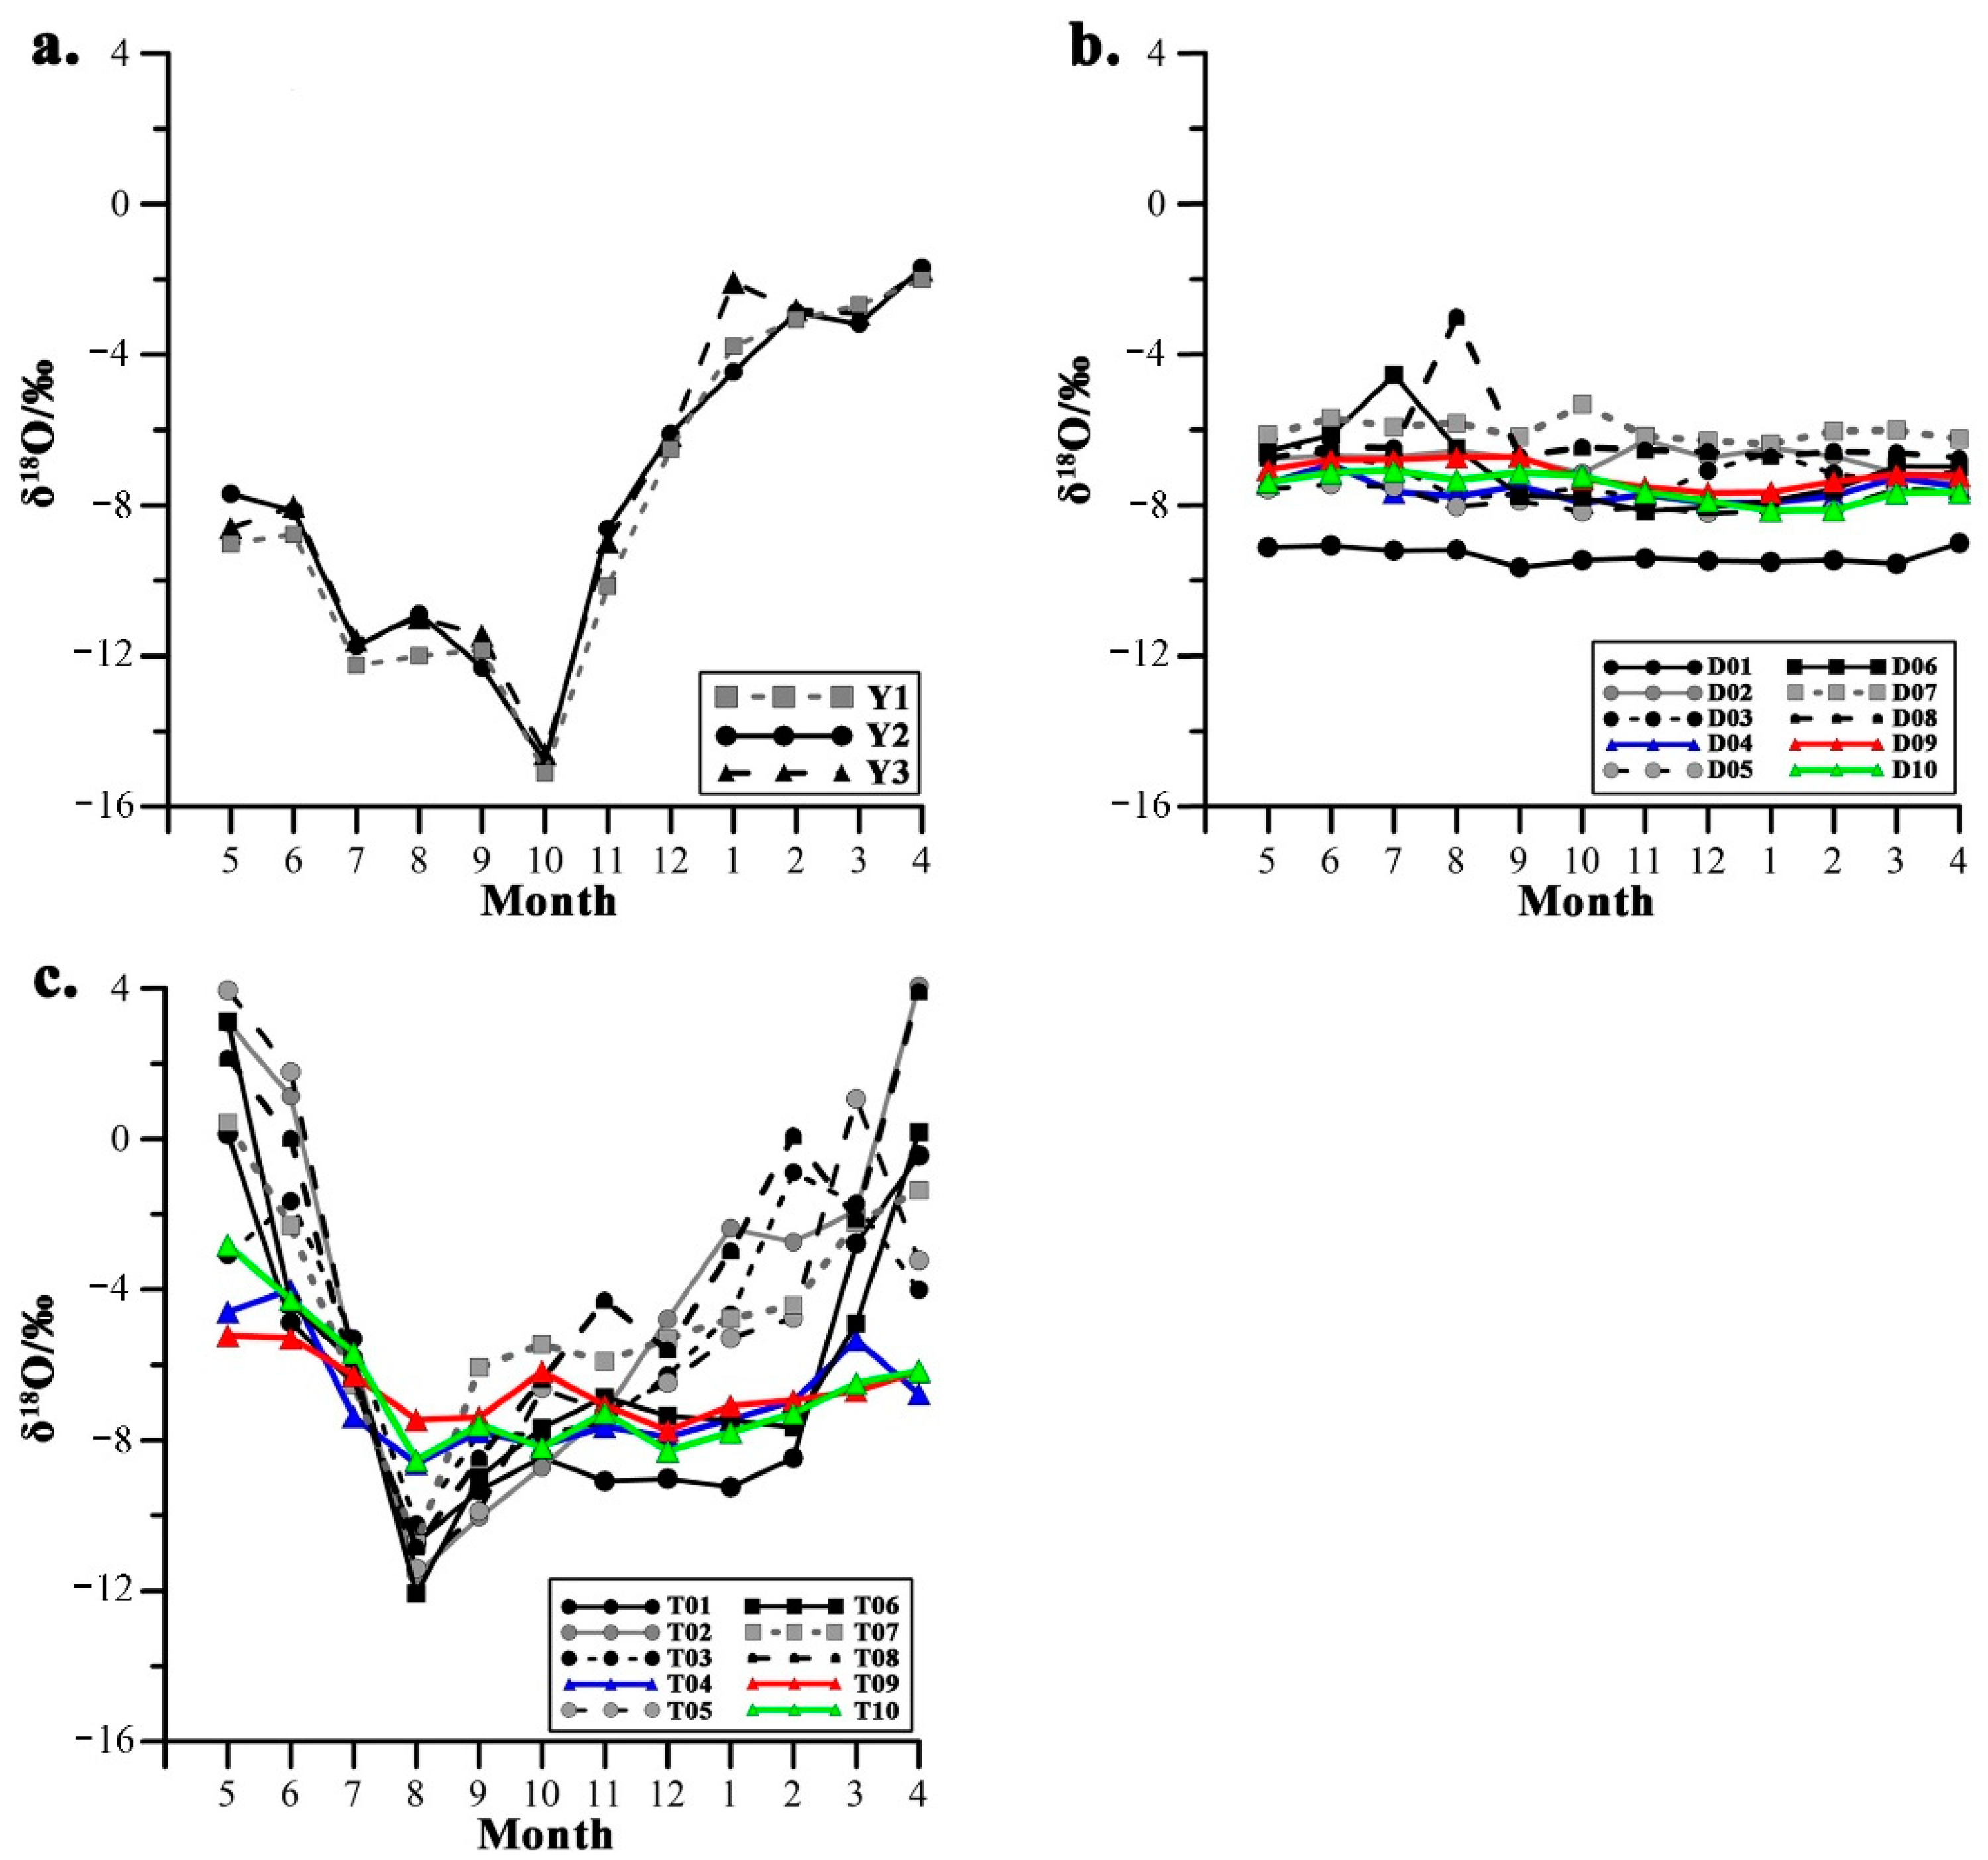
Precipitation was the most significant and stable water source in the study area, and therefore, its composition influenced the other water sources to a great degree. An analysis of 36 precipitation samples taken from three sampling sites (Y1–Y3) in the terrace areas showed that the variation range and trend of the δ18O values in the precipitation samples generally remained consistent over time and across the three sampling sites. No significant changes were observed over the elevation range, indicating little spatial variability in the precipitation. This could be attributed to the relatively low elevation gradient at the sampling sites (Figure 4a). Temporally, the δ18O values of precipitation in the terraces varied with the precipitation volume, showing a ‘V-shaped’ pattern overall. During the wet season (May to October), the δ18O values of the precipitation decreased with increasing precipitation, reaching a minimum in October, while in the dry season (November to April), the δ18O values increased with decreasing precipitation, reaching a maximum in April. Correlation between the δ18O values in the rainwater and the amount of monthly precipitation at each site was analysed, and the correlation coefficients were −0.83, −0.84, and −0.85 (with a significance level of 0.05) for the respective sampling sites. Significant negative correlation was observed between the two variables, indicating a noticeable ‘amount effect’ in the precipitation in the terrace areas. This characteristic ‘amount effect’ observed in the precipitation was inherited by other water sources that were primarily recharged by precipitation. Consequently, these water sources exhibited similar trends in temporal variations.

4.1.2. Characteristics Variations of δ18O Values in Groundwater

The widely exposed groundwater in the study area was another prominent source for recharging the field water in the terrace areas. The analysis of 120 groundwater samples from 10 sampling points (D01–D10) located along the terraces (Figure 4b) exhibited no significant changes over time. Furthermore, the temporal change in the groundwater stable isotope values was associated with relatively fewer fluctuations than the values observed in the precipitation. Outliers existed only in the samples collected from sampling sites D06 and D08 during certain months. Noticeable spatial variations across the elevation range were detected in the groundwater of the study area, with depleted δ18O values observed at sites located at higher elevations. The analysis of the correlation between the δ18O values of the groundwater and elevation of the 10 sampling sites (shown in Table 1) exhibited a significant negative correlation between the two variables in all months except November and January. However, at the seasonal (dry and wet seasons) and annual levels, significant correlation between the two variables was observed for all sampling sites across the study area. The decrease in isotopic values with increasing elevation is known as the isotopic altitude (elevation) effect. Accordingly, this spatial altitude effect was expected in the water sources recharged by this groundwater in the terraces.

4.1.3. Characteristic Variations of δ18O in Terrace Water

If terrace water in this area is recharged by both precipitation and groundwater, their stable isotopic characteristics will be manifested in the terrace water. To verify this, 120 terrace water samples were collected from 10 sampling sites (T01–T10) located within the study area, and their oxygen stable isotopic values were determined (Figure 4c). Temporal variations in the isotopic compositions of surface water at all 10 sampling sites showed a ‘U-shaped’ pattern, marked by depletion from May to August 2015, relative stabilisation from September to December 2015, and enrichment from January to April 2016. The maximum values for both the surface water and precipitation were recorded in April. In contrast, the minimum values for surface water and precipitation were recorded in August and October, respectively. These results indicated that the temporal variability of the δ18O values in the groundwater of the study area was similar to that of the precipitation. However, a relatively stable period was observed from September to December.
In terms of spatial variability, no significant altitude effect was observed in the δ18O values of the terrace water, except for the samples collected in October and November. Furthermore, based on the magnitude of fluctuations observed in the stable isotope values of the collected samples, terrace water was classified into two types: stable terrace water (coloured sample sites) and fluctuating terrace water (black sample sites). The stable terrace water showed no significant fluctuations in the δ18O values throughout the year, similar to the pattern observed in the case of groundwater, while the oxygen stable isotope ratios of the fluctuating terrace water displayed a ‘U-shaped’ variation pattern, showing depletion from May to August, stability from September to December, and enrichment from January to April.

4.2. Analysis of Terrace Water Recharge Sources

4.2.1. Determination of Water Recharge Sources for Terraces Based on the δD-δ18O Relationship of Water Bodies

Based on the analysis of the δD-δ18O values in the 120 terrace water, 120 groundwater, and 36 precipitation samples in the study area (Figure 5), the δD-δ18O relationships in the water sources in the study area were obtained as follows: δD = 8.36δ18O + 21.88 (R2 = 0.97, n = 36) for the local meteoric water (Figure 5a); δD = 4.98δ18O − 15.01 (R2 = 0.92, n = 120) for the local groundwater (Figure 5b); δD = 6.10δ18O − 3.90 (R2 = 0.86, n = 120) for the local terrace water (Figure 5c). The slope of the local annual meteoric water line was slightly greater than that of the global meteoric water line [45]. Figure 5d shows that the terrace water isotope values are distributed between the local annual meteoric water line and the local groundwater line for all months except July. The local terrace water line also lies between the two lines, which provides a preliminary indication that the terrace water was recharged by both precipitation and groundwater. However, the terrace water’s δD and δ18O values recorded in July showed significant deviation from the wet season’s terrace water line, showing a drift towards δD. This may be owing to the application of hydrogen-containing pesticides or fertilizers in the terrace areas in July; however, the exact cause of the deviation requires further analysis.

4.2.2. Analysis of the Proportion of Recharge to Terrace Water Based on a Binary Mixture Model

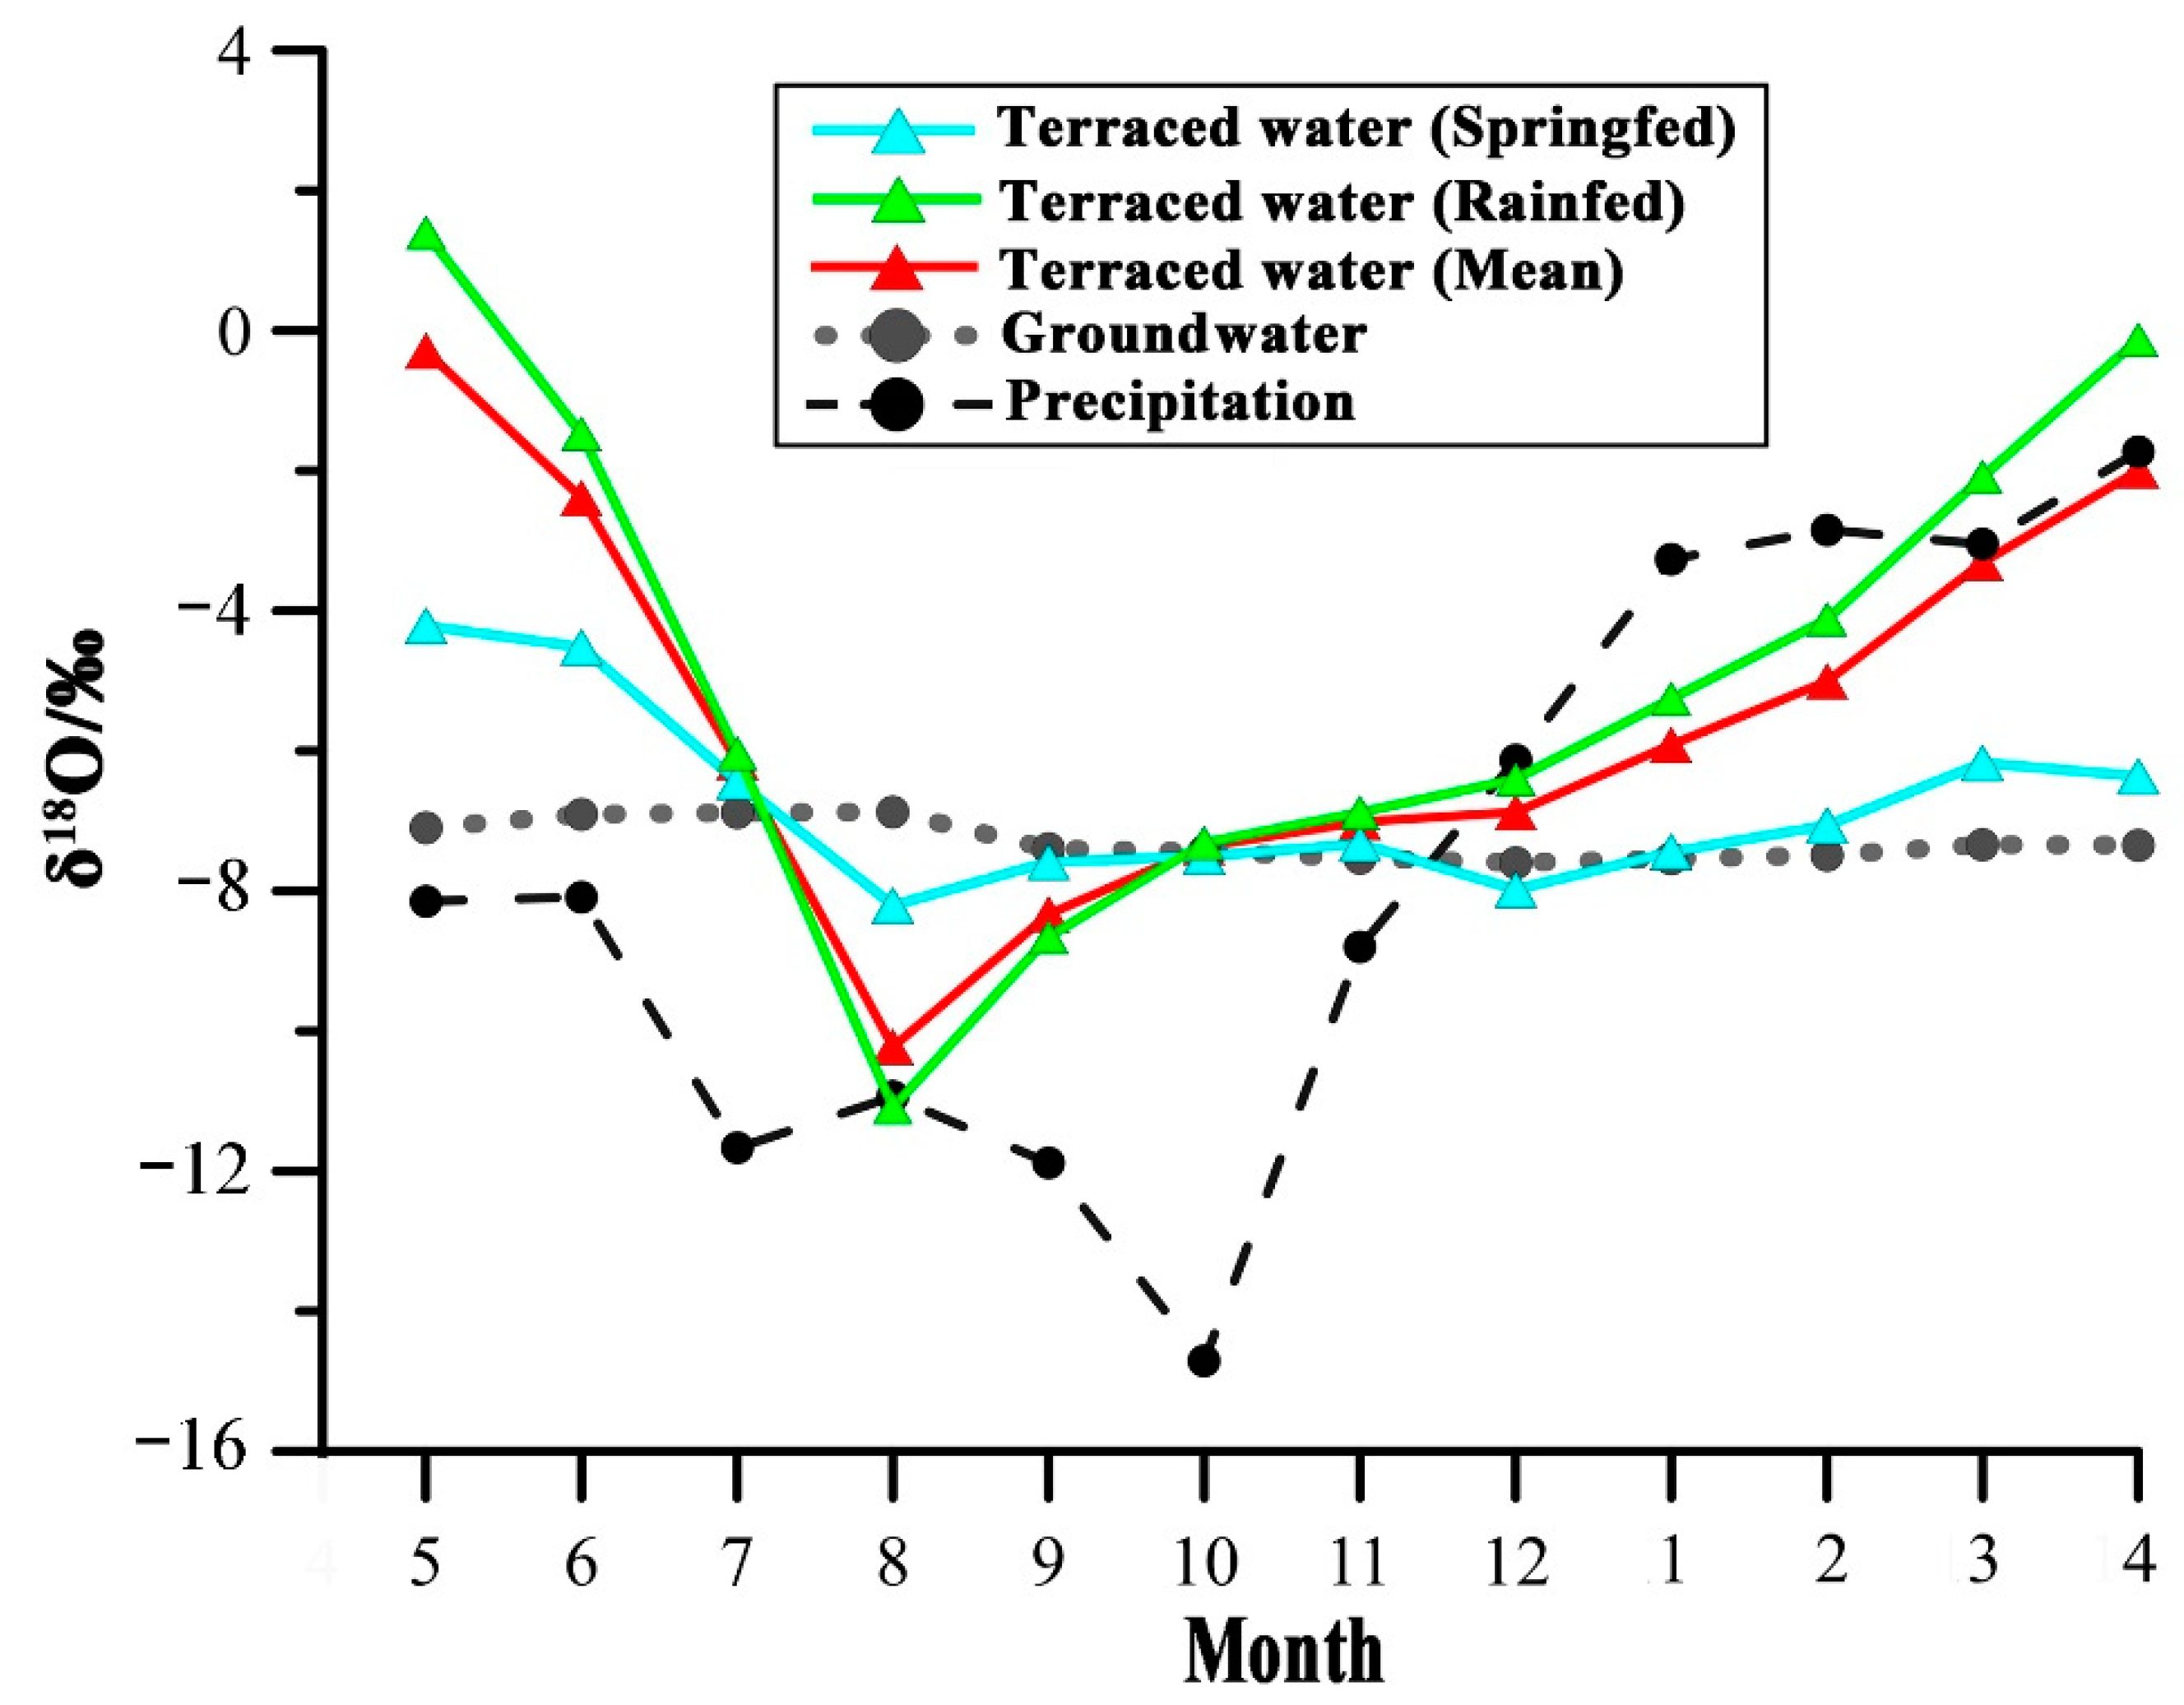
The analysis of the results tentatively suggested that atmospheric precipitation and groundwater were the primary sources for recharging the terrace water in the study area. The mixing ratio of the two sources in the terrace water can be determined by a binary linear mixture model. Figure 6 shows that the δ18O values found in the terrace water were more positive than those found in both the precipitation and groundwater. This could be attributed to the influence of the evaporation process in the case of terrace water. Therefore, variables such as the evaporation process, temperature, humidity, and the evaporation lines of the water sources need to be taken into account, and the values for respective water sources need to be modified accordingly. In this study, the stable isotope δ18O values for the precipitation and terrace water were calibrated using the Hydrocalculator software (version 1.03) (http://hydrocalculator.gskrzypek.com (accessed on 5 January 2021)) [42]. Since groundwater stays underground for a long time, it should not be subjected to evaporation by default. The binary linear mixture model was also used to calculate the monthly mixing ratios of the precipitation and groundwater in the terrace water based on the calibration results (Table 2). As shown in Table 2, the binary mixture ratios were consistent with the previous results, which were obtained according to the stable isotope δ18O values of the three types of water and evaporation lines. Precipitation and groundwater were the main sources to replenish terrace water in the study area, and the average annual recharge ratio of precipitation (66.83%) was higher than the average annual recharge ratio of groundwater (33.17%). For the purpose of simplification, the words ‘ratio’ and ‘proportion’ have been used to describe percentages in this paper.

4.3. Mechanisms of Temp-Spatial Heterogeneity of Water Recharge

4.3.1. Heterogeneous Characteristics of Alternating Recharge of Terrace Water during Rain-Fed and Spring-Fed Periods on an Annual Scale

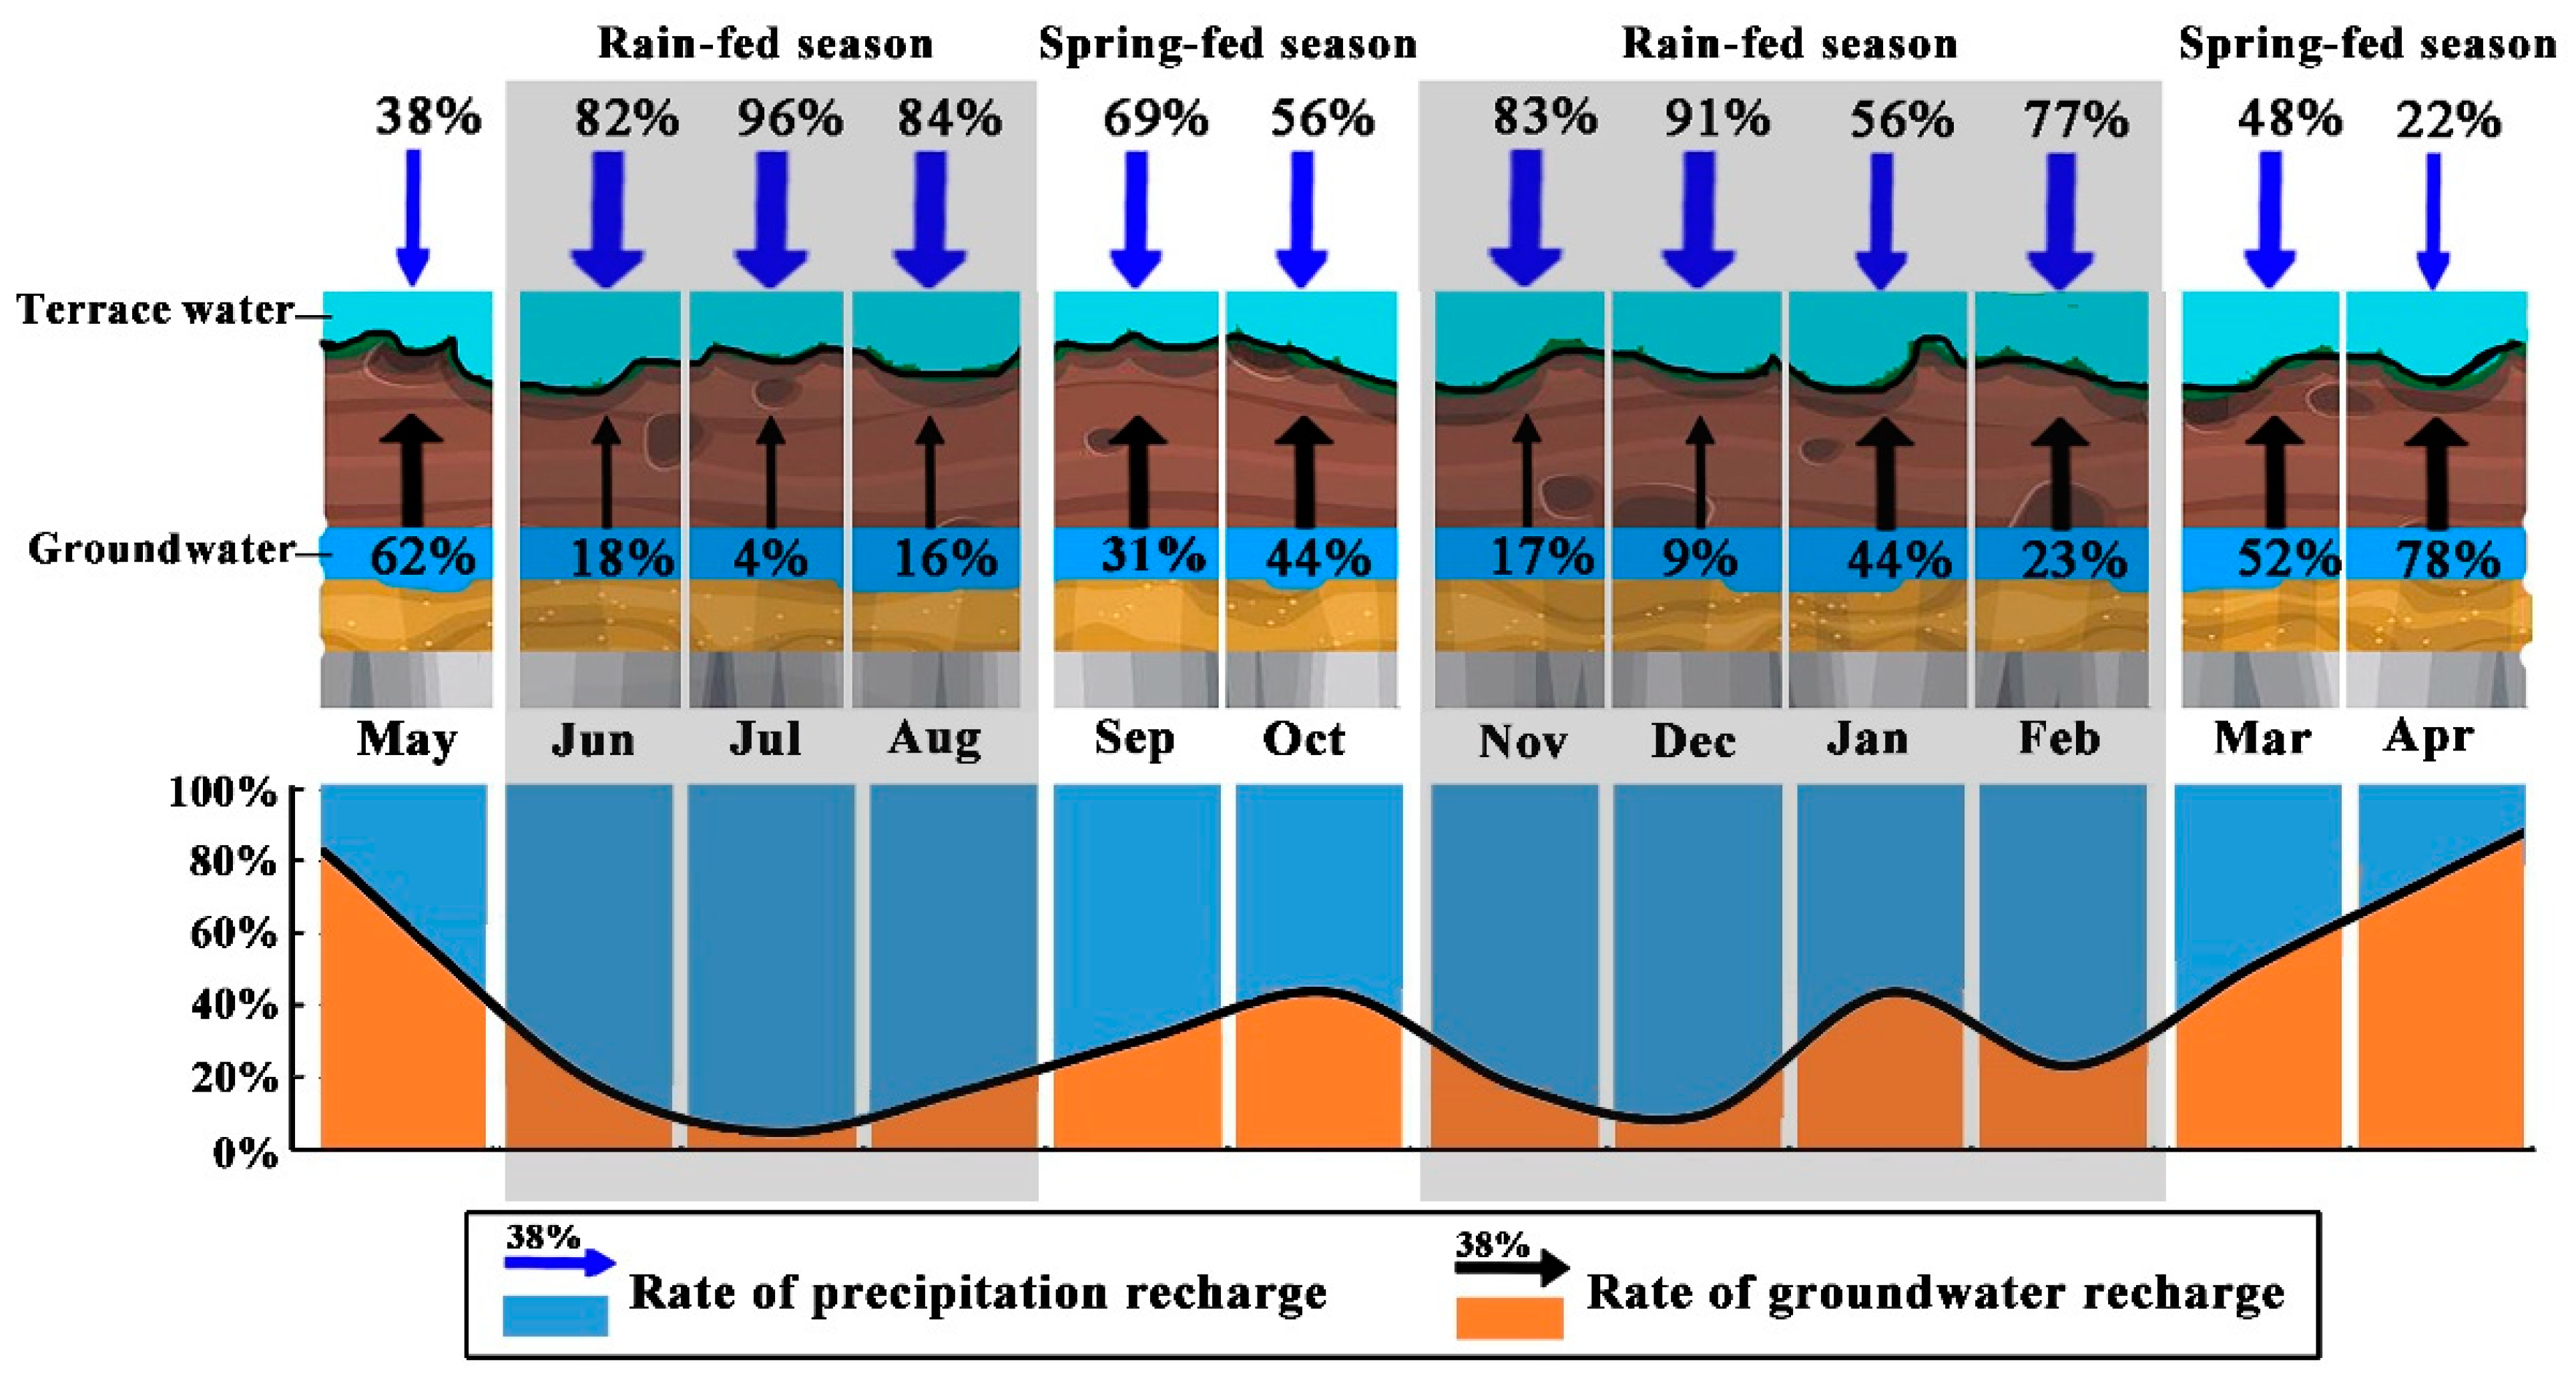
In terms of temporal characteristics (Figure 7), the recharge to the terrace water can be divided into two different recharge periods according to the aforementioned average annual recharge ratios of precipitation (66.83%) and groundwater (33.17%): the rain-fed season (average annual recharge ratio of precipitation > 66.83%) and the spring-fed season (average annual recharge ratio of groundwater > 33.17%). The two types alternated within a year, following seasonal changes. The first rain-fed season was from June to August 2015, during which the high rainfall in the terrace areas increased the proportion of precipitation recharge to 87.33%. The first spring-fed season was from September to October 2015. When the precipitation peaked in August, the groundwater recharge from the precipitation also reached saturation. The groundwater began to flow outwards to recharge the terraces, with the ratio of groundwater recharge increasing to 37.50%. The second rain-fed season was from November 2015 to February 2016, during which the groundwater discharge decreased, and the recharge ratio of precipitation increased to 76.75%. The second spring-fed season was from March to May 2016. As the amount of precipitation decreased to its lowest value, the terraces were recharged by the groundwater, which had been replenished in the second rain-fed season (64%). In particular, terrace water recharge in May was consistent with the dry season because the alternating rain-fed and spring-fed cycle occurred approximately 1–2 months later than the dry and wet season cycles. This delay was calculated according to the time required for recharging the terrace water.
Additionally, a study found that from November to January of each year, tilling activities in the terrace areas accelerated the downward infiltration of terrace water and increased groundwater recharge from the terrace water [29]. Therefore, the groundwater was sufficiently replenished and was equipped to recharge the terraces in the second spring-fed season. The artificial regulation of groundwater infiltration in the form of tilling helped to increase the stability of the recharge water source for the terraces. In general, groundwater has a relatively weak instantaneous response to rainfall and is highly susceptible to land use and the depth of the soil. These factors limit groundwater recharge rates from precipitation. However, the practice of tilling effectively solved this problem [46]. The proportion of groundwater recharge to terrace water during this period may have been miscalculated due to the effect of mixing, with the exact degree of deviation subject to further analysis.

4.3.2. Interwoven Heterogeneous Characteristics of Rain-Fed and Spring-Fed Terrace Water at a Basin Scale

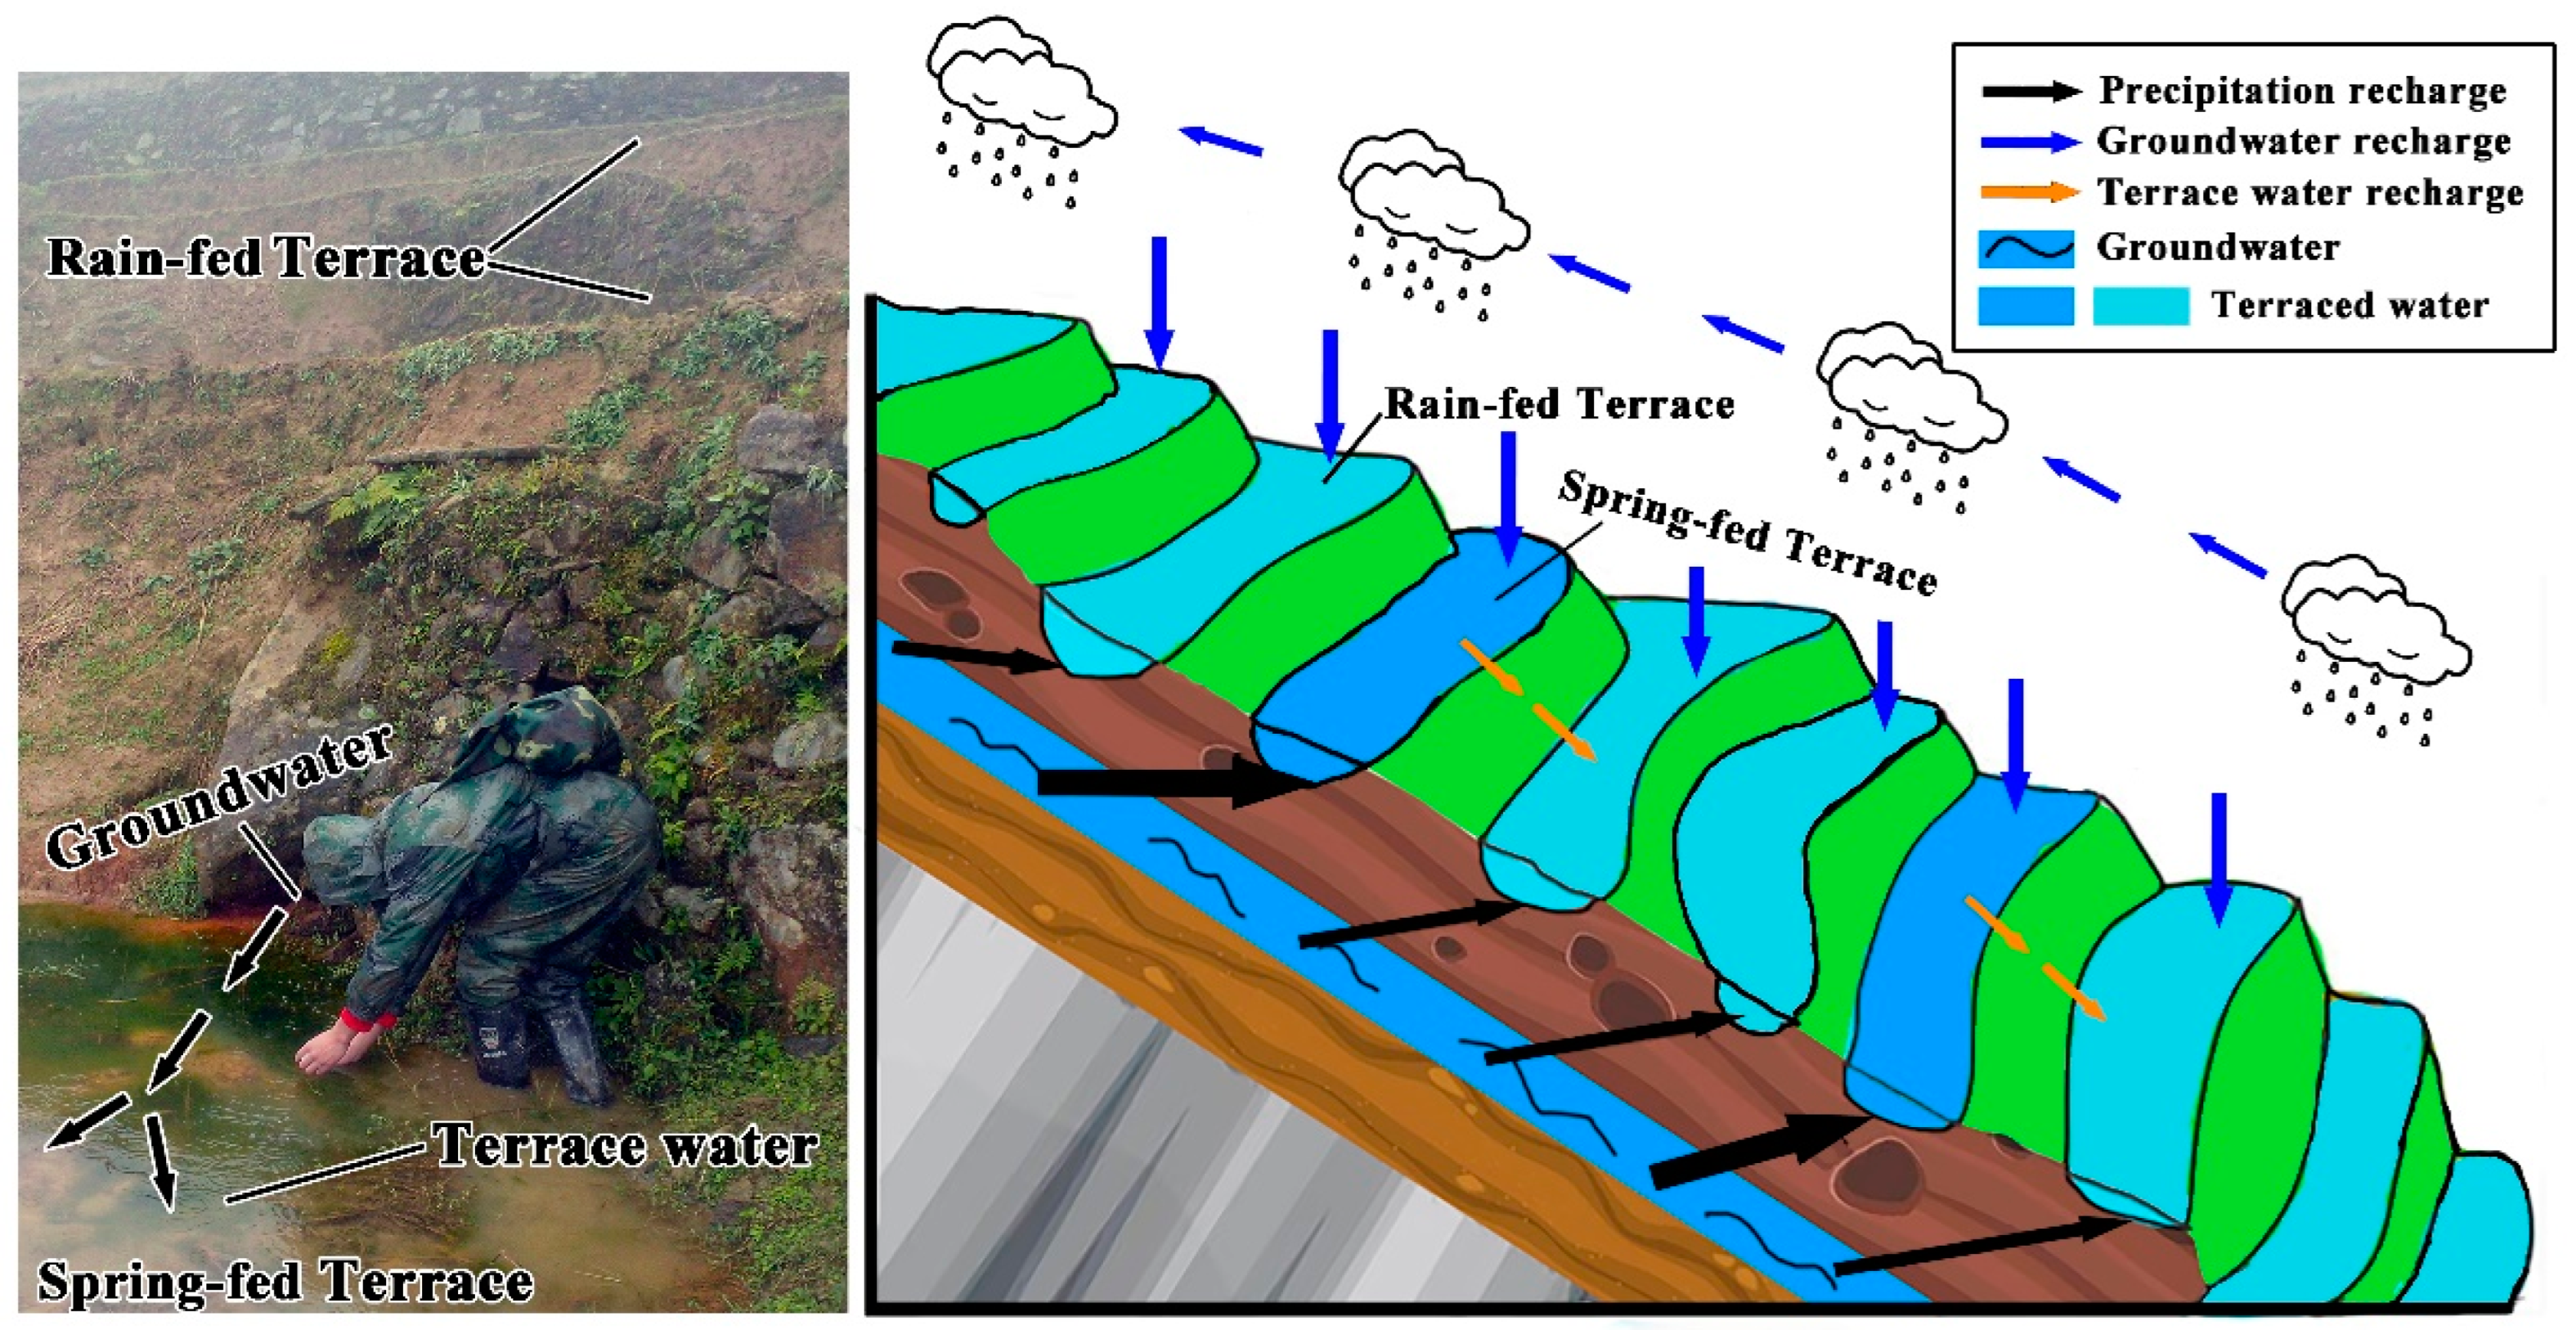
In terms of the spatial characteristics of terrace water recharge (Figure 8), the terrace water can be divided into ‘rain-fed’ and ‘spring-fed’. This categorisation is based on the changes in the values of the stable isotope δ18O in terrace water over time and the recharge relationship. The two types of terrace water exhibited an interwoven distribution. The spring-fed terrace water accounted for a smaller portion. They were mainly recharged by groundwater, with water available in the terraces throughout the year. The majority of the terraces were rain-fed. They were primarily replenished by precipitation, and therefore, were more susceptible to the changes in the amount of precipitation. In the second spring-fed season, while the precipitation recharge reduced, the spring-fed terraces were able to recharge from the groundwater and further replenish water to neighbouring rain-fed fields, which were interwoven with other types through overflow or along the ditches. Thus, the surrounding terraces received water recharge from other fields in addition to their own groundwater recharge. This mechanism maintains the spatial stability of different types of terraced water sources.
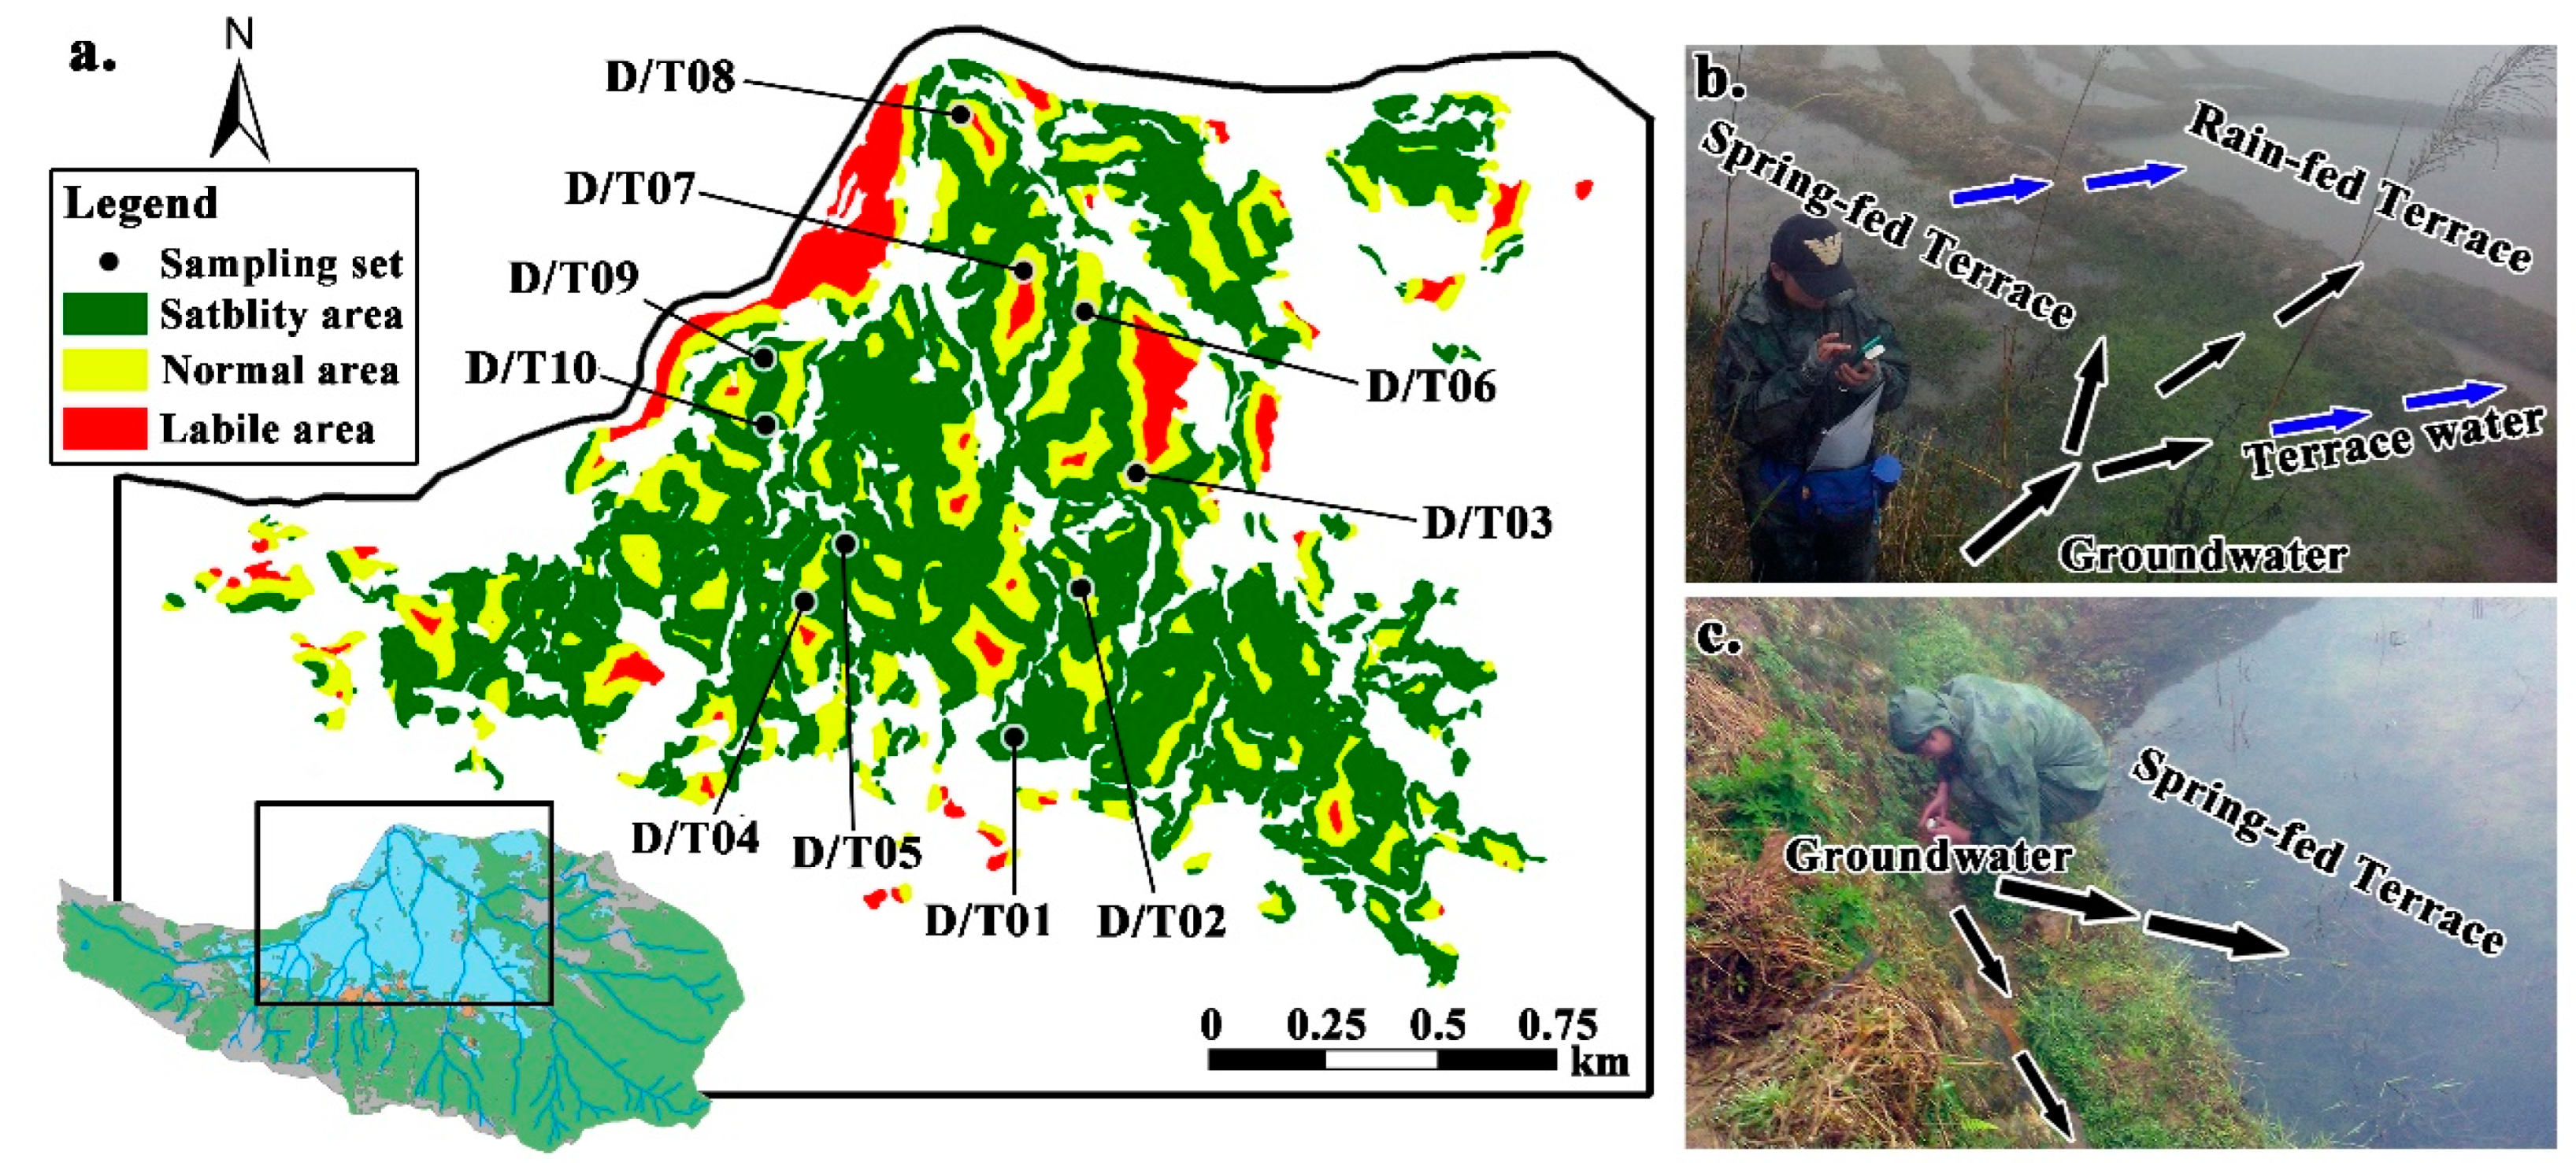
In fact, as early as 2014, some scholars have studied the water source stability of the Quanfuzhuang catchment based on the least-cost distance model and drawn the distribution map of the water source stability area [47]. By comparing with Wang’s research, we can see that the data from their study were superimposed with the locations of the 10 terrace water sampling sites used in this study, as shown in Figure 9a. The results showed that the sites of spring-fed terrace water (T04, T09, and T10) were all located in the terrace water stable area, while the sites of rain-fed terrace water were mostly distributed in the normal or labile areas. This indicates that the spring-fed terraces recharged by groundwater have higher water stability. In addition, while ensuring the stability of spring-fed terraces themselves, the groundwater in spring-fed terraces is also directly or indirectly recharged to rain-fed terraces through the ditches to increase the stability of water recharge in near rain-fed terraces (Figure 9b,c).

5. Discussion

The above analysis indicated that the recharge water sources in the terraces showed significant heterogeneous characteristics both temporally and spatially, and the high degree of coupling between these two heterogeneous features formed the basic framework of the spatial–temporal heterogeneity mechanism of the water recharge sources in the rice terraces of the study area. The results suggested that the two cycles of spring-fed and rain-fed seasons alternated on a temporal scale, while the rain-fed and spring-fed types showed spatial distribution in an interwoven pattern. However, the detailed operation of this coupling mechanism and its capability of maintaining the stability of terrace water sources are yet to be explored.
First, the stability of the recharge water sources for terraces in their natural state lies in whether water can be maintained in the terraces during rice cultivation through continuous irrigation or intermittent precipitation [15]; for example, a study on Hani terraces showed that the water depth of rice terraces with year-round irrigation was generally 20–25 cm, which should be maintained by a sufficient recharge volume to ensure the stability of the terraces [40]. As terrace water only flowed out when either the water level in the field was more than 20 cm or the bottom soil was mostly clay (which has weak permeability), evaporation was the primary cause of field water loss in the dry season. To maintain the stability and sustainability of the terrace water during the dry season, precipitation in the terrace areas should ideally be greater than the evaporation. The stability of water sources was calculated using the drought index, and the values showed that the stability of water sources in the study area was generally at high levels, i.e., they usually reached wet level, and in cases of substantially excessive precipitation, they reached even higher levels of stability. The two exceptions were February, which showed a low stability (1.14) with a semi-wet level, and March, which showed an even lower stability (5.45) that implied a dry state. Thus, the stability of water sources in the terrace areas was fundamentally dependent on the stability of the precipitation.
Second, when instability existed in the natural state of the terrace water supply, human intervention became necessary in the management and regulation of the stability of the terrace water system. During the months of February and March, the terrace areas were in the middle of the dry season and received the least amount of precipitation. Precipitation alone could not keep the terrace water stable. However, the field water in the terrace areas remained at a steady level, as it was supplemented by human activities. The farming activities in the terrace areas are generally arranged months in advance to cope with this situation, i.e., through spatial intervention such as extensive tilling activities to increase water storage and enhance the recharge of terrace water and groundwater by precipitation during the second rain-fed season. These activities provided increased groundwater recharge during the second spring-fed season. In addition, the water supply to the surrounding terraces could be maintained by diverting water from the spring-fed terraces, which were interconnected with the other type of terraces.
In summary, to ensure that the growth cycle of rice coincides with the period in which the stability of water sources is maintained by monsoonal precipitation, the Hani terrace areas have adopted the following practice in an annual farming cycle (Figure 10): During the wet season (April to October), the abundant precipitation maintains recharge water sources with high stability. This is the cultivation period in the terrace areas, during which the rice crops go through the phases of sprouting, transplanting, growing, and maturing. During the dry season (November to April), the precipitation decreases, and cultivation largely ceases. This period was primarily characterised by activities such as tilling and water recharge, which helped to maintain and nurture the fields. Currently, approximately 70% of the mountainous rice farming areas in Asia have transitioned into permanent systems with annual rice cultivation, such as the rice terraces in Bali, Indonesia; the Ifugao terraces in the Philippines; and the Honghe Hani terraces in China. With guaranteed water supply, these rice terraces sustain and provide other exceptionally rich ecosystem services, such as rice production, fish, and duck farming, as well as runoff storage [15,40,48,49]. The key to sustainability lies in the spatial and temporal stability of the recharge water sources in the field based on human–land coupling, which is essentially the same as the case discussed in this study. Scheduled agricultural activities ensured that the growth cycle of rice was aligned, both temporally and spatially, with the phases of water source stability induced by monsoonal precipitation. Furthermore, deliberate farming practices helped to coordinate water recharge and irrigation demand. In other words, rice farming will remain sustainable if the changes in monsoonal precipitation patterns caused by global climate change are synchronised with the anthropogenic agricultural cycle, which comprises land preparation, planting, growing, and harvesting; conversely, if they are not synchronised or are disrupted by human activities, rice farming will not be sustainable. This is the core mechanism for the spatial and temporal stability of the water supply to the human–land coupled system represented by the Hani terraces; it is also a key factor in maintaining the sustainability of the Hani terraces for over a thousand years.

6. Conclusions

Precipitation and groundwater were the main water sources to recharge the terrace water in the Hani terrace areas. Spatially, terrace areas were classified into rain-fed terraces, which were mainly replenished by precipitation, and spring-fed terraces, where groundwater was the primary source of recharge. Temporally, an isotope mixing model was used to determine the main recharge periods and recharge ratios of different water sources, and two recharge periods were defined: the rain-fed season (>70% recharge from precipitation) and the spring-fed season (>30% recharge from groundwater).
The temporally alternating recharge periods of spring-fed and rain-fed seasons and the spatially interwoven distribution of rain-fed and spring-fed types were the key mechanisms to maintain stable water sources in the Hani terraces. In this context, the recharge from groundwater and agricultural interventions on a spatial scale regulated the system to some extent, replenishing the terraces during the two dry months.
In conclusion, the key to the stability of water recharge for rice terraces in the East Asian monsoon region is the temporal stability of precipitation, while groundwater recharge and the scheduling of agricultural cultivation play a moderating role on a spatial scale. If changes in monsoonal precipitation patterns due to global climate change coincide with the agricultural cycle, which includes land preparation, planting, growing, and harvesting, rice farming will be sustainable. This is the essential mechanism for the spatial and temporal stability of the water supply to the human–land coupled system represented by the Hani terraces, which is also a key factor in maintaining the sustainability of the Hani terraces for over a thousand years.

Author Contributions

Conceptualization, Y.J.; Funding acquisition, Y.J. and Q.X.; Writing—original draft, C.L.; Writing—review & editing, Y.J.; Formal analysis, Q.X.; Software, Y.D.; Investigation, Z.L.; Resources, Y.J. and Q.X. All authors have read and agreed to the published version of the manuscript.

Funding

This research was funded by [the Yunnan Provincial Basic Research Project Key Project] grant number [202201AS070024], [the National Natural Science Foundation of China] grant number [41271203] and [41761115], and [the Multi-government International Science and Technology Innovation Cooperation Key Project of National Key Research and Development Program of China] grant number [2018YFE0184300], as well as [the postgraduate research and innovation fund of Yunnan Normal University] grant number [YJSJJ22-B99]. The APC was funded by Yunnan Normal University.

Data Availability Statement

Not Applicable.

Acknowledgments

We further acknowledge all the anonymous reviewers who comprehensively contributed to this paper by providing valuable reviews of earlier versions of this manuscript, and the editors for editing the manuscript.

Conflicts of Interest

The authors declare no conflict of interest.

References

  1. Middleton, B.A.; Souter, N.J. Functional integrity of freshwater forested wetlands, hydrologic alteration, and climate change. Ecosyst. Health Sustain. 2016, 2, e01200. [Google Scholar] [CrossRef] [Green Version]
  2. Henry, R.C.; Arneth, A.; Jung, M.; Rabin, S.S.; Rounsevell, M.D.; Warren, F.; Alexander, P. Global and regional health and food security under strict conservation scenarios. Nat. Sustain. 2022, 5, 303–310. [Google Scholar] [CrossRef]
  3. Sterling, S.M.; Ducharne, A.; Polcher, J. The impact of global land-cover change on the terrestrial water cycle. Nat. Clim. Chang. 2013, 3, 385–390. [Google Scholar] [CrossRef]
  4. Steffen, W.; Rockström, J.; Richardson, K.; Lenton, T.M.; Folke, C.; Liverman, D.; Summerhayes, C.P.; Barnosky, A.D.; Cornell, S.E.; Crucifix, M.; et al. Trajectories of the Earth System in the Anthropocene. Proc. Natl. Acad. Sci. USA 2018, 115, 8252–8259. [Google Scholar] [CrossRef] [Green Version]
  5. Leimbach, M.; Giannousakis, A. Burden sharing of climate change mitigation: Global and regional challenges under shared socio-economic pathways. Clim. Chang. 2019, 155, 273–291. [Google Scholar] [CrossRef]
  6. Grover, V.I. Impact of Climate Change on the Water Cycle. In Managing Water Resources under Climate Uncertainty; Springer Water; Shrestha, S., Anal, A.K., Salam, P.A., van der Valk, M., Eds.; Springer: Cham, Switzerland, 2015; pp. 3–30. [Google Scholar]
  7. Zhang, H.; Huang, G.H.; Wang, D.; Zhang, X.; Li, G.; An, C.; Cui, Z.; Liao, R.; Nie, X. An integrated multi-level watershed-reservoir modeling system for examining hydrological and biogeochemical processes in small prairie watersheds. Water Res. 2012, 46, 1207–1224. [Google Scholar] [CrossRef] [PubMed]
  8. Zahn, R. Monsoon linkages. Nature 2003, 421, 324–325. [Google Scholar] [CrossRef]
  9. Turner, A.G.; Annamalai, H. Climate change and the South Asian summer monsoon. Nat. Clim. Chang. 2012, 2, 587–595. [Google Scholar] [CrossRef]
  10. Mandal, S. Sustainable Land-Use and Water Management in Mountain Ecosystems. In Modelling Land-Use Change; Koomen, E., Stillwell, J., Bakema, A., Scholten, H.J., Eds.; Springer: Dordrecht, The Netherland, 2007. [Google Scholar] [CrossRef]
  11. Annamalai, H.; Slingo, J.M. Active/break cycles: Diagnosis of the intraseasonal variability of the Asian Summer Monsoon. Clim. Dyn. 2001, 18, 85–102. [Google Scholar] [CrossRef]
  12. Wang, B.; Lin, H. Rainy season of the Asian-Pacific summer monsoon. J. Clim. 2022, 15, 386–398. [Google Scholar] [CrossRef]
  13. Singh, D.; Tsiang, M.; Rajaratnam, B.; Diffenbaugh, N.S. Observed changes in extreme wet and dry spells during the South Asian summer monsoon season. Nat. Clim. Chang. 2014, 4, 456–461. [Google Scholar] [CrossRef]
  14. Maclean, J.; Dawe, D.; Hardy, B.; Hettel, G. Rice Almanac: Source Book for the Most Important Economic Activity on Earth; CABI Publishing: Wallingford, UK; International Rice Research Institute (IRRI): Metro Manila, Philippines, 2002. [Google Scholar]
  15. Bouman, B.; Humphreys, E.; Tuong, T.P.; Barker, R. Rice and water. Adv. Agron. 2007, 92, 187–237. [Google Scholar]
  16. Büntgen, U.; Urban, O.; Krusic, P.J.; Rybníček, M.; Kolář, T.; Kyncl, T.; Ač, A.; Koňasová, E.; Čáslavský, J.; Esper, J.; et al. Recent European drought extremes beyond Common Era background variability. Nat. Geosci. 2021, 14, 190–196. [Google Scholar] [CrossRef]
  17. Ceola, S.; Laio, F.; Montanari, A. Global-scale human pressure evolution imprints on sustainability of river systems. Hydrol. Earth Syst. Sci. 2019, 23, 3933–3944. [Google Scholar] [CrossRef] [Green Version]
  18. Penny, G.; Srinivasan, V.; Apoorva, R.; Jeremiah, K.; Peschel, J.; Young, S.; Thompson, S. A process-based approach to attribution of historical streamflow decline in a data-scarce and human-dominated watershed. Hydrol. Process. 2020, 34, 1971–1995. [Google Scholar] [CrossRef]
  19. Vrsmarty, C.J.; Lettenmaier, D.; Leveque, C.; Meybeck, M.; Lawford, R. Human transforming the global water system. Eos Trans. Am. Geophys. Union 2004, 85, 509–514. [Google Scholar] [CrossRef] [Green Version]
  20. Boltz, F.; LeRoy, P.N.; Folke, C.; Kete, N.; Brown, C.M.; St. George, F.S.; Matthews, J.H.; Martinez, A.; Rockström, J. Water is a master variable: Solving for resilience in the modern era. Water Secur. 2018, 8, 100018. [Google Scholar]
  21. Gleick, P.H. Global freshwater resources: Soft-path solutions for the 21st century. Global freshwater resources: Soft-path solutions for the 21st century. Science 2003, 302, 1524–1528. [Google Scholar] [CrossRef] [Green Version]
  22. Hao, S.; Li, F.; Li, Y.; Gu, C.; Zhang, Q.; Qiao, Y.; Jiao, L.; Zhu, N. Stable isotope evidence for identifying the recharge mechanisms of precipitation, surface water, and groundwater in the Ebinur Lake Basin. Sci. Total Environ. 2019, 657, 1041–1050. [Google Scholar] [CrossRef]
  23. Gat, J.R. Oxygen and hydrogen isotopes in the hydrologic cycle. Annu. Rev. Earth Planet. Sci. 1996, 24, 225–262. [Google Scholar] [CrossRef] [Green Version]
  24. Brock, B.E.; Yi, Y.; Clogg-Wright, K.P.; Edwards, T.W.; Wolfe, B.B. Multi-year landscape-scale assessment of lakewater balances in the Slave River Delta, NWT, using water isotope tracers. J. Hydrol. 2009, 379, 81–91. [Google Scholar] [CrossRef]
  25. Turner, K.W.; Wolfe, B.B.; Edwards, T.W. Characterizing the role of hydrological processes on lake water balances in the Old Crow Flats, Yukon Territory, Canada, using water isotope tracers. J. Hydrol. 2010, 386, 103–117. [Google Scholar] [CrossRef]
  26. Lapworth, D.; Dochartaigh, B.; Nair, T.; O’Keeffe, J.; Krishan, G.; MacDonald, A.; Khan, M.; Kelkar, N.; Choudhary, S.; Krishnaswamy, J.; et al. Characterising groundwater-surface water connectivity in the lower Gandak catchment, a barrage regulated biodiversity hotspot in the mid-Gangetic basin. J. Hydrol. 2020, 594, 125923. [Google Scholar] [CrossRef]
  27. Zhou, J.; Liu, G.; Meng, Y.; Xia, C.; Chen, K.; Chen, Y. Using stable isotopes as tracer to investigate hydrological condition and estimate water residence time in a plain region, Chengdu, China. Sci. Rep. 2021, 11, 2812. [Google Scholar] [CrossRef] [PubMed]
  28. Ayenew, T.; Kebede, S.; Alemyahu, T. Environmental isotopes and hydrochemical study applied to surface water and groundwater interaction in the Awash River basin. Hydrol. Process. 2007, 22, 1548–1563. [Google Scholar] [CrossRef]
  29. Liu, C.; Jiao, Y.; Zhao, D.; Ding, Y.; Liu, Z.; Xu, Q. Effects of Farming Activities on the Temporal and Spatial Changes of Hydrogen and Oxygen Isotopes Present in Groundwater in the Hani Rice Terraces, Southwest China. Water 2020, 12, 265. [Google Scholar] [CrossRef] [Green Version]
  30. Yang, Y.; Xiao, H.; Wei, Y.; Zhao, L.; Zou, S.; Yang, Q.; Yin, Z. Hydrological processes in the different landscape zones of alpine cold regions in the wet season, combining isotopic and hydrochemical tracers. Hydrol. Process. 2011, 26, 1457–1466. [Google Scholar] [CrossRef]
  31. Miller, S.A.; Mercer, J.J.; Lyon, S.W.; Williams, D.G.; Miller, S.N. Stable isotopes of water and specific conductance reveal complimentary information on streamflow generation in snowmelt-dominated, seasonally arid watersheds. J. Hydrol. 2021, 596, 126075. [Google Scholar] [CrossRef]
  32. Yang, N.; Zhou, P.; Wang, G.; Zhang, B.; Shi, Z.; Liao, F.; Li, B.; Chen, X.; Guo, L.; Dang, X.; et al. Hydrochemical and isotopic interpretation of interactions between surface water and groundwater in Delingha, Northwest China. J. Hydrol. 2021, 598, 126243. [Google Scholar] [CrossRef]
  33. Sklash, M.G.; Farvolden, R.N. The role of groundwater in storm runoff. J. Hydrol. 1979, 43, 45–65. [Google Scholar] [CrossRef]
  34. Gui, J.; Li, Z.; Yuan, R.; Xue, J. Hydrograph separation and the influence from climate warming on runoff in the north-eastern Tibetan Plateau. Quat. Int. 2019, 525, 45–53. [Google Scholar] [CrossRef]
  35. Buytaert, W.; Vuille, M.; Dewulf, A.; Urrutia, R.; Karmalkar, A.; Célleri, R. Uncertainties in climate change projections and regional downscaling in the tropical Andes: Implications for water resources management. Hydrol. Earth Syst. Sci. 2010, 14, 1247–1258. [Google Scholar] [CrossRef] [Green Version]
  36. Jiao, Y.; Liu, C.; Liu, Z.; Ding, Y.; Xu, Q. Impacts of moisture sources on the temporal and spatial heterogeneity of monsoon precipitation isotopic altitude effects. J. Hydrol. 2020, 583, 124576. [Google Scholar] [CrossRef]
  37. Gao, X.; Roder, G.; Jiao, Y.; Ding, Y.; Tarolli, P. Farmers’ landslide risk perceptions and willingness for restoration and conservation of world heritage site of Honghe Hani Rice Terraces, China. Landslides 2020, 17, 1915–1924. [Google Scholar] [CrossRef] [Green Version]
  38. Brooks, J.R. Water, bound and mobile. Science 2015, 349, 138–139. [Google Scholar] [CrossRef]
  39. Yunnan Geological Survey Bureau. 1:200,000 Regional Geological Report of the Yuanyang Areas; Yunnan Geological Survey Bureau: Kunming, China, 1971; pp. 20–31.
  40. Jiao, Y.M. Natural and Cultural Landscape Ecology of Hani Terraces; Chinese Environmental Science Press: Beijing, China, 2009; pp. 75–112. [Google Scholar]
  41. Masaya, Y. Environmental isotopes in groundwater. In Hydrogen and Oxygen Isotopes in Hydrology; Yoshida, N., Ed.; IHP, UNESCO: New York, NY, USA, 2022; pp. 109–132. [Google Scholar]
  42. Skrzypek, G.; Mydłowski, A.; Dogramaci, S.; Hedley, P.; Gibson, J.J.; Grierson, P.F. Estimation of evaporative loss based on the stable isotope composition of water using Hydrocalculator. J. Hydrol. 2015, 523, 781–789. [Google Scholar] [CrossRef] [Green Version]
  43. Penman, H.L. Natural evaporation from open water, bare soil and grass. Proc. R. Soc. Lond. Ser. A Math. Phys. Sci. 1948, 193, 120–145. [Google Scholar]
  44. Yin, Y.; Ma, D.; Wu, S. Enlargement of the semi-arid region in China from 1961 to 2010. Clim. Dyn. 2018, 52, 509–521. [Google Scholar] [CrossRef]
  45. Craig, H. Isotopic Variations in Meteoric Waters. Science 1961, 133, 1702–1703. [Google Scholar] [CrossRef]
  46. Huang, Y.; Evaristo, J.; Li, Z. Multiple tracers reveal different groundwater recharge mechanisms in deep loess deposits. Geoderma 2019, 353, 204–212. [Google Scholar] [CrossRef]
  47. Wang, D.; Jiao, Y.; He, L.; Zong, L.; Xiang, D.; Hu, Z. Assessment on water source stability of the Hani Terrace landscape based on river-ditch connectivity. Chin. J. Ecol. 2014, 33, 2865–2872. [Google Scholar]
  48. Sintayehu, D.W. Impact of climate change on biodiversity and associated key ecosystem services in Africa: A systematic review. Ecosyst. Health Sustain. 2018, 4, 225–239. [Google Scholar] [CrossRef] [Green Version]
  49. Dang, K.B.; Burkhard, B.; Windhorst, W.; Müller, F. Application of a hybrid neural-fuzzy inference system for mapping crop suitability areas and predicting rice yields. Environ. Model. Softw. 2019, 114, 166–180. [Google Scholar] [CrossRef]
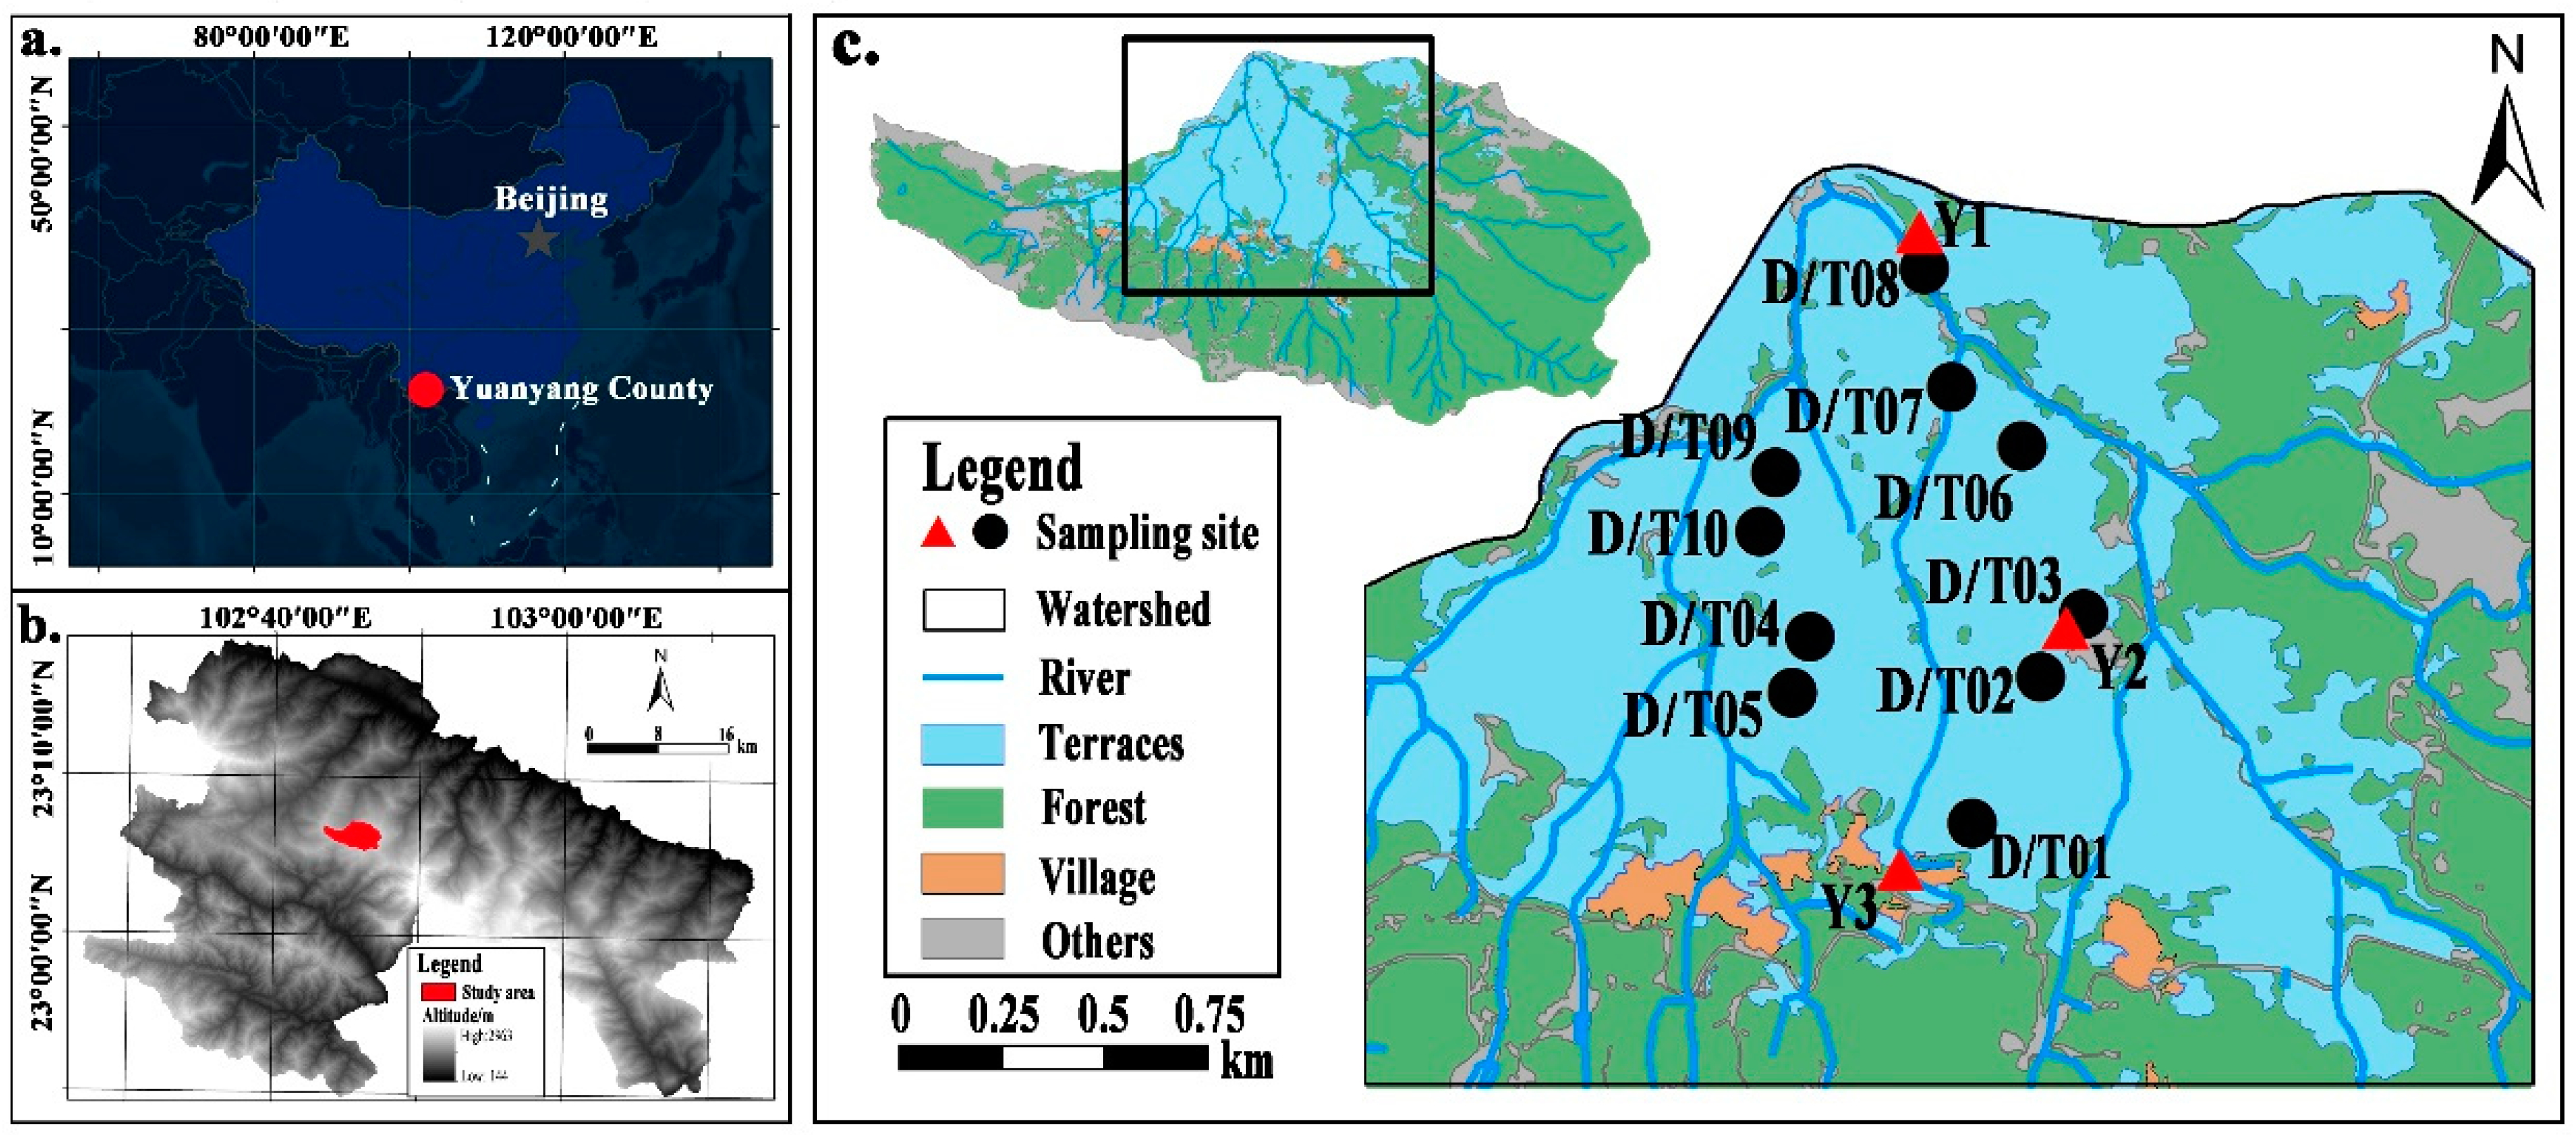
Figure 1. (a) Location of the Quanfuzhuang River Basin (QBS), (b) topography of the Yuanyang County, and (c) landscape pattern of the Quanfuzhuang River Basin (QBS). The black solid circles in (c) indicate the sampling site of terrace water and groundwater (T01–T10 and D01–D10, respectively); the red solid triangles in (c) indicate the sampling site of precipitation (Y1–Y3); and the weather station is located at Y3.
Water 14 04110 g001
Figure 2. Monthly average temperature, relative humidity, evaporation, and precipitation data were collected from April 2015 to July 2016 at the weather stations (Y3).
Water 14 04110 g002
Figure 3. Figures showing the sample collection process in study area: (a) precipitation samples collected in Y3, (b) groundwater samples collected in D2, (c) terrace water samples collected in T2, (d) the Quanfuzhuang catchment of the Hani Terraces (part).
Water 14 04110 g003
Figure 4. (a) The spatial and temporal distributions of δ18O in precipitation, (b) the spatial and temporal distributions of δ18O in groundwater, (c) the spatial and temporal distributions of δ18O in terrace water.
Water 14 04110 g004
Figure 5. (a) Global Meteoric Water Line (GMWL) and Local Meteoric Water Line (LMWL) for the study area based on the data of individual sampling events from May 2015 to April 2016. (b) Local Ground Water Line (LGWL) for the study area based on the data of individual sampling events from May 2015 to April 2016. (c) Local Terrace Water Line (LTWL) for the study area based on the data of individual sampling events from May 2015 to April 2016. (d) The relationships between the δD-δ18O relationships in precipitation, ground water, and terrace water.
Water 14 04110 g005
Figure 6. Relationship between the precipitation, groundwater, and terrace water across seasons.
Water 14 04110 g006
Figure 7. Temporal features on terrace water under the influence of recharge.
Water 14 04110 g007
Figure 8. Spatial feature on terraced water under the influence of recharge.
Water 14 04110 g008
Figure 9. (a) Map showing the location of terrace water sampling sites at the water stability zoning (data on water stability zoning were taken from Wang [47]). (b) Indirect recharge of groundwater to rain-fed terraces, (c) direct recharge of groundwater to rain-fed terraces.
Water 14 04110 g009
Figure 10. Temporal and spatial stability mechanism of terrace water sources: when K < 0.05, stability is highest; 0.5 ≤ K ≤ 1, stability is high; 1 < K ≤ 1.25, stability is low; and K > 1.25, stability is lowest.
Water 14 04110 g010
Table 1. The δ18O-altitude relationships in groundwater.
DateCorrelation CoefficientDateCorrelation Coefficient
May−0.70 *November−0.56
June−0.77 *December−0.66 *
July−0.75 *January−0.58
August−0.85 *February−0.70 *
September−0.66 *March−0.76 *
October−0.76 *April−0.83 *
Rainy season−0.87 *Dry season−0.70 *
Annual−0.80 *
Note: n = 10 when α = 0.05, = 0.63. “*” implies passing the correlation test.
Table 2. Statistics of the precipitation and groundwater ratios in the study area: fp is the proportional contribution of the precipitation; fg is the proportional contribution of the groundwater.
TimeRecharge RatioTimeRecharge Ratio
fpfgfpfg
May38%62%November83%17%
June82%18 %December91%9%
July96 %4%January56%44%
August84%16%February77%23%
September69%31%March48%52%
October56%44%April22%78%
Publisher’s Note: MDPI stays neutral with regard to jurisdictional claims in published maps and institutional affiliations.