Article

Comparisons of Precipitation Isotopic Effects on Daily, Monthly and Annual Time Scales—A Case Study in the Subtropical Monsoon Region of Eastern China

1
College of Geographical Sciences, Hunan Normal University, Changsha 410081, China
2
Key Laboratory of Geospatial Big Data Mining and Applications in Hunan Province, Hunan Normal University, Changsha 410081, China
*
Authors to whom correspondence should be addressed.
Water 2023, 15(3), 438; https://doi.org/10.3390/w15030438
Submission received: 21 December 2022 / Revised: 12 January 2023 / Accepted: 18 January 2023 / Published: 22 January 2023
(This article belongs to the Special Issue Isotope Tracers in Watershed Hydrology)

Abstract

:
The study on precipitation isotope variation can potentially improve the understanding of weather processes, regional water cycle and paleoclimate reconstruction in the subtropical monsoon region. Based on the measured stable isotope composition in precipitation (δ18Op) and daily precipitation from January 2010 to December 2021 in Changsha of the subtropical monsoon region of eastern China, the δ18Op variations, amount effect and local meteoric water line (LMWL) were analyzed and compared on daily, monthly and annual time scales, as well as under different precipitation intensities. The results showed that, on the daily time scale, δ18Op was significantly and negatively correlated with precipitation in the study area. Influenced by subcloud evaporation, small precipitation events (≤5 mm/d) could change the rainout level of precipitation isotopes. There were significant differences in the slope and intercept of the LMWL on different time scales, in different seasons and under different precipitation intensities. On the daily and monthly time scales, the slope and intercept of the LMWL in the cold half of the year were significantly smaller and larger than those in the warm half of the year, respectively, and the slope and intercept of the LMWL increased significantly with precipitation intensity, and then remained largely stable. On the annual time scale, the slope and intercept of the LMWL in the cold half of the year were smaller than those in the warm half of the year. The possible reasons for the differences in the LMWL on different time scales are the combined effects of seasonal differences in precipitation intensity and water vapor sources.

Graphical Abstract

1. Introduction

The heavy isotopes in precipitation (i.e., 2H and 18O) have stable geophysical–chemical characteristics and respond sensitively to changes in the atmospheric environment. Therefore, the stable isotopic compositions in precipitation (i.e., δ2Hp and δ18Op) are often used as quantitative proxies for water cycle tracing, atmospheric circulation pattern diagnosis and paleoclimate reconstruction [1,2,3,4,5,6].
In many cases, stable isotopes in precipitation show a significant negative correlation with precipitation amount [7]. This phenomenon, called the “amount effect”, universally appears in the low-latitude ocean and monsoon regions [8,9,10]. However, at some mid-latitude stations, the amount effect may occur only in summer [11]. In paleoclimate and hydrometeorological studies, stable isotope compositions in different water bodies have been used as indicators of precipitation intensity or monsoon intensity based on the amount effect [12,13]. According to the Rayleigh fractionation principle [7], the amount effect arises as a result of stable isotope fractionation during condensation. Due to the preferential condensation of heavy isotopes during the phase change, the heavy isotopes in the remaining water vapor are continuously depleted, which leads to the continuous depletion of heavy isotopes in the following precipitation. The higher the cumulative amount of a precipitation event, the stronger the depletion of stable isotopes in water vapor, and the lower the δ2Hp and δ18Op. In addition, δ2Hp and δ18Op are also influenced by subcloud evaporation [14,15,16].
The linear relationship between δ2Hp and δ18Op, famous as the meteoric water line (MWL), indicates the average fractionation rate difference among two stable isotopes [7]. On the global scale, MWL was described as δ2H = 8δ18O + 10‰ [17]. However, the local MWL (LMWL) varies from place to place and on different time scales [18]. When a water body evaporates in an unsaturated atmosphere, the combined effect of light isotope preferential evaporation and kinetic fractionation effects accelerate the ratio of 2H to 18O fractionation effects in evaporating water vapor, resulting in an increase in the LMWL slope and deuterium excess (d) in water vapor [7,19]. The higher the temperature and the lower the humidity, the higher the LMWL [19]. At the same time, the LMWL slope and d decrease in evaporated water bodies, such as raindrops falling from the clouds. In supersaturated environments, the combined action of heavy isotope preferential condensation and kinetic fractionation effects decelerates the ratio between the 2H and 18O fractionation effects in condensation, leading to a decrease in the LMWL slope and d [20]. Additionally, the recycled water vapor from the underlying surface also plays a positive role in the LMWL slope and d [20,21]. Generally, the slopes and intercepts of LMWLs are greater in humid regions than in arid regions, and greater in the wet season than in the dry season.
Isotopic effects in precipitation change with time, location and atmospheric circulation conditions [22,23]. Previous studies mainly investigated the stable isotope effects in precipitation based on monthly precipitation data [24,25,26]. However, limited by the length of the monitoring station data, the following questions require further study: (1) the differences in stable isotopes in precipitation on different time scales; (2) whether the stable isotope effect in precipitation is stable and (3) how stable isotope effects in precipitation vary with precipitation intensity in the monsoon region.
This paper aims to compare the relationship between δ18Op and precipitation on daily, monthly and annual time scales, and analyze the LMWL variation on different time scales, based on the 12-year daily δ2H and δ18O in precipitation observations in Changsha, and the corresponding daily precipitation from 2010 to 2021. The results will deepen the understanding of stable isotope variation patterns in precipitation in the monsoon region, and provide a basis for regional water cycle research, water resource investigation and paleoclimate reconstruction.

2. Materials and Methods

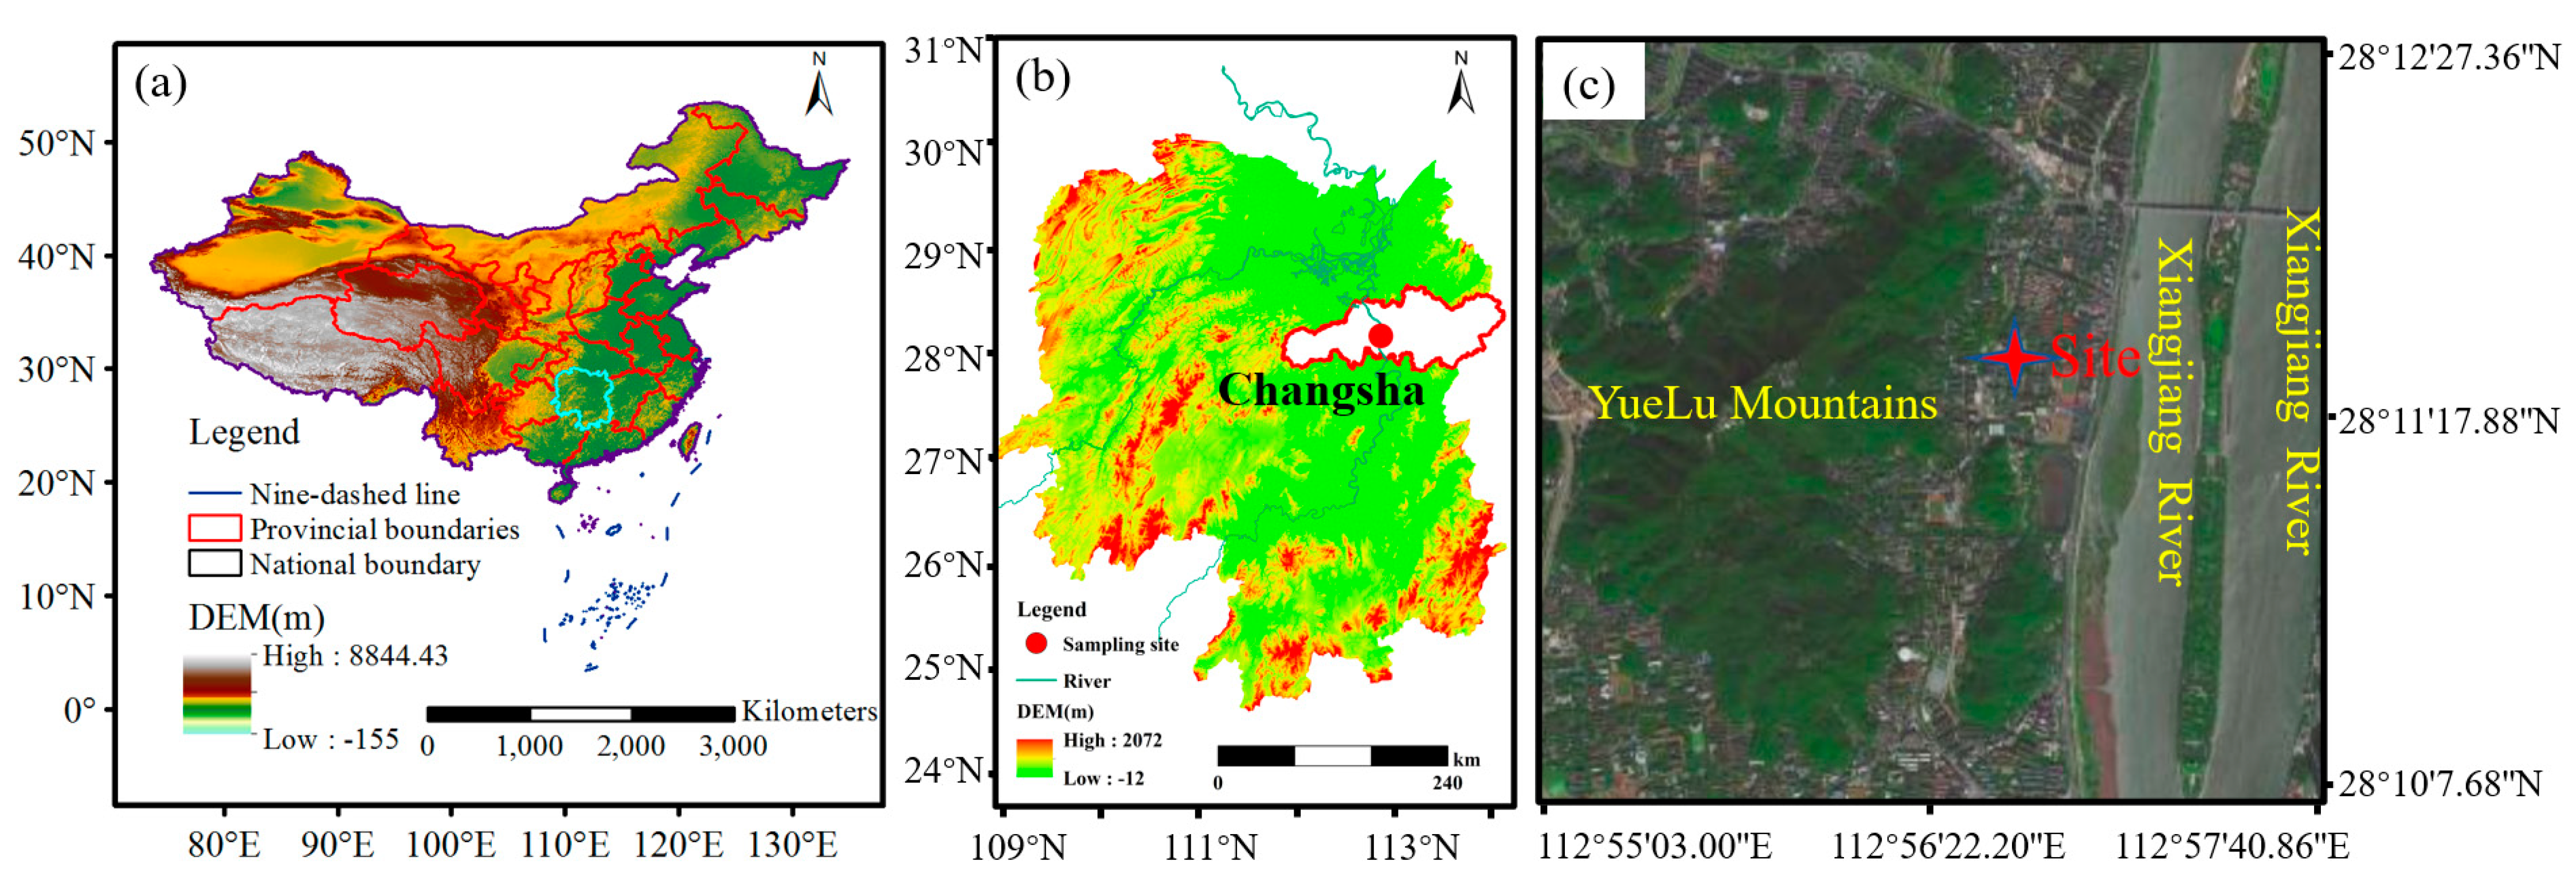
2.1. Overview of the Study Area

Changsha is located in the eastern subtropical monsoon region of China (Figure 1), with a mild and humid climate and distinct four seasons. The mean annual temperature is 17.4 °C and mean annual precipitation amount is 1447.0 mm. During the warm half of the year (April to September), influenced by the southwest monsoon from the Bay of the Bengal, the Arabian Sea and the southeast monsoon from the western Pacific Ocean, precipitation is abundant and accounts for about 69% of the annual precipitation. During the cold half of the year (October to March), precipitation is low and only accounts for about 31% of the annual precipitation due to continental air masses prevailing.

2.2. Water Sample Collection

Precipitation sample collection was carried out from 1 January 2010 to 31 December 2021, at the meteorological station of Hunan Normal University, located at the foot of the Yuelu Mountain in Changsha City, China. According to precipitation observation regulation published by the China Meteorological Administration, precipitation of ≥0.1 mm was sampled at 08:00 and at 20:00 (Beijing time) on the rainy day. Precipitation samples were collected by a siphon rain gauge, and the liquid precipitation collected was directly poured into a 30 mL polyethylene plastic bottle and then measured, sealed and numbered. For solid precipitation (snow, hail, etc.), the sample was firstly put into a water sample bag, tightened and placed at room temperature, and then sealed in a 30 mL polyethylene plastic bottle after it completely melted. The water samples were stored at a low temperature (~4 °C) to avoid evaporation.
δ2Hp and δ18Op in water samples were measured using a gas–liquid dual-use water stable isotope analyzer (DLT-IWA-35EP, LGR, USA). Analytical results are expressed as per mill, relative to those of the Vienna Standard Mean Ocean Water (V-SMOW).
δ18O (or δ2H) = (Rs/Rv-smow − 1) × 1000‰
where Rs and Rv-snow represent the oxygen (or hydrogen) stable isotope ratios (18O/16O or 2H/1H) in water samples and Vienna Standard Average Ocean Water, respectively. δ18Op and δ2Hp have the precisions of ±0.6‰ and ±0.2‰, respectively.
The data of precipitation and other meteorological elements during the sampling period were obtained from an automatic weather station (WeatherHawk500, Logan, UT, USA) installed at the observation site.
The sampling and monitoring period was 12 natural years. For days including more than one precipitation sample, δ18Op and δ2Hp were calculated using the precipitation-weighted mean. Overall, we obtained 1544 precipitation samples, representing 1544 precipitation days.

3. Results and Discussion

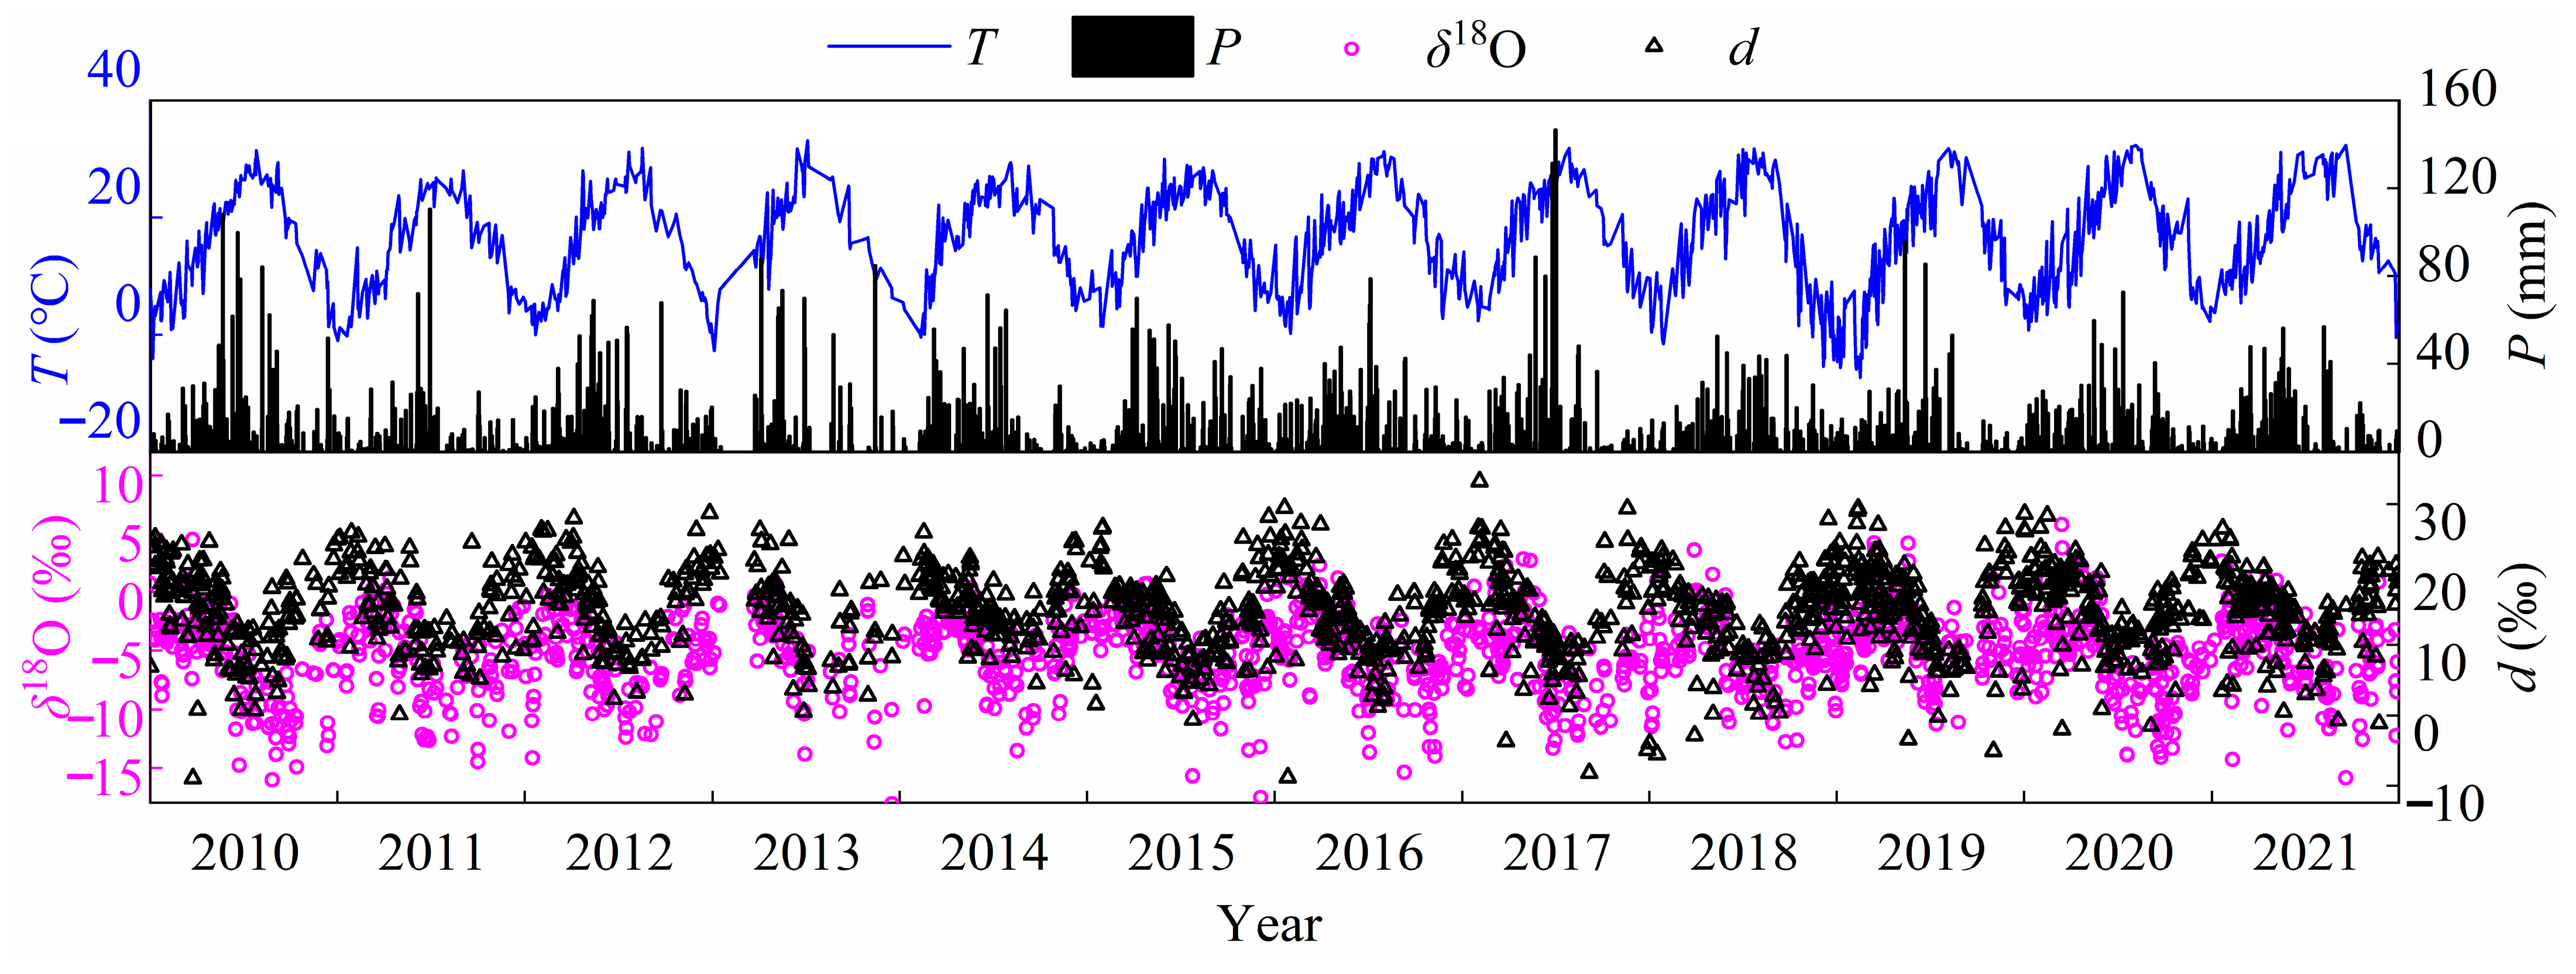
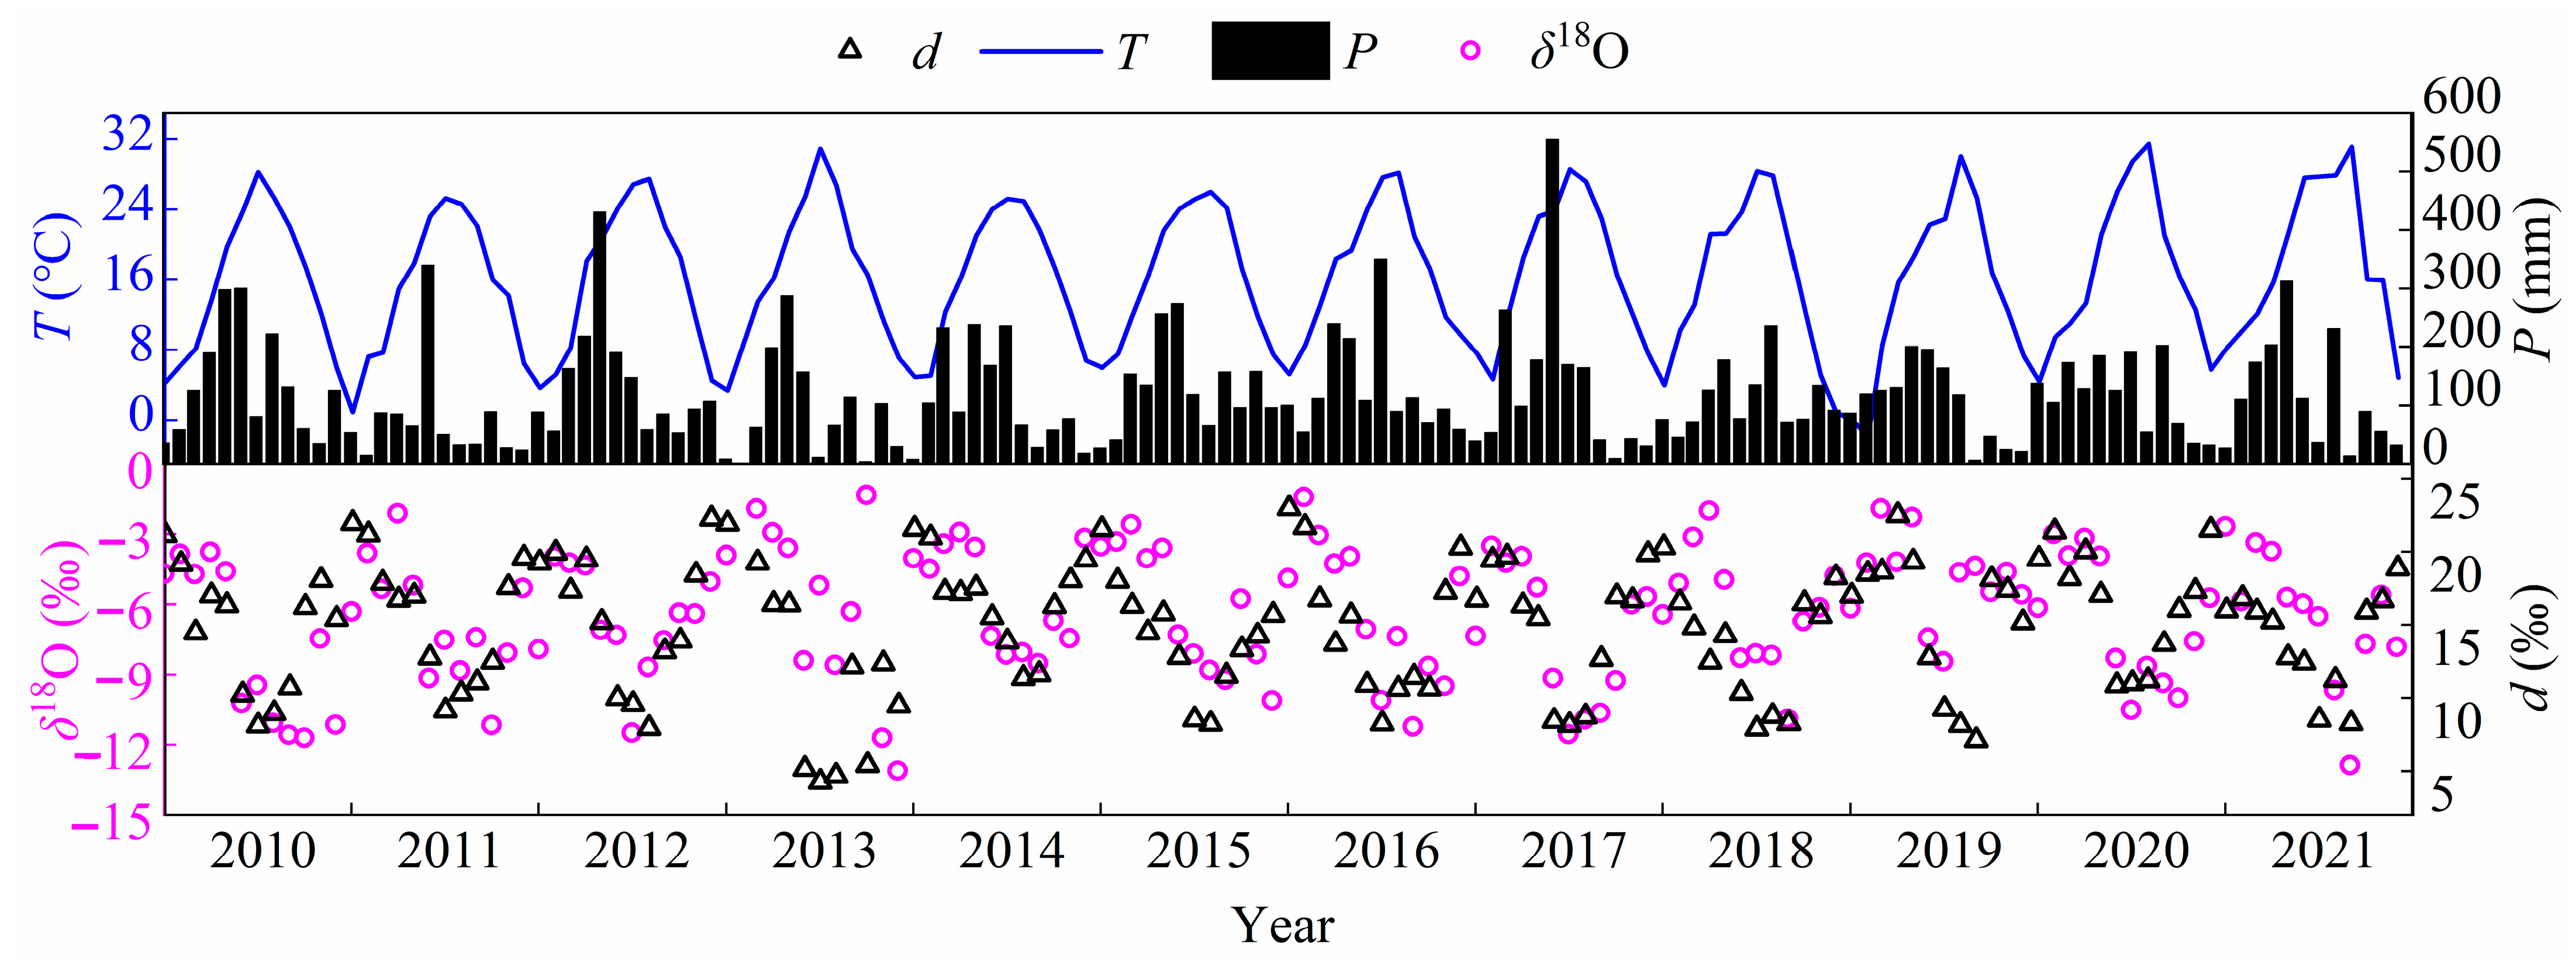
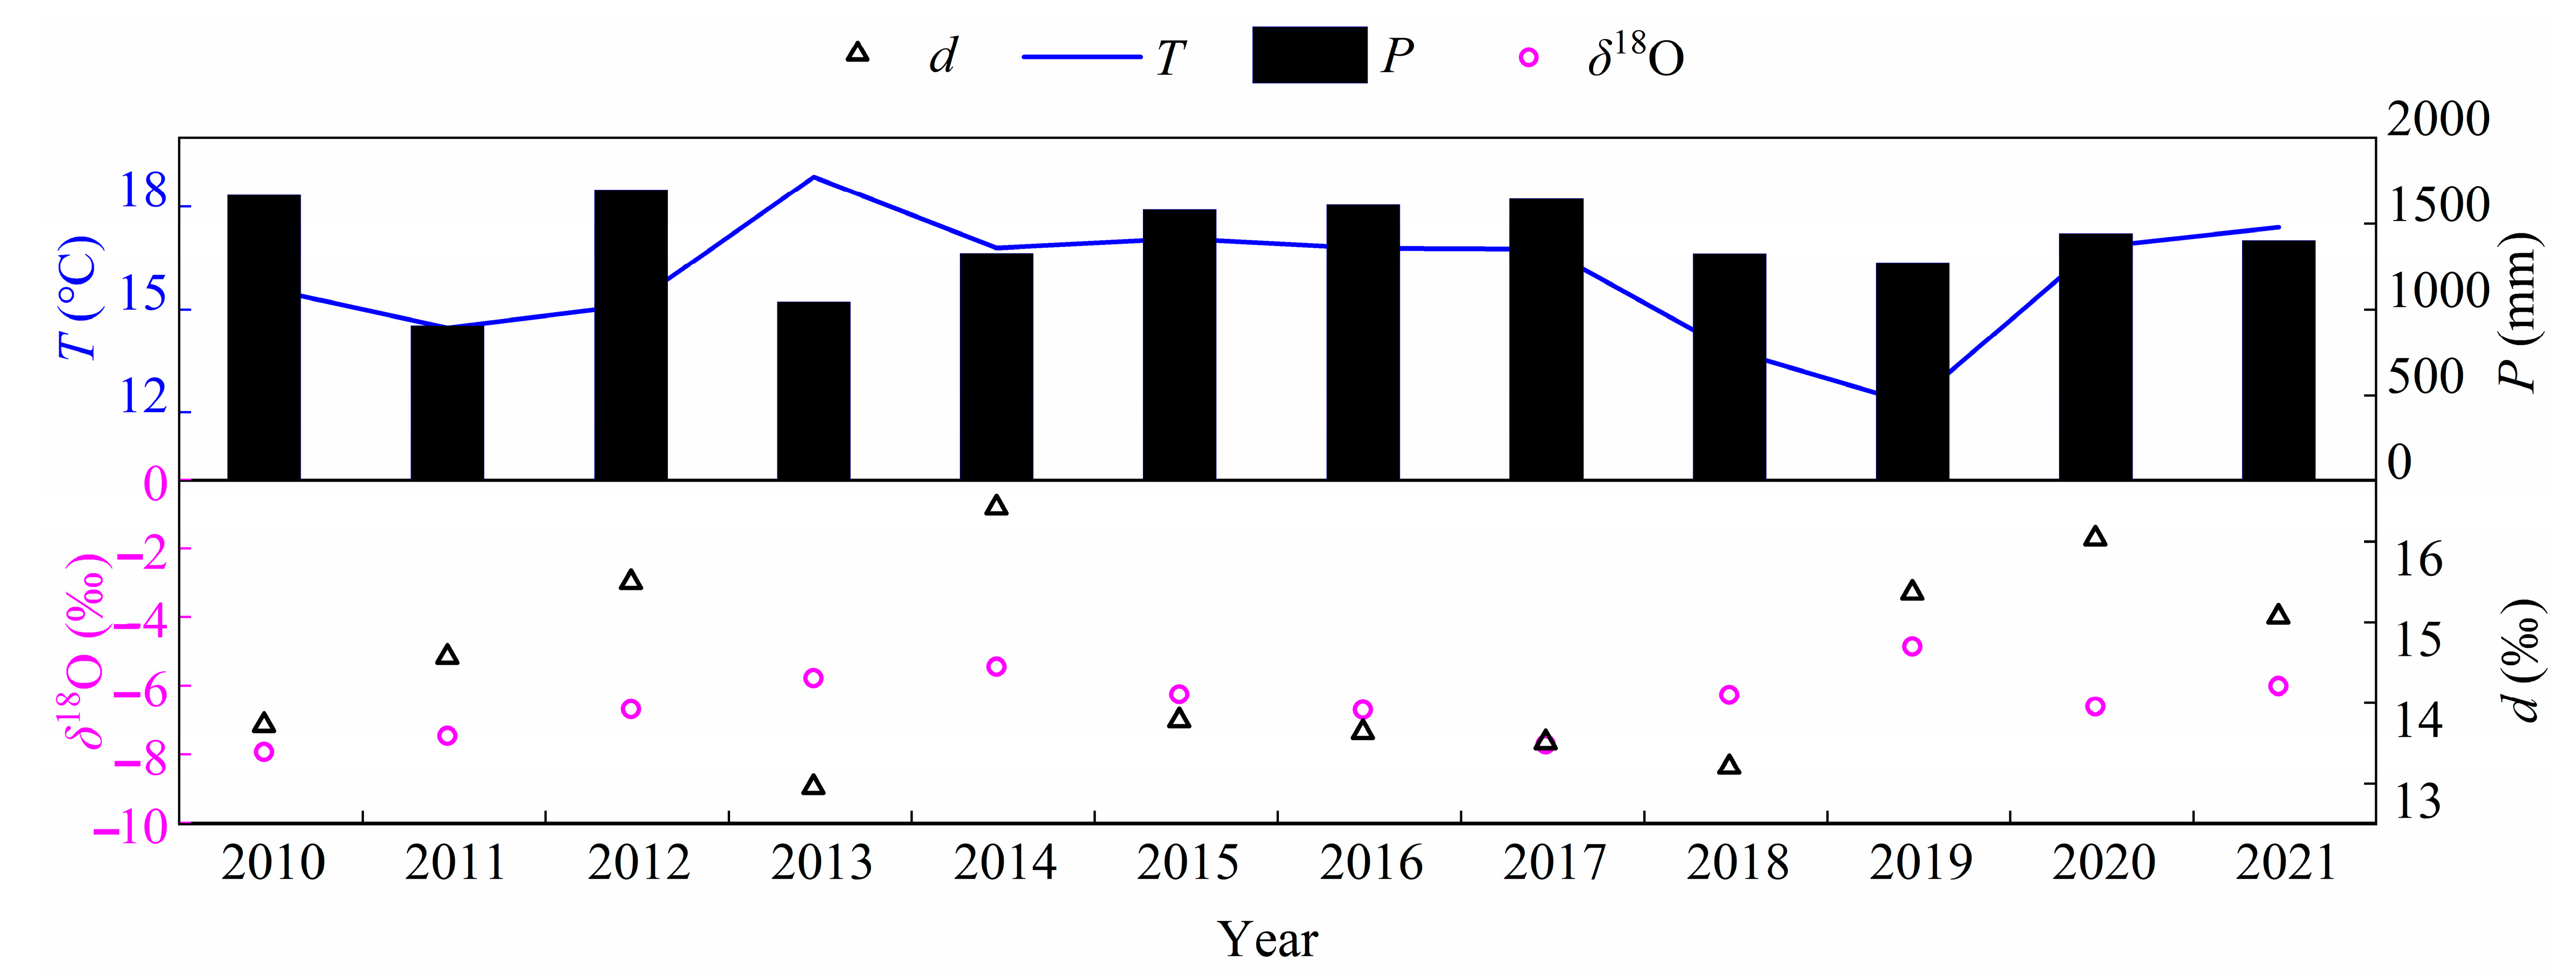
3.1. Temporal Variation in Stable Isotopes in Precipitation

The daily variations in δ18Op, deuterium excess (d) (d = δ2H-8δ18O), daily precipitation (P) and mean temperature (T) in Changsha during the study period are shown in Figure 2. According to Figure 2, a unimodal pattern is shown by T variation, ranging from −7.3 to 33.1 °C. The long-term mean T is 15.8 °C, of which 22.3 °C is for the warm half of the year and 9 °C is for the cold half of the year. The variation in daily precipitation also shows a clear unimodal pattern, reaching its peak in a similar period of T. On the daily time scale, the long-term daily mean P is 10.98 mm, of which 14.41 mm is in the warm half of the year and 7.34 mm is in the cold half of the year. The δ18Op ranges from −18.1‰ to 5.8‰, and the long-term precipitation-weighted mean δ18Op is −6.5‰. It is not consistent with the seasonality of T and P. The long-term precipitation-weighted mean δ18Op in the cold half of the year (−5.7‰) is significantly higher than that in the warm half of the year (−7.0‰). The d ranges from −8.9‰ to 33.3‰, with a long-term precipitation-weighted mean value of 14.5‰. Similarly to the seasonal cycle of δ18Op, the mean d during the cold half of the year (14.5‰) is close to that during the warm half of the year (14.4‰).
The temporal variations in monthly δ18O, d, P and T are shown in Figure 3. the monthly T varies from −1.9 to 31.5 °C. In a year, the maximum monthly T usually occurs in August, and the minimum is in February. The long-term monthly mean P is 118.28 mm, of which 158.56 mm is in the warm half of the year and 77.43 mm is in the cold half of the year. The maximum monthly precipitation usually occurs in June and the minimum occurs in January. The monthly δ18Op ranges from −13.1‰ to −1.3‰. The highest monthly δ18Op occurs in March and the lowest one occurs in December, which are not consistent with P and T. The long-term monthly mean d ranged from 4.3‰ to 23.0‰ (Jan). The largest and the smallest monthly d appeared in January and August, respectively, which are consistent with T.
On the annual time scale (Figure 4), the mean annual T ranges from 12.3 to 18.9 °C. The maximum mean annual T of 18.9 °C appears in 2013, and the minimum of 12.3 °C appears in 2019. The difference between them is 6.6 °C. The mean annual P ranges from 907 to 1699 mm, with a long-term mean of 1412 mm. The average precipitation in the warm half of the year is 954 mm and that in the cold half of the year is 458 mm. The maximum annual precipitation of 1699 mm occurs in 2012 and the minimum of 907 mm occurs in 2011. The annual δ18Op ranges from −7.9‰ to −4.9‰, in which the highest δ18O occurs in 2019 and the lowest one occurs in 2010 with a difference of 3.1‰ between the two years. The interannual variation in d is consistent with that of δ18O, ranging from 13.0‰ to 16.4‰. The largest annual average d occurs in 2014 and the smallest one occurs in 2013 with a difference of 3.5‰ between the two years. It can be seen that the years with extreme δ18Op do not correspond to those with extreme temperature and precipitation.
Although stable isotopes in precipitation or temperature have the same weighted mean or mean value on daily, monthly and annual time scales, there are significant differences in their dispersion levels. For example, the standard deviations of the weighted mean δ18O are 3.4‰, 2.7‰ and 0.9‰ on the three time scales; 5.9‰, 4.4‰ and 1.1‰ for the weighted mean d; and 8.7 °C, 8.2 °C and 1.7 °C for the mean temperature, respectively. This indicates that the variation range of each element varies on different time scales. Since the precipitation is cumulative, the average precipitation amounts on the three time scales are 11mm (mean daily), 118mm (mean monthly) and 1412mm (mean annual), respectively, and their standard deviations are 15.37mm, 89.83mm and 240.74mm, respectively.

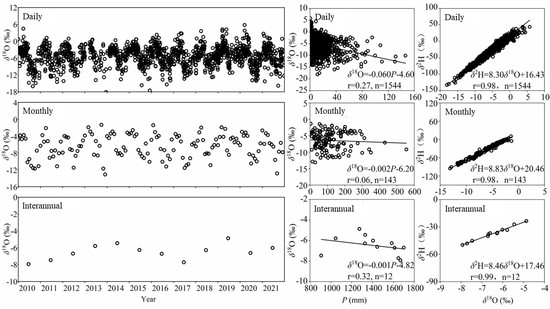
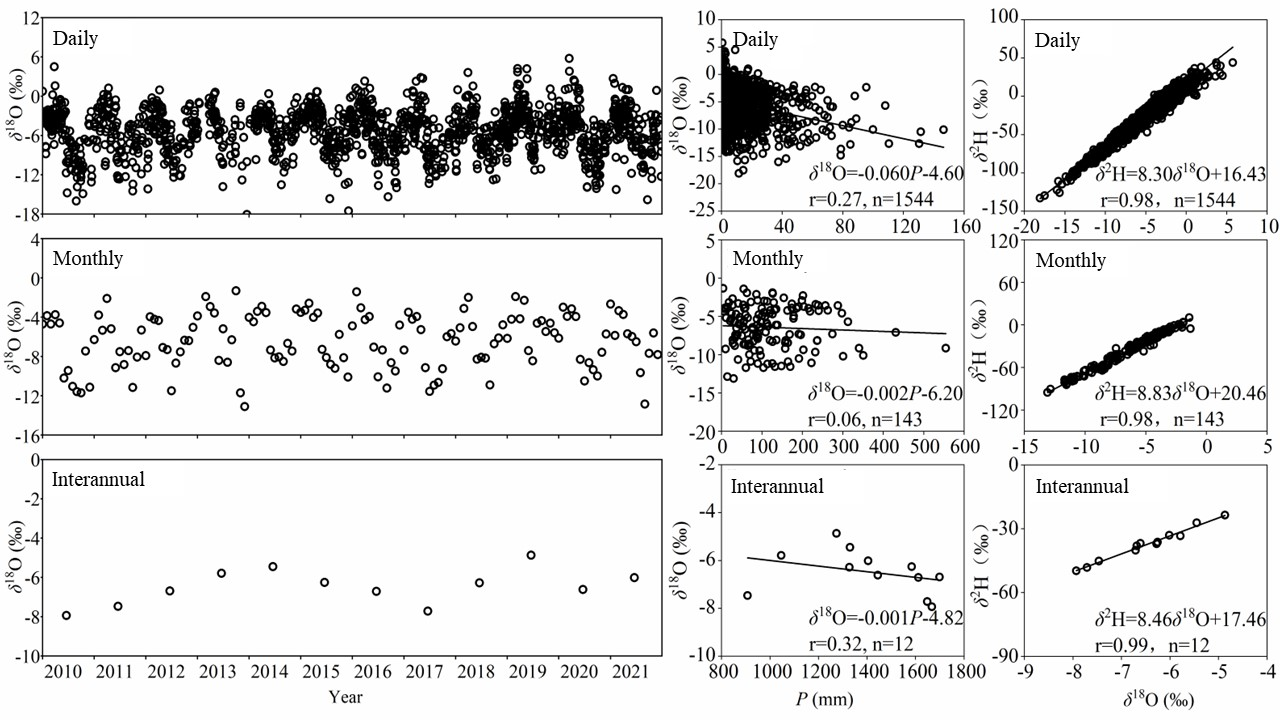
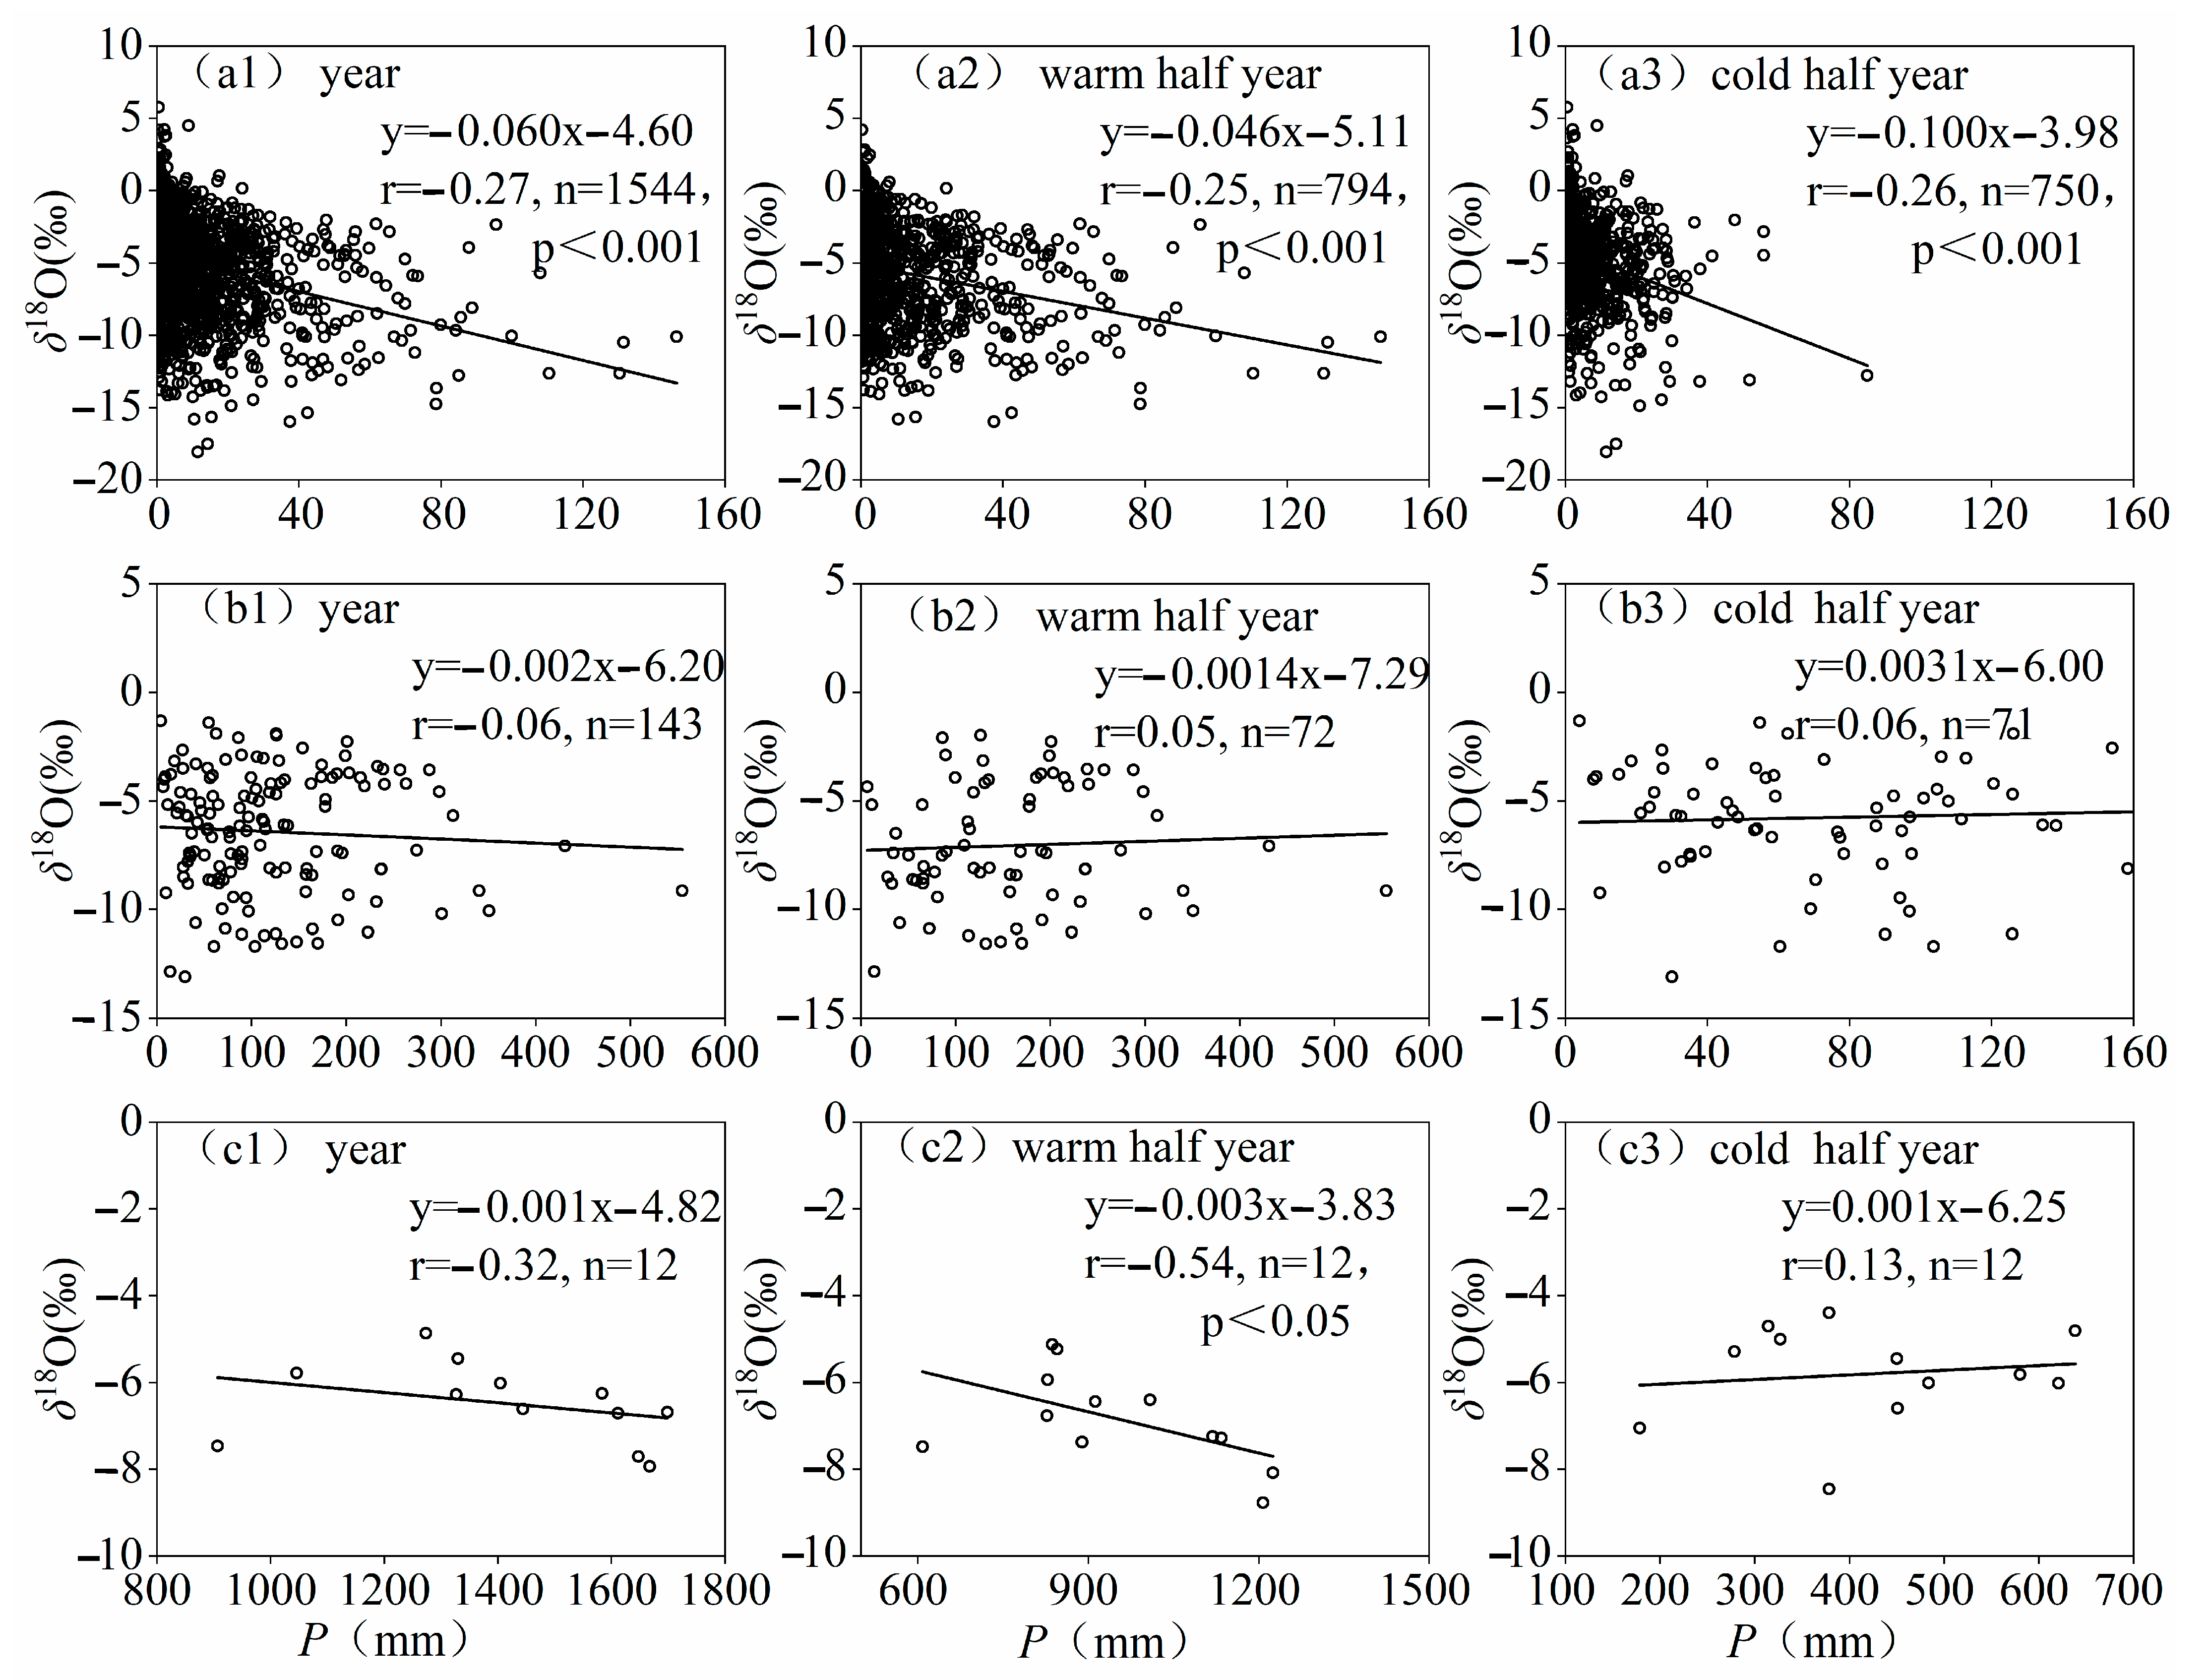
3.2. Relationship between δ18Op and Precipitation Amount

In paleoclimate and hydrometeorological studies, stable isotope compositions in precipitation are often considered as proxies for humidity or monsoon intensity [12,13], especially in low-latitude marine and monsoon regions. Usually, the intensity of the amount effect is mainly dependent on the slope of the δ18Op-P linear regression. It represents the rainout level of δ18Op during the phase change [7].
To reveal the seasonal differences in amount effect and the variation in amount effect with precipitation intensity in the study area, scatter plots of δ18Op versus P on three different time scales (daily, monthly and annual) and in three different periods (annual, warm half of the year and cold half of the year) are shown in Figure 5. By calculating the δ18Op-P correlations for daily precipitation of ≥5.0 mm, 10.0 mm and 25.0 mm, Table 1 is obtained. In order to make the statistical results more reasonable, the sample size in each group should be more than 12.
On the daily time scale (Figure 5a), a significant negative correlation between δ18Op and daily P is observed for all three time periods. All correlation coefficients reach the significance level of 0.001, indicating that the amount effect exists in the study area. In comparison, the slope of −0.10‰/mm and the intercept of −3.92‰ for δ18O-P in the cold half of the year are larger than those in the warm half of the year (−0.046‰/mm and −5.04‰), indicating that the rainout level is relatively higher in the cold half of the year than in the warm half of the year.
In addition to seasonal differences, the amount effect also varies with precipitation intensity. As can be seen from Table 1, when the daily precipitation intensity increases from >0.0 mm to ≥5.0 mm, the δ18O-P slope decreases significantly and the intercept increases significantly for all three time periods. With the increase in daily precipitation intensity, both the δ18O-P slope and the intercept do not change much. This result suggests that small precipitation events below 5.0 mm/d can change the rainout level of precipitation isotopes. It has been pointed out that the evaporative enrichment of stable isotope composition in raindrops occurs mainly during small precipitation events [16]. The result of evaporative enrichment of stable isotopes in raindrops causes an upward shift of the left end of the δ18O-P regression line, which leads to an increase in the slope of the regression line and a decrease in the intercept.
On the monthly time scale (Figure 5b), there is no significant negative correlation between monthly δ18Op and monthly P for all three time periods. However, according to Table 1, a negative correlation between the monthly weighted average δ18O and monthly P exists to some extent only during the annual period and only when monthly precipitation is greater than or equal to 200 mm, with the correlation coefficients reaching the 0.1 significance level. In the study area, monthly precipitation exceeding 200 mm occurs mainly during the rainy season in the warm half of the year. Therefore, it can be concluded that there is a significant amount effect during the rainy season in the warm half of the year in the study area. The slope of δ18O-P on the monthly time scale is significantly smaller than that on the daily time scale.
On the annual time scale (Figure 5c), there is a very weak negative correlation between the annual δ18Op and annual P. During the warm half of the year, the negative correlation between δ18Op and P reaches a confidence level of 0.05. In the cold half of the year, there is an insignificant positive correlation between the annual δ18Op and the annual P.

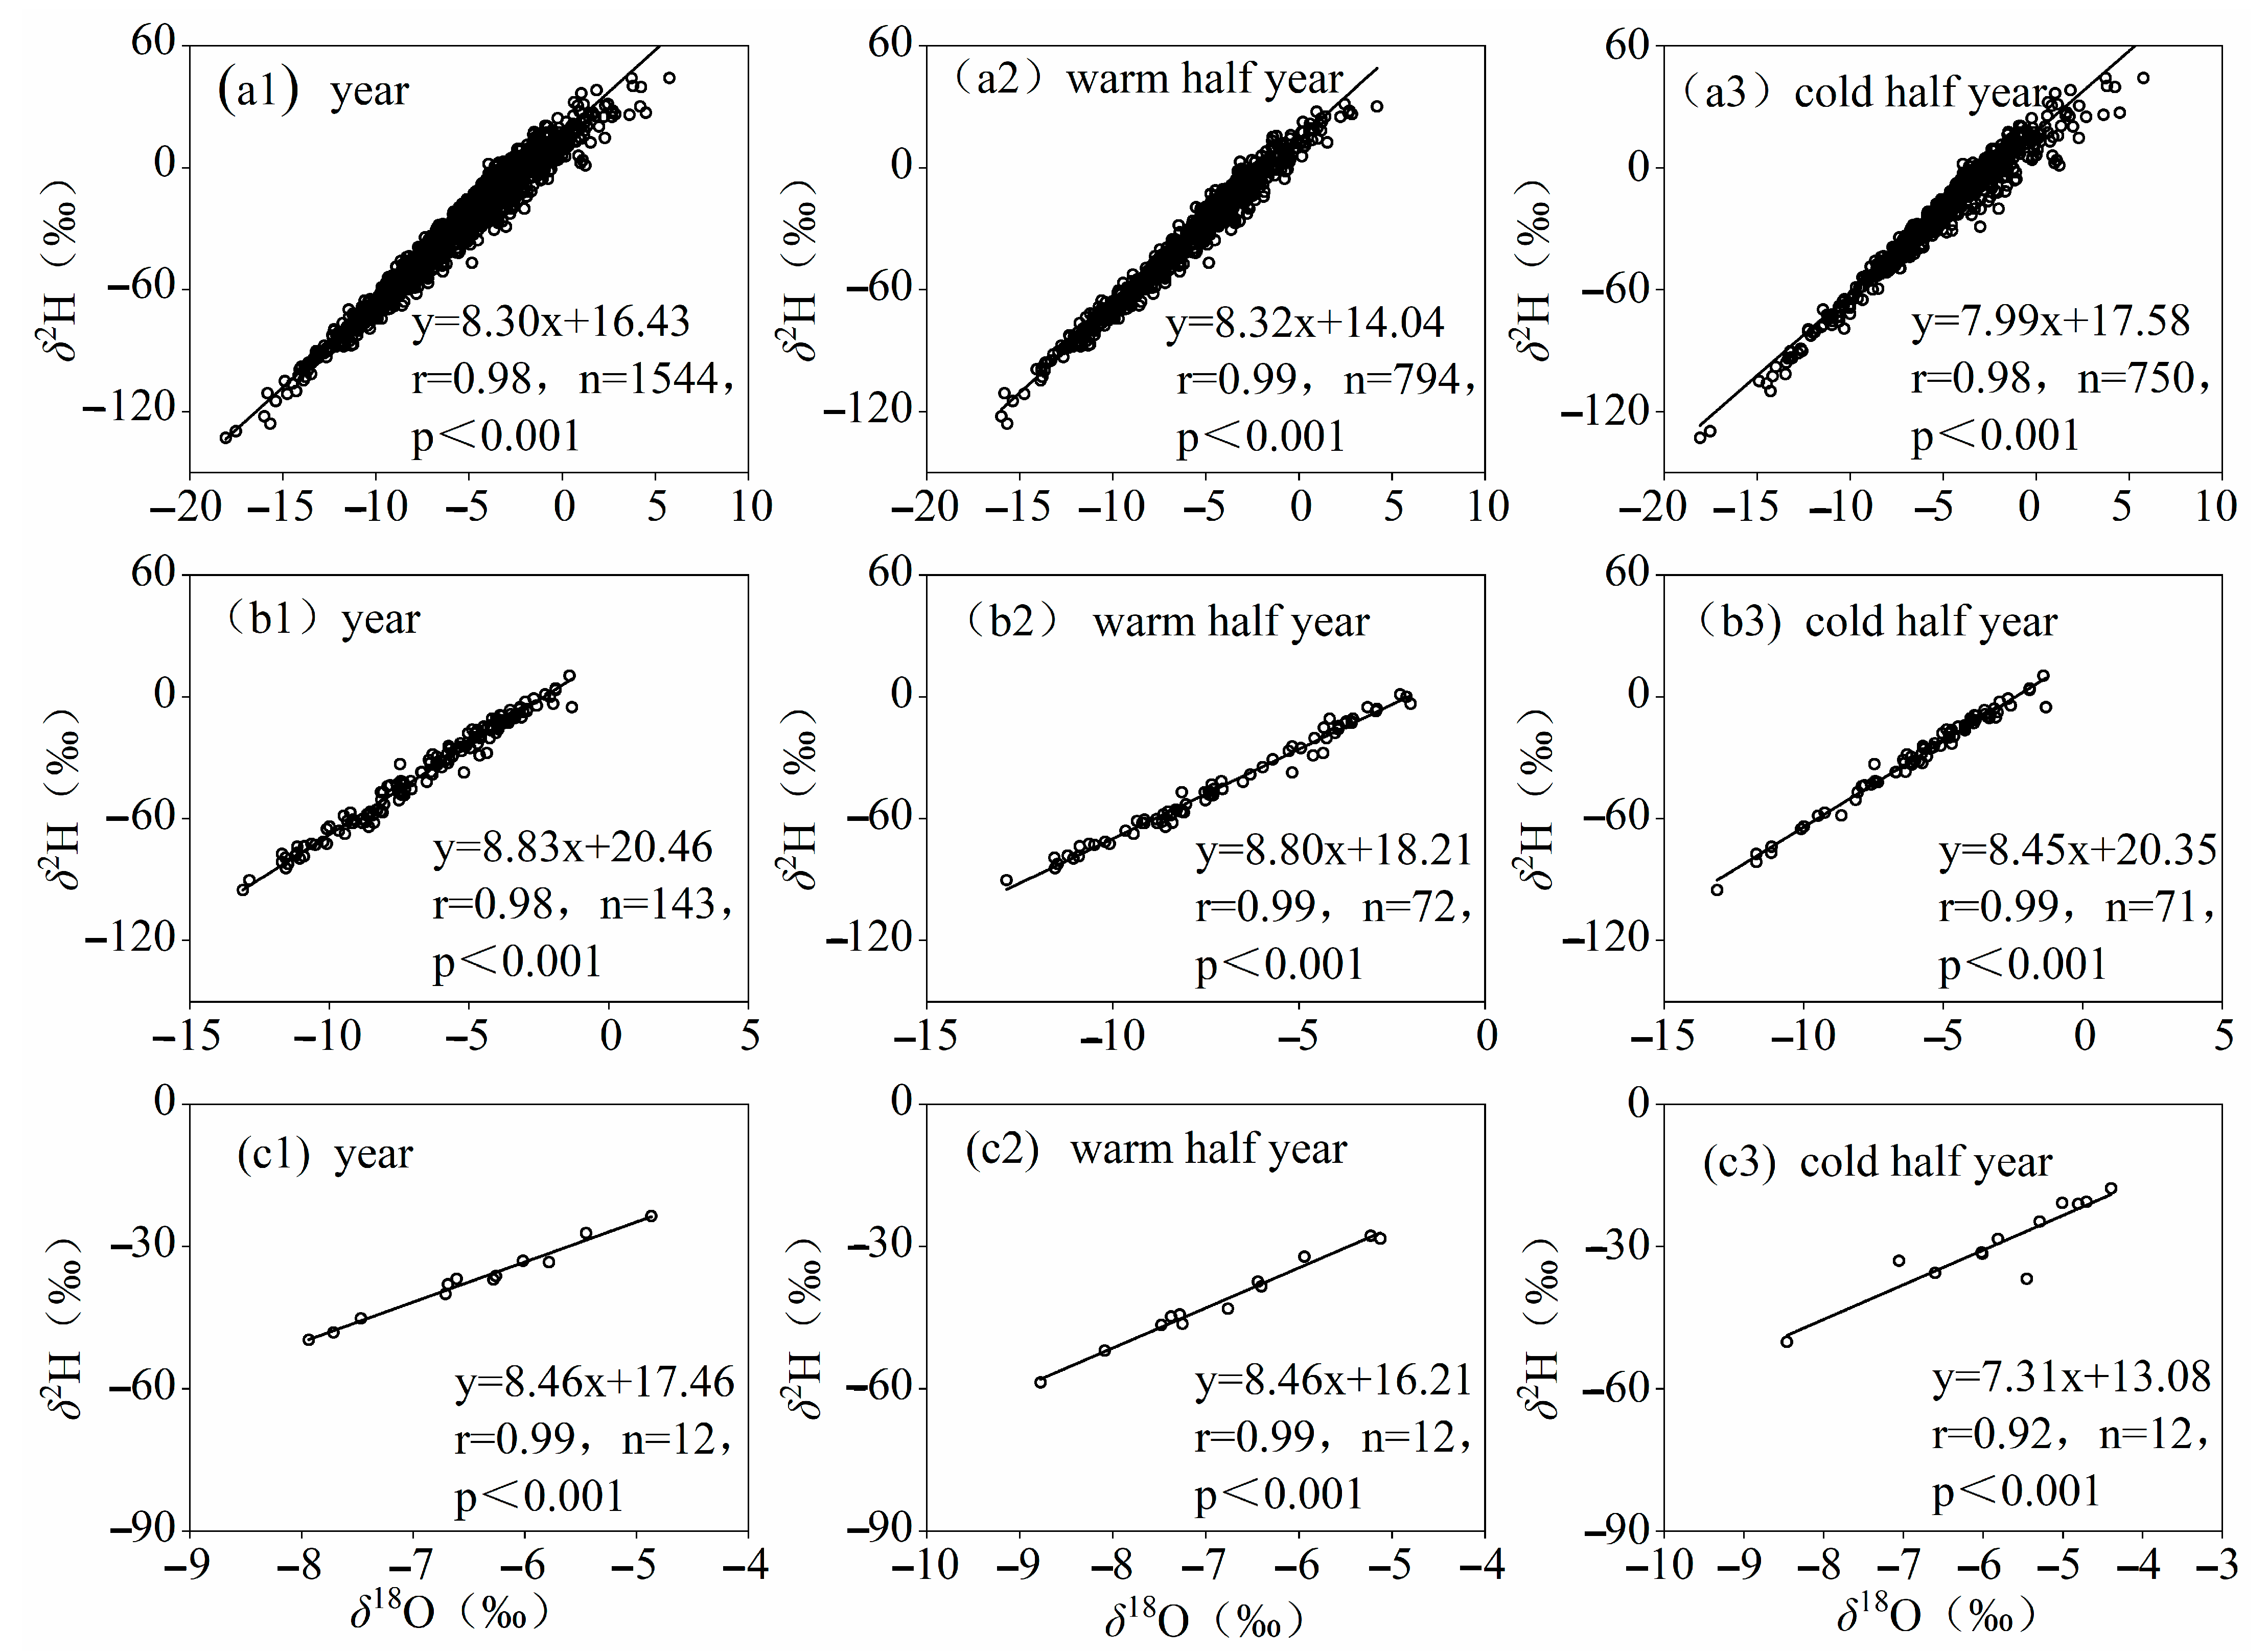
3.3. Comparison of Meteoric Water Lines

The regression equation between δ2H and δ18O in atmospheric precipitation is called the meteoric water line (MWL), which is divided into the global meteoric water line GMWL and the local meteoric water line LMWL [17]. The difference between them both is mainly reflected in the difference in spatial scales. We take the GMWL as the average. Then, are there also significant differences in meteoric water lines on different time scales and under different precipitation intensities?
In order to answer the above question, Figure 6 shows the scatters between δ2H and δ18O in precipitation on three different time scales (daily, monthly and annual) and in three different periods (annual, warm half of the year and cold half of the year) in the study area. In addition, the variations in local meteoric water lines (LMWLs) with precipitation intensities on daily and monthly time scales are shown in Table 2.
On the daily time scale (Figure 6a), the slope of the LMWL in the cold half of the year (7.99) is significantly smaller than that in the warm half of the year (8.32), but its intercept (17.58) is larger than that in the warm half of the year (14.04), indicating that the vapor source of generating precipitation varies with seasons [27,28]. The slope and intercept of the LMWL in the annual period intermediate between the two halves of the year. Usually, the slope of the LMWL is proportional to the intercept [9], but in the monsoon region, the δ18Op and δ2Hp in the cold half of the year are higher than those in the warm half of the year, which leads to the scatters in the cold half of the year being in the upper right of the δ2H-δ18O diagram compared with those in the warm half of the year, resulting in a larger intercept of the LMWL in the cold half of the year than in the warm half of the year.
Different precipitation intensities have different condensation conditions in the cloud and different environmental conditions under the cloud, and thus directly affect the fractionation effect of 2H and 18O, and change the LMWL. As can be seen from Table 2, the slope and intercept of the LMWL increase significantly with the increase in precipitation intensity from ≥0.0 mm to ≥5.0mm in the three periods. After that, both the slope and the intercept of the LMWL remain almost unchangeable with the increase in daily precipitation intensity. This result suggests that small precipitation events below 5.0 mm/d can significantly change local meteoric water lines. It has been demonstrated [16] that the evaporation enrichment of stable isotopes in falling raindrops during small precipitation events will lead to a decrease in the slope and intercept of the LMWL.
On the monthly time scale (Figure 6b), the slope of the LMWL in the cold half of the year (8.45, with a standard error of 0.14) is smaller than that in the warm half of the year (8.80, with a standard error of 0.14), but its intercept (20.35) is obviously larger than that in the warm half of the year (18.21), also reflecting the seasonal differences in vapor sources that generate precipitation. Compared with the LMWL on the daily time scale, the slope and intercept of the LMWL on the monthly time scale for all three time periods are significantly larger, and increase with monthly precipitation intensity, especially with regard to the low precipitation intensity. This is related to the seasonal variation characteristics of stable isotopes in precipitation, and also to the application of the precipitation-weighted mean algorithm. In the East Asian monsoon region, strong precipitation usually corresponds to low isotopic values [28,29,30,31,32]. Owing to the applied precipitation-weighted mean algorithm, the precipitation samples at the upper right end of the δ2H-δ18O scatter plot will shift to the left relative to the lower left end, and this will result in an increase in the slope and intercepts of the LMWL on monthly time scales.
On the annual time scale (Figure 6c), the slope and intercept of the LMWL in the cold half of the year are smaller than those in the warm half of the year and annual periods. Since the annual statistics have eliminated the continuous seasonal variation and only 12 samples are available for each data set, their reasonableness needs to be tested.

4. Conclusions

Based on the measured stable isotopes in precipitation and the corresponding daily precipitation at Changsha station from 1 January 2010 to 31 December 2021, the temporal variations in stable isotopes in precipitation, amount effect and LMWLs were analyzed and compared on daily, monthly and annual time scales, as well as under different precipitation intensities. The principal results are as follows:
(1) The daily variation in δ18Op ranges from −18.1‰ to 5.8‰ in Changsha, the monthly δ18Op ranges from −13.1‰ to −1.3‰ and the annual range of δ18Op ranges from −7.9‰ to −4.9‰. Overall, the long-term precipitation-weighted mean δ18Op in the cold half of the year (−5.7‰, with a standard error of 3.4) is significantly higher than that in the warm half of the year (−7.0‰, with a standard error of 3.4).
(2) On the daily time scale, a significant negative correlation between δ18Op and daily P is observed for all three time periods, indicating the amount effect that exists in the study area. In comparison, the rainout level is relatively higher in the cold half of the year than in the warm half of the year, and the amount effect also varies with precipitation intensity. This result suggests that small precipitation events below 5.0 mm/d can change the rainout level of precipitation isotopes. There is an insignificant correlation between δ18Op and P on both monthly and annual time scales.
(3) There are significant differences in the LMWL corresponding to different time scales, different seasons and different precipitation intensities. On the daily and monthly time scales, the slope and intercept of the LMWL in the cold half of the year are smaller than those of the LMWL in the warm half of the year and in the annual period. However, the slope and intercept of the LMWL remain almost unchangeable with the increasing precipitation intensity afterward. On the annual time scale, the slope and intercept of the LMWL in the cold half of the year are smaller than those in the warm half of the year.

Author Contributions

Conceptualization, Z.X., X.Z., X.X. and X.C.; methodology, Z.X., X.Z., X.H. and X.C.; software, X.H.; validation, Z.X. and X.Z.; formal analysis, Z.X., X.Z., X.X. and X.C.; investigation, Z.X., X.Z., X.X. and X.C.; resources, X.Z.; data curation, X.Z.; writing—original draft preparation, Z.X., X.Z., X.X. and X.C.; writing—review and editing, Z.X., X.Z., X.X., C.Z. and X.C.; visualization, Z.X. and X.Z.; supervision, X.Z., X.X., X.H. and C.Z.; project administration, X.Z. and X.X.; funding acquisition, X.Z. and X.X. All authors have read and agreed to the published version of the manuscript.

Funding

This research was funded by the National Natural Science Foundation of China (Grant number 42101130).

Data Availability Statement

The data that support the findings of this study are available from the corresponding author upon reasonable request.

Conflicts of Interest

The authors declare that they have no known competing financial interests or personal relationships that could have appeared to influence the work reported in this paper.

References

  1. Wu, H.; Li, X.Y.; Zhang, J.; Li, J.; Liu, J.; Tian, L.; Fu, C. Stable isotopes of atmospheric water vapour and precipitation in the northeast Qinghai-Tibetan Plateau. Hydrol. Process. 2019, 33, 2997–3009. [Google Scholar] [CrossRef]
  2. Wu, H.; Huang, Q.; Fu, C.; Song, F.; Liu, J.; Li, J. Stable isotope signatures of river and lake water from Poyang Lake, China: Implications for river–lake interactions. J. Hydrol. 2021, 592, 125619. [Google Scholar] [CrossRef]
  3. Zhang, X.P.; Liu, J.M.; Wang, X.Y.; Nakawo, M.; Xie, Z.C.; Zhang, J.M.; Zhang, X.Z. Climatological significance of stable isotopes in precipitation over south-west China. Int. J. Climatol. 2010, 30, 2229–2239. [Google Scholar] [CrossRef]
  4. Laonamsai, J.; Ichiyanagi, K.; Kamdee, K.; Putthividhya, A.; Tanoue, M. Spatial and temporal distributions of stable isotopes in precipitation over Thailand. Hydrol. Process. 2021, 35, e13995. [Google Scholar] [CrossRef]
  5. Mosley-Thompson, E.; Thompson, L.G.; Grootes, P.M.; Gundestrup, N. Little ice age (neoglacial) paleoenvironmental conditions at siple station, Antarctica. Ann. Glaciol. 1990, 14, 199–204. [Google Scholar] [CrossRef] [Green Version]
  6. Tan, M. Circulation effect: Response of precipitation δ18O to the ENSO cycle in monsoon regions of China. Clim. Dyn. 2014, 42, 1067–1077. [Google Scholar] [CrossRef]
  7. Dansgaard, W. Stable isotopes in precipitation. Tellus 1964, 16, 436–468. [Google Scholar] [CrossRef]
  8. Tian, L.D.; Yao, T.D.; Schuster, P.F.; White, J.W.C.; Ichiyanagi, K.; Pendall, E.; Pu, J.; Yu, W. Oxygen-18 concentrations in recent precipitation and ice cores on the Tibetan Plateau. J. Geophys. Res. Atmos. 2003, 108. [Google Scholar] [CrossRef]
  9. Yao, T.; Masson-Delmotte, V.; Gao, J.; Yu, W.; Yang, X.; Risi, C.; Sturm, C.; Werner, M.; Zhao, H.; He, Y.; et al. A review of climatic controls on δ18O in precipitation over the Tibetan Plateau: Observations and simulations. Rev. Geophys. 2013, 51, 525–548. [Google Scholar] [CrossRef]
  10. Kong, Y.; Wang, K.; Li, J.; Pang, Z. Stable isotopes of precipitation in China: A consideration of moisture sources. Water 2019, 11, 1239. [Google Scholar] [CrossRef]
  11. Moore, M.; Kuang, Z.; Blossey, P.N. A moisture budget perspective of the amount effect. Geophys. Res. Lett. 2014, 41, 1329–1335. [Google Scholar] [CrossRef] [Green Version]
  12. Fritz, P.; Ch, F.J. Isotopes in cloud physics: Multiphase and multistage condensation process. In Handbook of Environmental Isotope Geochemistry. Volume 2, the Terrestrial Environment; Elsevier: New York, NY, USA, 1986; pp. 71–73. [Google Scholar]
  13. Araguás-Araguás, L.; Froehlich, K.; Rozanski, K. Stable isotope composition of precipitation over southeast Asia. J. Geophys. Res. Atmos. 1998, 103, 28721–28742. [Google Scholar] [CrossRef]
  14. Risi, C.; Bony, S.; Vimeux, F.; Chong, M.; Descroix, L. Evolution of the stable water isotopic composition of the rain sampled along Sahelian squall lines. Q. J. R. Meteorol. Soc. 2010, 136, 227–242. [Google Scholar] [CrossRef]
  15. Liu, Z.; Tian, L.; Yao, T.; Yu, W. Seasonal deuterium excess in Nagqu precipitation: Influence of moisture transport and recycling in the middle of Tibetan Plateau. Environ. Geol. 2008, 55, 1501–1506. [Google Scholar] [CrossRef]
  16. Chen, F.; Chen, J.; Wang, S.; Wu, X.; Zhang, Q.; Gao, M.; Kang, X.; Pu, Z.; Zhang, D. Below-cloud evaporation effect on stable water isotopes in precipitation at the eastern margin of Qinghai-Tibet Plateau. Hydrol. Process. 2022, 36, e14699. [Google Scholar] [CrossRef]
  17. Craig, H. Isotopic variations in meteoric waters. Science 1961, 133, 1702–1703. [Google Scholar] [CrossRef]
  18. Wang, S.; Zhang, M.; Hughes, C.E.; Crawford, J.; Wang, G.; Chen, F.; Du, M.; Qiu, X. Meteoric water lines in arid Central Asia using event-based and monthly data. J. Hydrol. 2018, 562, 435–445. [Google Scholar] [CrossRef]
  19. Zhang, X.P.; Liu, J.M.; Nakawo, M.; Xie, Z.C. Vapor origins revealed by deuterium excess in precipitation in southwest China. J. Glaciol. Geocryol. 2009, 31, 613–619. [Google Scholar]
  20. Zhang, X.P.; Yang, Z.L.; Niu, G.Y.; Wang, X.Y. Stable water isotope simulation in different reservoirs of Manaus, Brazil, by Community Land Model incorporating stable isotopic effect. Int. J. Climatol. A J. R. Meteorol. Soc. 2009, 29, 619–628. [Google Scholar] [CrossRef]
  21. Cai, Z.; Tian, L. Atmospheric controls on seasonal and interannual variations in the precipitation isotope in the East Asian monsoon region. J. Clim. 2016, 29, 1339–1352. [Google Scholar] [CrossRef]
  22. Yu, W.; Wei, F.; Ma, Y.; Liu, W.; Zhang, Y.; Luo, L.; Tian, L.; Xu, B.; Qu, D. Stable isotope variations in precipitation over Deqin on the southeastern margin of the Tibetan Plateau during different seasons related to various meteorological factors and moisture sources. Atmos. Res. 2016, 170, 123–130. [Google Scholar] [CrossRef]
  23. Guo, X.; Gong, X.; Shi, J.; Guo, J.; Domínguez-Villar, D.; Lin, Y.; Wang, H.; Yuan, D. Temporal variations and evaporation control effect of the stable isotope composition of precipitation in the subtropical monsoon climate region, Southwest China. J. Hydrol. 2021, 599, 126278. [Google Scholar] [CrossRef]
  24. Liu, J.; Song, X.; Yuan, G.; Sun, X.; Yang, L. Stable isotopic compositions of precipitation in China. Tellus B Chem. Phys. Meteorol. 2014, 66, 22567. [Google Scholar] [CrossRef] [Green Version]
  25. Wu, J.; Ding, Y.; Ye, B.; Yang, Q.; Zhang, X.; Wang, J. Spatio-temporal variation of stable isotopes in precipitation in the Heihe River Basin, Northwestern China. Environ. Earth Sci. 2010, 61, 1123–1134. [Google Scholar] [CrossRef]
  26. Pang, H.; He, Y.; Lu, A.; Zhao, J.; Ning, B.; Yuan, L.; Song, B. Synoptic-scale variation of δ18O in summer monsoon rainfall at Lijiang, China. Chin. Sci. Bull. 2006, 51, 2897–2904. [Google Scholar] [CrossRef]
  27. Wu, H.; Zhang, X.; Xiaoyan, L.; Li, G.; Huang, Y. Seasonal variations of deuterium and oxygen-18 isotopes and their response to moisture source for precipitation events in the subtropical monsoon region. Hydrol. Process. 2015, 29, 90–102. [Google Scholar] [CrossRef]
  28. Li, G.; Zhang, X.; Xu, Y.; Wang, Y.; Wu, H. Synoptic time-series surveys of precipitation δ18O and its relationship with moisture sources in Yunnan, southwest China. Quat. Int. 2017, 440, 40–51. [Google Scholar] [CrossRef]
  29. Zhou, H.; Zhang, X.; Yao, T.; Hua, M.; Wang, X.; Rao, Z.; He, X. Variation of δ18O in precipitation and its response to upstream atmospheric convection and rainout: A case study of Changsha station, south-central China. Sci. Total Environ. 2019, 659, 1199–1208. [Google Scholar] [CrossRef]
  30. Benettin, P.; Volkmann, T.H.; von Freyberg, J.; Frentress, J.; Penna, D.; Dawson, T.E.; Kirchner, J.W. Effects of climatic seasonality on the isotopic composition of evaporating soil waters. Hydrol. Earth Syst. Sci. 2018, 22, 2881–2890. [Google Scholar] [CrossRef] [Green Version]
  31. Tappa, D.J.; Kohn, M.J.; McNamara, J.P.; Benner, S.G.; Flores, A.N. Isotopic composition of precipitation in a topographically steep, seasonally snow-dominated watershed and implications of variations from the Global Meteoric Water Line. Hydrol. Process. 2016, 30, 4582–4592. [Google Scholar] [CrossRef]
  32. Fritz, M.; Wetterich, S.; McAlister, J.; Meyer, H. A new local meteoric water line for Inuvik (NT, Canada). Earth Syst. Sci. Data 2022, 14, 57–63. [Google Scholar] [CrossRef]
Figure 1. (a) Topographic map of China. (b) Topographic map of Hunan. (c) Locations of sampling sites and weather stations at Hunan Normal University.
Water 15 00438 g001
Figure 2. Temporal variation in daily temperature (T), precipitation (P), δ18Op and d-excess (d), from 1 January 2010 to 31 December 2021, at Changsha station.
Water 15 00438 g002
Figure 3. Temporal variations in monthly temperature (T), precipitation (P), δ18Op and d-excess (d) in Changsha.
Water 15 00438 g003
Figure 4. Temporal variations in annual temperature (T), precipitation (P), δ18Op and d-excess (d) in Changsha.
Water 15 00438 g004
Figure 5. Correlated scatters of δ18Op versus precipitation (P) in Changsha on daily (a1,a2,a3), monthly (b1,b2,b3) and annual (c1,c2,c3) time scales in three periods: entire year (a1,b1,c1), warm half of the year (a2,b2,c2) and cold half of the year (a3,b3,c3) (p > 0.05 is not marked in the figure).
Water 15 00438 g005
Figure 6. Variations in LMWLs on daily (a1,a2,a3), monthly (b1,b2,b3) and annual (c1,c2,c3) time scales in three periods: entire year (a1,b1,c1), warm half of the year (a2,b2,c2) and cold half of the year (a3,b3,c3) in Changsha.
Water 15 00438 g006
Table 1. Correlations of δ18O in precipitation versus precipitation under different precipitation intensities on daily and monthly time scales in Changsha.
Time ScaleTime Intervalp > 0.0 mm≥5.0 mm≥10.0 mm≥25.0 mm≥50.0 mm
DailyYear−0.0596/−4.60 −0.0419/−5.23 −0.0367/−5.46 −0.0379/−5.45 −0.0437/−4.85
−0.27 † −0.23 †−0.21 †−0.25 † −0.29 *
Warm half of the year−0.0462/−5.11 −0.0361/−5.55 −0.0307/−5.82 −0.0379/−5.44 −0.0416/−4.94
−0.25 †−0.23 †−0.20 †−0.26 ‡−0.29 *
Cold half of the year−0.0961/−3.98 −0.0532/−4.82 −0.0545/−4.81 −0.0443/−5.30 −0.1580/1.520
−0.27 †−0.16 ‡−0.16 *−0.15−0.45
p > 0.0 mm≥50.0 mm≥100.0 mm≥150.0 mm≥200.0 mm
MonthlyYear−0.0019/−6.20 −0.0013/−6.29 −0.0042/−5.57 −0.0054/−5.20 −0.0116/−3.17
−0.06 −0.04 −0.12 −0.15 −0.34
Warm half of the year0.0014/−7.29 −0.0001/−6.93 −0.0022/−6.42 −0.0031/−6.14 −0.0106/−3.66
0.05 −0.00−0.07 −0.09 −0.32
Cold half of the year0.0031/−6.01 0.0115/−7.05 0.0137/−7.04 0.0076/−5.68
0.06 0.19 0.23 0.18
Note: The first row is the slope/intercept and the second row is the correlation coefficient; the symbols *, ‡ and † indicate the correlation coefficient exceeding the confidence levels of 0.05, 0.01 and 0.001, respectively.
Table 2. Variations in the local meteoric water lines (LMWLs) with precipitation intensities on daily and monthly time scales in Changsha (slope/intercept).
Time ScaleTime Intervalp > 0.0 mm≥5.0 mm≥10.0 mm≥25.0 mm≥50.0 mm
DailyYear8.30/16.438.59/18.818.64/18.568.71/18.928.69/18.35
Cold half of the year8.32/14.048.60/17.118.62/17.448.72/18.508.70/18.20
Warm half of the year7.99/17.588.37/19.928.47/20.238.59/20.348.71/20.47
p > 0.0 mm≥50.0 mm≥100.0 mm≥150.0 mm≥200.0 mm
MonthlyYear8.83/20.468.91/20.728.96/20.579.06/20.889.03/21.12
Cold half of the year8.81/18.218.96/19.528.91/19.469.06/20.708.99/20.75
Warm half of the year8.45/20.358.52/20.528.54/20.428.49/19.13
Disclaimer/Publisher’s Note: The statements, opinions and data contained in all publications are solely those of the individual author(s) and contributor(s) and not of MDPI and/or the editor(s). MDPI and/or the editor(s) disclaim responsibility for any injury to people or property resulting from any ideas, methods, instructions or products referred to in the content.

