Article

Influence of Livelihood Capital of Rural Reservoir Resettled Households on the Choice of Livelihood Strategies in China

1
School of Public Administration, Hohai University, Nanjing 210098, China
2
National Research Center for Resettlement, Hohai University, Nanjing 210098, China
*
Author to whom correspondence should be addressed.
Water 2022, 14(24), 4055; https://doi.org/10.3390/w14244055
Submission received: 13 October 2022 / Revised: 30 November 2022 / Accepted: 7 December 2022 / Published: 12 December 2022
(This article belongs to the Section Water Resources Management, Policy and Governance)

Abstract

:
The livelihood capital of resettled households is an important factor that affects their choice of livelihood strategies. The relationship between the two can help to transform the livelihood behavior of resettled households aiming to achieve sustainable livelihoods. Based on survey data of livelihoods of the Wuxikou Water Control Project, the logistic regression model was used to analyze the influence of livelihood capital on the choice of livelihood strategies. The results showed the following: (1) The five categories of livelihood capital values were generally not high. The value of human capital was the highest (0.480), while the value of natural capital was the lowest (0.362). (2) Natural and financial capital have significant effects on the choice of an agricultural-oriented livelihood strategy, in which natural capital has a positive effect and financial capital has a negative effect. Social and financial capital have a significant positive effect on the choice of a migrant-oriented livelihood strategy. Human and physical capital have significant positive effects on the choice of a part-time balanced livelihood strategy. (3) Decisive factors are used to promote transformation from agriculture-oriented to migrant-oriented, mostly comprising education level and interpersonal communication, among other indicators. The important factors used to promote transformation from agriculture-oriented to part-time balanced are mainly labor force quantity and total family income, among other indicators. Finally, on the basis of the above findings, context-specific policies are proposed from the observations of livelihood capital and livelihood strategies, such as upgrading the level of human capital by category, reconstructing the social capital network in multiple forms, and diversifying and broadening financial capital channels.

1. Introduction

The demand for energy has increased dramatically with the rapid growth of the global economy. Hydropower, as a renewable energy source, causes less pollution in the environment and will become an essential source of low-carbon power generation in response to climate pledges and the goal of decreasing greenhouse gas emissions in the power sector [1,2]. Hydroelectric energy requires the construction of dams, which can lead to massive reservoir resettlement. Reservoir resettlement is a kind of involuntary resettlement. After resettlement, the original lifestyle of resettlers has been destroyed, and as a consequence of poverty caused by forced migration, not only are their economic activities and income interrupted, and food, clothing, housing, and transportation not guaranteed, but also, necessary public services such as medical treatment and education may be lost, and they are marginalized by the social mainstream and can even become refugees [3]. The focus of involuntary resettlement policy prior to the 1980s was relief and compensation, which was exclusively focused on the living conditions of the displaced population, while ignoring the growth of production. Resettlers had a hard time supporting themselves, because their livelihoods were dependent on government assistance. After the reform and opening up, the “people-oriented” trend of thought has developed rapidly. A series of normative and legal system reforms have promoted resettlement activities from purely destructive to “recovery and development after trauma” in China. The goal is to reduce the poverty risk of affected resettled households, so that livelihoods can be restored and gradually improve, thereby achieving the goal of “moving out, being stable, and becoming rich” [4]. At present, driven by the demand for hydropower, 172 major water conservation and water supply projects are being implemented in China, more than half of which are water control projects. What is the current situation of the livelihood capital owned by reservoir resettled households? What is the current livelihood strategy? How does livelihood capital affect the different types of livelihood strategies? What are the key factors to promote the transformation of livelihood strategies? Based on these parameters, our aims were to explore the influencing factors of livelihood capital on the choice and transformation of livelihood strategies, therefore helping to realize the sustainable development of resettled households, and transfer experience to existing or upcoming projects in other regions, providing reference for government governance.
Based on the evaluation of livelihood capital, the choice of livelihood strategy, and the impact of livelihood capital on livelihood strategies, we reviewed the relevant literature. The research on livelihood capital primarily emphasizes the following aspects: (1) The construction and measurement of a livelihood capital evaluation index system. Research on a livelihood capital evaluation index system is well established. Most scholars principally depend on the sustainable livelihood framework theory established by the U.K. Department for International Development (DFID) to create a livelihood capital evaluation index system [5,6,7], which includes the index quantification and capital measurement livelihood capital [8,9,10]. (2) The empirical study of livelihood capital. Oladele and Ward used the SLA framework to select the corresponding indicator elements of livelihood capital, and by constructing a logistic regression model of livelihood capital and farmers’ life satisfaction, it was concluded that capital stocks in different regions are different [11]. Johnson empirically analyzed the main and moderating effects of risk expectations and livelihood capital on farmers’ homestead withdrawal intentions and their intergenerational differences [12]. The research showed that livelihood capital has a positive impact on farmers’ willingness to withdraw from homesteads and plays a moderating role in the relationship between risk expectations and willingness to withdraw from homesteads.
Livelihood strategies are the activities carried out by people to achieve their established livelihood objectives. Production choices and production activities belong to the category of livelihood strategies. Research on livelihood strategies is also relatively mature. Presently, there are many studies on the classification forms and influencing factors of livelihood strategies [6,13,14]. These research studies are, correspondingly, one of the significant bases to comprehend sustainable livelihood. There are various types of livelihood strategies, and there is no unified division standard at present. Some scholars have separated the types of strategies according to their local lifestyles, such as livestock breeding, agricultural planting, going out to work, and doing business [15]. According to the proportion of agricultural income within the total household income, some scholars have divided livelihood strategies into pure agriculture, part-time agriculture, and non-agriculture types [16]. There are also abundant studies on the impact of livelihood capital on livelihood strategies. Ding et al. believed that livelihood capital has a substantial impact on livelihood strategies and pointed out that through the development of livelihood capital, the variation in livelihood strategies can be improved, so as to expand the sustainable livelihood ability [17]. Meng et al. took the farmers and herdsmen in Ordos, China, as research subjects and analyzed the impact of their livelihood capital on their livelihood strategies [18]. It was found that natural capital such as pasture area and livestock quantity have a significant impact on the choice of livelihood strategies. Zinda and Zhang used a logistic regression model to analyze the relationship between farmers’ livelihood capital and livelihood strategies based on a sustainable livelihood analysis framework [19]. The research showed that farmers with a high human capital index tend to work in other places, and farmers with high physical capital and social capital indexes tend to work locally.
In summary, researchers have achieved rich results on livelihood capital and livelihood strategies, providing useful reference for this article. However, according to the literature review, most scholars have focused primarily on farmers, rarely focusing on reservoir resettled households as the research object in the context of involuntary resettlement. In addition, the literature on the relationship between livelihood capital and livelihood strategies lacks in-depth empirical research. Although some scholars have conducted research on the impact of livelihood capital on livelihood strategies, this research is not comprehensive and thorough. Such research has only analyzed the impact of livelihood capital on the choice of livelihood strategies, without further analyzing the key influencing factors of the transformation of livelihood strategies [20]. Thus, this paper intends to make up for this deficiency. Based on this, we used the survey data of 468 households in the case area. First, the entropy method was used to measure and evaluate the livelihood capital level of reservoir resettled households. Second, the logistic regression model was used to empirically analyze the impact of livelihood capital on the selection and transformation of livelihood strategies, so as to truly reflect the relationship between them in terms of resettled households in poor areas. Moreover, we put forward countermeasures and suggestions according to the research conclusions, which have important reference significance for the formulation of later support policies.

2. Analysis Framework

2.1. Sustainable Livelihood Theory

The Department for International Development (DFID) proposed a sustainable livelihood analysis framework [21], which consists of five parts: vulnerability background, livelihood capital, structure and system, livelihood strategy, and livelihood output. The sustainable livelihood of reservoir resettled households can be explained according to the framework as follows: reservoir resettled households combine their own capital in a fragile environment, realize one or more livelihood strategies under the influence of the structure and system, and finally achieve their livelihood goal. Vulnerability background indicates that human survival and development is impacted and disturbed through the external environment, including natural disasters, economic downturn, and political turmoil. Livelihood capital mainly refers to the natural, social, financial, physical, and human capital needed to maintain living or obtain development. Structure and system refer to the impact of the organizational structure, political system, policies, and measures on livelihood. Livelihood strategies involve the use of livelihood capital and the choice of lifestyle after livelihood capital combination. Livelihood strategies are always fluid, changing alongside internal and external circumstances. Livelihood output is also called livelihood outcome, including multiple outcomes such as increased income, a high level of welfare, good living conditions, and low vulnerability.

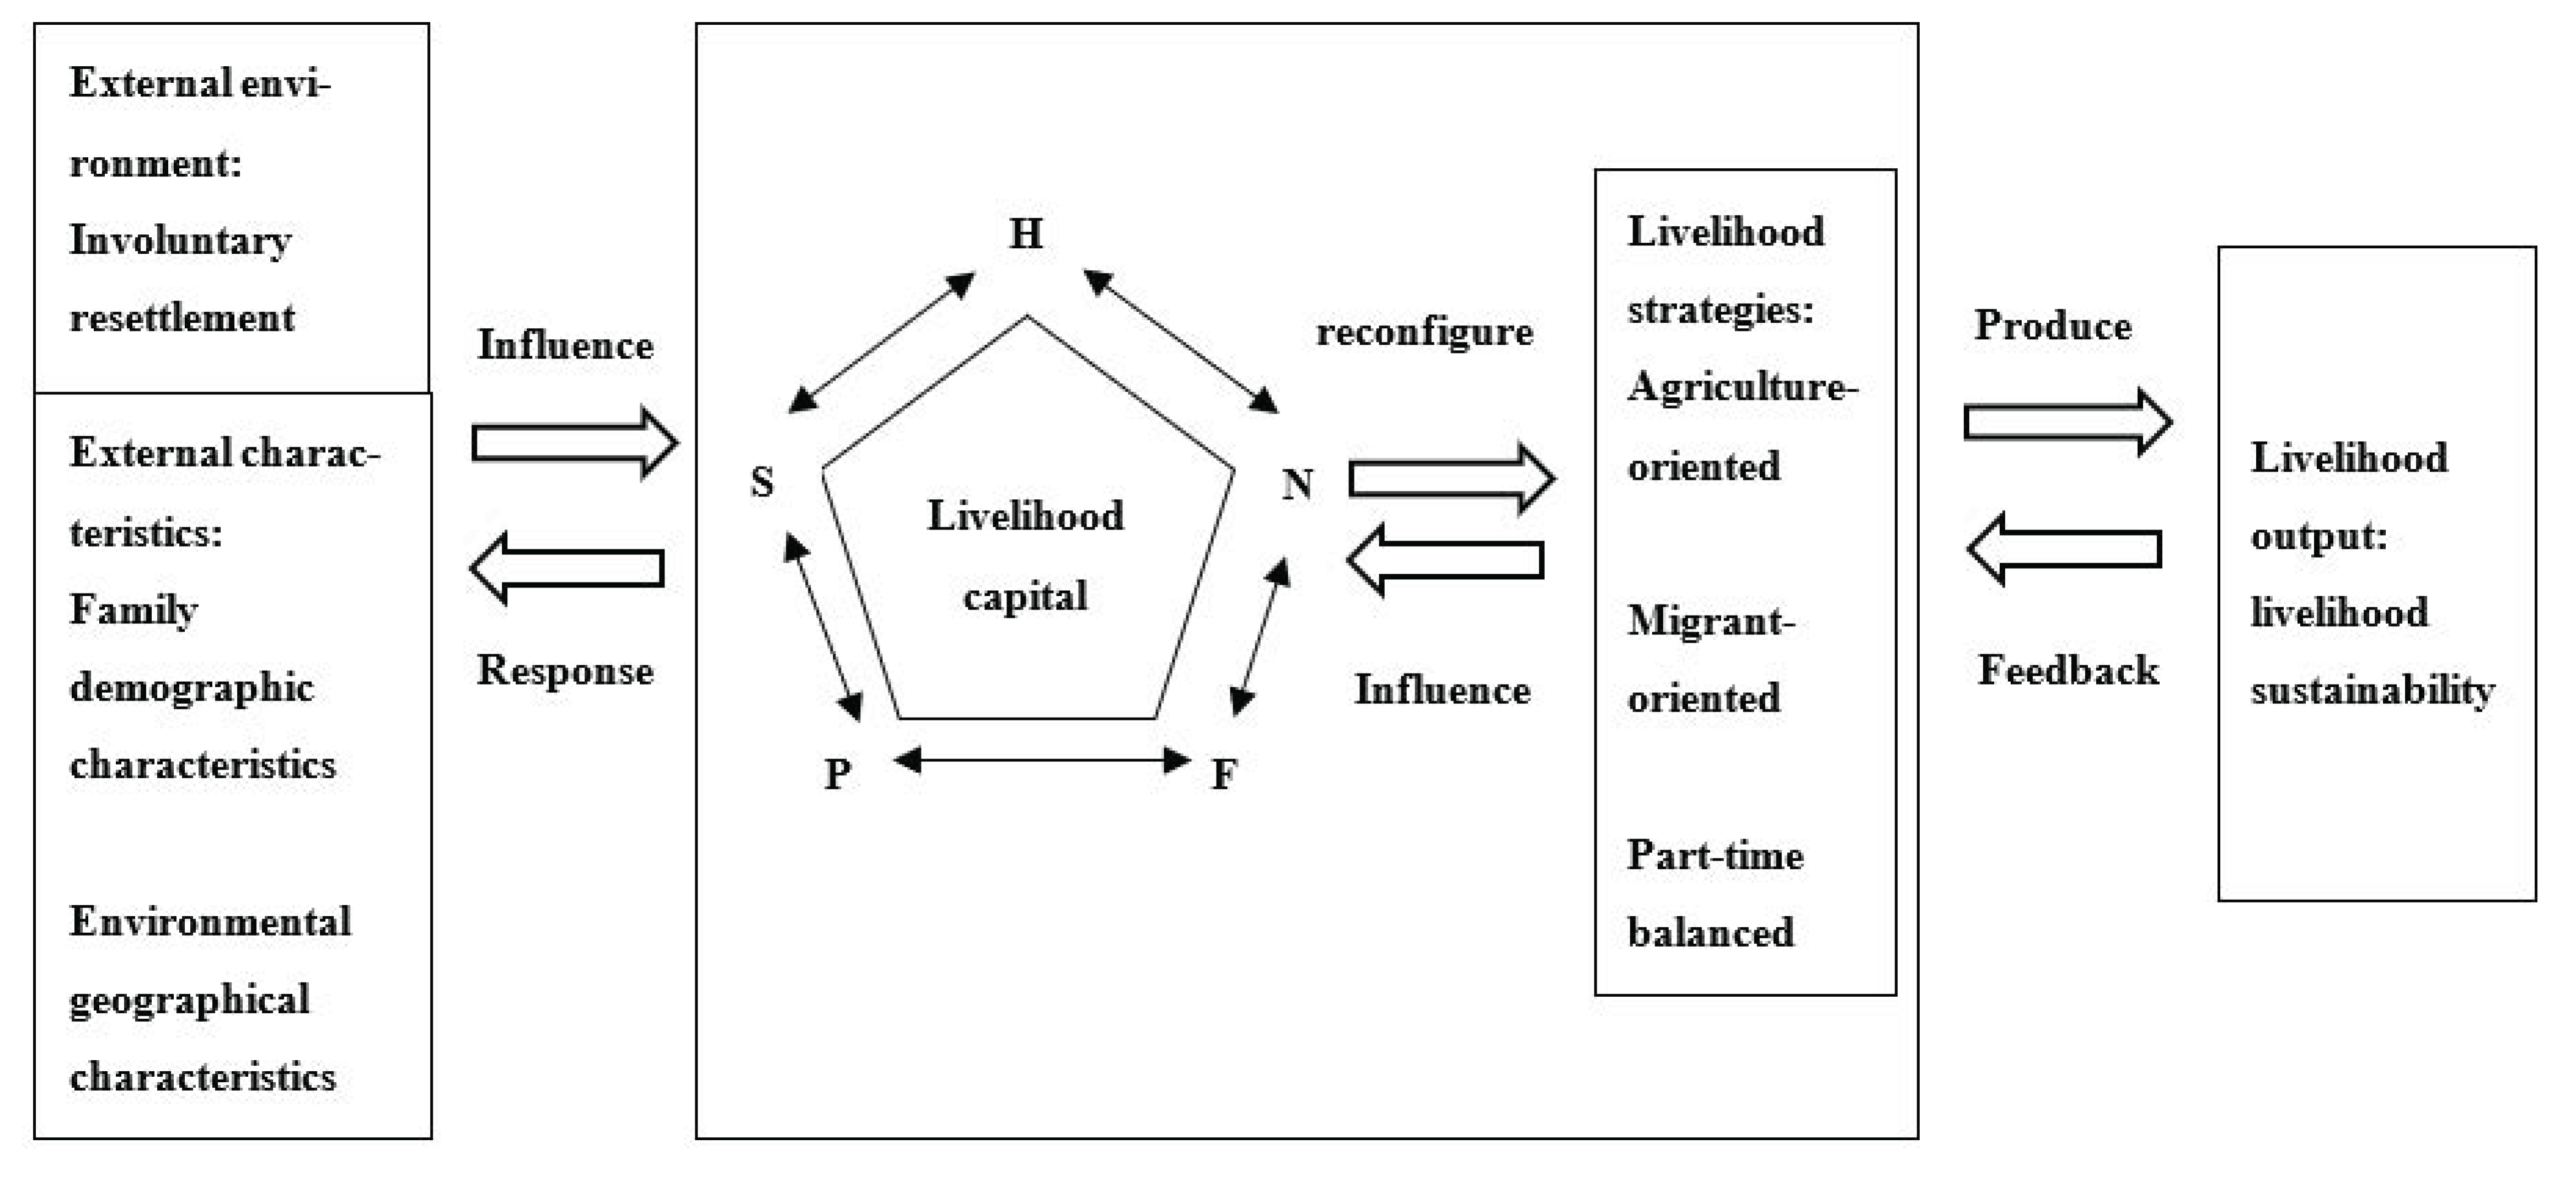
2.2. Theoretical Analysis Framework

Livelihood capital is the resources owned by individuals or families for survival and development. Livelihood strategy refers to the scope and combination of individual or family activities and choices. Theoretically, a correct understanding of the impact of livelihood capital on livelihood strategies is the basis and premise of this paper. The analysis of the impact of resettled households’ livelihood capital on livelihood strategies is shown in Figure 1. The vulnerability background includes external environment and external characteristics. The external environment was involuntary resettlement, and the external characteristics were family demographic characteristics and environmental geographical characteristics. In the context of involuntary resettlement, the livelihood dynamics of resettled households follow the logic of “involuntary resettlement–changes in livelihood capital–adjustment of livelihood strategies”. The stock, composition, and changes in livelihood capital owned by resettled households will affect the type and transformation of livelihood strategies; in turn, livelihood strategy will also influence the livelihood capital, until it reaches a relatively stable state, namely, sustainable livelihood. The greater the livelihood capital, the greater the capacity for self-development and the greater the ability to actively choose the type of livelihood strategy and the best way of livelihood and enhance the ability to resist risks. Therefore, the improvement of livelihood capital and the optimization of livelihood strategies are important for resettled households, as they are conductive to improving their sustainable livelihood capacity and achieving common prosperity.

2.3. Index System Construction

This research followed the principles of methodicalness, systematicness, completeness, and operability when constructing the index system [22]. On the basis of denoting the current research results [23,24,25], initially, the index set was preselected through the theoretical analysis framework (Figure 1), the existing livelihood capital index system research results, and the actual situation of resettled households in the sample area. After this, the evaluation indexes were screened by the method of expert scoring, and finally, an evaluation index system of resettled households’ livelihood capital was constructed, which included seven first-level indexes and 23 second-level indexes (as shown in Table 1). The specific indicators are explained below.
(1) Natural capital (N). Natural capital is one of the most important forms of livelihood capital of resettled households. Many resettled households principally rely on farming for their livelihood. Agricultural planting itself is a kind of livelihood activity dependent on nature. Thus, the quality and stock of natural capital have a great impact on the sustainable development of resettled households’ livelihoods and also determine the degree of vulnerability of their livelihoods. Regarding the relevant research and the actual situation of the case study, “per capita cultivated area” and “cultivated land quality” were carefully selected as indicators to measure the livelihood capital of resettled households.
(2) Human capital (H). Human capital holds an important position among the five categories of livelihood capital. Human capital comprises knowledge and skills besides physical fitness and also plays an important role in the sustainable livelihood development of resettled households. Combined with the actual local conditions, this research chose four primary human capital indicators: “health status”, “labor force quantity”, “education level”, and “skill training”.
(3) Social capital (S). Social capital principally denotes social network resources. This article selected four main indicators: “interpersonal communication”, “public affairs participation”, “social network support”, and “social network support”.
(4) Physical capital (P). The level of a family’s physical capital can reflect their overall income level, as well as their ability to maintain their livelihood. “Housing situation”, “means of production and living”, and “infrastructure evaluation” were considered the three main physical capital indicators in this research paper.
(5) Financial capital (F). The total amount of financial capital owned by a family, especially the amount of funds, directly determines the quality of life of the family and its ability to deal with risks. This research chose three main financial capital indicators: “total household income”, “financing channels”, and “government subsidies”.
(6) Family demographic characteristics. We chose four main indicators: “householder’s age”, “householder’s marriage status”, “family size”, and “land disposal mode”.
(7) Environmental geographical characteristics. We chose three main indicators: “resettlement mode”, “traffic conditions of resettlement site”, and “economic development level of resettlement site”.

3. Materials and Methods
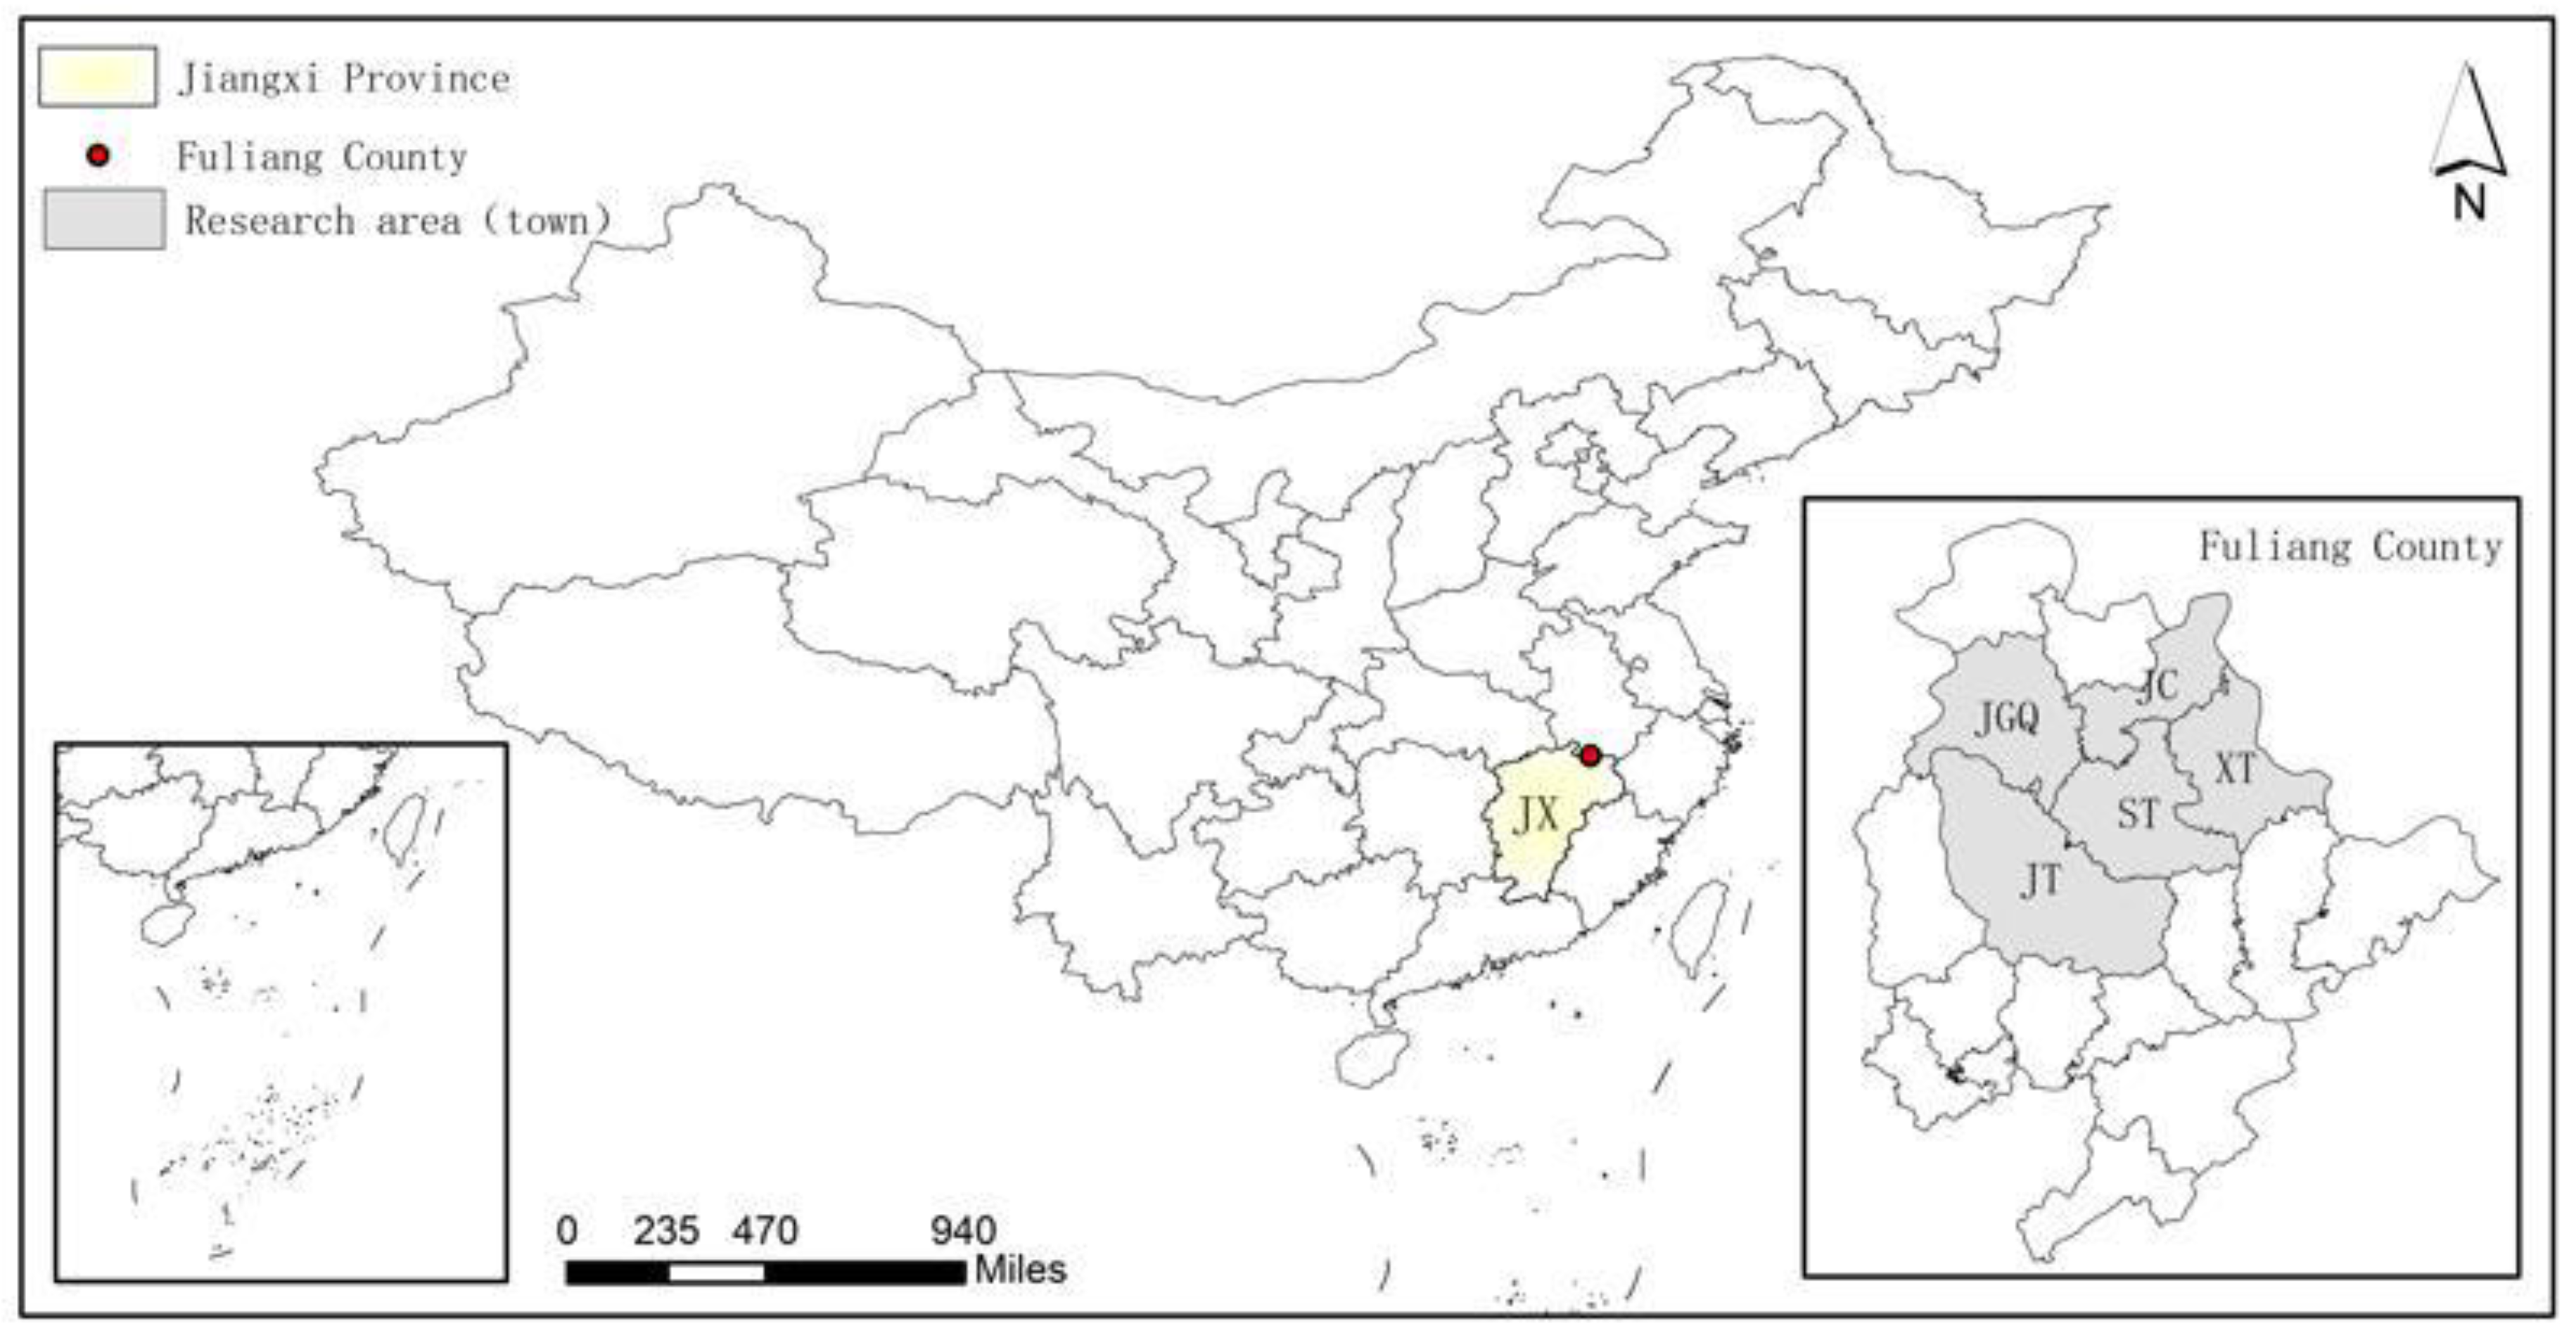
3.1. Study Area

This research chose Wuxikou Water Control Project as the study area, in Fuliang county, Jingdezhen city, Jiangxi Province, China (as shown in Figure 2). It is a large (II) reservoir in the middle reaches of the Yangtze River main stream. The main function of the reservoir is flood control, and it also has comprehensive functions, such as water supply and power generation, which play important roles in promoting the sustainable development of the regional economy. The construction was officially started in 2017, and the final acceptance of resettlement was completed in November 2020. The project involves five towns in Fuliang county, namely Shitan, Jiaotan, Xingtian, Jiangcun, and Jinggongqiao. The total population affected by the project is 9568, with 11762.18 mu of cultivated land and 6551.48 mu of forest land submerged. As one of the 172 major water conservation and water supply projects in China, less than two years have passed since the completion of reservoir construction and resettlement. The whole resettlement area is still in the recovery period, and the livelihood of resettled households need to be solved. Therefore, taking the Wuxikou Water Control Project as the sample area is representative and typical. Through empirical analysis of the influence of livelihood capital on the choice and transformation of livelihood strategies, it can reflect the relationship between the livelihood strategies of reservoir resettled households, help to achieve the goal of “moving out, staying stable, and becoming rich”, and transfer experience to existing or upcoming resettlement projects in other regions.

3.2. Data Source

The research data in this article came from a field survey of reservoir resettled households conducted by the research team in Fuliang county, Jiangxi Province, in May 2022. Both questionnaires and interviews with reservoir resettled households were employed. In this research study, simple random sampling was used to conduct “one-to-one” sampling surveys on resettled households in the survey area. According to the data provided by the Fuliang county government, the project has 29 resettlement sites in five towns. The survey process comprised the following steps.
First, randomly select 10 resettlement sites. Second, based on the total number of households in the resettlement site, 500 resettled households were selected by stratified sampling. Lastly, the sample resettled households were interviewed, and questionnaires were issued. After sorting out and removing the invalid questionnaires, 468 valid questionnaires were finally obtained (as shown in Table 2). The statistical data of the basic characteristics of the samples are shown in Table 3.
Moreover, to understand the local characteristics and information regarding resettled household members, this survey also focused on investigating and interviewing resettled households regarding their livelihood capital in addition to their livelihood strategies. Furthermore, for a better understanding of the livelihood of local resettled households, the investigation teams also established dialogue forums at each sample point, and a total of more than 30 in-depth interview records were assembled, providing more comprehensive information for this research study. After each detailed survey, the research group held a positive meeting and had a conversation about the survey, summarizing the problems and difficulties encountered in the survey process and solving them at this time. The combination of questionnaire surveys and field investigations confirmed the authenticity and reliability of the survey data.

3.3. Research Methods

This research paper primarily evaluated the level of resettled households’ livelihood capital and empirically investigated the impact of livelihood capital on resettled households’ livelihood strategies. When calculating the livelihood capital, the entropy method was used, and SPSS software was used for data analysis. When empirically analyzing the impact of livelihood capital on the choice and transformation of sustainable livelihood strategies, the logistic regression model was used, and STATA software was used for data analysis. The livelihood capital measurement method and empirical model settings were as follows.

3.3.1. Livelihood Capital Measurement Method

Weight is an indispensable part of the comprehensive evaluation method, and the application of any method requires the calculation of the weight. In this paper, the entropy method was used to calculate the weight of each index. The entropy method is an objective weighting method. It is a method to determine the index weight according to the impact of the change in evaluation index on the whole system, and the greater the change in the index, the greater the weight. In order to avoid as much as possible the influence of some subjective factors in the process of determining the weight, we adopted the entropy method to calculate the weight of each index. Since the dimensions and orders of magnitude of various indicators of livelihood capital were not unified, in order to eliminate the impact of the difference in dimension and order of magnitude, it was necessary to homogenize the heterogeneous indicators and standardize the indicators, so as to solve the problem of the homogenization of the values of various heterogeneous indicators. In this paper, the extreme value method was used to standardize the data, as shown in Formula (1) [26]:
      Z i j = X i j X j m i n / X j m a x X j m i n
where i represents the number of resettled households, j represents the number of indicators, X i j is the original value of the j th indicator of the i th resettled household, X j m a x is the maximum value of the j th indicator, X j m i n is the minimum value of the j th indicator, and Z i j is the standardized value of the j th indicator of the i th resettled household. The closer the normalized value is to 1, the higher the relative level of the indicator.
Secondly, the entropy method was used to calculate the weight of each index, and the steps were as follows:
The proportion of the i th resettled household index value under the j th index was calculated: P i j = Z i j / i = 1 n Z i j .
The entropy value of the j th index was calculated: e j = 1 / ln n i = 1 n P i j ln P i j .
The weight of the j th index was calculated: W j = 1 e j / i = 1 n 1 e j .
The weight values of the various indicators obtained in this paper are shown in Table 4.
Finally, the livelihood capital LC of the farmers based on the standardized processing data and the weight of each indicator was calculated: L C = j = 1 n W j Z i j .

3.3.2. Variable Selection and Model Setting of the Impact of Livelihood Capital on Livelihood Strategies

Variable Selection

This research considered the Wuxikou Water Control Project as an example of the impact of resettled households’ livelihood capital on their livelihood strategies, so the resettled households’ livelihood strategy was the dependent variable (Y). There are various types of livelihood strategies, and there is no unified division standard at present. According to the classification methods of some scholars [18,27,28], we divided the resettled households into three types by using K-means cluster analysis (as shown in Table 5): agriculture-oriented, migrant-oriented, and part-time balanced.
The livelihood capital of resettled households was an independent variable (X), comprising natural capital (N), physical capital (P), human capital (H), social capital (S), and financial capital (F). As for the index setting of each livelihood capital, these were determined in a previous paper, and the origin of and reasons for the index settings are not repeated here. The specific indicators of the five types of livelihood capital are shown in Table 1. This section continues to use the standardized data of each index for empirical analysis.

Model Setting

The impact of livelihood capital on livelihood strategies has received extensive attention in academia, and there are many qualitative studies available on the relationship between them [29]. Moreover, many scholars have used certain models and methods to conduct empirical research on the relationship between the two from different perspectives [30,31,32]. At present, the logistic regression model is widely used to analyze the relationship between the two. Therefore, this research paper learned from previous research methods and used the logistic regression model to empirically analyze the impact of livelihood capital on the livelihood strategies of resettled households in the Wuxikou Water Control Project.
First, the logistic regression model was used to analyze the influencing factors of resettled households’ different types of livelihood strategies. When analyzing certain types of livelihood strategies, a value of 1 was assigned to the pertinent type of livelihood strategy, while a value of 0 was assigned to the remaining two types of livelihood strategies [33]. For example, when analyzing the influencing factors of the choice of the agriculture-oriented livelihood strategy, the agriculture-oriented livelihood strategy was assigned 1, and the other two livelihood strategies were assigned 0. Based on this method, logistic regression models of the migrant-oriented and part-time balanced strategies were constructed, and the details are shown in Formulas (2)–(4).
  ln P y 1 / 1 P y 1 = a 10 + a 11 X 1 + , , a 1 m X i        
      ln P y 2 / 1 P y 2 = a 20 + a 21 X 1 + , , a 2 m X i  
    ln P y 3 / 1 P y 3 = a 30 + a 31 X 1 + , , a 3 m X i
In Formula (2), if the type of livelihood strategy was agriculture-oriented, then P y 1 = 1 ; otherwise, it was 0. X i is the explanatory variable, i.e., the five major livelihood capitals. a 10 a 1 m are the estimated coefficients of the explanatory variables. In Formula (3), if the type of livelihood strategy was migrant-oriented, then P y 2 = 1 ; otherwise, it was 0. X i is the explanatory variable, i.e., the five major livelihood capitals. a 20 a 2 m are the estimated coefficients of the explanatory variables. In Formula (4), if the type of livelihood strategy was part-time balanced, then P y 3 = 1 ; otherwise, it was 0. X i is the explanatory variable, i.e., the five major livelihood capitals. a 30 a 3 m are the estimated coefficients of the explanatory variables. The influencing factors and degree of resettled households’ livelihood capital on different types of livelihood strategies were studied by the logistic regression model.
Meanwhile, in order to reveal the law of transformation of resettled households’ livelihood strategies from agriculture-oriented to migrant-oriented and part-time balanced, we assigned the livelihood strategies of agriculture-oriented, migrant-oriented, and part-time balanced as 1, 2, and 3, respectively, and took the livelihood strategy of agriculture-oriented as a reference to analyze the changes in livelihood capital in the process of transformation from agriculture-oriented to migrant-oriented and part-time balanced. Therefore, we constructed a polynomial logistic regression model, as shown in Formulas (5) and (6).
  ln P y 2 / P y 1 = a 210 + a 211 X 1 + , , a 21 m X i
  ln P y 3 / P y 1 = a 310 + a 311 X 1 + , , a 31 m X i
If the type of livelihood strategy was agriculture-oriented, then P y 1 = 1 ; if the type of livelihood strategy was migrant-oriented, then P y 2 = 2 ; if the type of livelihood strategy was part-time balanced, then P y 3 = 1 . a 210 a 21 m and a 310 a 31 m are the estimation coefficients.

4. Results

Based on the research methods and data sources mentioned above, the final results for this research paper were obtained. This section mainly analyzes the evaluation results pertaining to livelihood capital, the impact of livelihood capital on livelihood strategies, and the main factors of livelihood strategy transformation from agriculture-oriented to migrant-oriented and part-time balanced.

4.1. Evaluation Results of the Resettled Households’ Livelihood Capital

The calculated results of the livelihood capital of resettled households in the Wuxikou Water Control Project are shown in Table 4. It can be clearly seen from Table 4 that the asset values of natural, human, social, physical, and financial capital were 0.362, 0.480, 0.437, 0.372, and 0.443, respectively. The average values of the five kinds of livelihood capital were generally not high. Among them, human capital was the highest, with a value of 0.480, which reflects that the level of human capital has improved after resettlement, and its quantity and quality also determine whether resettled households can reasonably use other livelihood assets. Financial capital was relatively high, with an asset value of 0.443, which shows that the government has provided better financial support policies to promote the sustainable development of resettled households. Social capital was at a medium level, with a value of 0.437, meaning that the resettled households know enough about the construction of social relationship networks and pay enough attention to the utilization of social network resources to resist risks and improve livelihoods. Physical capital was low, with a value of 0.372. Natural capital was the lowest, with a value of 0.362, which reflects that the livelihood model of resettled households has changed, most of the land has led to a loss of basic security in a short period of time, and physical capital has suffered losses to varying degrees in the resettlement process.

4.2. The Impact of Livelihood Capital on Livelihood Strategies

This research assumed that there is a certain relationship between livelihood capital and livelihood strategies. In order to confirm the mathematical relationship between the two, the Wuxikou Water Control Project was considered as an example model, based on the survey data and using the binary logistic regression method to empirically analyze the impact of resettled households’ livelihood capital on their livelihood strategies. The results are shown in Table 6.
It can be seen from Table 6 that the natural and financial capital have a significant impact on resettled households’ choice of agriculture-oriented livelihood strategy, in which financial capital has a negative impact and natural capital has a positive impact. The higher the natural capital of resettled households, the more likely they are to have carefully chosen the agriculture-oriented livelihood strategy. This might be because the agriculture-oriented livelihood strategy is primarily based on agricultural cultivation and breeding, which is highly dependent on natural capital. The higher the financial capital owned by resettled households, the lower the probability of choosing an agriculture-oriented livelihood strategy. A possible reason is that the higher the financial capital, the stronger the economic strength of resettled households. The more credit opportunities resettled households obtain, the more channels of income sources they have and the more capital they have to engage in other non-agriculture livelihood activities. The social and financial capital have a significant positive impact on resettled households’ choice of migrant-oriented livelihood strategy. The higher the social and financial of resettled households, the more likely they are to have carefully chosen the migrant-oriented livelihood strategy. The higher the social capital, the more opportunities for resettled households to understand the external market information, which is more likely to promote the transformation of these resettled households to migrant-oriented livelihood strategy. Normally, the greater the financial capital, the more numerous the means of livelihood pursued by resettled households. In this case, the stronger the ability to promote the transformation of resettled households’ livelihood strategies, the more likely resettled households are to develop into non-agricultural industries. The human and physical capital have a significant positive impact on resettled households’ choice of part-time balanced livelihood strategy. The higher the human and physical capital of resettled households, the more likely they are to have carefully chosen the part-time balanced livelihood strategy. The key reason is that the higher the education level of resettled households, the richer the family labor force and the greater the knowledge and skills that they master. Hence, they are more likely to discard their previous agriculture-oriented livelihood strategy and engage in part-time balanced livelihood strategy. When the number of production tools and durable goods owned by resettled households is sufficient, the willingness to choose a part-time balanced strategy will be enhanced.

4.3. Analysis of the Key Influencing Factors of the Transformation from Agriculture-Oriented to the Migrant-Oriented and Part-Time Balanced Strategies

Based on the agriculture-oriented livelihood strategy as a reference, we investigated the influencing factors of the transformation from agriculture-oriented to migrant-oriented and part-time balanced, in order to determine the important influencing factors to optimize resettled households’ livelihood strategies and to increase their income sources, so as to promote an improvement in their sustainable livelihood ability. Table 7 and Table 8 show the analysis outcomes of the influencing factors of the transformation from agriculture-oriented to migrant-oriented and part-time balanced.
It can clearly be seen from Table 7 that natural, physical, and financial capital have a significant impact on the transformation of livelihood strategies from agriculture-oriented to migrant-oriented. Specifically, natural and physical capital have a negative impact, and financial capital has a positive impact. From the perspective of the contribution rate Exp (B) of different types of livelihood capital to the choice of livelihood strategies, financial capital is the key factor in the transformation of livelihood strategies from agriculture-oriented to migrant-oriented. When other independent variables remain unchanged, for every unit increase in financial capital, the incidence of strategic transformation from agriculture-oriented to migrant-oriented increases by 124.269 times. The analysis shows that the richer the financial capital is, the more accessible financing is, which means it is easier to leave agricultural livelihood activities and choose to go out to work or engage in nonagricultural business investment with higher returns to meet the family’s needs. Therefore, in the case of both agriculture-oriented and migrant-oriented strategies, resettled households are more inclined to choose migrant-oriented strategies, which is consistent with reality. It can clearly be seen from Table 7 that human, social, and financial capital have a significant impact on the transformation of livelihood strategies from agricultural oriented to part-time balanced, in which social and financial capital have a negative impact and human capital has a positive impact. From the perspective of the contribution rate Exp (B) of different types of livelihood capital to the choice of livelihood strategies, human capital is the key factor in the transformation of livelihood strategies from agricultural oriented to part-time balanced. When the other independent variables remain unchanged, the incidence of the transformation from an agricultural-oriented to a part-time balanced strategy increases by 4.379 times for each unit increase in human capital. The analysis shows that the more abundant human capital is, the more likely resettled households are to have a large labor force, a better educated labor force, and stronger labor skills and information processing ability, thus providing a better foundation and conditions for engaging in nonagricultural operations and migrant work. Therefore, in the case of both agriculture-oriented and part-time balanced strategies, resettled households are more inclined to choose part-time balanced strategies, which is consistent with reality.
It can clearly be seen from Table 8 that among the segmentation variables of natural capital, the area of cultivated land per capita is the key factor in the transformation of resettled households’ livelihood strategy from agriculture-oriented to migrant-oriented. When other independent variables remain unchanged, for each unit increase in the per capita cultivated land area, the incidence of choosing the migrant-oriented strategy will decrease by 148.775 times. The main reason is that the endowment of land resources determines the cost of agricultural production, and an increase in land area means that resettled households have more comparative advantages in agricultural production and operation activities, and resettled households are therefore more inclined to choose agriculture-oriented strategies, which is consistent with the conclusions of many previous studies. Among the human capital segmentation variables, the education level is the key factor in the transformation of resettled households’ livelihood strategy from agriculture-oriented to migrant-oriented. When the other independent variables remain unchanged, the incidence of migrant-oriented strategies increases by 0.328 times for each unit increase in education level. The main reason is that the resettled household labor force is better educated and has stronger labor skills and information processing ability, thus providing a better foundation and conditions for migrant workers. Among the segmentation variables of social capital, interpersonal communication is the key factor in the transformation of resettled households’ livelihood strategies from agriculture-oriented to migrant-oriented. When the other independent variables remain unchanged, the incidence of migrant-oriented strategies will increase by 0.613 times for each unit increase in interpersonal communication. This result shows that migrant workers often go out collectively by means of mutual introduction of relatives and friends and gradually form their own social network in relatively developed regions such as Jiangsu, Zhejiang, Shanghai, eastern Fujian, and southern Guangdong. Among the financial capital segmentation variables, total household income is the key factor in the transformation of resettled households’ livelihood strategy from agriculture-oriented to migrant-oriented. When the other independent variables remain unchanged, the incidence of the employment-oriented strategy will increase by 158.698 times for every unit increase in total household income. The survey data show that migrant workers’ income is the main source of income for resettled households, and wage income accounts for 58% of the total income of resettled households surveyed. This feature of the family income structure makes it easier for resettlers to choose the migrant-oriented strategy from the perspective of improving family income. Among family demographic characteristics, land disposal is the key factor in the transformation of resettled households’ livelihood strategies from agriculture-oriented to migrant-oriented. When the other independent variables remain unchanged, the incidence of the migrant-oriented strategy will increase by 5.386 times for each additional unit of land disposal mode. The main reason is that, in the case of non-cultivated land disposal methods such as land transfer or abandonment, the surplus labor force of resettled households can be replaced by agricultural production and operation to engage in nonagricultural activities to obtain income to meet family livelihood needs. Among the environmental and geographical characteristics, the transportation conditions of the resettlement site are the key factors in the transformation of the livelihood strategy of resettled households from agriculture-oriented to migrant-oriented. When other independent variables remain unchanged, the occurrence rate of the migrant-oriented strategy will increase by 12.193 times for each unit increase in traffic conditions in the resettlement site. This result shows that the better the traffic conditions in the resettlement site are, the more likely resettled households are to go out to work, which reduces the possibility of engaging in traditional agricultural production and operation.
It can clearly be seen from Table 8 that among the segmentation variables of human capital, labor force quantity is the key factor in the transformation of resettled households’ livelihood strategy from agriculture-oriented to part-time balanced. When other independent variables remain unchanged, the incidence of the part-time balanced strategy will increase by 118.348 times for each unit of increase in the labor force quantity. The main reason is that the number of resettled households in the labor force is larger, and the latter’s labor skills and information processing ability are stronger, which provides a better basis and conditions for engaging in nonagricultural business. Among the segmentation variables of social capital, interpersonal communication is the key factor in the transformation of resettled households’ livelihood strategies from agriculture-oriented to part-time balanced. When other independent variables remain unchanged, the occurrence rate of the part-time balanced strategy will increase by 6.574 times for each additional unit of interpersonal communication. This result shows that resettled households have a stronger ability to acquire, process and use various information resources and social relations resources, which is conducive to better connecting with local nonagricultural business channels. Among the financial capital segmentation variables, total household income is the key factor in the transformation of resettled households’ livelihood strategies from agriculture-oriented to part-time balanced. When other independent variables remain unchanged, the incidence of choosing a part-time balanced strategy will decrease by 0.221 times for each unit of increase in total household income. The main reason is that migrant workers’ income is the main source of income for resettled households. According to the survey data, 68% of resettled households have engaged in migrant work activities in the past year, including 70.2% migrant workers and 29.8% local migrant workers. Resettled households work for hours outside the home. It is difficult for the labor force to take into account other local livelihood activities. These other local livelihoods require additional labor from families. Families with an insufficient labor force may stop these livelihood activities [34,35]. Among family demographic characteristics, family size is the key factor in the transformation of the resettled households’ livelihood strategy choice from agriculture-oriented to part-time balanced. When other independent variables remain unchanged, for each unit of increase in family size, the incidence of choosing a part-time balanced strategy will increase by 56.824 times, indicating that the greater the family population, the more willing they will be to engage in nonagricultural livelihood activities to obtain income. Among the environmental and geographical characteristics, the economic development level of the resettlement area is the key factor in the transformation of the livelihood strategy of resettled households from agriculture-oriented to part-time balanced. When other independent variables remain unchanged, the occurrence rate of the part-time balanced strategy will increase 347.508 times for each unit increase in the economic development level of the resettlement site. According to the survey, involuntary resettlement is resettled in mainly a centralized way. Most resettlement sites are close to the county seat or township, which can provide more timely and effective information resources. The channels of production, living, and employment choices are also more diverse, and it is easier to choose a balanced part-time strategy.

5. Discussion

The research on livelihood capital and livelihood strategies is constantly evolving, both at home and abroad [17,36]. Based on the characteristics of reservoir resettled households’ sustainable livelihoods in the Wuxikou Water Control Project, we constructed a model of resettled households’ livelihood capital and livelihood strategies and conducted data analysis. However, due to differences in research areas and research methods, the results of the research are slightly different from other researchers’ findings in terms of resettled households’ livelihoods.
Regarding the evaluation methods of livelihood capital, in recent years, new methods have been established and gradually implemented by the majority of scholars, such as regression analysis, analytic hierarchy process, artificial neural networks, and fuzzy evaluation [37,38,39]. Each evaluation method has its advantages and disadvantages. Based on the real circumstances of the study area, we carefully chose the entropy methodology as the evaluation method of the livelihood capital of reservoir resettled households in the Wuxikou Water Control Project. The reason was that the entropy technique can imitate in depth the utility value of the index information entropy value and thus determine the weight. In addition, the entropy method is an objective weighting method, so the weights of the indicators derived from it are more considered, with moderately high reliability and accuracy [40]. The research results of this paper show that the value of human capital is the highest, while the value of natural capital is the lowest. The reason for the higher human capital is that the level of human capital of resettled households has improved significantly after resettlement and has become the most important factor for resettled households to maintain their livelihoods and promote the innovation of livelihood models. Meanwhile, the low natural capital was mainly caused by the loss of land, which has led to a loss of basic security in a short period of time.
In this paper, the logistic regression model was used to conduct an empirical investigation of the relationship between livelihood capital and livelihood strategies. The results show that different livelihood capital conditions determine the choice of livelihood strategy for reservoir resettled households. The difference in this study is that the livelihood strategies of resettled households were divided into three types, namely agriculture-oriented, migrant-oriented, and part-time balanced, and the impact of different livelihood capital types on the three livelihood strategies was calculated. In addition, most scholars have only studied the impact of livelihood capital on livelihood strategies and have not further studied the key influencing factors of the transformation of livelihood strategies [17,41]. With changes in livelihood capital, the type of livelihood strategy will also change to a certain extent. We individually analyzed the influencing factors of the transformation from pure agriculture to part-time and non-agriculture livelihood strategies. The results show that the transformation of resettled households’ livelihood strategies is affected by many key factors. This study can help resettled households quickly identify the influencing factors of different livelihood strategies so as to realize the optimization of their strategy, in order to better solve the sustainable livelihood problems of resettled households in other regions.
The possible innovations of this paper are as follows. We focused on empirical research on the impact of livelihood capital on livelihood strategies and conducted a detailed analysis of the key influencing factors of livelihood strategy transformation. Most of the studies on livelihood strategies were from the perspective of sociology, mainly focusing on the current situation of livelihood, types of livelihood strategies, etc., and lacked in-depth empirical research. Although some scholars have made some research progress on the impact of livelihood capital on livelihood strategies, the research is not comprehensive. They only analyzed the impact of livelihood capital on the choice of livelihood strategies and did not further analyze the impact of livelihood capital on the transformation of livelihood strategies. This article has made up for this deficiency. However, this study has certain limitations. The availability of data was one limitation, as this paper only discussed the livelihood of resettled households of Wuxikou Water Control Project at a single point in time. The livelihood capital of resettled households will change with time, and the choice of livelihood strategy also needs dynamic analysis. In future research, we will try to establish a dynamic monitoring system for resettled households to compare the changes in their livelihood capital and livelihood strategies at different time points, and we will analyze the livelihood issues of resettled households in different periods.

6. Conclusions and Suggestions

6.1. Conclusions

On the basis of the relevant research results pertaining to livelihood capital and livelihood strategy, in this research, we adopted Wuxikou Water Control Project as an example, constructed an evaluation index system of livelihood capital, evaluated the livelihood status of reservoir resettled households with the help of field survey data, and then empirically studied the impact of resettled households’ livelihood capital on their choice of livelihood strategy. Based on previous theoretical analysis and empirical research, this research draws the following conclusions:
(1) From the perspective of livelihood capital, the five categories of livelihood capital were generally not high. Among them, the asset value of human capital was the highest, at 0.480; the natural capital value was the lowest, at 0.362; the financial, social, and physical capital values were between the two, at 0.443, 0.437, and 0.372, respectively. The average values of the five kinds of livelihood capital were generally not high. This research showed that in the Wuxikou Water Control Project, there are still some constraints on resettled households’ sustainable livelihoods.
(2) From the perspective of the influencing factors of livelihood strategy selection, natural and financial capital have significant impact on the choice of agricultural-oriented livelihood strategy, in which natural capital has a positive effect and financial capital has a negative effect. Social and financial capital have a significant positive impact on the choice of migrant-oriented livelihood strategy. Human and physical capital have significant positive impact on the choice of part-time balanced livelihood strategy. This research showed that the type of livelihood strategy that resettled households choose depends on the type and stock of livelihood capital that they have.
(3) From the perspective of the key factors that affect the transformation of livelihood strategies, the key factors that promote the transformation of livelihood strategy from agriculture-oriented to migrant-oriented mainly include the per capita cultivated land area, education level, interpersonal communication, total family income, land disposal methods, and transportation conditions. The key factors that promote the transformation of livelihood strategy from agriculture-oriented to part-time balanced are mainly the labor force quantity, interpersonal communication, total family income, family size, and the economic development level. This research showed that the types of livelihood strategies adopted by resettled households are not invariable and will change with a change in livelihood capital. Therefore, resettled households should choose the most suitable livelihood strategy according to their actual livelihood capital, so as to enhance their livelihood ability.

6.2. Suggestions

In summary, the livelihood capital of rural reservoir resettled households has a profound impact on the choice and transformation of livelihood strategies after resettlement. To help resettled households achieve sustainable livelihoods, it is necessary to provide targeted late-stage assistance policies based on differences in resettled households’ livelihood capital endowment and different types of policies to encourage resettled households to make the most reasonable choice of livelihood strategies based on their own livelihood capital conditions. Specific policy recommendations are as follows.
(1) Improve the human capital level of resettled households by category. According to the demand of the labor market, a series of targeted training activities should be carried out by category to strengthen the professional skills of adult labor, such as agricultural production skills, migrant workers’ skills, self-employed skills, etc., and effectively overcome professional barriers of single skills, poor adaptability, and low levels of migration. While strengthening the vocational skills of the adult labor force, we should also pay attention to the basic education of the next generation, improve their cultural knowledge level through formal school education, and realize the intergenerational transformation of resettled household identity. We should also understand the development direction of rural revitalization and county urbanization; integrate the old, middle-aged, and young labor force to create local agricultural and sideline products, eco-tourism, research and education, and other industrial brands and chains; and innovate and develop learning livelihoods.
(2) Reconstruct the social capital network of resettled households in various forms. Guide various public welfare social organizations in cities to participate in the construction of new resettlement communities, jointly promote the reconstruction of social networks for resettlers in various forms, enhance the feeling and sense of solidarity and mutual assistance among neighbors in resettlement areas, and enhance the ability of resettlers to accumulate social capital. Resettlers should actively participate in various activities organized by the community, actively integrate into community life, compensate for their own shortcomings in development, and improve their social adaptability.
(3) Diversify and broaden the financial capital channels of resettled households. Improve the credit mechanism, expand credit coverage, increase the supply of loans to resettlers, promote diversification and innovation in credit supply services for resettlers, pay attention to prior guidance and process monitoring, and prevent the risk of capital utilization. Resettlers should cultivate the concept of financial management, develop an awareness of asset management, and use financial assets flexibly with the help of formal lending.

Author Contributions

Conceptualization, J.W. and S.C.; data curation, X.C; formal analysis, J.W.; investigation, X.C.; methodology, K.Z.; project administration, J.W.; resources, S.C.; software, K.Z.; supervision, S.C.; validation, J.W.; writing—original draft, J.W.; writing—review and editing, J.W. and S.C. All authors have read and agreed to the published version of the manuscript.

Funding

This research was funded by the Key Research Project of the National Foundation of Social Science of China (Fund No. 21&ZD 183), Community Governance and Post-relocation Support in Cross District Resettlement.

Institutional Review Board Statement

Not applicable.

Informed Consent Statement

Informed consent was obtained from all subjects involved in the study.

Data Availability Statement

The original contributions presented in the study are included in the article, and further inquiries can be directed to the corresponding author.

Conflicts of Interest

The authors declare that the research was conducted in the absence of any commercial or financial relationships that could be construed as a potential conflict of interest. Publisher’s note: All claims expressed in this article are solely those of the authors and do not necessarily represent those of their affiliated organizations or those of the publisher, the editors, and the reviewers. Any product that may be evaluated in this article, or claim that may be made by its manufacturer, is not guaranteed or endorsed by the publisher.

References

  1. Sepulveda, N.A.; Jenkins, J.D.; de Sisternes, F.J.; Lester, R.K. The Role of Firm Low-Carbon Electricity Resources in Deep Decarbonization of Power Generation. Joule 2018, 2, 2403–2420. [Google Scholar] [CrossRef] [Green Version]
  2. Dolter, B.; Fellows, G.K.; Rivers, N. The cost effectiveness of new reservoir hydroelectricity: British Columbia’s Site C project. Energy Policy 2022, 169, 113161. [Google Scholar] [CrossRef]
  3. Jichuan, S.; Shi, G. Economic Analysis on the Poverty Reasons for Reservoir Resettlement. Issues Agric. Econ. 2008, 12, 43–46. (In Chinese) [Google Scholar]
  4. Duan, Y.F. Development oriented migration policy: Conceptual framework, application and development. Jianghan Trib. 2007, 7, 131–134. (In Chinese) [Google Scholar]
  5. Guo, S.; Liu, S.; Peng, L.; Wang, H. The impact of severe natural disasters on the livelihoods of farmers in mountainous areas: A case study of Qingping Township, Mianzhu city. Nat. Hazards 2014, 73, 1679–1696. [Google Scholar] [CrossRef]
  6. Perz, S.G.; Leite, F.L.; Griffin, L.N.; Hoelle, J.; Rosero, M.; Carvalho, L.A.; Castillo, J.; Rojas, D. Trans-boundary infrastructure and changes in rural livelihood diversity in the southwestern amazon: Resilience and inequality. Sustainability 2015, 7, 2807. [Google Scholar] [CrossRef] [Green Version]
  7. Biggs, E.M.; Watmough, G.R. A community mmevel assessment of factors affecting livelihoods in nawalparasi district, nepal. J. Int. Dev. 2012, 24, 255–263. [Google Scholar] [CrossRef]
  8. Liu, M.Y.; Feng, X.L.; Wang, S.G.; Zhong, Y. Does poverty-alleviation-based industry development improve farmers’ livelihood capital? J. Integr. Agric. 2021, 20, 915–926. [Google Scholar] [CrossRef]
  9. Erenstein, O.; Hellin, J.; Chandna, P. Poverty mapping based on livelihood assets: A meso-level application in the Indo-Gangetic Plains, India. Appl. Geogr. 2010, 30, 112–125. [Google Scholar] [CrossRef]
  10. Fang, Y.P.; Fan, J.; Shen, M.Y.; Song, M.Q. Sensitivity of livelihood strategy to livelihood capital in mountain areas: Empirical analysis based on different settlements in the upper reaches of the Minjiang River, China. Ecol. Indic. 2014, 38, 225–235. [Google Scholar] [CrossRef]
  11. Oladele, I.; Ward, L. Effect of micro-agricultural financial institutions of south Africa financial services on livelihood capital of beneficiaries in north west province south Africa. Agric. Food Secur. 2017, 6, 45. [Google Scholar] [CrossRef] [Green Version]
  12. Johnson, S. Sustainable livelihoods and pro-poor market development. Enterp. Dev. Microfinance 2012, 20, 333–335. [Google Scholar] [CrossRef]
  13. Nyaupane, G.P.; Poudel, S. Linkages among biodiversity, livelihood, and tourism. Ann. Tour. Res. 2011, 38, 1344–1366. [Google Scholar] [CrossRef]
  14. Ado, A.M.; Savadogo, P.; Abdoul-Azize, H.T. Livelihood strategies and household resilience to food insecurity: Insight from a farming community in Aguie district of Niger. Agric. Hum. Values 2019, 36, 747–761. [Google Scholar] [CrossRef]
  15. Ayuttacorn, A. Social networks and the resilient livelihood strategies of Dara-ang women in Chiang Mai, Thailand. Geoforum 2019, 101, 28–37. [Google Scholar] [CrossRef]
  16. Zhang, J.; Mishra, A.K.; Zhu, P. Identifying livelihood strategies and transitions in rural China: Is land holding an obstacle? Land Use Policy 2019, 80, 107–117. [Google Scholar] [CrossRef]
  17. Ding, W.; Jimoh, S.O.; Hou, Y.; Hou, X.; Zhang, W. Influence of livelihood capitals on livelihood strategies of herdsmen in inner Mongolia, China. Sustainability 2018, 10, 3325. [Google Scholar] [CrossRef] [Green Version]
  18. Meng, J.; Amrulla, L.Y.; Xiang, Y. Study on relationship between livelihood capital and livelihood strategy of farming and grazing households: A case of Uxin Banner in Ordos. Acta Sci. Nat. Univ. Peking 2013, 49, 321–328. [Google Scholar]
  19. Zinda, J.; Zhang, Z. Land tenure legacies, household life cycles, and livelihood strategies in upland China. Rural Sociol. 2018, 83, 51–80. [Google Scholar] [CrossRef]
  20. Parizeau, K. When assets are vulnerabilities: An assessment of informal recyclers’ livelihood strategies in Buenos Aires, Argentina. World Dev. 2015, 67, 161–173. [Google Scholar] [CrossRef]
  21. Kuang, F.; Jin, J.; He, R.; Wan, X.; Ning, J. Influence of livelihood capital on adaptation strategies: Evidence from rural households in Wushen Banner, China. Land Use Policy 2019, 89, 104228. [Google Scholar] [CrossRef]
  22. Abson, D.J.; Dougill, A.J.; Stringer, L.C. Using principal component analysis for information-rich socio-ecological vulnerability mapping in Southern Africa. Appl. Geogr. 2020, 35, 515–524. [Google Scholar] [CrossRef]
  23. Athalya, B.; Yee, G.A. Capitals and capabilities: A framework for analyzing peasant viability, rural livelihoods and poverty. World Dev. 1999, 27, 2021–2044. [Google Scholar]
  24. Oberlack, C.; Tejada, L.; Messerli, P.; Rist, S.; Ginger, M. Sustainable livelihoods in the global land rush? Archetypes of livelihood vulnerability and sustainability potentials. Glob. Environ. Chang. 2016, 41, 153–171. [Google Scholar] [CrossRef]
  25. Tao, T.; Wall, G. Tourism as a sustainable livelihood strategy. Tour. Manag. 2009, 30, 90–98. [Google Scholar] [CrossRef]
  26. Zhang, L. Analysis of TJ economic vulnerability based on set pair analysis. J. Serv. Sci. Manag. 2019, 12, 116–125. [Google Scholar] [CrossRef] [Green Version]
  27. Zhu, J.J.; Hu, J.L.; An, K.; Huo, M. Analysis on the choice of livelihood strategies of peasant households who rent out the farmland and the influencing factors: Based on CFPS data. Issues Agric. Econ. 2016, 2, 49–58. (In Chinese) [Google Scholar] [CrossRef]
  28. Xu, D.D.; Zhang, J.F.; Liu, S.Q.; Xie, F.T.; Cao, M.T.; Wang, X.L.; Liu, E.L. An anlysis of the relationship between livelihood capital and livelihoodstrategies of the Typical Mountainous settlements in Southwestern Chian. J. Southwest Univ. Nat. Sci. Ed. 2015, 37, 118–126. (In Chinese) [Google Scholar] [CrossRef]
  29. Liu, W.; Li, J.; Ren, L.; Xu, J.; Li, C.; Li, S. Exploring livelihood resilience and its impact on livelihood strategy in rural China. Soc. Indic. Res. 2020, 150, 977–998. [Google Scholar] [CrossRef]
  30. Su, M.M.; Wall, G.; Wang, Y.; Jin, M. Livelihood sustainability in a rural tourism destination-Hetu Town, Anhui Province, China. Tour. Manag. 2019, 71, 272–281. [Google Scholar] [CrossRef]
  31. Ning, A.F.; Gang, M.A.; Faculty of Law, Ningbo University. On the allocation of increment income in land expropriation under the theory of feasible capability based on the case of a certain city of Zhejiang. J. Ningbo Univ. 2017, 30, 108–113. [Google Scholar]
  32. Poole, N.; Gauthier, R.; Mizrahi, A. Rural poverty in Mexico: Assets and livelihood strategies among the Mayas of Yucatán. Int. J. Agric. Sustain. 2007, 5, 315–330. [Google Scholar] [CrossRef] [Green Version]
  33. Zhao, W.; Yang, S.; Wang, X. The relationship between livelihood capital and livelihood strategy based on logistic regression model in Xinping County of Yuanjiang dry-hot valley. Resour. Sci. 2016, 38, 136–143. (In Chinese) [Google Scholar]
  34. Li, C.; Li, S.Z. The influence of labor migration on rural households’ livelihood strategy: An empirical analysis in Western China Mountain Area. Modern Econ. Sci. 2010, 5, 77–85. (In Chinese) [Google Scholar]
  35. Wu, Y. Study on farmers livelihood capital impact upon the strategies. J. South China Agric. Univ. Soc. Sci. Ed. 2015, 2, 57–66. (In Chinese) [Google Scholar]
  36. Wang, M.; Li, M.; Jin, B.; Yao, L.; Ji, H. Does livelihood capital influence the livelihood strategy of Herdsmen? Evidence from Western China. Land 2021, 10, 763. [Google Scholar] [CrossRef]
  37. Barreteau, O.; Anderies, J.M.; Guerbois, C.; Quinn, T.; Bousquet, F. Transfers of vulnerability through adaptation plan implementation: An analysis based on networks of feedback control loops. Ecol. Soc. 2020, 25, 15. [Google Scholar] [CrossRef]
  38. Hagenlocher, M.; Renaud, F.G.; Haas, S.; Sebesvari, Z. Vulnerability and risk of deltaic social-ecological systems exposed to multiple hazards. Sci. Total Environ. 2018, 631–632, 71–80. [Google Scholar] [CrossRef]
  39. Naylor, L.A.; Brady, U.; Quinn, T.; Brown, K.; Anderies, J.M. A multiscale analysis of social-ecological system robustness and vulnerability in Cornwall, UK. Reg. Environ. Chang. 2019, 19, 1835–1848. [Google Scholar] [CrossRef] [Green Version]
  40. Frazier, T.G.; Thompson, C.M.; Dezzani, R.J. A framework for the development of the SERV model: A spatially explicit resiliencevulnerability model. Appl. Geogr. 2014, 51, 158–172. [Google Scholar] [CrossRef]
  41. Liu, Z.; Chen, Q.; Xie, H. Influence of the farmer’s livelihood assets on livelihood strategies in the western mountainous area, China. Sustainability 2018, 10, 875. [Google Scholar] [CrossRef]
Figure 1. Schematic diagram of the influence of livelihood capital on livelihood strategies in the context of involuntary resettlement. Source: Created by the authors.
Water 14 04055 g001
Figure 2. The geographical location of the study area.
Water 14 04055 g002
Table 1. Evaluation indicator system of resettled households’ livelihood capital.
TypeMeasurement IndicatorIndicator Interpretation and Assignment
Natural capital
(N)
Per capita
cultivated area
Farmland area owned by family (mu)/total family population (person)
Cultivated
land quality
The overall evaluation of cultivated land quality by family members: very good = 1, good = 0.75, general = 0.5, poor = 0.25, very poor = 0
Human capital
(H)
Health statusAnnual medical expenditure of families (yuan)/annual total expenditure (yuan)
Labor force
quantity
Number of adults in labor force including family members aged 18–60
Education levelThe overall education level of family members: college degree or above = 1, high school or junior college = 0.75, junior high school or technical secondary school = 0.5, primary school = 0.25, illiterate = 0
Skill trainingTotal number of times that family members take skill training courses every year
Social
capital
(S)
Interpersonal
communication
The degree of harmony between family members and relatives, neighbors and friends: very good = 1, good = 0.75, general = 0.5, poor = 0.25, very bad = 0
Public affairs
participation
The frequency of family members participating in collective public affairs: often = 1, more = 0.75, generally = 0.5, occasionally = 0.25, never = 0
Social network supportWhen the family is faced with risks and difficulties, whether they can obtain support from their relatives and friends in terms of human, material and financial resources: yes = 1, no = 0
Village committee appointmentWhether a family member holds a position in the village committee: yes = 1, no = 0
Physical
Capital
(P)
Housing
situation
Considering the two factors of housing structure and per capita housing area. Housing structure: building = 1, brick concrete house = 0.75, stone brick house = 0.5, earth house = 0.25, dilapidated house = 0. Per capita housing area: more than 50 m2 = 1, 40–50 m2 = 0.75, 30–40 m2 = 0.5, 20–30 m2 = 0.25, less than 20 m2 = 0. Housing situation = housing structure * 0.5 + per capita housing area * 0.5
Means of
production and living
The number of production tools and durable goods owned by families, including TV sets, washing machines, refrigerators, air conditioners, range hoods, motorcycles, agricultural vehicles, cars, etc.
Infrastructure evaluationFamily members evaluated the resettlement site and surrounding infrastructure: very satisfied = 1, relatively satisfied = 0.75, generally = 0.5, relatively dissatisfied = 0.25, very dissatisfied = 0
Financial capital
(F)
Total
household
income
Total annual household income (yuan)
Financing
channels
Whether family members can borrow money from banks, governments, relatives, and friends: yes = 1, no = 0
Government
subsidies
Sum of government transferred annual income of family members receiving minimum living allowances, five guarantees, and elderly subsidies (yuan)
Family
demographic characteristics
Householder’s ageActual observation value (year)
Householder’s marriage statusMarried = 1, divorced = 2, unmarried = 3
Family sizeTotal household population (person)
Land disposal modeSelf-cultivation = 1, circulation = 2, abandonment = 3
Environmental geographical characteristicsResettlement modeDecentralized resettlement = 0, centralized resettlement = 1
Traffic conditions of resettlement siteVery bad = 0, poor = 0.25, generally = 0.5, better = 0.75, good = 1
Economic development level of resettlement siteVery bad = 0, poor = 0.25, generally = 0.5, better = 0.75, good = 1
Table 2. Sample location distribution.
RegionSample Site Number of Samples
Fuliang countyResettlement site 131
Resettlement site 345
Resettlement site 722
Resettlement site 918
Resettlement site 1018
Resettlement site 1421
Resettlement site 1639
Resettlement site 2120
Resettlement site 2427
Resettlement site 27227
Total468
Table 3. Basic characteristics of the survey sample households.
FeaturesCategoryNumberProportionFeaturesCategoryNumberProportion
GenderMale34072.64%MarriageUnmarried357.48%
Female12827.36%Married36377.56%
Age<25122.56%Divorced/Widowed7014.96%
25–4011725.00%ChildrenChildless5812.39%
40–6019942.52%=112927.57%
>6014029.92%≥228160.04%
EducationPrimary school14130.12%Source of livelihoodAgriculture-
oriented
21145.09%
Junior high school or technical secondary school24652.57%Migrant-
oriented
10522.44%
High school or junior college5912.61%Part-time
balanced
9420.09%
College degree or above224.70%Be unemployed5812.38%
Table 4. Evaluation results of the livelihood capital.
Capital TypeMeasurement IndicatorWeightMean Value
Natural capital (N)Per capita cultivated area0.5440.362
Cultivated
land quality
0.456
Human capital (H)Health status0.0980.480
Labor force quantity 0.134
Education level0.304
Skill training0.464
Social capital (S)Interpersonal communication0.1770.437
Public affairs participation0.209
Social network support0.209
Village committee appointment0.406
Physical capital (P)Housing situation0.2840.372
Means of production and living0.586
Infrastructure evaluation0.130
Financial capital (F)Total household income0.3980.443
Financing channels0.140
Government subsidies0.462
Livelihood capitalZ = N + H + S+P + F2.094
Data source: Research data calculation.
Table 5. Classification of livelihood strategies of resettled households.
Variable NameAgriculture-OrientedMigrant-OrientedPart-Time Balanced
Proportion of labor force0.980.950.70
Proportion of agricultural income0.700.210.34
Proportion of income from working and part-time work0.220.750.30
Proportion of subsidy
income
0.020.010.02
Proportion of other income0.050.030.23
Table 6. Binary logistic regression analysis of the impact of livelihood capital on the livelihood strategy.
Variable NameAgriculture-OrientedMigrant-OrientedPart-Time Balanced
BWaldExp (B)BWaldExp (B)BWaldExp (B)
Natural capital11.666 ***18.5572.708−0.0080.0010.3010.3751.2830.331
Human capital−2.29772.0642.702−0.230.0161.8375.372 ***15.4661.458
Social capital−2.2142.2601.43713.425 ***28.6752.5070.4360.2260.918
Physical capital0.3430.0232.267−2.2061.6181.5936.873 ***17.3481.65
Financial capital−4.638 **6.461.8257.226 ***15.4041.8410.561.5960.443
Constant term−10.60211.433.136−19.66326.8443.795−13.96830.5152.528
Note: **, and *** represent significance at the 5%, and 1% levels, respectively.
Table 7. Regression results of the impact of livelihood capital on livelihood strategy selection.
Variable NameMigrant-Oriented/Agriculture-OrientedPart-Time Balanced/Agriculture-Oriented
BStandard ErrorWaldExp (B)BStandard ErrorWaldExp (B)
Natural capital−1.118 **1.3430.6930.3270.9011.7450.2672.463
Human capital−0.3651.3820.0700.6941.477 ***1.8910.6104.379
Social capital0.0191.4600.0031.109−1.7626 **1.7611.0020.172
Physical capital−2.436 **2.1051.3400.0872.7972.7431.04016.393
Financial capital4.882 ***3.0302.533124.269−6.9966 **5.3061.7390.001
Constant term0.9920.8521.3552.6961.0811.1010.9642.949
Note: **, and *** represent significance at the 5%, and 1% levels, respectively.
Table 8. Regression results of the impact of livelihood capital subdivision variables on livelihood strategy selection.
Variable NameMigrant-Oriented/Agriculture-OrientedPart-Time Balanced/Agriculture-Oriented
BStandard ErrorWaldExp (B)BStandard ErrorWaldExp (B)
Characteristics of livelihood capitalNatural capitalPer capita cultivated area−7.278 **5.3251.868148.775−19.9878.1176.0620.065
Cultivated land quality−0.9120.8601.1240.402−0.2861.7810.0260.751
Human capitalHealth status−3.532 **4.3670.6540.0290.3997.2830.0031.490
Labor force quantity−0.6061.8850.1030.5467.055 ***5.2611.798118.348
Education level3.590 ***3.4351.0920.3282.810 **6.9730.16216.606
Skill training−0.5830.8040.5250.5580.9432.0850.2052.568
Social capitalInterpersonal communication−0.097 ***0.8660.6130.9078.488 ***3.3116.5742.938
Public affairs participation−0.4330.7220.3600.6481.5081.8100.6940.221
Social network support1.5121.5920.9024.5365.326 **4.3441.5030.005
Village committee appointment0.9001.0230.7752.460−3.1011.8392.8420.045
Physical capitalHousing situation−6.3722.1378.8880.00212.4956.1934.0710.002
Means of production and living−0.1001.6450.0040.904−2.2822.9540.5970.102
Infrastructure evaluation−0.2621.4650.0320.770−1.6004.0840.1540.202
Financial capitalTotal household income20.469 ***11.1523.369158.698−1.502 ***23.0780.0040.221
Financing channels1.0980.7911.9302.9990.7272.2100.1082.069
Government subsidies9.3861 *6.3122.2120.283−5.060 *9.7890.2670.006
Family
demographic characteristics
Householder’s age−0.1640.5250.0720.867−1.0981.02133.2040.334
Householder’s marriage status0.8401.2570.4222.257−0.5041.0740.2920.604
Family size−1.9791.9631.2040.1384.105 **3.3440.50356.824
Land disposal mode1.854 **1.8621.1035.3861.3740.8911.9803.950
Environmental geographical characteristicsResettlement mode−0.5810.8050.5260.599−1.5111.8300.6840.221
Traffic conditions of resettlement site2.580 ***2.2051.44012.1931.6791.6610.9865.361
Economic development level of resettlement site1.5141.6320.9524.5435.907 **4.3541.403347.508
Constant term0.7411.4510.2612.0985.9663.5472.829389.776
Note: *, **, and *** represent significance at the 10%, 5%, and 1% levels, respectively.
Publisher’s Note: MDPI stays neutral with regard to jurisdictional claims in published maps and institutional affiliations.

