Abstract
Energy dissipators, such as stilling basins, are usually required at the toe of stepped chutes to achieve adequate and safe operation of the spillway. Stepped chute hydraulics has been extensively studied in last several decades, however, only limited knowledge is available on the stilling basin performance below stepped chutes. In particular, the effect of the chute slope remains unknown, despite being a central design issue. Therefore, an experimental campaign was performed using a 30° or 50° inclined smooth or stepped chute with an adjacent conventional plain stilling basin. The experimental results indicated that, within the stilling basin, the surface characteristics and the roller as well as hydraulic jump lengths are practically independent of the chute slope. This further strengthens the previous findings that stepped chutes require 17% longer dimensionless jump lengths and consequently stilling basin lengths. The experimental results also confirmed that stepped chutes generated increased extreme and fluctuating bottom pressure characteristics at the stilling basin entrance area. With increasing chute slope, the latter were found to significantly magnify. However, such increased magnitudes were not expected to provoke cavitation damage as stepped chute inflows induced bottom aeration at the basin entrance, irrespective of the chute slope.
1. Introduction
In recent decades, stepped spillways became one of the preferred options of flood releasing facilities implemented in dams. This is, among others, due to the development of the Roller Compacted Concrete (RCC) construction technique. The latter leads to reduced costs, increased energy dissipation along the stepped chute (compared to conventional smooth chutes) and consequently to smaller energy dissipation structures at the spillway end. Extensive research was conducted on stepped chute hydraulics and several guidelines [1,2,3,4] resulted, further giving confidence in implementing such flood releasing facilities.
In spite of having an increased energy dissipation rate along the chute (as compared to conventional smooth chutes), adequately sized energy dissipators however should be provided at the stepped chute end, given that they only provide partial energy dissipation of the conveyed flow. The dissipation is typically not sufficient for a safe release into the downstream river [5]. Stilling basins are usually implemented, primarily due to the diversity of flow conditions encountered at the stepped chute ends, making them efficient energy dissipation devices.
To date only few studies investigated stilling basin performance below stepped chutes and no comprehensive design guidelines for these structures exist. The majority of the conducted studies focused on tailwater requirements, mean invert pressures and energy dissipation in the plain and USBR type III stilling basins [6,7,8,9]. The dynamic pressures acting on the plain stilling basin invert were investigated in [5,10,11]. These studies showed that stepped chute inflows enhance dynamic pressures acting at the stilling basin begin. Using detailed measurements of the flow surface fluctuations along with dynamic pressure measurements at the invert, [5] revealed that up to 17% higher dimensionless stilling basin lengths are required below stepped chutes as compared to smooth chutes. The latter was further confirmed by [12], who studied internal macroscopic air-water flow properties of a plain stilling basin below smooth and stepped chutes. Moreover, they reported increased bottom air concentrations at the stilling basin entrance downstream of stepped chutes indicating that they were better protected against cavitation than stilling basins downstream of smooth chutes. All of the above-mentioned studies were typically performed for a single chute slope and, as such, the effect of the stepped chute slope on the stilling basin performance remains open.
The present paper reports a systematic experimental study on the effect of chute slope on the plain stilling basin performance downstream of smooth and stepped chutes. The experimental results on stilling basin performance below 30°degree stepped chutes reported in [5,12] are expanded herein by analyzing an additional set of experimental data collected in a similar plain stilling basin below 50° smooth and stepped chutes. The analysis on the effect of chute slope will primarily focus on flow surface, roller and jump lengths, bottom pressure and bottom air concentration characteristics along the stilling basin, given that they are the most relevant parameters for design.
2. Materials and Methods
2.1. Physical Model
The spillway model, assembled at the Laboratory of Hydraulic Constructions (LCH) of the Ecole Polytechnique Fédérale de Lausanne (EPFL) in Switzerland, consisted of a: jet box at the chute inlet [13], prismatic smooth or stepped chute, and plain, prismatic, and horizontal stilling basin (Figure 1 and Figure 2).
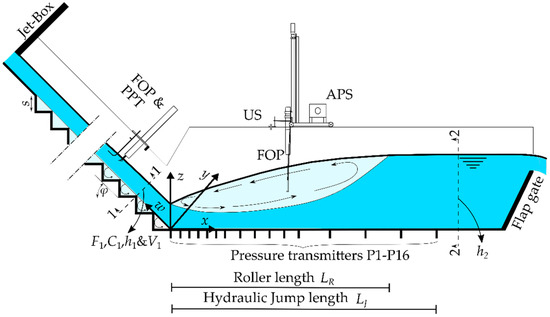
Figure 1.
Definition sketch with instrumentation, notations and nomenclature. FOP—Fiber optical probe; PPT—Pitot-Prandtl tube; US—Ultrasonic displacement meter; APS—Automatic positioning system.
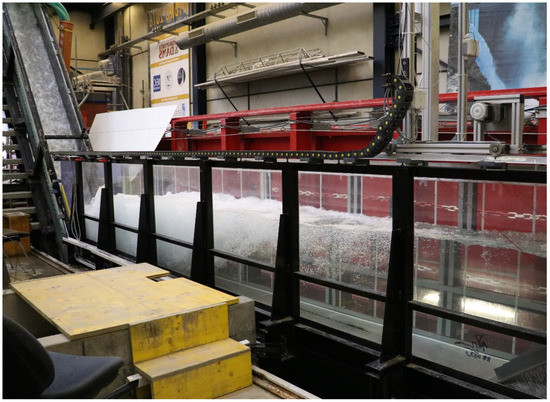
Figure 2.
Photo of the spillway model with Q = 0.14 m3/s, the 50° smooth chute in the background and the plain stilling basin at the front. Flow direction from left to right.
The chute channel was 0.5 m wide and 0.6 m deep. Its slope φ was constant and adjustable. Two slopes were tested, namely φ = 30° and φ = 50° with 6.0 and 4.8 m long chutes, respectively. The chute consisted of aluminum (right) and glass (left) sidewalls allowing flow observation. Its bottom was equipped with s = 0.06 m or s = 0.03 m high steps made out of folded stainless-steel sheets. The total number of s = 0.06 m high steps was 45 for 30° and 60 and 50° stepped chutes. For the smaller step height s = 0.03 m the latter numbers were doubled. The smooth chutes were built by placing 0.01 m thick PVC plates on top of the steps.
As smooth chutes resulted in non-aerated flow along the entire chute, flow aeration at the chute end was provoked by: (a) increasing the bottom roughness by installing a 4.0 m (φ = 30°) or 3.5 m (φ = 50°) long, 0.496 m wide and 0.0015 m thick metal grid on the smooth chute bottom and (b) pre-aerating the flow by supplying air into the jet-box and conserving the metal grid.
The chute channel released the flow in a 6.0 m (φ = 30°) or 6.5 m (φ = 50°) long and 0.5 m wide stilling basin channel built with 0.015 m thick aluminum plates as bottom, and acrylic sidewalls for flow observation. The stilling basin end was equipped with a flap gate to control the tailwater and thus the position of the hydraulic jump.
2.2. Instrumentation
An electromagnetic flowmeter ABB FXE 4000 (Baden, Switzerland) of ±0.5% accuracy full scale (FS), installed on a DN300 supply conduit of the jet-box, was used to measure the discharge Q.
The stilling basin approach flow conditions, i.e., the air-water flow properties at the chute end centerline, were derived using a fiber-optical probe (FOP, Figure 1, RBI Instrumentation, Grenoble, France) featuring two optical fibers with inline tips. The air-water flow properties, namely the local air concentration C and velocity V, were measured in three profiles (some 15–20 points per profile) close to the chute end, perpendicular to its (pseudo) bottom. The measurements were conducted at w = 0.260, 0.460 and 0.660 m distance for the smooth chute ends, and at the step edges 2, 3 and 4 for φ = 30° (i.e., w = 0.240, 0.360 and 0.480 m) or 3, 4 and 5 (i.e., w = 0.235 0.313 0.391 m) for φ = 50° (Figure 1). The sampling duration was 30 s at a frequency of 1 MHz. In low air content flow regions (i.e., C < 0.03), the velocity measurements were completed with a Pitot–Prandtl tube (PPT, Figure 1) with a 0.003 m tip diameter, linked to a differential pressure transducer Keller PD-33X (Winterthur, Switzerland) with an accuracy of 0.02% FS. The sampling duration was 60 s at a frequency of 30 Hz.
The air-water flow properties in the stilling basin were measured with an additional FOP, fixed on an automatic positioning system (APS), moving with an accuracy of 0.0001 m (Figure 1). These measurements were performed perpendicular to the basin invert at 15 equidistant profiles (40 points per profile) along its centerline. The measurements ranged within 0.1 ≤ x/LR ≤ 1.5, where LR is the roller length derived from the flow depth measurements (Section 4.1.2). At each profile, the measurements were conducted from 0.006 m distance to the bottom up to the free surface. The sampling duration was 60 s per point at a frequency of 30 Hz.
Flow depths along the basin centerline were measured with an ultrasonic distance sensor (US) Baumer UNAM 30U9103/S14 (Frauenfeld, Switzerland) with an accuracy of ±0.0005 m (Figure 1). The US sensor was fixed on an APS. The flow depths were collected at 24 points, ranging between 0.2 m ≤ x ≤4.9 m, for 328 s per point at 12.5 Hz.
Fluctuating bottom pressures along the stilling basin centerline were measured using sixteen piezo-resistive transmitters with a flush diaphragm (Keller Series 25,Zurich, Switzerland) installed in the stilling basin invert (Figure 1). They had a measuring range of ±1 bar with an accuracy of 0.1% FS. Pressures were collected simultaneously during 393 s at a sampling rate of 1 kHz.
Further information about the instrumentation as well as the detailed measuring procedure can be found in [5,12,14].
3. Test Program and Inflow Conditions
Test program included eighteen runs with smooth and twelve with stepped chute inflows (Table 1). Based on the air-water flow measurements conducted at the chute end, the equivalent clear water flow parameters were deduced in order to quantify the approach flow conditions and subsequently use them for the stilling basin analysis. These included: (1) the inflow equivalent clear-water depth h1 = (1 − C1)y90, (2) the inflow mean water velocity V1 = q/h1, (3) the inflow Froude number F1 = V1/(gh1)0.5, (4) the inflow Reynolds number R1 = q/ν, (5) the inflow Weber number W1 = (ρV12h1)/σ, (6) critical flow depth hc = (q2/h1)1/3, and (7) kinetic energy correction coefficient α, with C1 as the mean (depth-averaged) air concentration at the inflow section as [15,16]:
where y90 is the characteristic flow depth defined up to y(C = 0.90), g as gravitational acceleration, ν as the kinematic viscosity of water, ρ as the water density and σ as the air-water surface tension.

Table 1.
Test program. SM = smooth chute; R = roughened with grid; PA = roughened with grid and pre-aeration; ST = stepped chute; s = step size.
The reference section for the stilling basin analysis, i.e., inflow Section 1-1 (Figure 1), was the most downstream measured section near the chute end, namely step edge 3 (50°) or 2 (30°) for stepped chutes, and at w = 0.240 for smooth chutes (30° or 50°).
The smooth chute tests (Runs 1–9 and 16–24, Table 1) included two chute slopes of φ = 30° and 50°, each with three discharges of q ≈ 0.20, 0.28 and 0.36 m2/s. To assess the effect of approach flow aeration on the stilling basin performance, air concentrations C1 at the inflow section were varied between 0.15 ≤ C1 ≤0.37. The lowest values of C1 ≈ 0.16 (Runs 6–9 and 22–24, Table 1) practically correspond to black-water at the stilling basin entrance. The latter was achieved for a smooth chute without bottom roughness or flow pre-aeration. Self-aeration of the flow upstream of the stilling basin entrance was provoked by roughening the bottom, resulting in C1 ≈ 0.26 (φ = 30°, Runs 4–6, Table 1) and C1 ≈ 0.28 (φ = 50°, Runs 19–21, Table 1). The highest approach flow aeration of C1 ≈ 0.32 (φ = 30°, Runs 1–3, Table 1) and C1 ≈ 0.36 (φ = 50°, Runs 16–18, Table 1) was achieved with a roughened smooth chute bottom combined with the jet-box pre-aeration. Detailed analysis of 30° smooth chute inflows is given in [5]. The air concentration profiles measured at the inflow section for 50° smooth chutes are shown in Figure 3a. They are compared with the advective diffusion model [17] and, similarly to 30° smooth chutes [5], showed a good agreement. The dimensionless velocity V/V90 profiles, with V90 as the velocity at y(C = 0.90), measured at the inflow section for 50° smooth chutes are shown in Figure 3b. They are approximated by:
with N = 12.9 and a coefficient of determination of R2 = 0.92. The velocity profiles were almost similar to those measured for the 30° smooth chute inflows [5], as indicated by the similar exponent (N = 12.6 for the 30° smooth chutes).

Figure 3.
(a) Air concentration profiles at the inflow section for the 50° smooth chute (Runs 16–24, Table 1) and comparison with (—) advective diffusion model [17] with C1 = 0.16, 0.29 and 0.36, and (b) Dimensionless velocity V/V90 profiles at the inflow section for the 50° smooth chute (Runs 16–24, Table 1) and comparison with (—) Equation (2).
The stepped chutes tests (Runs 10–15 and 25–30, Table 1) included two chute slopes of φ = 30° and 50° systematically investigated for three unit discharges q ≈ 0.20, 0.28 and 0.36 m2/s. They corresponded to skimming flow with 2.7 ≤ hc/s ≤ 7.94. Quasi-uniform approach flow conditions were attained at the 30° stepped chute end with C1 ≈ 0.41 [5]. Detailed analysis of 30° stepped chute approach flows is given in [5]. The air concentration profiles measured at the inflow section for 50° stepped chutes are shown in Figure 4a. The measured range of C1 and the shape of the air concentration profiles for different tests at the inflow section (Figure 4a) suggest that quasi-uniform flow was not fully attained at the stepped chute end for all 50° stepped chutes tests. This is shown in Figure 5, where measured values of C1 are compared to the quasi-uniform mean air concentration values Cu of [18] for the same chute slope and range of relative critical depths. For lower relative critical depths, i.e., hc/s = 2.71 and 3.36 (Runs 25 and 26, Table 1), the flow conditions at the chute end were practically quasi-uniform with C1/Cu ≈ 0.95 (Figure 5). On the other hand, for higher relative critical depths, i.e., for 3.97 ≤ hc/s ≤ 7.94 (Runs 27–30, Table 1), gradually varied flow conditions were attained. The advection diffusion model [17] well described the measured air concentration profiles, excepted close to the pseudo-bottom (Figure 4a). The dimensionless velocity V/V90 profiles at the inflow section (Figure 4b) follow Equation (2) with N = 4.9 (R2 = 0.87). Similarly to the results of other studies on steep chutes (e.g., [18,19]), a lower N was obtained as compared to 30° stepped chutes (N = 5.5 [5]).
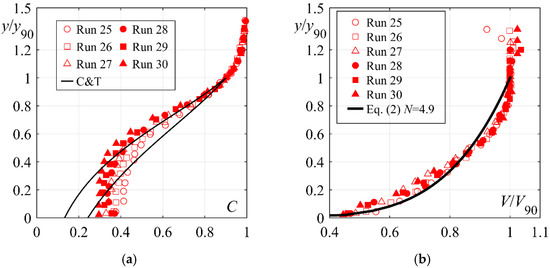
Figure 4.
(a) Air concentration profiles at the inflow section for 50° stepped chute tests (Runs 25–30, Table 1), comparison with (―) advective diffusion model [17] with C1 = 0.55 and 0.46, and (b) Dimensionless velocity V/V90 profiles at the inflow section for 50° stepped chute test runs (Runs 25–30, Table 1), comparison with (—) Equation (2).
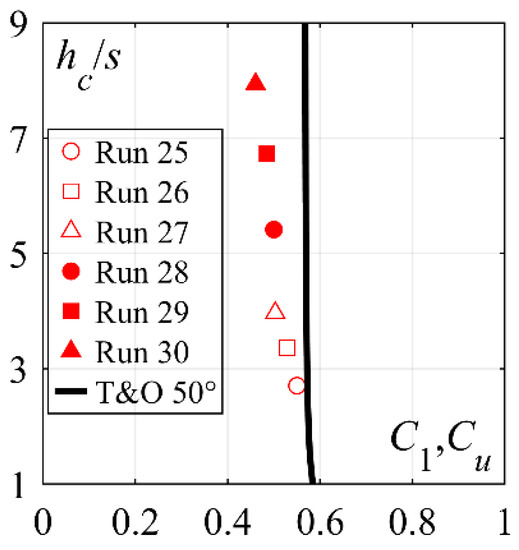
Figure 5.
Comparison between measured mean air concentrations C1 at 50° stepped chute inflow section (Runs 25–30, Table 1) and quasi-uniform values Cu of [18]. Note: T&O is Takahashi and Ohtsu [18].
4. Results and Discussion
4.1. Free Surface Characteristics
4.1.1. Mean Flow Depths
A typical streamwise development of the mean (time-averaged) flow depth η (from US measurements) along the stilling basin for 50° smooth (Run 22) and stepped (Run 25) chute inflows is shown in Figure 6a and compared to the mean flow depth development for 30° smooth (Run 7) and stepped (Run 10) inflows for similar unit discharge q, step size s and smooth chute inflow aeration C1. The mean flow depths streamwise increased reaching a maximum in the “boiling” zone, herein defined as the roller length LR,η (Figure 6a). Downstream of the roller end, i.e., at x > LR,η, the flow depths decreased reaching a quasi-constant tailwater depth h2. As one may expect, higher approach flow Froude numbers F1 at the 50° smooth and stepped chute ends (as compared to 30° chutes) resulted in higher mean flow depths η and longer jump rollers LR,η for quasi-similar unit discharge q.
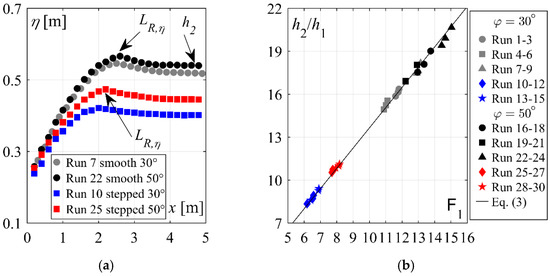
Figure 6.
(a) Streamwise mean flow depths η along the stilling basin, and (b) Sequent depth ratio h2/h1 as a function of the approach Froude number F1; (—) Equation (3); [Runs 1–9: 30° smooth chute, Runs 10–15: 30° stepped chute, Runs 16–24: 50° smooth chute, Runs 25–30: 50° stepped chute].
In Figure 6b the measured sequent depth ratio h2/h1 is plotted against F1, including the values for 30° and 50° chutes. They are compared to the basic solution of momentum conservation equation for classical hydraulic jumps:
showing a good agreement. Accordingly, for a given F1, the sequent depth ratio is practically independent of the approach flow conditions (except F1) or chute slope φ. These results further strengthen the conclusions [5] that using equivalent clear-water parameters at the chute end lead to a fairly accurate prediction of the sequent depth ratio using the classical momentum principle. As mentioned in [5], these results indicate that Equation (3) is applicable even if the flow enters at a significant angle with the horizontal, which would not be expected a priori, because Equation (3) was derived for horizontal approach flows. Nevertheless, these results are in line with observations [20] for smooth chute inflows.
The dimensionless mean flow depths Z = (η − h1)/(h2 − h1) along the jump roller for 50° smooth and stepped chute approach flows are shown in Figure 7a,b, and compared to dimensionless flow depth data obtained with 30° smooth and stepped chute inflows. It can be seen that no major effect of the chute slope φ on the development of the mean flow depths Z occurred. Similarly to the 30° chutes [5], the dimensionless mean flow depths for 50° chutes are found to be higher below stepped chutes within the first half of the roller, i.e., x/LR,η ≤ 0.5, as compared to smooth chutes, which is attributed to the relatively higher approach flow depth after stepped chutes. As such, the mean flow depths over the jump roller can be described with the self-similar function [5]:
with coefficients a = 1.07 and b = 0.39 for smooth chute approach flows and a = 1.07 and b = 0.32 for stepped chute approach flows, irrespective of the chute slope φ.
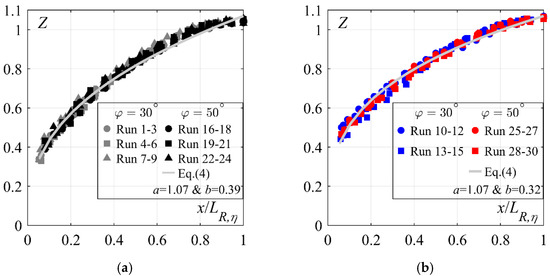
Figure 7.
Dimensionless flow depths Z along the jump roller for 30° and 50°: (a) smooth and (b) stepped chute inflows; (—) Equation (4); [Runs 1–9: 30° smooth chute, Runs 10–15: 30° stepped chute, Runs 16–24: 50° smooth chute, Runs 25–30: 50° stepped chute].
4.1.2. Roller Length
The dimensionless roller lengths LR/h2 for 50° (black symbols) smooth (Runs 16–24) and stepped (Runs 25–30) chute inflows, obtained from flow depth measurements LR,η and visual observations LR,D, are plotted against the F1 in Figure 8a and compared to the dimensionless roller lengths obtained with 30° (gray symbols) smooth (Runs 1–9) and stepped (Runs 10–15) chute inflows. One can notice that the dimensionless roller lengths LR,η/h2 (full symbols) are practically independent of the approach flow conditions or chute slope φ with a typical value of LR,η ≈ 5.0h2. Similarly to the conclusions made in [5], the visually observed roller lengths (open symbols) are consistently shorter, with typical values of LR,η ≈ 4.6h2.
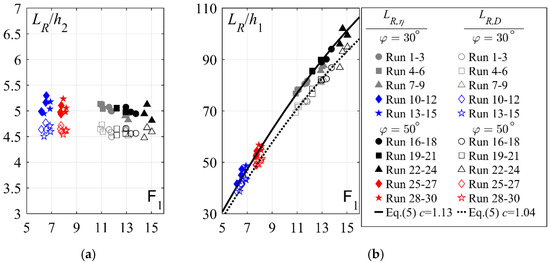
Figure 8.
Roller lengths obtained from ultrasonic displacement meter measurement LR,η and visual observation LR,D plotted against F1 as: (a) LR/h2 and (b) LR/h1; (− −) Equation (5); [Runs 1–9: 30° smooth chute, Runs 10–15: 30° stepped chute, Runs 16–24: 50° smooth chute, Runs 25–30: 50° stepped chute].
In Figure 8b the roller lengths are plotted in dimensionless form as LR,η/h1 and compared with the roller length prediction developed by [5]:
with c = 1.13 and 1.04 for measured LR,η and visually observed LR,D roller lengths, respectively. As can be noticed, the agreement is good. The resulting coefficient of determination for measured LR,η and visually observed LR,D roller lengths are R2 = 0.92 and R2 = 0.99, respectively.
4.1.3. Flow Depth Fluctuations and Jump Length
A typical streamwise development of flow depth fluctuations η’ (characterized by the standard deviation of US readings) along the stilling basin for 50° smooth (Run 22) and stepped (Run 25) inflows are shown in Figure 9a, and compared to the flow depth fluctuation development for 30° sloping smooth (Run 7) and stepped (Run 10) approach flows for similar unit discharge q, step size s and smooth chute approach flow aeration C1. Irrespective of the chute slope, the surface fluctuations along the hydraulic jump showed a monotonic decrease in the streamwise direction. As expected, higher approach F1 at the 50° chute end, as compared to 30° chutes, resulted in higher flow depth fluctuations.
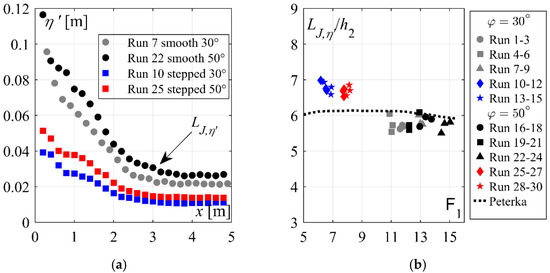
Figure 9.
(a) Streamwise flow depth fluctuations η’ along the stilling basin (Table 1) and (b) Dimensionless jump lengths LJ,η’ obtained from flow depth fluctuations η’ as a function of the inflow Froude number F1, compared to jump length prediction of [20]; [Runs 1–9: 30° smooth chute, Runs 10–15: 30° stepped chute, Runs 16–24: 50° smooth chute, Runs 25–30: 50° stepped chute].
The hydraulic jump length with respect to the surface fluctuations LJ,η’ was deduced using the criteria introduced in [5], namely as the distance from the jump toe to the section where the surface fluctuations η’ are 1.1 times those measured in the tailwater zone. The resulting dimensionless jump lengths LJ,η’/h2 downstream of 50° smooth and stepped chutes are plotted in Figure 9b against F1, and compared with dimensionless jump length values obtained downstream of 30° smooth and stepped chutes and jump length prediction [20]. The jump lengths after smooth chutes were between 5.5 ≤ LJ,η’/h2 ≤ 6.1, with an overall average value of LJ = 5.8h2, in agreement with the recommendations of [20]. The hydraulic jumps occurring after stepped chutes consistently required an increased flow length x/h2, namely 6.5 ≤ LJ,η’/h2 ≤ 7.0 with an overall average value of LJ,η’/h2 = 6.7h2. The chute slope had no major effect on the dimensionless jump lengths LJ,η’/h2. These results further support the conclusion [5] that hydraulic jumps formed below stepped chutes required a longer normalized distance x/h2 than those formed below smooth chutes.
Figure 10 shows the streamwise development of the surface fluctuation coefficient CH′ = η′/HK with HK = αV12/(2 g), plotted against the normalized streamwise coordinate x/LJ,η’ for all tests. The maximum fluctuation coefficients were observed in the vicinity of the jump toe, caused by the intense splashing [5]. Further downstream, the surface fluctuation coefficients tended to rapidly reduce, attaining quasi-constant values of CH’ ≈ 0.01 in the tailwater zone. No major effect of approach flow conditions or chute slope φ on the streamwise development of CH’ occurred. These results suggest that the surface fluctuations were mainly governed by the approach flow kinetic energy HK. As such the streamwise development of CH’ for 50° chutes can be described using the same equations developed for 30° chute inflows [5]:
with R2 = 0.57 and 0.97 for Equations (6) and (7), respectively.
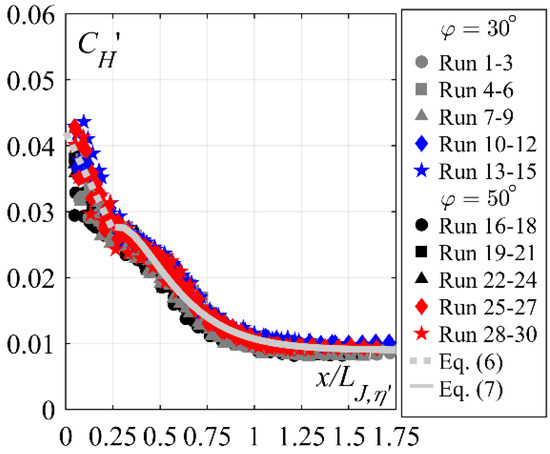
Figure 10.
Streamwise development of the flow depth fluctuation coefficient CH’ versus the normalized streamwise coordinate x/LJ,η’ for 30° and 50° smooth and stepped chute tests; (− −) Equation (6), (—) Equation (7); [Runs 1–9: 30° smooth chute, Runs 10–15: 30° stepped chute, Runs 16–24: 50° smooth chute, Runs 25–30: 50° stepped chute].
4.2. Bottom Pressure Characteristics
4.2.1. Streamwise Pressure Distribution and Jump Length
Based on the simultaneous pressure measurements conducted at 16 points (Figure 1), the dynamic pressure parameters used for assessment of hydrodynamic loads acting on the stilling basin invert [5] were derived. These include: (1) time-averaged pressure pm, (2) fluctuating pressure characterized by standard deviation p’, (3) extreme maximum pressure pmax and corresponding 99.9th percentile p99.9, (4) extreme minimum pressure pmin and corresponding 0.1th percentile p0.1, (5) skewness as where pi is the pressure at a given instant and n is the number of samples, and (6) excess kurtosis defined as A typical streamwise bottom pressure development for 50° chutes is shown in Figure 11 (Run 22, smooth chute).
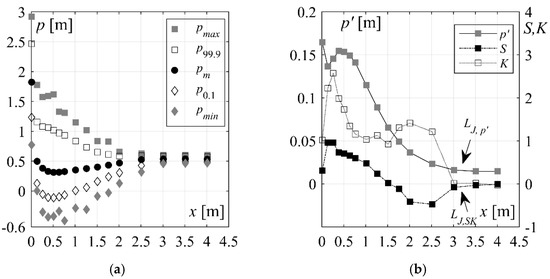
Figure 11.
Streamwise pressure distribution (Run 22, smooth chutes, Table 1) of: (a) extreme maximum pmax, 99.9% probability p99.9, mean pm, 0.1% probability p0.1, and extreme minimum pressure pmin, and (b) fluctuating pressure p’, skewness S and excess kurtosis K.
Based on criteria established in [5], the hydraulic jump lengths LJ with respect to bottom pressures LJ,p′ and LJ,SK were derived, namely as: (1) LJ,p′ distance from the jump toe to the section where pressure fluctuations p′ are 1.1 times those measured in the tailwater zone, and (2) LJ,SK as a distance from the jump toe to the section where the pressure distribution followed a normal probability density function with skewness S and excess kurtosis K tending to zero (Figure 11b). The resulting jump lengths are plotted as LJ/h2 in Figure 12 against F1, along with jump lengths obtained with flow depth measurements LJ,η′/h2 (Figure 9). The pressure measurements indicated a similar range of dimensionless jump lengths as the flow depth measurements. The overall average values for smooth and stepped chutes were LJ/h2 = 5.8h2 and LJ/h2 = 6.7h2, respectively. Moreover, if comparing the dimensionless jump lengths downstream of 30° and 50° chutes (Figure 12) it became noticeable that no major effect of the chute slope φ on the dimensionless jump length occurred. These results show that hydraulic jumps initiated below stepped chutes required an increased length x/h2, as compared to those below smooth chutes.
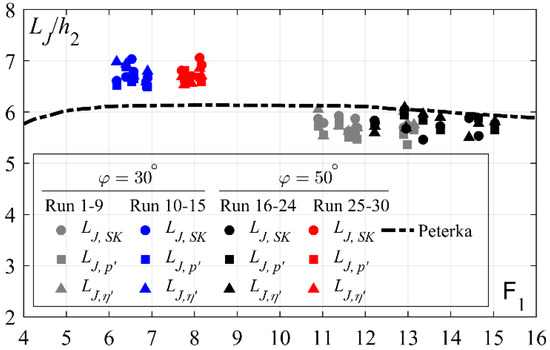
Figure 12.
Dimensionless jump lengths LJ/h2 downstream of 30° and 50° smooth and stepped chutes from pressure (LJ,p′ and LJ,SK) and flow depth (LJ,η′/h2) measurements, plotted against the inflow Froude number F1; (− −) [20]; [Runs 1–9: 30° smooth chute, Runs 10–15: 30° stepped chute, Runs 16–24: 50° smooth chute, Runs 25–30: 50° stepped chute].
To describe and conduct a comparative analysis of streamwise pressure distributions, the following pressure coefficients are introduced [5]: (1) mean coefficient Pm = (pm − h1)/(h2 − h1), (2) fluctuation coefficient CP’ = p’Hk−1, (3) extreme maximum coefficient CPmax = (pmax − pm)Hk−1, (4), 99.9th percentile coefficient CP99.9 = (p99.9 − pm)Hk−1, (5) extreme minimum coefficient CPmin = (pm − pmin)Hk−1 and (6) 0.1th percentile coefficient CP0.1 = (pm − p0.1)Hk−1. In Figure 13a–h, the streamwise development of bottom pressure coefficients Pm, CP’, CPmax, CP99.9, CPmin, CP0.1, S and K downstream of 50° smooth and stepped chutes are plotted against the normalized streamwise coordinate XJ = x/LJ. The latter bottom pressure coefficient developments for 30° chutes can be found in [5]. In following sub-chapters, the effect of chute slope on the streamwise development of bottom pressure coefficients is detailed.
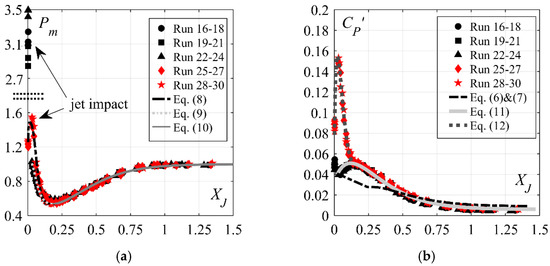
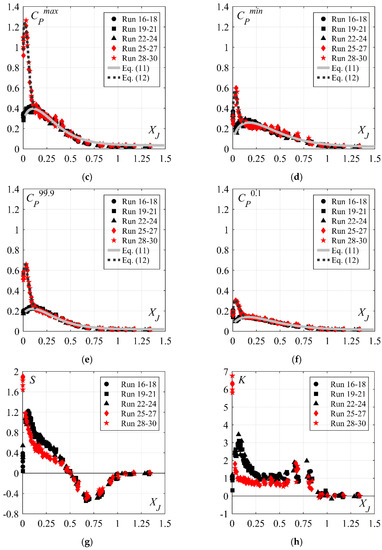
Figure 13.
Streamwise distribution of: (a) mean pressure coefficient Pm, (b) pressure fluctuation coefficient CP’, (c) maximum pressure coefficient CPmax, (d) 99th percentile coefficient CP99.9, (e) minimum pressure coefficient CPmin, (f) 0.1th percentile coefficient CP0.1, (g) skewness S, and (h) excess kurtosis K; (—) Equations (10) and (11); (− −) Equations (6)–(9) and (12); [Runs 16–24: 50° smooth chute; Runs 25–30: 50° stepped chute].
4.2.2. Streamwise Distribution of Mean Pressure
The streamwise development of dimensionless mean pressure Pm downstream of the 50° chutes, similarly to the 30° chutes [5], indicated the following flow zones (Figure 13a):
- deflection zone along 0 ≤ XJ ≤ 0.18, characterized by increased mean pressures due to the impact and flow curvature
- transition zone along 0.18 < XJ < 1, where mean pressures qualitatively follow the flow depths, and
- tailwater zone along XJ ≥ 1, where mean pressures are quasi-hydrostatic.
The development of the mean pressure coefficients Pm for 30° and 50° smooth and stepped chutes are compared in Figure 14a,b, respectively.
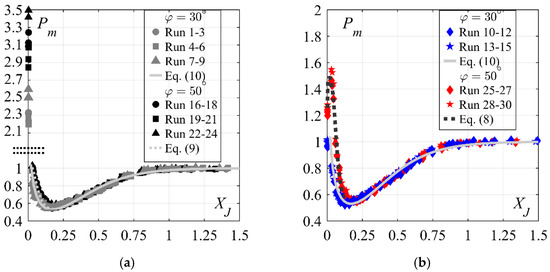
Figure 14.
Streamwise distribution of mean pressure coefficients Pm downstream of 30° and 50°: (a) smooth chutes, and (b) stepped chutes; (—) Equation (10); (− −) Equations (8) and (9); [Runs 1–9: 30° smooth chute, Runs 10–15: 30° stepped chute, Runs 16–24: 50° smooth chute, Runs 25–30: 50° stepped chute].
Comparing the mean pressure development for smooth chute inflows (Figure 14a), a clear effect of chute slope φ within the flow deflection zone was visible. At the flow deflection point, i.e., at the jump toe XJ ≈ 0, up to 60% higher dimensionless mean pressures Pm are observed downstream of 50° smooth chutes, as compared to those downstream of 30° smooth chutes.
Further downstream, within 0 ≤ XJ ≤ 0.18, the mean pressure with 50° smooth chutes decreases in a similar manner as on 30° smooth chutes, however, with slightly higher magnitudes caused by stronger flow curvature due to the more abrupt slope change. The local minimum below 50° smooth chutes is observed at XJ ≈ 0.18, where flow curvature greatly reduced, and beyond which the dimensionless mean pressure magnitudes coincide with those of 30° smooth chutes along the remaining part of the stilling basin, i.e., in the transition and tailwater zone. The influence reach of the flow curvature was thus somewhat longer below 50° smooth chutes, i.e., 0 ≤ XJ ≤ 0.18, as compared to those after 30° smooth chutes, i.e., 0 ≤ XJ ≤0.15 [5].
The effect of chute slope within the flow deflection zone was even more pronounced downstream of stepped chute inflows (Figure 14b). The streamwise position of the maximum mean pressures downstream of 50° stepped chutes was observed further downstream, i.e., at XJ ≈ 0.04, as compared to 30° stepped chute inflows at XJ ≈ 0. The maximum Pm magnitudes downstream of 50° stepped chutes were up to 60% higher than maximum Pm magnitudes observed downstream of 30° stepped chutes or two times higher for the similar streamwise position, i.e., XJ ≈ 0.04.
The relative downstream shift of the maximum mean pressure position after 50° stepped chute can be explained with the smaller impact area of the internal jet (typical of stepped chute flows) close to the jump toe. As observed by [18], the impact region of the internal jet decreased with increasing chute slope. Therefore, for the 30° chutes, a major portion of the incoming flow was “deflected” towards the inner part of the last step cavity (i.e., upstream of the first pressure sensor P1, Figure 1) resulting in a concentrated flow impact at the jump toe, i.e., at XJ ≈ 0. For the 50° chutes, only a small portion of the flow impacted near the jump toe (i.e., fictitious step edge) resulting in the more concentrated impact further downstream, i.e., at XJ ≈ 0.04. Downstream of the flow deflection point, within 0.04 < XJ ≤ 0.18, the mean pressures below 50° stepped chutes decreased in a similar manner as below 30° chutes, however with higher magnitudes caused by stronger flow curvature (Figure 14b). The mean pressure coefficients reached a local minimum at XJ ≈ 0.18, after which they coincide with 30° stepped chute inflows along the entire remaining stilling basin reach.
Comparing the maximum mean pressures coefficients downstream of the 50° chute (i.e., at XJ ≈ 0 for smooth and XJ ≈ 0.04 for stepped chutes), one can notice up to 2.5 times higher magnitudes below smooth chute as compared to those below stepped chute (Figure 13a). As the mean pressure at this point was mainly governed by the approach flow kinetic energy [5], the mean pressure at the flow deflection point pdef was normalized with the approach flow kinetic energy HK. The resulting mean pressure coefficients CPdef = pdef/HK are shown in Figure 15, along with CPdef values for 30° chute. In case of the 50° chute, the mean pressures at the flow deflection point were, on average, 41% and 58% of the corresponding approach flow kinetic energy for smooth and stepped chutes. As detailed in [5], the higher magnitudes downstream of smooth chutes were caused by its lower approach flow depth, resulting in a more concentrated impact. Furthermore, the pressure coefficients CPdef are approximately 20% higher below 50° smooth and stepped chutes, as compared to the corresponding ones for 30° chutes (Figure 15). This is clearly caused by the “sharper” angle of the flow impact.
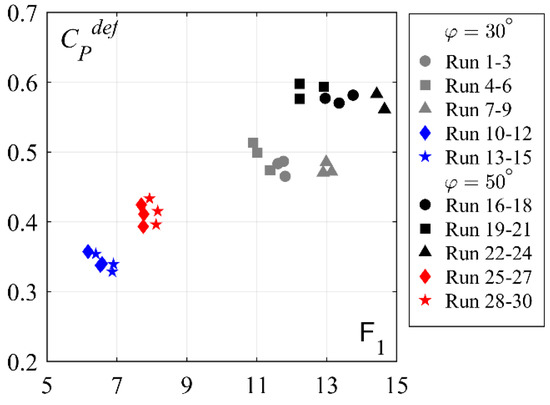
Figure 15.
Mean pressure coefficients CPdef against inflow Froude number F1; [Runs 1–9: 30° smooth chute, Runs 10–15: 30° stepped chute, Runs 16–24: 50° smooth chute, Runs 25–30: 50° stepped chute].
As a result of a slightly shifted flow deflection point, the 50° stepped chute indicated slightly higher Pm magnitudes within 0.05 ≤ XJ < 0.12, as compared to 50° smooth chute (Figure 13a). Further downstream, i.e., XJ ≥ 0.12, the mean pressure coefficients were practically independent of the approach flow conditions. The pronounced mean pressures in the flow deflection zone below 50° stepped (R2 = 0.97) and smooth (R2 = 0.95) chutes can be described as (Figure 13a):
Further downstream, in the transition and tailwater zones, the streamwise distribution of mean pressures for 50° sloping smooth and stepped chutes can be estimated using the same equation developed for 30° smooth and stepped chutes by [5] (Figure 13a):
Finally, no major effect of the step size s or the smooth chute inflow aeration C1 on the streamwise mean pressure distribution occurred.
4.2.3. Streamwise Distribution of the Pressure Fluctuation
The 50° sloping smooth chute approach flows (Figure 13b) showed a typical streamwise pressure fluctuation CP’ development (e.g., [21,22,23]). The pressure fluctuations increased downstream of the jump toe reaching maximum values of CP’ ≈ 0.05 at XJ ≈ 0.12. Further downstream, they monotonically decreased towards quasi-constant tailwater magnitudes. Due to the flow deviation at the jump toe (XJ = 0), the pressure fluctuations reached or exceed the magnitudes observed at XJ ≈ 0.12. No major effect of approach flow aeration C1 on the streamwise development of CP’ occurred.
The streamwise development of the pressure fluctuation coefficients CP’ for 50° and 30° smooth chutes are compared in Figure 16a. No considerable effect of the chute slope φ on the pressure fluctuation development occurred.
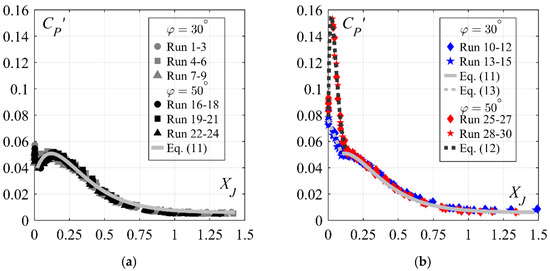
Figure 16.
Streamwise development of pressure fluctuation coefficient CP’ for 30° and 50°: (a) smooth chute, and (b) stepped chute; (—) Equation (11); (− −) Equations (12) and (13); [Runs 1–9: 30° smooth chute, Runs 10–15: 30° stepped chute, Runs 16–24: 50° smooth chute, Runs 25–30: 50° stepped chute].
Comparing the pressure fluctuation development (Figure 13b), the effect of stepped chute approach flows becomes evident. At the jump toe, up to 40% higher pressure fluctuation coefficients could be observed, as compared to 50° smooth chute approach flows, reaching up to CP’ = 0.09 (Figure 17). Downstream of the jump toe, the fluctuation magnitudes sharply increased reaching maximum values of CP’ = 0.15 at XJ ≈ 0.04. These values are up to 3 times higher as compared to the maximum values observed for smooth chute approach flows (Figure 13b and Figure 17). To further illustrate the severeness of pressure fluctuations downstream of stepped chute at this location, the absolute values of the pressure fluctuations p′ are compared for smooth (Run 24) and stepped chute (Run 30) inflows in Figure 18 with similar unit discharge of q ≈ 0.360 m2/s. Despite the significantly higher inflow Froude number F1 for the smooth chute inflow (F1 ≈ 14), as compared to stepped chute inflow (F1 ≈ 8), the absolute values of pressure fluctuations p′ downstream of stepped chute were about 50% higher at the flow deflection point, as compared to the maximum values observed with smooth chute approach flow (i.e., in the zone of maximum pressure fluctuations at XJ ≈ 0.12). This shows that pronounced pressure fluctuations downstream of stepped chute are caused by the higher turbulence levels of the approaching flow, as compared to smooth chute approach flows. Downstream of the flow deflection point, i.e., XJ > 0.04, the pressure fluctuation coefficients monotonically decreased up to XJ ≈ 0.13, after which they coincided with smooth chute approach flows magnitudes over the entire stilling basin reach (Figure 13b). No considerable effect of step size s occurred.
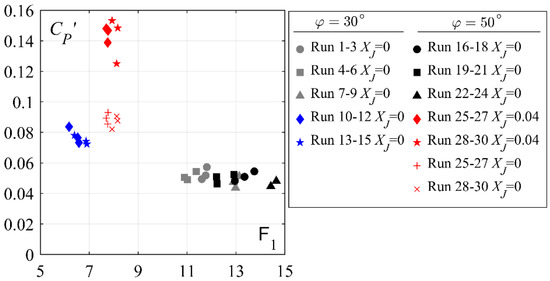
Figure 17.
Pressure fluctuation coefficients CP’ at the flow deflection point and the jump toe against inflow Froude number F1; [Runs 1–9: 30° smooth chute, Runs 10–15: 30° stepped chute, Runs 16–24: 50° smooth chute, Runs 25–30: 50° stepped chute].
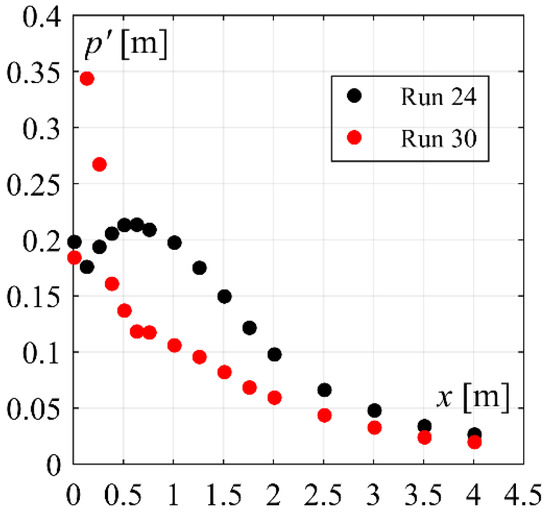
Figure 18.
Streamwise development of bottom pressure fluctuations p′ for Run 24 (50°, smooth chute) and Run 30 (50°, stepped chute chute).
The streamwise development of CP’ for 50° and 30° stepped chute approach flows are compared in Figure 16b. A major effect of the chute slope could be noticed. As a result of the relative downstream shift of the flow deflection point, the maximum pressure fluctuations for 50° stepped chutes occurred further downstream (XJ ≈ 0.04), as compared to the 30° chutes (XJ ≈ 0). At this point, up to 2 times higher CP’ magnitudes were observed, as compared to those of 30° stepped chute at the flow deflection point (XJ ≈ 0) (Figure 16b and Figure 17). Apart from the flow deflection point, the 50° stepped chute tended to increase the pressure fluctuations at the jump toe as well, with up to 30% higher CP’ magnitudes (Figure 16b and Figure 17). Downstream of the flow deflection point (XJ ≈ 0.04), as previously mentioned, the pressure fluctuations monotonically decreased and reached the 30° chute magnitudes at XJ ≈ 0.13, beyond which they coincided along the remaining downstream reach of the stilling basin.
The pressure CP’ and surface fluctuation CH′ are also compared in Figure 13b (only Equations (6) and (7) are included for clarity). As expected, the surface fluctuations were lower than the corresponding pressure fluctuations within the first half of the hydraulic jump, i.e., XJ < 0.5. As for the 30° chute inflows [5], they coincided at XJ ≈ 0.5. At this point, the skewness of the pressure readings reached negative values, indicating a detachment of the bottom jet flow [5] (Figure 13g). The skewness values attended minimal values at XJ ≈ 0.75, beyond which they tended towards zero in the tailwater zone.
4.2.4. Streamwise Distribution of Extreme Pressures
The extreme pressure coefficients CPmax and CPmin downstream of 50° chute showed a similar streamwise distribution as the previously described pressure fluctuations (Figure 13c,d).
The 50° sloping smooth chute approach flows revealed an increase in extreme pressure coefficients downstream of the jump toe, reaching maximum magnitudes of CPmax = 0.42 and CPmin = 0.29 at XJ ≈ 0.12 and XJ ≈ 0.18, respectively. Further downstream, they decreased attaining quasi-constant tailwater magnitudes. As a result of the flow deflection, the extreme pressure coefficients were of the same order of magnitudes at the jump toe, i.e., CPmax ≈ CPmin ≈0.32 (Figure 13c and Figure 20). In Figure 19a,c, the streamwise development of extreme pressure coefficients for 30° and 50° smooth chutes are compared, showing that the chute slope φ had no considerable effect.
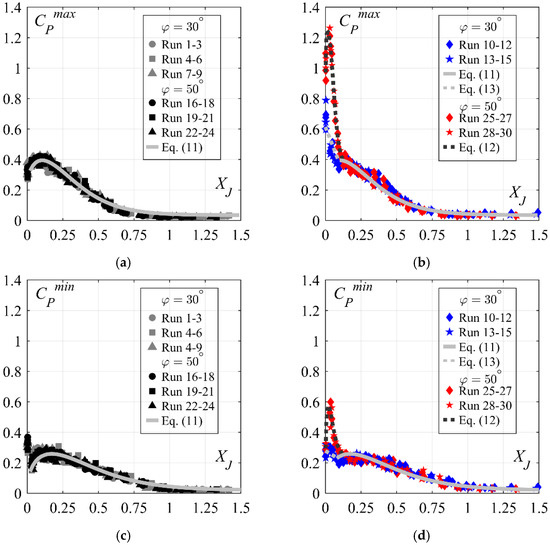
Figure 19.
Streamwise development of extreme pressure coefficients: (a) CPmax for 30° and 50° smooth chutes, (b) CPmax for 30° and 50° stepped chutes, (c) CPmin for 30° and 50° smooth chutes, and (d) CPmin for 30° and 50° stepped chutes; (—) Equation (11); (− −) Equations (12) and (13); [Runs 1–9: 30° smooth chute, Runs 10–15: 30° stepped chute, Runs 16–24: 50° smooth chute, Runs 25–30: 50° stepped chute].
In Figure 19b,d, the streamwise development of extreme pressure coefficients for 30° and 50° stepped chutes are compared. The 50° stepped chute approach flows produced up to three times higher extreme maximum pressure coefficients CPmax at the flow deflection point (i.e., XJ ≈ 0.04, Figure 13c), as compared to the 50° smooth chute, or up to two times higher compared to 30° stepped chute (Figure 19b). These values reached up to CPmax ≈ 1.26 (Figure 13c and Figure 20). Similarly, to the pressure fluctuation coefficients, pronounced values were also observed at the jump toe, where they reached up to CPmax ≈ 1.1 (Figure 13c and Figure 20). The peak in extreme negative pressures CPmin was also observed at the flow deflection point, where they reached up CPmin ≈ 0.6 (Figure 13d and Figure 20). These values were up to 2 times higher as compared to 50° smooth or 30° stepped chutes (Figure 13d, Figure 19d and Figure 20). At the jump toe, the extreme negative pressures were similar to those of 50° smooth or 30°stepped chutes (Figure 13c, Figure 19d and Figure 20). Downstream of the flow deflection point, i.e., XJ > 0.04, the extreme pressure coefficients for 50° stepped chutes decreased and were similar to 50° smooth chute approach flow magnitudes for XJ > 0.13. Similar conclusions can be drawn for extreme pressure coefficients with 99.9% and 0.1% percentiles, but with typically two times lower magnitudes (Figure 13e,f).
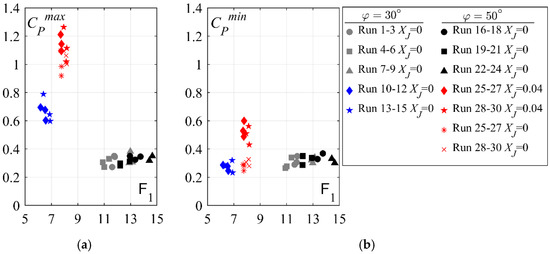
Figure 20.
Extreme pressure coefficients: (a) CPmax and (b) CPmin at the flow deflection point and jump toe; [Runs 1–9: 30° smooth chute, Runs 10–15: 30° stepped chute, Runs 16–24: 50° smooth chute, Runs 25–30: 50° stepped chute].
The fluctuation and extreme pressure coefficients for 50° smooth chute approach flows can be described with the same relation developed for 30° chutes [5] (Figure 13c,d):
where coefficients d, e, f and j are given in Table 2. The same equation can be used for 50° stepped chutes for XJ > 0.13 or 30° stepped chutes for XJ > 0.1. The pronounced pressure coefficients for 50° stepped chute inflows within XJ ≤ 0.13 are described as:
where coefficients k, l, m and n are listed in Table 2. The pronounced pressure coefficients for 30° stepped chute inflows within XJ ≤ 0.1 are described as [5]:
where coefficients o and r are listed in Table 2.
Table 2.
Coefficients of Equations (11)–(13).
4.2.5. Streamwise Distribution of Bottom Air Concentration and Cavitation Damage Protection
Structures subjected to high velocity flows, such as stilling basins, are sensitive to cavitation formation and associated damage. The knowledge of the bottom air concentration development is essential, as even a relatively small quantity close to the concrete surface can provide protection [24]. In Figure 21 the streamwise development of the bottom air concentration Cb downstream of 30° and 50° smooth and stepped chutes are compared, including the bottom air concentration at the chute end, i.e., Cb,ce, illustrated at XJ = −0.3.
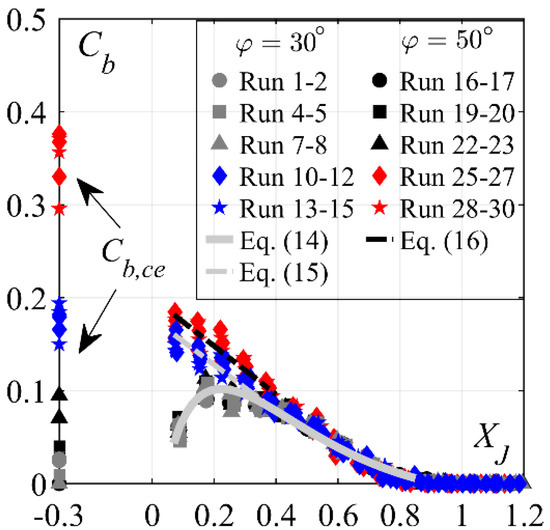
Figure 21.
Streamwise development of bottom air concentration Cb; (—) Equation (13); (− −) Equations (14) and (15); [Runs 1–9: 30° smooth chute, Runs 10–15: 30° stepped chute, Runs 16–24: 50° smooth chute, Runs 25–30: 50° stepped chute].
Smooth chute inflows were characterized by a sharp rise in Cb in the downstream direction, reaching maxima Cb ≈ 0.11 at XJ ≈ 0.17, followed by a decrease towards zero at XJ ≈ 0.9. The bottom air concentration development was practically independent of the approach flow conditions or chute slope φ. The bottom air concentration development remained unaltered, despite the increased bottom air concentration at the 50° smooth chute end, i.e., Cb,ce values. This further strengthens the conclusion made in [12] that the bottom air concentrations downstream of smooth chutes were not influenced by the approach flow aeration C1 due to the flow deviation at the jump toe, that generated high pressures (Figure 14a) and thus promoted de-aeration of the flow at the basin entrance.
The 50° stepped chute approach flows had significantly higher bottom air concentrations within XJ ≤ 0.4, as compared to 50° smooth chute approach flows, with values reaching up to Cb = 0.18 at XJ = 0.08 (Figure 21). The increased values after 50° stepped chute approach flows, similarly to those after 30° stepped chutes, can be attributed to the significantly higher Cb,ce and comparatively lower pressure magnitudes at the flow deviation point [12] (Figure 13a). Further downstream, the values of Cb decreased up to XJ ≈ 0.4, beyond which they coincide with smooth chute approach flow values. Comparing the 30° and 50° stepped chute approach flows (Figure 21), it was noticeable that 50° stepped chute had a slightly higher air concentration (on average 2% more) within XJ ≤ 0.4, as compared to 30° stepped chute, despite the significantly higher bottom air concentration at the 50° stepped chute end (18%, on average) This was caused by the higher pressure magnitudes at the flow deviation point downstream of 50° stepped chute (Figure 13a), which lead to higher de-aeration rates at the basin entrance. Further downstream, i.e., XJ > 0.4, the bottom air concentration development was independent of the chute slope φ
The streamwise development of the bottom air concentration Cb for 50° smooth chute approach flows was described by the equation developed for 30° [12] (Figure 21):
The same equation can be used for 30° or 50° sloping stepped chute approach flows for XJ > 0.4. The pronounced bottom air concentrations for stepped chute approach flows can be approximated as (R2 = 0.8, Figure 21):
In terms of cavitation protection, stilling basins downstream of 50° chutes had the same cavitation damage protection length with respect to bottom air concentration as 30° steep chutes [12]: (1) smooth chute inflows within 0.1 ≤ XJ ≤ 0.5 and 0.15 ≤ XJ ≤ 0.4 considering 5% and 8% bottom air concentration limit [24,25,26], and (2) stepped chute inflows within 0 ≤ XJ ≤ 0.5 and 0 ≤ XJ ≤ 0.4 considering 5% and 8% bottom air concentration limit [24,25,26]. The pronounced extreme pressures downstream of 30° or 50° sloping stepped chutes within XJ ≤ 0.13 (Figure 19b,d) do probably not present a risk in terms of cavitation damage.
5. Conclusions
The effect of chute slope (i.e., φ = 30° and 50°) on the performance of a plain stilling basin below smooth and stepped chutes was systematically investigated for several discharges, smooth chute approach flow aerations and two step heights. The following conclusions can be drawn:
- The use of equivalent clear water parameters at the chute end leads to a fairly accurate prediction of the sequent depth ratio using classical momentum principle, irrespective of the approach flow conditions or chute slope φ, for a given approach Froude number F1.
- The free surface characteristics along the plain stilling basin, such as dimensionless flow depths Z and dimensionless flow depth fluctuations CH’, are independent of the approach flow conditions or chute slope φ, either for smooth or stepped chutes.
- The dimensionless roller lengths LR/h2 are independent of the approach flow conditions or chute slope φ.
- The dimensionless hydraulic jump lengths LR/h2 are practically independent of the chute slope φ. Further, the results support the conclusions made by [5], stating that hydraulic jumps initiated below stepped chutes require an increased length x/h2 as compared to those below smooth chutes.
- It is recommended that longer dimensionless plain stilling basin lengths are provided below stepped chutes irrespective of the chute slope, namely LJ ≈ 6.7h2 as compared to LJ ≈ 5.8h2 below smooth chutes, plus a safety margin.
- Increasing chute slope pronounces dimensionless mean bottom pressures Pm, due to the stronger flow curvature, and slightly extends the influence reach of the flow curvature. The latter is more significant for stepped chute inflows.
- Fluctuation and extreme pressure coefficients along the plain stilling basin invert are independent of the approach flow aeration C1 or chute slope φ below smooth chutes.
- Stepped chute inflows increase the fluctuating and extreme pressure coefficients at the plain stilling basin entrance, as compared to smooth chute inflows. Increasing stepped chute slope increases the extreme and fluctuating pressure coefficients within XJ ≤ 0.13. For 50° stepped chutes, these coefficients can reach up to 3 times higher magnitudes compared to smooth chute inflows or up to 2 times higher compared to the 30° stepped chute inflows.
- The bottom air concentration development along the plain stilling basin below smooth chutes is independent of the chute slope φ, for XJ ≥ 0.08. Stepped chute inflows increase bottom air concentration within XJ ≤ 0.4. Increasing stepped chute slope slightly increases the bottom air concentration within the latter region, namely by some 2% for 50° stepped chute compared to 30° chutes.
- The cavitation protection length is independent of the chute slope, namely for: (1) smooth chute inflows within 0.1 ≤ XJ ≤ 0.5 and 0.15 ≤ XJ ≤ 0.4 considering 5% and 8% bottom air concentration limit, and (2) stepped chute inflows within 0 ≤ XJ ≤ 0.5 and 0 ≤ XJ ≤ 0.4 considering 5% and 8% bottom air concentration limit. Evidently, stepped chute approach flows provide better cavitation damage protection in the initial reach of the plain stilling basin.
- The increased extreme pressures below stepped chutes within XJ ≤ 0.13 are not expected to represent a danger in terms of cavitation. In spite of this, the increased bottom pressure coefficients below stepped chutes should be considered in the plain stilling basin slab design.
Empirical equations for predicting the roller length, mean and fluctuating flow depth development and bottom pressure characteristics along plain stilling basins below smooth and stepped chutes were proposed. The latter, including the results of the present study, strictly apply to 30° ≤ φ ≤ 50° gradually varied or quasi-uniform smooth (0.15 ≤ C1 ≤ 0.37 and 10.9 ≤ F1 ≤ 15) and skimming stepped (0.41 ≤ C1 ≤ 0.55, 6.2 ≤ F1 ≤ 8.2 and 2.70 ≤ hc/s ≤ 7.94) chute inflows.
Author Contributions
Conceptualization, I.S., M.P., J.M. and A.J.S.; methodology, I.S., M.P., J.M. and A.J.S.; software, I.S.; validation, I.S., M.P., J.M. and A.J.S.; formal analysis, I.S., M.P., J.M. and A.J.S.; investigation, I.S., M.P., J.M. and A.J.S.; resources, M.P., J.M. and A.J.S.; data curation, I.S.; writing—original draft preparation, I.S.; writing—review and editing, M.P., J.M. and A.J.S.; visualization, I.S.; supervision, M.P., J.M. and A.J.S.; project administration, M.P., J.M. and A.J.S.; funding acquisition, M.P., J.M. and A.J.S. All authors have read and agreed to the published version of the manuscript.
Funding
This research was funded by “Fundação para a Ciência e a Tecnologia” (FCT) from Portugal, Grant No. PD/BD/113621/2015, Laboratory of Hydraulic Constructions (LCH) of EPFL, Switzerland and Swiss Committee on Dams.
Institutional Review Board Statement
Not applicable.
Informed Consent Statement
Not applicable.
Data Availability Statement
Some or all data, models, or code that support the findings of this study are available from the corresponding author upon reasonable request.
Conflicts of Interest
The authors declare no conflict of interest.
References
- Chanson, H. Hydraulics of Stepped Chutes and Spillways; August Aimé Balkema: Rotterdam, The Netherlands, 2002. [Google Scholar]
- Chanson, H.; Bung, D.B.; Matos, J. Stepped spillways and cascades. In Energy Dissipation in Hydraulic Structures; CRC Press: Leiden, The Netherlands, 2015; pp. 45–64. [Google Scholar]
- Hager, W.H.; Schleiss, A.J.; Boes, R.M.; Pfister, M. Stepped chute. In Hydraulic Engineering of Dams; CRC Press: Leiden, The Netherlands, 2021; pp. 277–319. [Google Scholar]
- Frizell, K.W.; Frizell, K.H. Guidelines for Hydraulic Design of Stepped Spillways; Hydraulic Laboratory Report HL-2015-06; U.S. Bureau of Reclamation: Denver, CO, USA, 2015.
- Stojnic, I.; Pfister, M.; Matos, J.; Schleiss, A.J. Effect of 30-Degree Sloping Smooth and Stepped Chute Approach Flow on the Performance of a Classical Stilling Basin. J. Hydraul. Eng. 2021, 147, 04020097. [Google Scholar] [CrossRef]
- Bung, D.B.; Sun, Q.; Meireles, I.; Viseu, T.; Matos, J.S. USBR type III stilling basin performance for steep stepped spillways. In Proceedings of the 4th International. IAHR Symposium on Hydraulic Structures, Porto, Portugal, 9–11 February 2012. [Google Scholar]
- Frizell, K.W.; Svoboda, C.D. Performance of Type III Stilling Basins–Stepped Spillway Studies; U.S. Bureau of Reclamation: Denver, CO, USA, 2012.
- Frizell, K.W.; Svoboda, C.D.; Matos, J. Performance of type III stilling basins for stepped spillways. In Proceedings of the 2nd International Seminar on Dam Protection Against Overtopping, Fort Collins, CO, USA, 7–9 September 2016. [Google Scholar]
- Meireles, I.; Matos, J.; Silva Afonso, A. Flow characteristics along a USBR type III stilling basin downstream of steep stepped spillways. In Proceedings of the 3rd International Junior Researcher and Engineer Workshop on Hydraulic Structures, Brisbane, Australia, 2–4 May 2010. [Google Scholar]
- Novakoski, C.K.; Conterato, E.; Marques, M.; Teixeira, E.D.; Lima, G.A.; Mees, A. Macro-turbulent characteristics of pressures in hydraulic jump formed downstream of a stepped spillway. RBRH 2017, 22. [Google Scholar] [CrossRef]
- Novakoski, C.K.; Hampe, R.F.; Conterato, E.; Marques, M.G.; Teixeira, E.D. Longitudinal distribution of extreme pressures in a hydraulic jump downstream of a stepped spillway. RBRH 2017, 22. [Google Scholar] [CrossRef]
- Stojnic, I.; Pfister, M.; Matos, J.; Schleiss, A.J. Air-water flow in a plain stilling basin below smooth and stepped chutes. J. Hydraul. Res. 2022. [Google Scholar] [CrossRef]
- Schwalt, M.; Hager, W.H. Die Strahlbox. Schweiz. Ing. Archit. 1992, 110, 547–549. (In German) [Google Scholar] [CrossRef]
- Stojnic, I. Stilling basin performance downstream of stepped chutes. Ph.D. Thesis, École Polytechnique Fédérale de Lausanne, Lausanne, Switzerland, 2020. [Google Scholar]
- Wood, I. Uniform region of self-aerated flow. J. Hydraul. Eng. 1983, 109, 447–461. [Google Scholar] [CrossRef]
- Wood, I. Air entrainment in free-surface flows. In IAHR Hydraulic Structures Design Manuals 4: Hydraulic Design Considerations, 1st ed.; Wood, I., Ed.; CRC Press/Balkema: Rotterdam, The Netherlands, 1991; pp. 1–152. [Google Scholar]
- Chanson, H.; Toombes, L. Air–water flows down stepped chutes: Turbulence and flow structure observations. Int. J. Multiph. Flow 2002, 28, 1737–1761. [Google Scholar] [CrossRef]
- Takahashi, M.; Ohtsu, I. Aerated flow characteristics of skimming flow over stepped chutes. J. Hydraul. Res. 2012, 50, 427–434. [Google Scholar] [CrossRef]
- Matos, J.; Meireles, I. Hydraulics of stepped weirs and dams spillways: Engineering challenges, labyrinths of research. In Proceedings of the 5th IAHR International Symposium on Hydraulic Structures (ISHS 2014), Brisbane, Australia, 25–27 June 2014. [Google Scholar]
- Peterka, A.J. Hydraulic Design of Stilling Basins and Energy Dissipators; U.S. Department of the Interior: Denver, CO, USA, 2008.
- Fiorotto, V.; Rinaldo, A. Turbulent pressure fluctuations under hydraulic jumps. J. Hydraul. Res. 1992, 30, 499–520. [Google Scholar] [CrossRef]
- Lopardo, R.A.; De Lio, J.C.; Vernet, G.F. Physical modelling on cavitation tendency for macroturbulence of hydraulic jump. In Proceedings of the International Conference on the Hydraulic Modelling of Civil Engineering Structure, Conventry, UK, 22–24 September 1982. [Google Scholar]
- Toso, J.W.; Bowers, C.E. Extreme Pressures in Hydraulic-Jump Stilling Basins. J. Hydraul. Eng. 1988, 114, 829–843. [Google Scholar] [CrossRef]
- Peterka, A.J. The effect of entrained air on cavitation pitting. In Proceedings: Minnesota International Hydraulic Convention, Proceedings of the 1953 Minnesota International Hydraulics Convention, Minneapolis, MN, USA, 1–4 September 1953; American Society of Civil Engineers: New York, NY, USA, 1953. [Google Scholar]
- Rasmussen, R.E.H. Some experiments on cavitation erosion in water mixed with air. In Proceedings International Symposium on Cavitation in Hydrodynamics; National Physical Laboratory: London, UK, 1956. [Google Scholar]
- Russell, S.O.; Sheehan, G.J. Effect of entrained air on cavitation damage. Can. J. Civ. Eng. 1974, 1, 97–107. [Google Scholar] [CrossRef]


Publisher’s Note: MDPI stays neutral with regard to jurisdictional claims in published maps and institutional affiliations. |
© 2022 by the authors. Licensee MDPI, Basel, Switzerland. This article is an open access article distributed under the terms and conditions of the Creative Commons Attribution (CC BY) license (https://creativecommons.org/licenses/by/4.0/).