Article

Impacts of Different Socioeconomic Development Levels on Extremely Wet/Dry Events in Mainland China

1
Key Laboratory of Agricultural Soil and Water Engineering in Arid and Semiarid Areas, Ministry of Education, College of Water Resources and Architecture Engineering, Northwest A&F University, Xianyang 712100, China
2
Academy of Plateau Science and Sustainability, Qinghai Normal University, Xining 810016, China
3
Tashkent Institute of Irrigation and Agricultural Mechanization Engineers, National Research University, Qoriy Niyoziy 39, Tashkent 100000, Uzbekistan
4
Research Institute of Environment and Nature, Conservation Technologies, Bunyodkor Ave., 7-A, Chilanzar District, Tashkent 100043, Uzbekistan
5
Office of Rural Revitalization, Northwest A&F University, Xianyang 712100, China
6
College of Land Science and Technology, China Agricultural University, Beijing 100083, China
*
Author to whom correspondence should be addressed.
Water 2022, 14(23), 3950; https://doi.org/10.3390/w14233950
Submission received: 31 August 2022 / Revised: 3 November 2022 / Accepted: 26 November 2022 / Published: 4 December 2022
(This article belongs to the Special Issue Environmental and Human Impacts on Hydrological Drought)

Abstract

:
The impacts of human activity (denoted by population), economic, and social development (denoted by gross domestic product–GDP) on extremely wet/dry (or drought) events are important for humans to tackle extreme hazards. This research aims to investigate the variations in maximum values (SPEI_MAX) and minimum values (SPEI_MIN) of a 12 month standardized precipitation evapotranspiration index (SPEI12-month) for the selected 525 sites at different socioeconomic development levels (SDLs) (classified by population and GDP) in China between 2000–2018, and to analyze the impacts of increased population/GDP/SDLs on extremely wet/dry events. The linear correlations between SPEI12-month/SPEI_MAX/SPEI_MIN and population/GDP were conducted for all the sites. The relationship between linear slopes of population (PopuLS)/GDP(GDPLS) and SPEI_MAX (SPEI_MAXLS)/SPEI_MIN (SPEI_MINLS) were further studied. The results show that the extremely wet events denoted by SPEI_MAX become worse and the extreme drought events denoted by SPEI_MIN tend to be milder over time. The years 2016 and 2011 were extremely wet and extremely dry in China. There were general increasing trends in SPEI_MAX and decreasing trends in SPEI_MIN as the SDL increased from 1 to 6. This gradual, continuous increase/decrease potentially affected levels 5 and 6. Moreover, extremely wet events were more severe in developed big municipal cities of higher SDLs and extreme drought events were more severe for lower SDLs. This research can supply references for policy makers to prevent extreme disasters.

1. Introduction

Extreme climate events, including extreme precipitation events [1], extreme temperature events [2], and extremely wet/dry events [3], have enormous and potentially severe impacts on human, agriculture, economy, and ecology. Extremely wet/dry events have brought much uncertainty, sensitivity, exposure, and vulnerability, as well as high risks all over the world historically [4,5,6,7,8]. Extremely wet/dry events are unpredictable, severe, and unseasonal, and lead to enormous loss of life and destruction, posing major impediments to human security and sustainable socioeconomic development [9,10].
The evolution and mechanics of mild, severe, or extremely wet/dry events [11,12] are complicated, and are caused not only by climate variability, but also human activities. Liu et al. [13] suggested that a substantial increase in the Atlantic intertropical convergence zone swing induced severe droughts/floods in the Atlantic-rim countries by using state-of-the-art climate models under a high-emission scenario. Collins [14] tested an increasing trend of flood magnitudes after 1970 in New England watersheds with dominantly natural streamflow, and manifested that this timing was broadly synchronous with a phase change in the low frequency variability of the North Atlantic Oscillation. Daksiya et al. [15] investigated the climate change and urbanization (human activity) effects on flood protection decision-making, and they concluded that climate change had a higher impact compared to urbanization on the flood protection decisions. Modarres et al. [7] analyzed the changes of extremely wet/dry events in Iran. They suggested that the increase in flood magnitude and drought severity were attributed, partly, to an annual rainfall negative trend/maximum rainfall increasing trend and land use changes/inappropriate water resources management policies (human activity). Farhidi [16] explored whether environmental policies (of energy consumption, gross domestic product (GDP), population, technology, head of the state political affiliation, carbon emission, and waste generation) have been impacted by extreme climatic events (such as droughts, floods, storms, etc.). They concluded that policymakers make more imminent decisions that put human life at risk. Brunner et al. [17] stated that the extreme events can be significantly influenced by human flow regulations through hydropower production, water abstraction, or water diversions. However, data on human impacts, such as land use and channel morphology changes, water abstractions, or reservoir regulations, lack sufficient temporal and spatial detail, or are not available at all. Considering data availability, the present research of human activity influences on extreme precipitation events is still limited. Issues about how population and GDP increases affect extreme precipitation events, and the interactions between them, are still unclear.
China has also suffered from extremely wet/dry events with large losses. The duration of extremely wet/dry events may be short, but can cause great damage. Regarding extremely wet conditions, Wang et al. [18] investigated the extreme stream-flow of the Dongjiang River basin in southern China in the period 1956–2004. According to the yearbooks, the years 1998 and 2016 were extremely wet in China, which caused agricultural disaster areas of 22.29 and 26.1 × 10⁶ ha, death numbers of 3656 and 684, affected populations of 2.3 and 1.02 × 10⁹, direct economic losses of 2484 and 3661 × 109 RMB, and destroyed houses of 566 and 43 × 104, respectively [19]. In July 2021, Zhengzhou of Henan Province was hit by a rainstorm of rare high intensity, which caused severe flooding (Zhao et al.; Fan et al. [20,21]). Regarding extremely dry conditions, the extreme drought events in 2009–2010 in southwestern China, including Yunnan, Sichuan, and Guizhou provinces [22], affected around 21 million people, causing shortages of drinking water, and economic losses reached nearly USD 30 billion. The extreme drought between June and August 2022 was one of the worst droughts in around 60 years, which caused water levels in China’s largest freshwater lake, Poyang Lake, to drop by almost 10 m [23]. Although climate variability may have contributed more than human activities, due to the complex causes of extreme events, further studies are necessary to reveal the connection between extremely wet/dry events and human activity indicators in China [15].
Previous studies mainly focused on the natural characteristics and spatial–temporal variations of extremely wet/dry events. Few works have been carried out on the impacts of human activity (denoted by population), economic, and social development (denoted by GDP) on extremely wet/dry events, which have complex internal structures. Among the proposed indicators, the standardized precipitation and evapotranspiration index (SPEI) has multiscale characteristics and implications in denoting global warming when compared with SPI [24]. The maximum SPEI (SPEI_MAX) and minimum SPEI (SPEI_MIN) denote extremely wet/dry events well, respectively. Population and GDP could accurately reflect human activity and social development levels of a place because of its stability [25].
The objectives of this study were: (I) to detect the spatial–temporal variations of population, GDP, and the extremely wet/dry indicators, site specifically during the period 2000–2018 in mainland China. The selected 525 sites were divided into six socioeconomic development levels (SDLs); (II) to identify the spatial variations of linear slopes (LS) of population (PopuLS), GDPLS, and the extreme wet/dry indicators; (III) to analyze the relationship between changes (LS) in extremely wet/dry events and human activity/SDL in order to further reveal the impacts of population and GDP increase on extreme events; (IV) to investigate the influences of different SDLs on extremely wet/dry events.

2. Materials and Methods
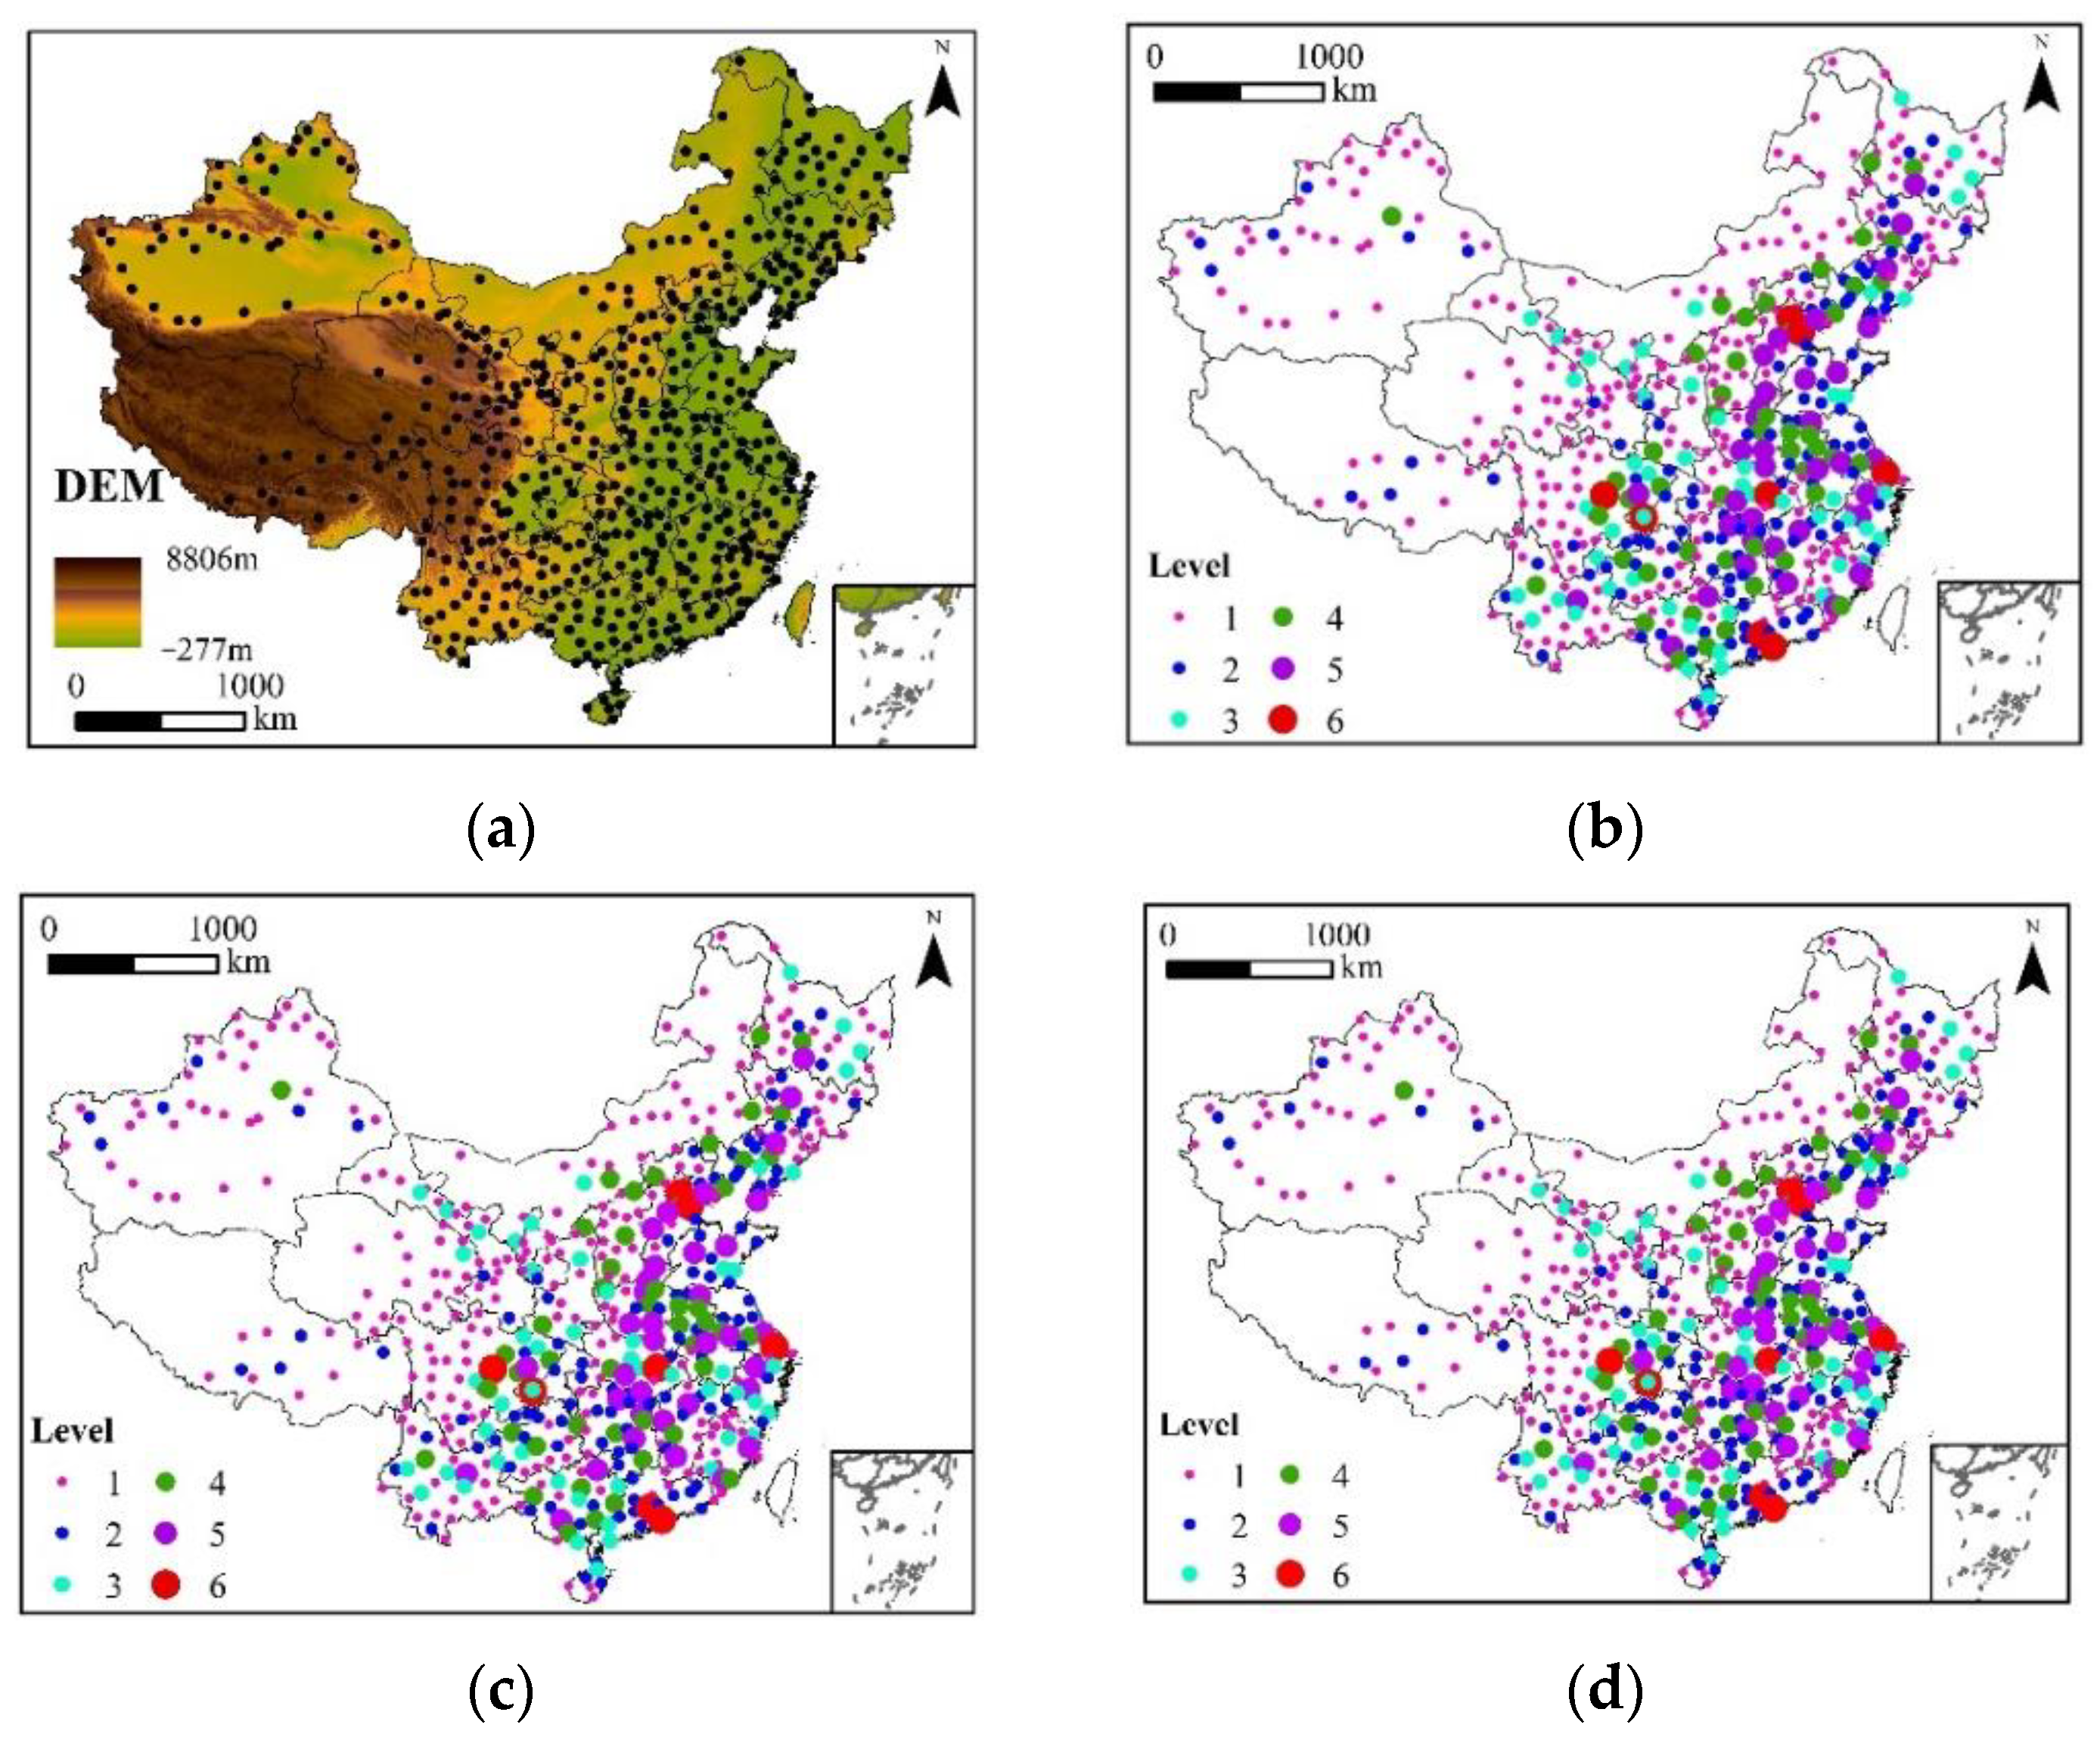
2.1. Study Area

China covers an area of 9.60340579 million km2, is located in the eastern Asia, and on the west coast of the Pacific Ocean. The elevation of China gradually decreases from west to east, generally similar to a ‘three-ladder’ structure [26]. The first ladder (with the highest elevation) is the Qinghai–Tibet plateau. Regions including Inner Mongolia, Xinjiang, Loess Plateau, Sichuan basin, and the Yunnan–Guizhou plateau belong to the 2nd ladder. The third ladder consists of east China and areas adjacent to oceans [27]. The average altitudes of the three ladders are 4500 m, 1000–2000 m, and below 500 m, respectively. With the development of economy and society, China has become the largest developing country [28]. China is divided into 34 provinces, and different provinces are made up of different prefecture-level or county-level cities. The population of China grew from 1.3 billion in 2000 to 1.4 billion in 2018, and the GDP grew from 10 × 1012 in 2000 to 90 × 1012 RMB in 2018, which was more than nine-fold the loss in 2000 due to the dramatic economic growth and the rapid expansion of cities.

2.2. Data Collection

A total of 525 sites were selected for the study. The observed weather data were collected from the Chinese Meteorological Data Sharing Service Network (http://data.cma.cn/) (accessed on 15 August 2018) with strict quality control. The missing data were interpolated by linear regression equation with the arithmetic average of adjacent days or months.
The population data and GDP data at the selected 525 sites were collected from the National of Bureau Statistics, the Statistical yearbook of China (http://www.stats.gov.cn/) (accessed on 15 August 2018), and the Winds Database (https://www.wind.com.cn/) (accessed on 15 August 2018). The selected 525 sites were divided into 6 SDLs first by population in 2018, then by GDP in 2018, and finally by both population and GDP in 2018 (Table 1).
Based on population, there were 266, 101, 64, 39, 43, and 12 sites that were classified as SDLs of 1 to 6, respectively. Based on GDP, there were 156, 191, 62, 52, 52, and 12 sites that were classified from levels 1 to 6, respectively. When taking account of both population and GDP, scale levels were estimated by the average of that site for population and GDP. If the level was 1.5, 2.5, 3.5, 4.5, or 5.5, it was classified as a scale of 1, 2, 3, 4, or 5, respectively. Finally, 270, 113, 52, 47, 35, and 8 sites were classified as levels 1 to 6 considering both population and GDP ranges, respectively.
The spatial distribution of digital elevation and weather stations, the classification levels of the sites according to population, GDP, and both population and GDP are mapped in Figure 1. The SDL classification based on both population and GDP are referred to hereinafter for further analysis.

2.3. Computation of SPEI

The SPEI value is computed based on the differences between precipitation and reference crop evapotranspiration (ET0). In this study, SPEI values at the 12 month timescale (SPEI12-month) are computed. A 12 month SPEI can be used to explore the impact of precipitation change on hydrological systems [29,30]. Ojara et al. [31] concluded that the temporal development of drought and wet events using a 3 month SPEI had higher temporal frequencies, which stabilized over the 12 month SPEI timescale. Therefore, the 12 month SPEI has higher stability than smaller timescales, and it can still maintain the details of temporal variations when compared to timescales longer than 12 months. The calculation procedure contains three steps:
First, monthly ET0 is estimated The Penman–Monteith equation performs well for estimating ET0 and is recommended as a standardized method by the Food and Agriculture Organization [32]. The equation is written as:
E T 0 = 0.48 Δ ( R n G ) + γ 900 T + 273 U 2 ( e s e a ) Δ + γ ( 1 + 0.34 U 2 )
The albedo (=0.23), the actual and maximum possible sunshine durations, the Stefan–Boltzmann constant (4.903 × 10⁻⁹ MJ K−4 m−2 d−1), the maximum and minimum absolute temperatures, and the coefficients as and bs in the Angstrom equation are used for calculating ET0. In order to obtain better accuracy, the calibrated values of as and bs based on the observed daily Rs at 139 stations of China were used [33], which were also used for the nearby stations using the Thiessen polygon method in ArcGIS 10.2 software. Detailed computation procedures of the other variables in Equation (1) are referred to Allen et al. [32].
Second, to determine the 12 month cumulative water deficit D (=Pre-ET0 in mm) [34]:
{ X i , j k = l = 13 k + j 12 D i 1 , l + l = 1 l = j D i , l   , i f   j < k X i , j k = l = j k + 1 j D i , l   , i f   j k
where X i , j k is cumulative D in the jth month of the ith year for k-month timescale (k = 12); Di,l is water deficit D in the first month of the ith year.
Third, the probability density function f(D) was calculated by using the three-parameter log-logistic probability distribution function. The probability density function f(x) and the probability distribution function F(D) are described as:
f ( D ) = β α [ D γ α ] β 1 [ 1 + [ D γ α ] ] 2
F ( D ) = [ 1 + ( α D γ ) β ] 1
where α, β, and γ are scale, shape, and origin parameters of log-logistic probability distribution, respectively [34,35].
Finally, to normalize F(D) and obtain the SPEI values [36]:
P(D) = 1 − F(D)
W = { 2 ln P ( D ) i f   P     0.5 2 ln ( 1 P ( D ) ) i f   P   >   0.5
S P E I = W c 0 + c 1 W + c 2 W 2 1 + d 1 W + d 2 W 2 + d 3 W 3
where c0 = 2.515517, c1 = 0.802853, c2 = 0.010328, d1 = 1.432788, d2 = 0.189269, and d3 = 0.001308.
Wet/dry severity level based on SPEI12-month is classified and presented in Table 2.
The annual maximum (SPEI_MAX), minimum (SPEI_MIN), and the value that SPEI ≥ 2 and SPEI ≤ −2 of SPEI12-month are obtained for further analysis.

2.4. Linear Slope Estimation

In order to compare how the changes in population and GDP impact the extremely wet/dry events, the linear slope (LS) values of annual population, GDP, and SPEI, SPEI_MAXLS, SPEI_MIN in the period 2000–2018 versus time (year) are obtained (simplified as PopuLS, GDPLS, SPEILS, SPEI_MAXLS, and SPEI_MINLS below, respectively). A negative LS indicates that the time series has a downward trend, while a positive LS indicates an upward trend. The Pearson correlations between pairs of PopuLS/GDPLS and SPEILS/SPEI_MAXLS/SPEI_MINLS are conducted to reveal the responses of extreme wet/dry events to human-activity-induced population and GDP changes. The larger the coefficient of determination (R2), the closer the relationship between two variables. The calculation is implemented through R 3.4.3.

3. Results

3.1. The Spatial–Temporal Variations of Population and GDP at Different SDLs

The temporal variations of population and GDP at six different SDLs during the period 2000–2018 and spatial distribution of their linear slopes are illustrated in Figure S1. First, population and GDP increase over time and their values increase as the level increases, especially for level six. This manifested the rapid population extension and economic development in China, especially in some large cities such as Beijing, Shanghai, Guangzhou, and Shenzhen for level six. Second, the box plots of PopuLS and GDPLS both increase with the increasing levels. Finally, from the spatial distribution of PopuLS, the sites that have greater increase in population (PopuLS ranges between 1.5 to 6.0 × 10⁵/year) and GDP (GDPLS ranges between 7.0 to 16 × 1010 RMB/year) are distributed mostly in eastern China.

3.2. The Temporal Variations of SPEI_MAX and SPEI_MIN

SPEI_MAX/MIN represent the extreme flooding/drought conditions. The change in SPEI_MAX and SPEI_MIN at six different SDLs during the period 2000–2018 and their linear slopes are illustrated in Figure 2.
In Figure 2: (1) both average SPEI_MAX and SPEI_MIN vary and fluctuate with time (Figure 2a,b). There is an overall consistence in the curve changes for different levels. The values of average SPEI_MAX and SPEI_MIN tend to rise over time, which means that extremely wet events have become worse and extremely dry events tend to be milder. Especially during 2016, the average SPEI_MAX value reaches 1.83 and average SPEI_MIN is also high, indicating an extremely wet year in China. Similar results were demonstrated by Li et al. [37]. There was generally low precipitation in China in 2011, resulting in a severely dry year with an average SPEI_MIN value of −1.58. Lu et al. [38] also reported a dry 2011 in China. (2) As the SDL increases, the average values of SPEI_MAXLS increase slightly, indicating small increases in extremely wet events from rural areas to urban areas; in the meantime, the tendency of SPEI_MINLS values decreases a little, showing that extremely dry events tend to be milder (Figure 2c,d). (3) The variability of SPEI_MAXLS and SPEI_MINLS decreases with the increase in level, since more sites are contained in the results. (4) To show detailed variations in SPEI_MAX and SPEI_MIN at different SDLs during the period 2000–2018, the box plots are presented (Figures S2 and S3), which indicate more temporal variability of SPEI.

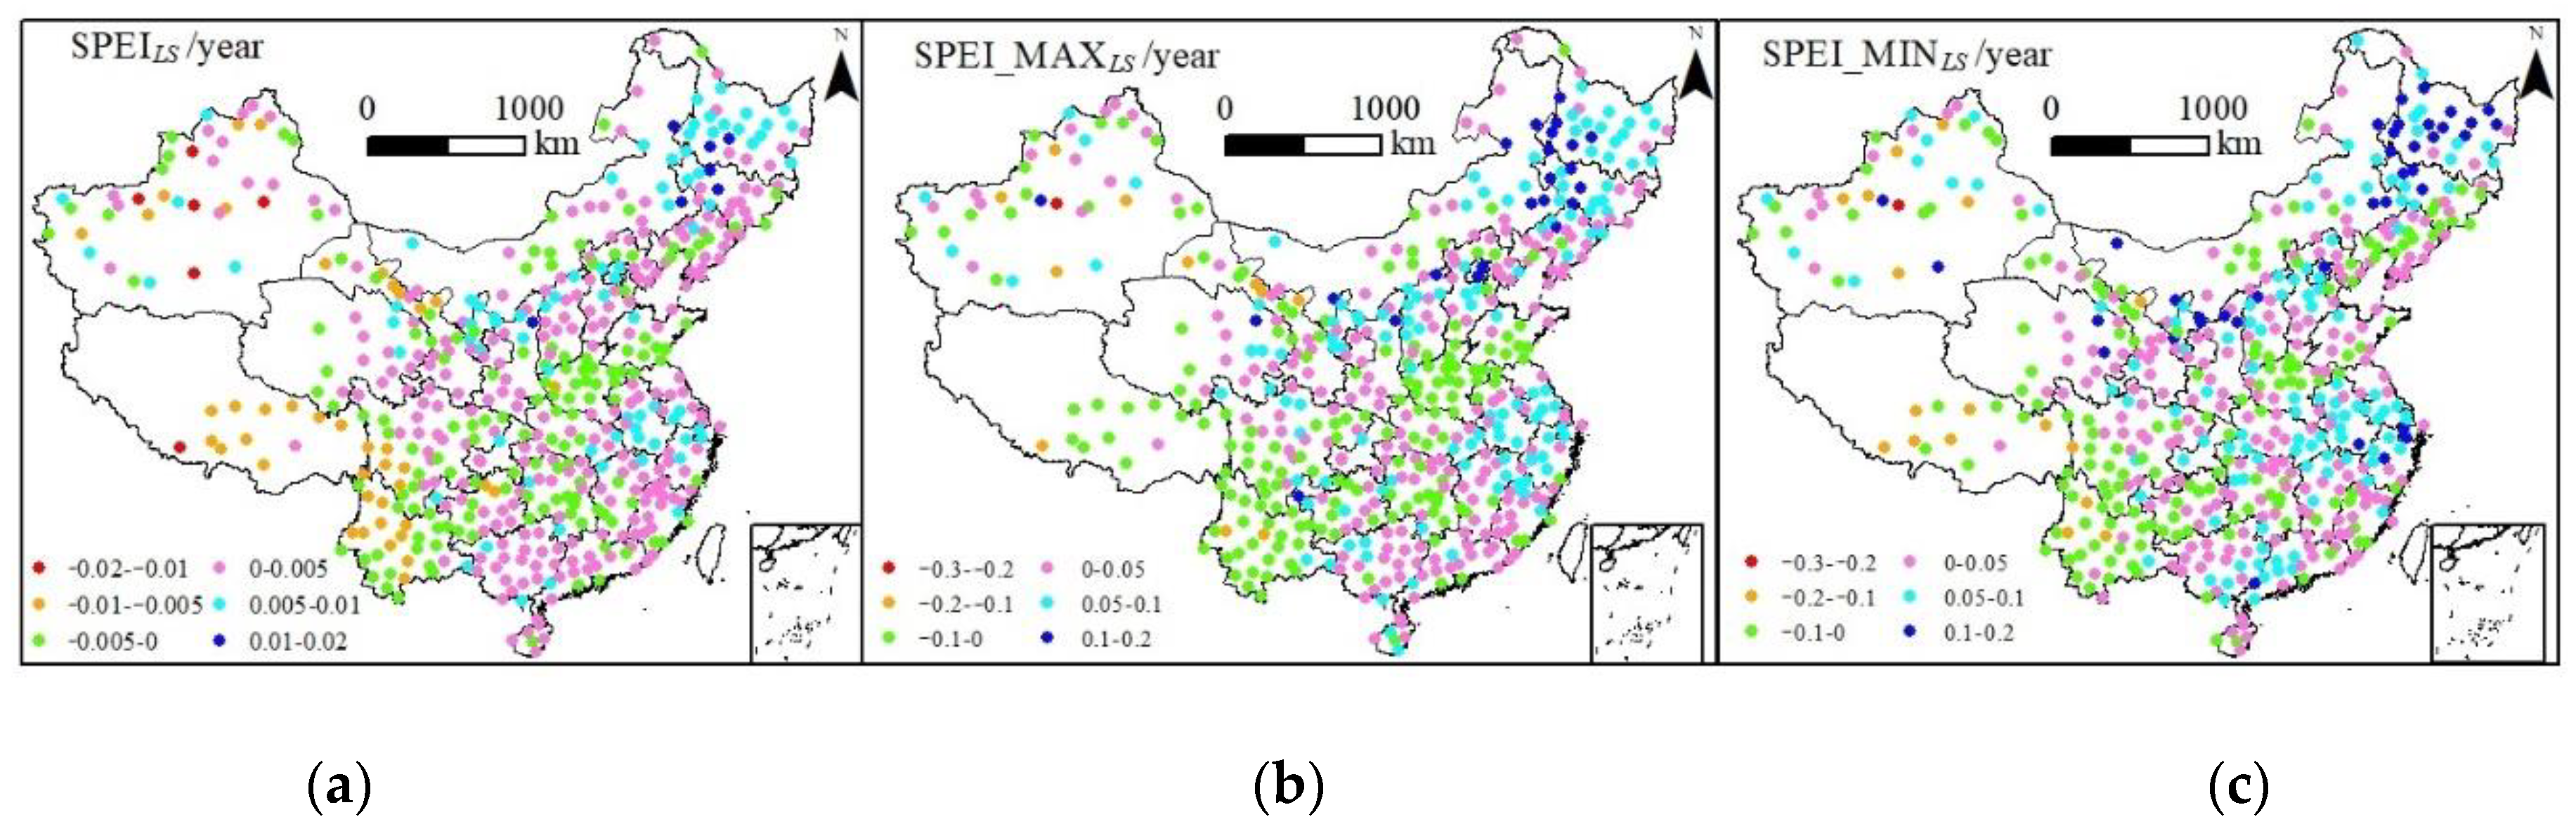
3.3. The Spatial Distribution of SPEILS, SPEI_MAXLS, and SPEI_MINLS

The spatial distribution of SPEILS, SPEI_MAXLS, and SPEI_MINLS are mapped in Figure 3. It shows that: (1) The range of SPEILS is between −0.02 and 0.02 year−1. The value of SPEILS gradually increases from west to east China, indicating less severe drought in the west and more severe wet conditions in the east of China. The negative values of SPEILS occur mainly in western China (Figure 3a). (2) SPEI_MAXLS ranges from −0.3 to 0.2 year−1 and increases from west to east China, revealing worse extremely wet events (Figure 3b). The reason is that the sites at small level have gradually transferred to bigger sites from the west to the east of China. In the northeast China especially, including the capital city of Beijing, the trend of extremely wet events is very pronounced, with SPEI_MAXLS ranging from 0.1 to 0.2 year−1. (3) Although the range of SPEI_MINLS is generally the same as SPEI_MAXLS, the extreme drought events tend to be milder from west to east and become more severe in northwest China, the Qinghai–Tibetan plateau, and southwest China (Figure 3c). (4) By comparing Figure 3a–c, the range of SPEILS is −0.02 to 0.02 year−1, while the range of SPEI_MAXLS and SPEI_MINLS vary from −0.3 to 0.2 year−1. Ranges differ 10-fold and imply both aggravated extremely dry/wet events in the 18 year period.

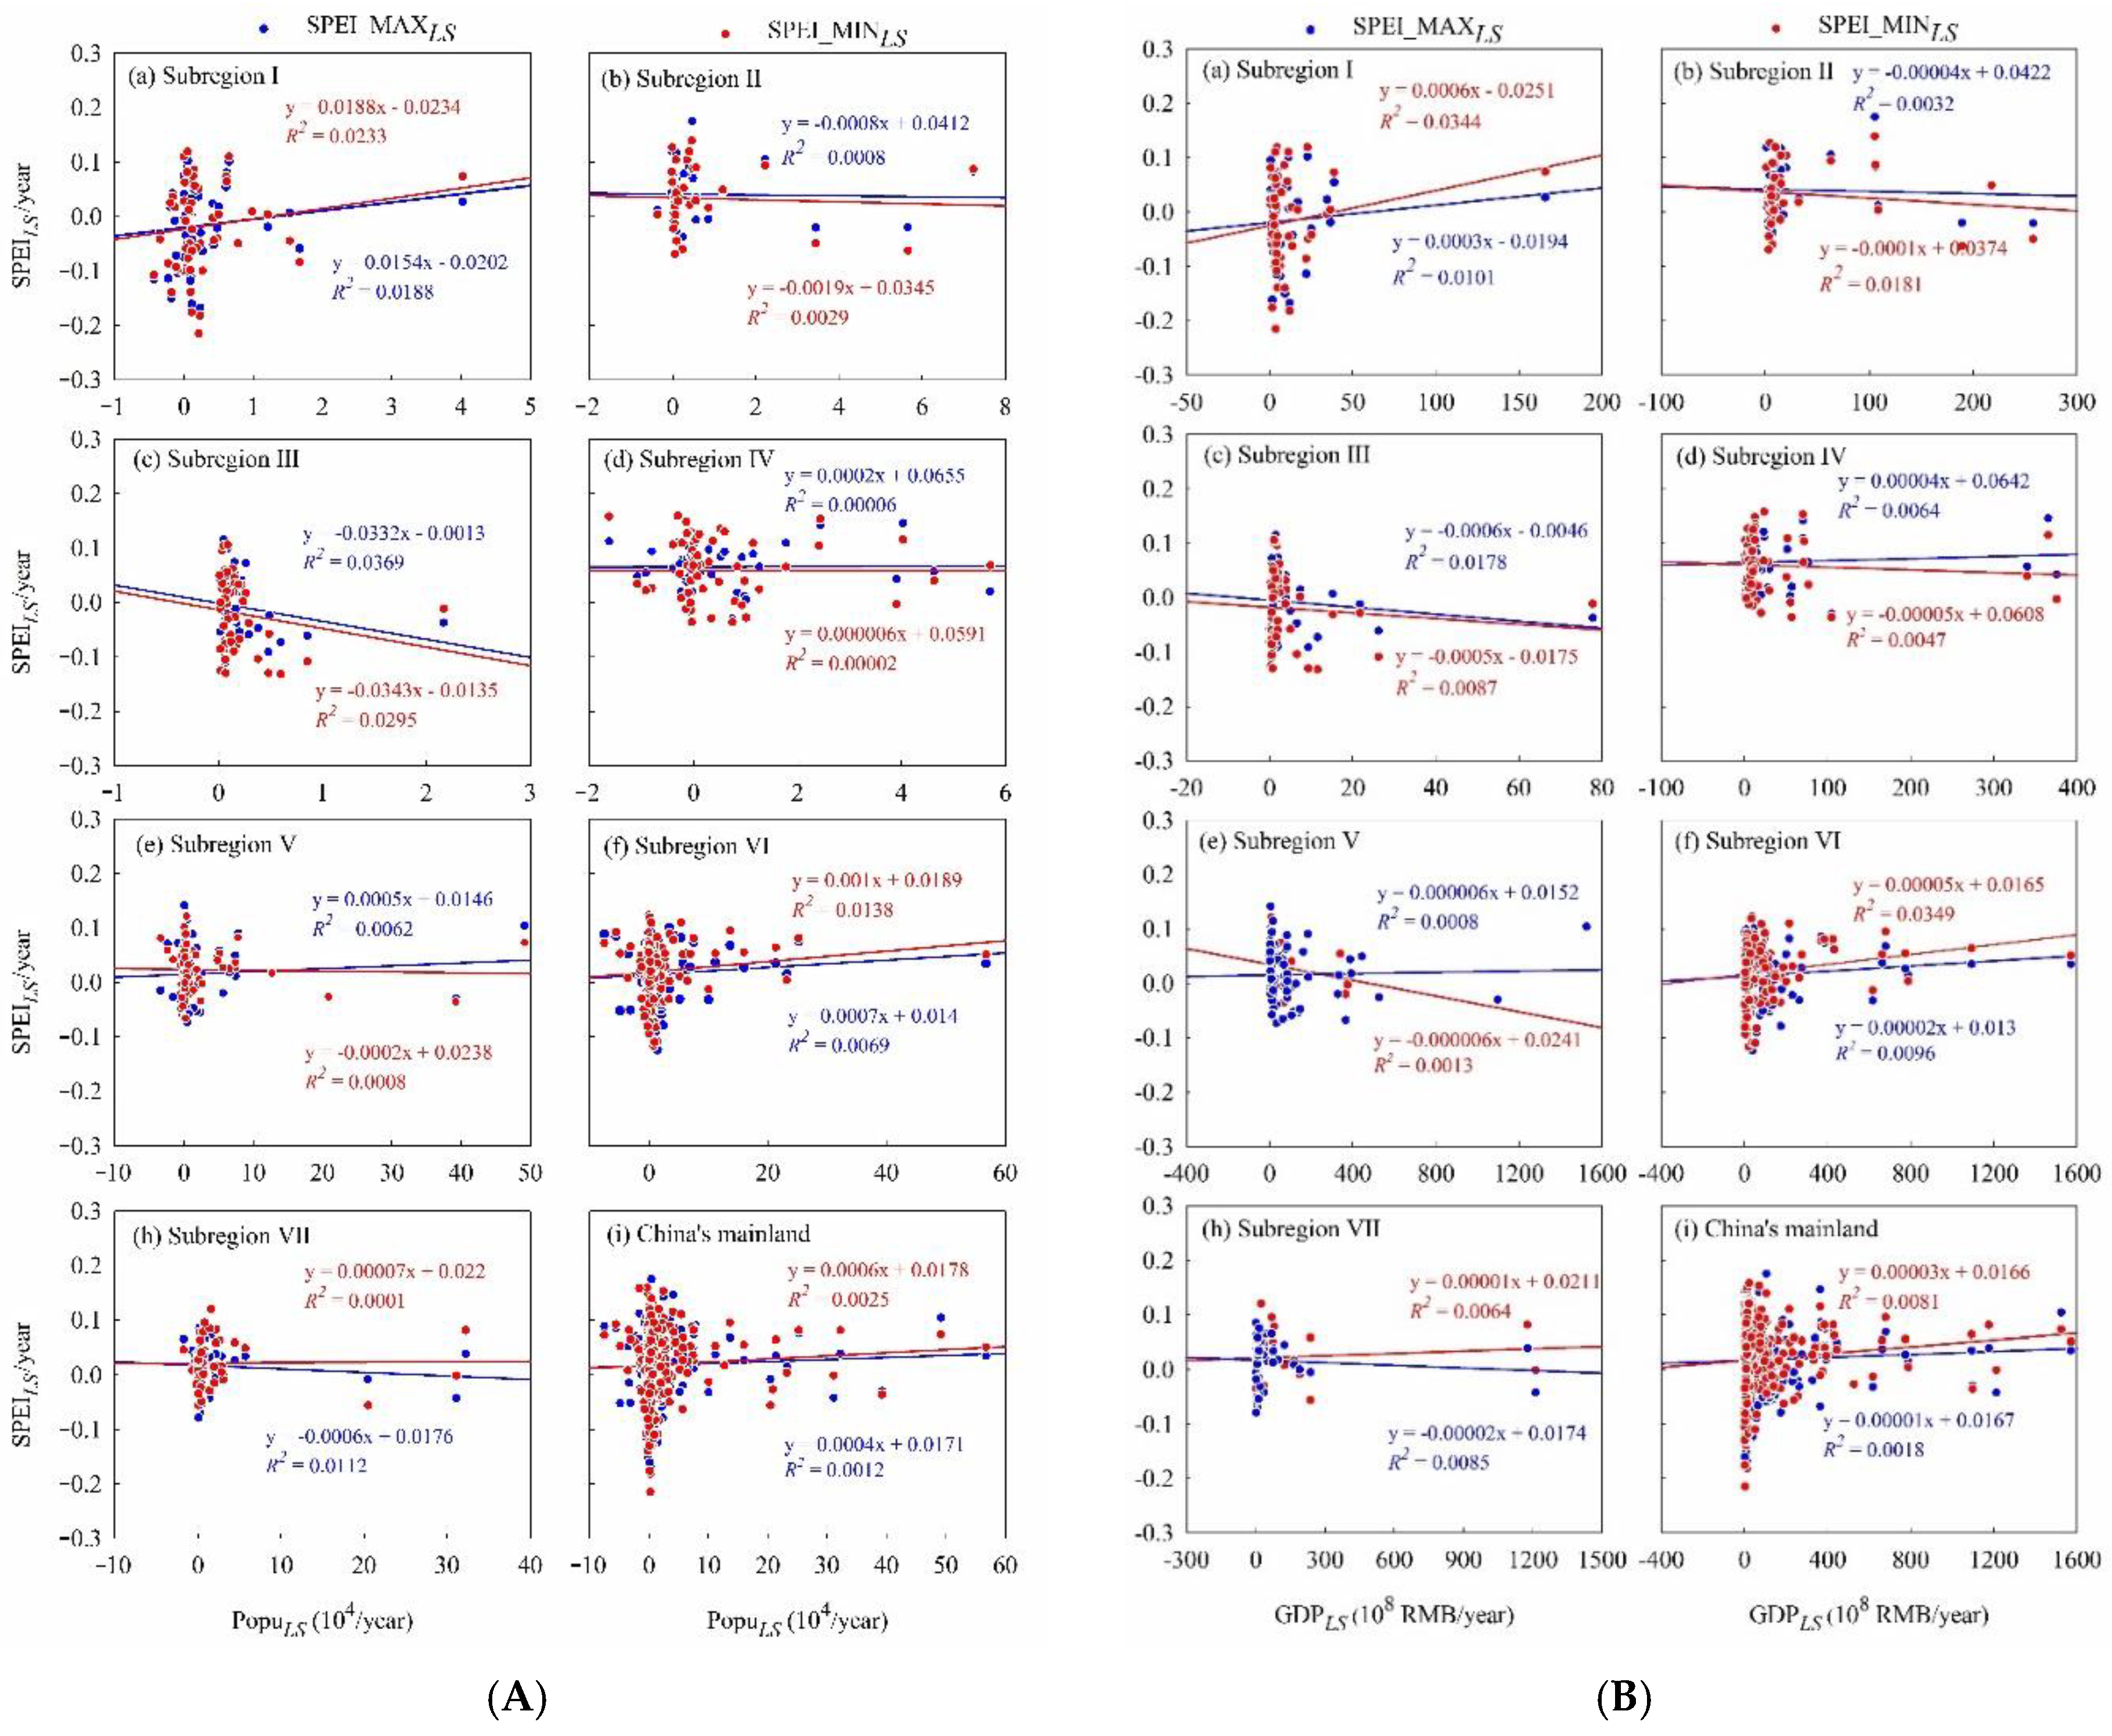
3.4. Relationship between PopuLS, GDPLS, SPEI_MAXLS, and SPEI_MINLS

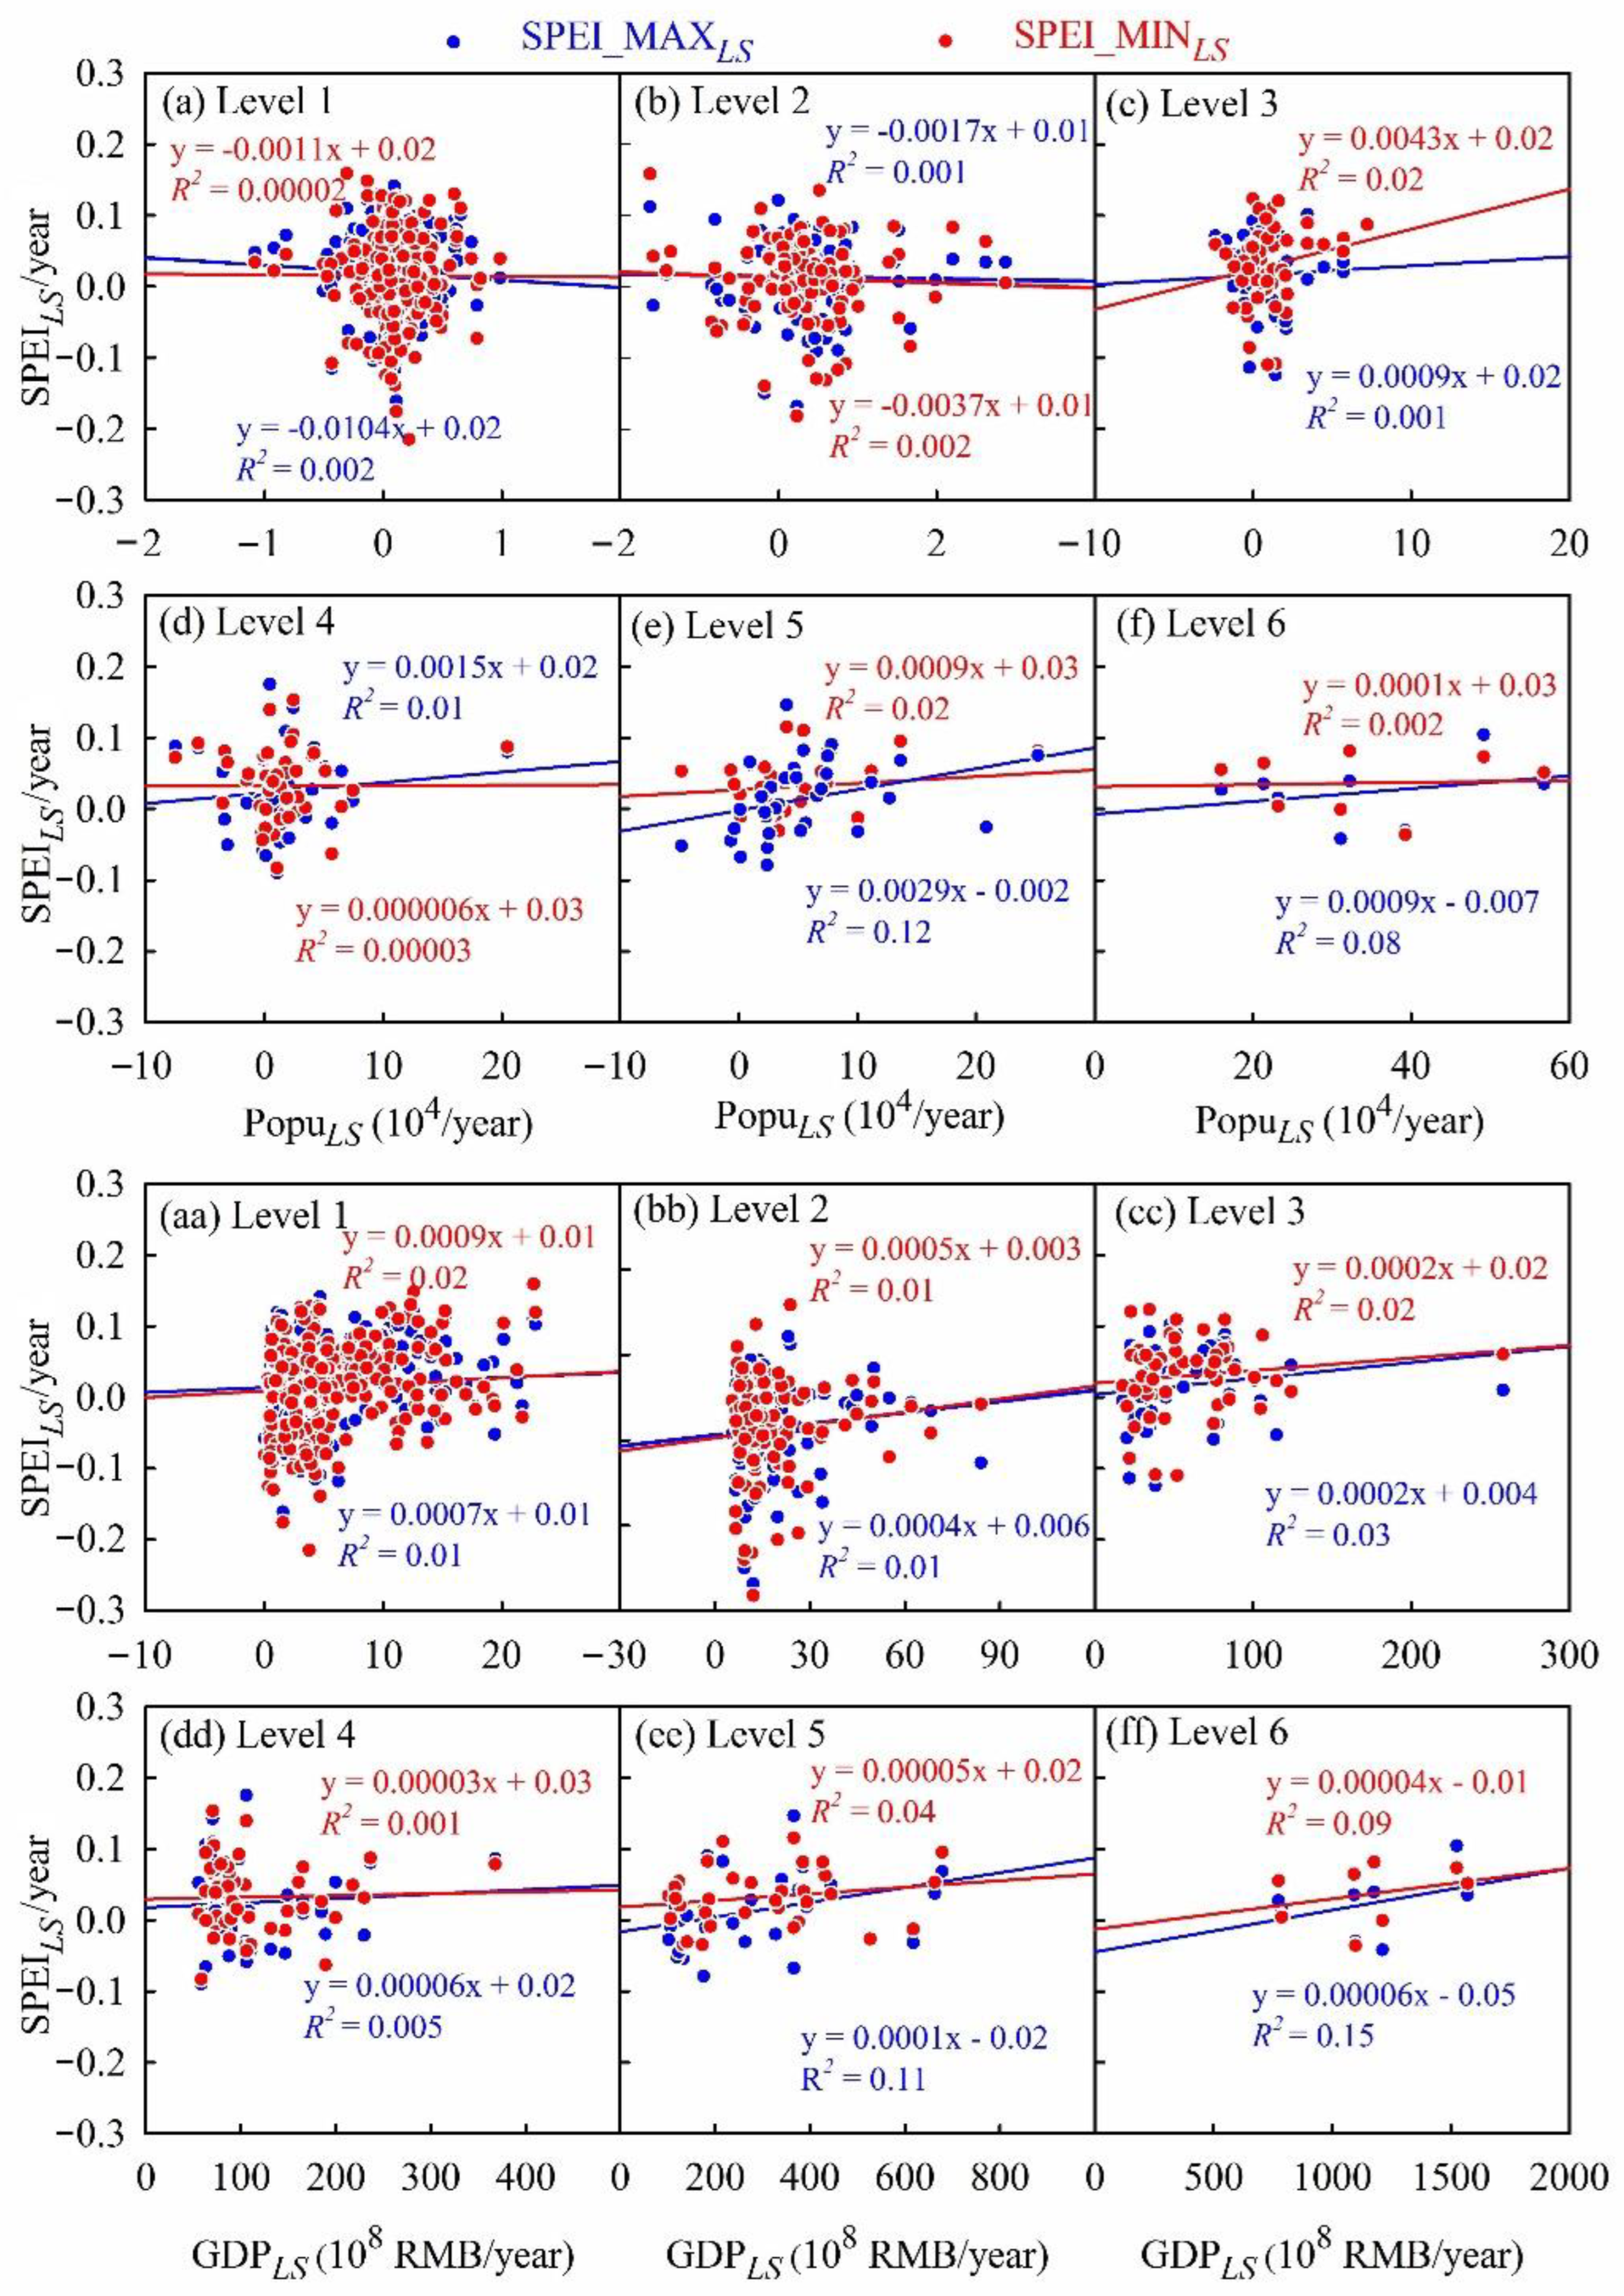
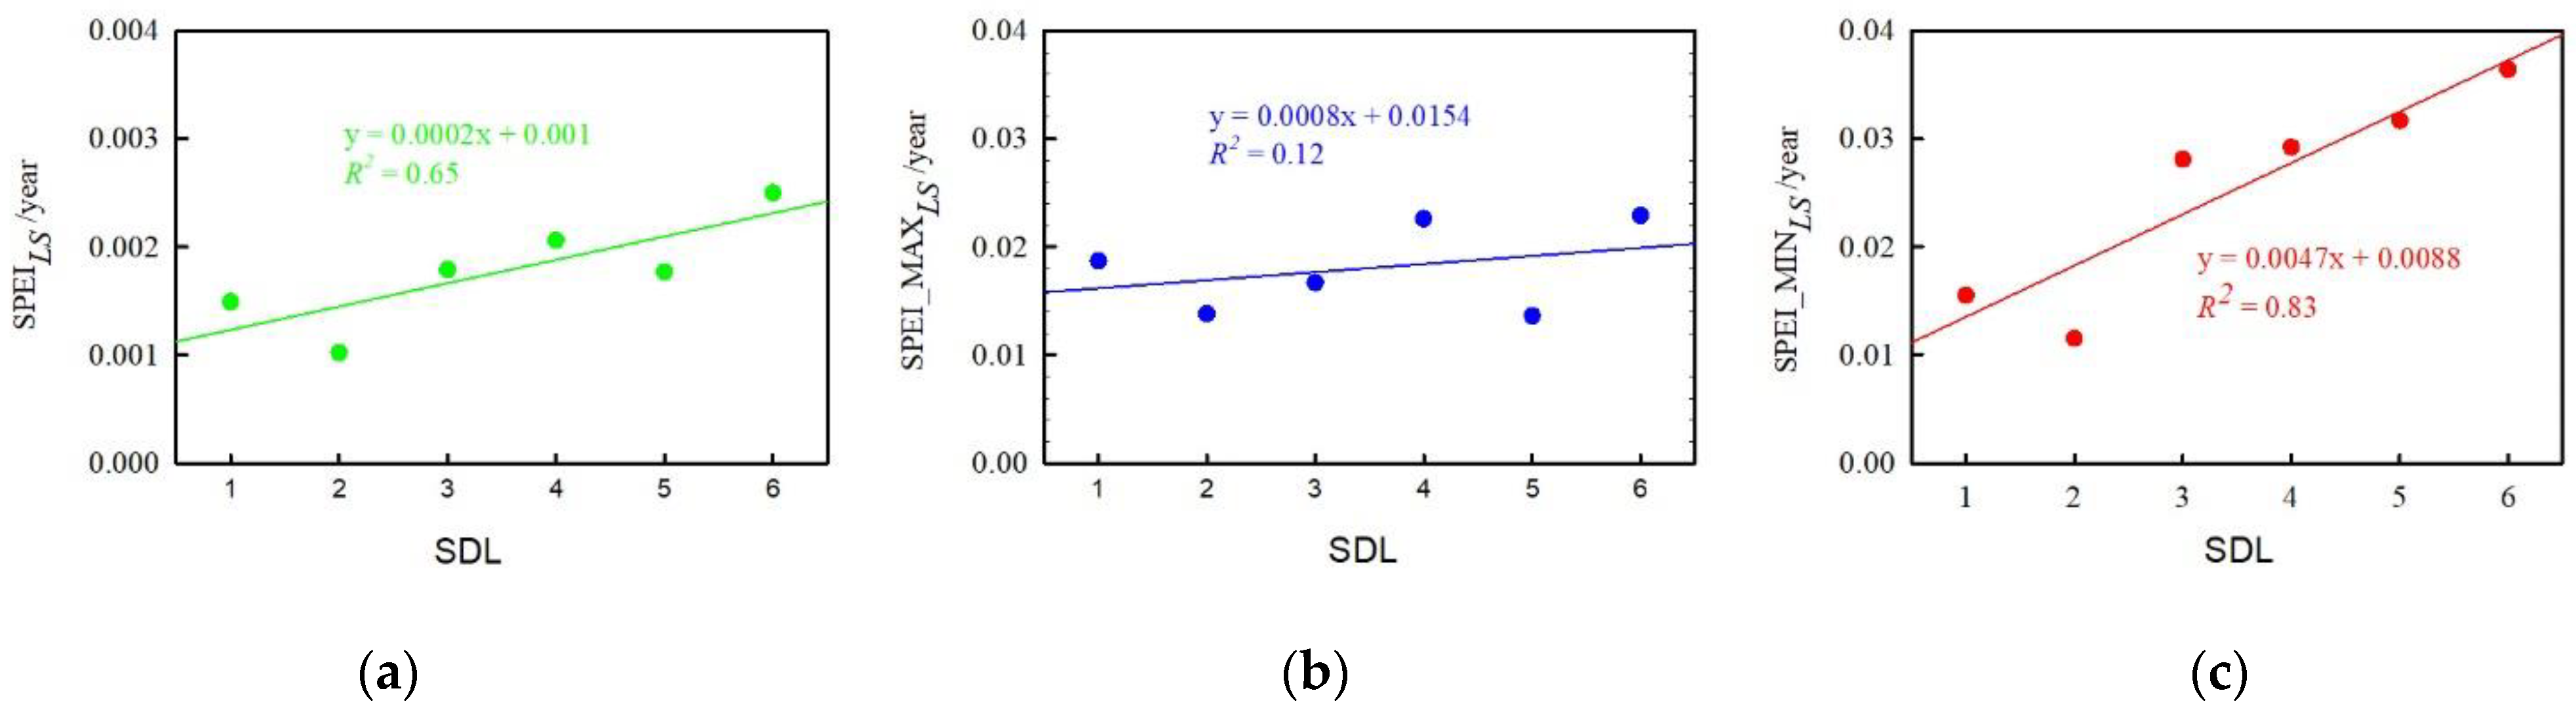
3.4.1. LSs of Socioeconomic Dry/Wet Indices in Different SDLs

The Pearson correlations between SPEI_MAXLS (or SPEI_MINLS) and PopuLS (or GDPLS) explored the connection between SPEI_MAX (or SPEI_MIN) and socioeconomic indices.
The Pearson correlations between SPEI_MAXLS (or SPEI_MINLS) and PopuLS (or GDPLS) at the six SDLs are shown in Figure 4, and the R2 values and the linear functions are also presented. As PopuLS increases, SPEI_MAXLS (or SPEI_MINLS) generally increases with the SDL levels of 3, 4, 5, and 6, which is more obvious for SPEI_MAXLS (with larger LSs). However, there are contrary cases for levels 1 and 2. This implies that extremely wet events tend to be worse in big cities (levels 5 and 6), while extremely dry events may aggravate only small cities or towns (especially for level 4) (Figure 4a–f). As GDPLS increases, SPEI_MAXLS and SPEI_MINLS increase, which shows that the risk of extremely wet events increases while the risk of extremely dry events decreases (Figure 4aa–ff). It is reasonable that the correlations between some variables are low because there is great climate variability with complex circulation processes.
The relationship between pairs of the average PopuLS, GDPLS, and SPEI_MAXLS, and SPEI_MINLS at different SDLs are plotted in Figure 5. There are positive correlations between average PopuLS and SPEI_MAXLS (R2 = 0.28), and between average PopuLS and SPEI_MINLS (R2 = 0.40) (Figure 5a), which are similar for the relationship between average GDPLS and SPEI_MAXLS (R2 = 0.26), and between average GDPLS and SPEI_MINLS (R2 = 0.47) (Figure 5b). This indicates that the effects of population/GDP expansion in China have exaggerated extremely wet/dry events, and their effects on extremely dry events surpass extremely wet events. It shows that increasing human activity may lead to more extremely dry events than extremely wet events (higher slopes). This result is reasonable, since a greater population consumes more water for living and agricultural production.

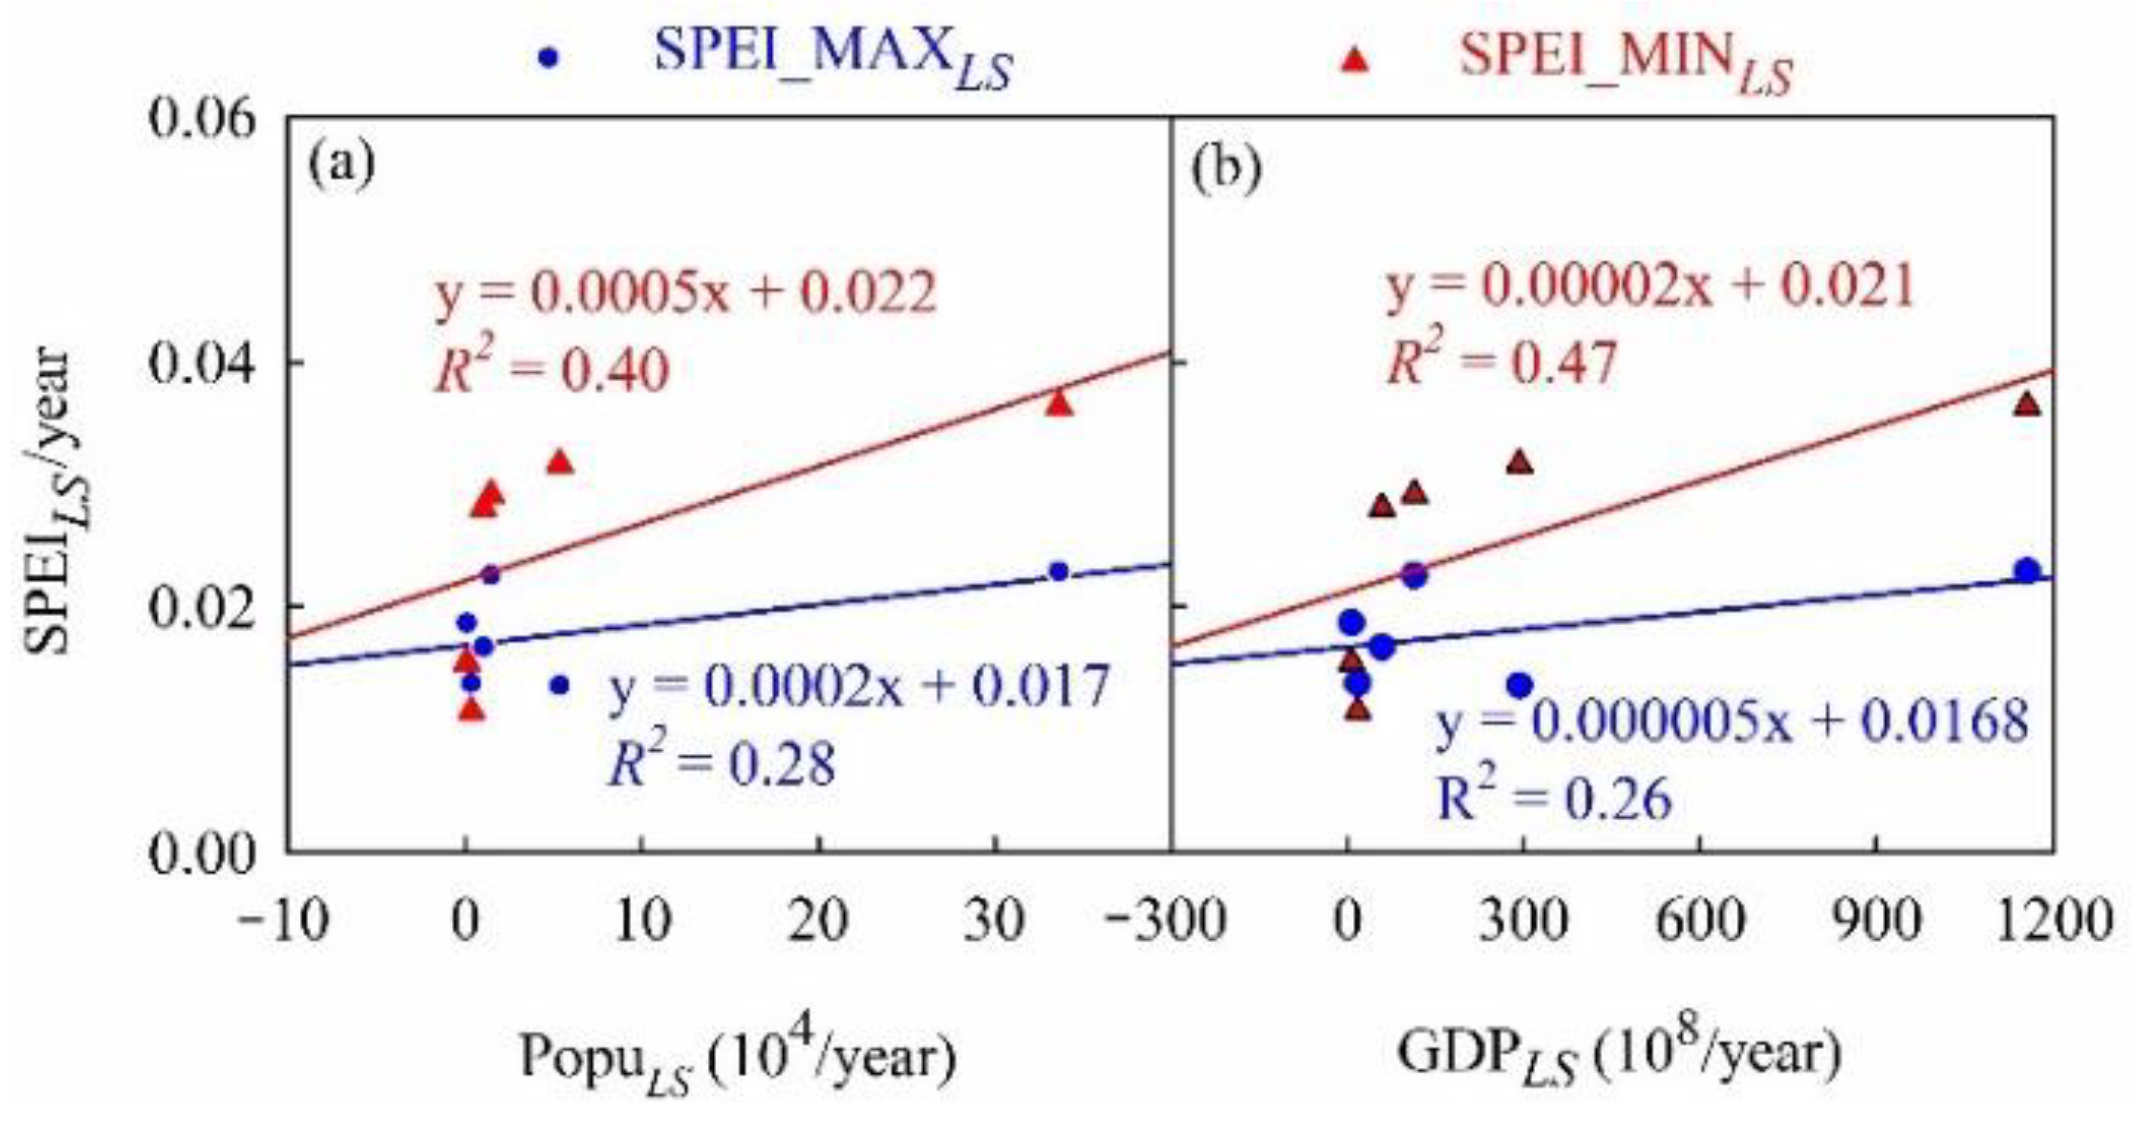
3.4.2. Relationship between PopuLS, GDPLS, and SPEI_MAXLS and SPEI_MINLS

After classification of population and GDP, the influence of extremely wet/dry events is analyzed. In addition, the impact of climate change and the Yellow River regional climate differences cannot be ignored, thus, we also analyze the relationship between PopuLS, GDPLS, and SPEI_MAXLS and SPEI_MINLS in China’s mainland and seven subregions (including the temperate and warm–temperate desert of northwest China (subregion I), the temperate grassland of Inner Mongolia (subregion II), the Qinghai–Tibetan Plateau (subregion III), the temperate humid and sub-humid northeast China (subregion IV), the warm–temperate humid and sub-humid north China (subregion V), the subtropical humid central and south China (subregion VI), and the tropic humid south China (subregion VII), as shown in Figure 6.
The results show that: (1) from Figure 6A, it can be found that for subregion I, IV, and VI, with the increase in population rate, the risk of extremely wet events tends to increase, and extreme drought events gradually become milder, while it is the opposite for subregions II and III. In addition, the risk of extremely wet/dry events tends to rise for subregion V, while it is the opposite for subregion VII. (2) As for Figure 6B, for the GDP aspect, the impact is slightly different from that of population. For subregions I and VI, with the increase in GDP rate, the risk of extremely wet events gradually increases, and extremely dry events tend to become milder, while it is opposite for subregions II and III. For northeast China and north China, extremely wet/dry events are more and more serious with the increase in GDP rate, while for subregion VII the opposite is true. (3) For the whole country, no matter the population and GDP growth rate increase, the risk trend of extremely wet/dry events increases.

3.5. The Variations of LSs for Dry Events at Different SDLs

The relationship between average SPEILS, SPEI_MAXLS, SPEI_MINLS, and SDLs is illustrated in Figure 7. As the level changes from 1 to 6, the SPEILS, SPEI_MAXLS, and SPEI_MINLS tend to increase, which means that either extremely wet/dry events tend to intensify in urban areas and the risk of extremely dry/wet events increases. The higher the degree of urbanization, the more urban construction land area there is with more obvious urban rain and heat island effects than areas with low levels of urbanization. In addition, the absolute values of LSs for SPEI_MINLS is much larger (0.0047) than SPEI_MAXLS (0.0008), and also higher R2 values for the former (0.83) than the latter (0.12), implying much greater effects of population and GDP expansion and urbanization on aggravating extremely dry events. It shows fewer connections between SPEI_MAX (extremely wet events) and SDL than SPEI_MIN (extremely dry events) and SDL. This result confirms results from Figure 4, which also show closer connections between human activity and extremely dry events.

3.6. The Occurrence of Extremely Wet/Dry Events

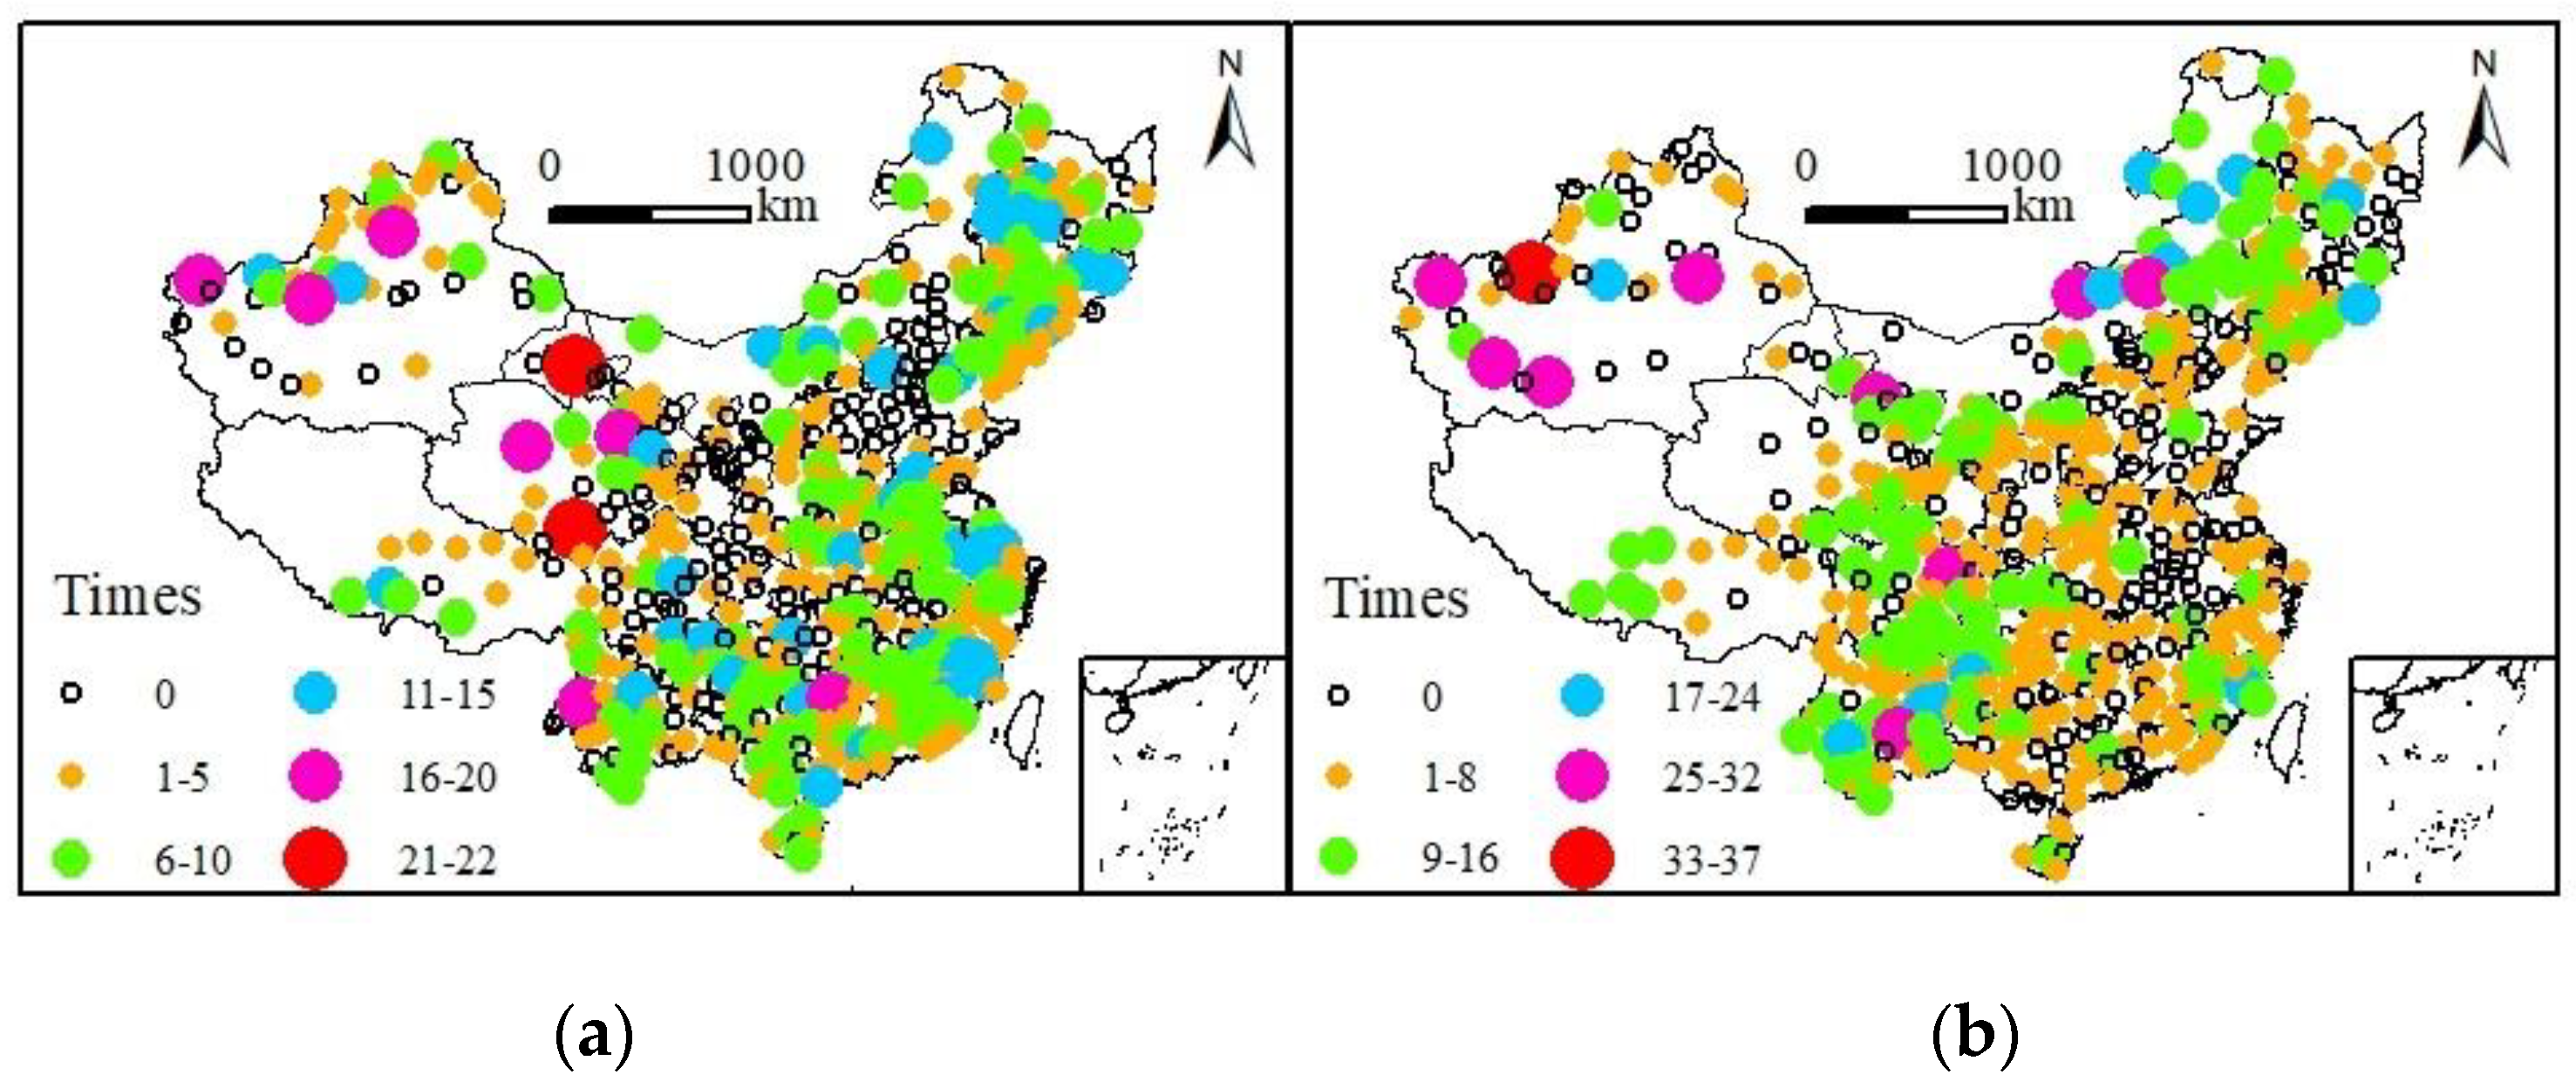
3.6.1. Spatial Distribution of Occurrence Time of Extremely Wet/Dry Events

The spatial distribution of total occurrence times of extremely wet/dry events during the period 2000–2018 in mainland China is mapped in Figure 8. The extremely wet events happen 0 to 22 times and are randomly distributed (Figure 8a). The highest occurrence of times of extremely wet events is 22 times at Yumen in Gansu province (northwest China). In addition, there are 172 sites where no extremely wet events occur, and most of these sites are located in central China. There are 185, 117, 42, and 7 sites where the occurrence times of extremely wet events fall in the ranges of 1 to 5, 6 to 10, 11 to 15, and 16 to 20 times, respectively. The occurrence of extreme drought events ranges from 0 to 37 times (Figure 8b). The highest occurrence of times of extreme drought is 37, which occurs at Aksu, Xinjiang province (northwest China). At Turpan, Hotan, Minfeng in Xinjiang, Erenhot in Inner Mongolia (north China), and Yuxi in Yunnan (southwest China), the extreme drought events occur 28, 28, 26, 26, and 25 times, respectively, which are also large drought events. Moreover, at 168 sites, distributed intensively in the middle of China, no extreme drought events occur. Furthermore, the occurrence of time ranges of extreme drought events of 1–8, 9–16, and 17–24 occur at 229, 105, and 17 sites, respectively, and are distributed randomly.
In fact, Yumen in Gansu is a site with low precipitation. The extreme wet events occur here 22 times, which is shown by SPEI_MAX. Except for Yumen, the results also show a high occurrence of times of extreme events in several sites of northwest China (arid and semi-arid zone). Since SPEI is a standardized index, it shows variations of D around average levels. Such extreme wet events in some low precipitation areas are observed because at the times of occurrence, the D values are much higher than the average D. This is a shortcoming of standardized indices (not only SPEI), which denote the high/low variations of D compared to the referenced standard (average value), but do not represent the actual value of average D. Thus, the high/low values may be exaggerated if the D values are relatively low.

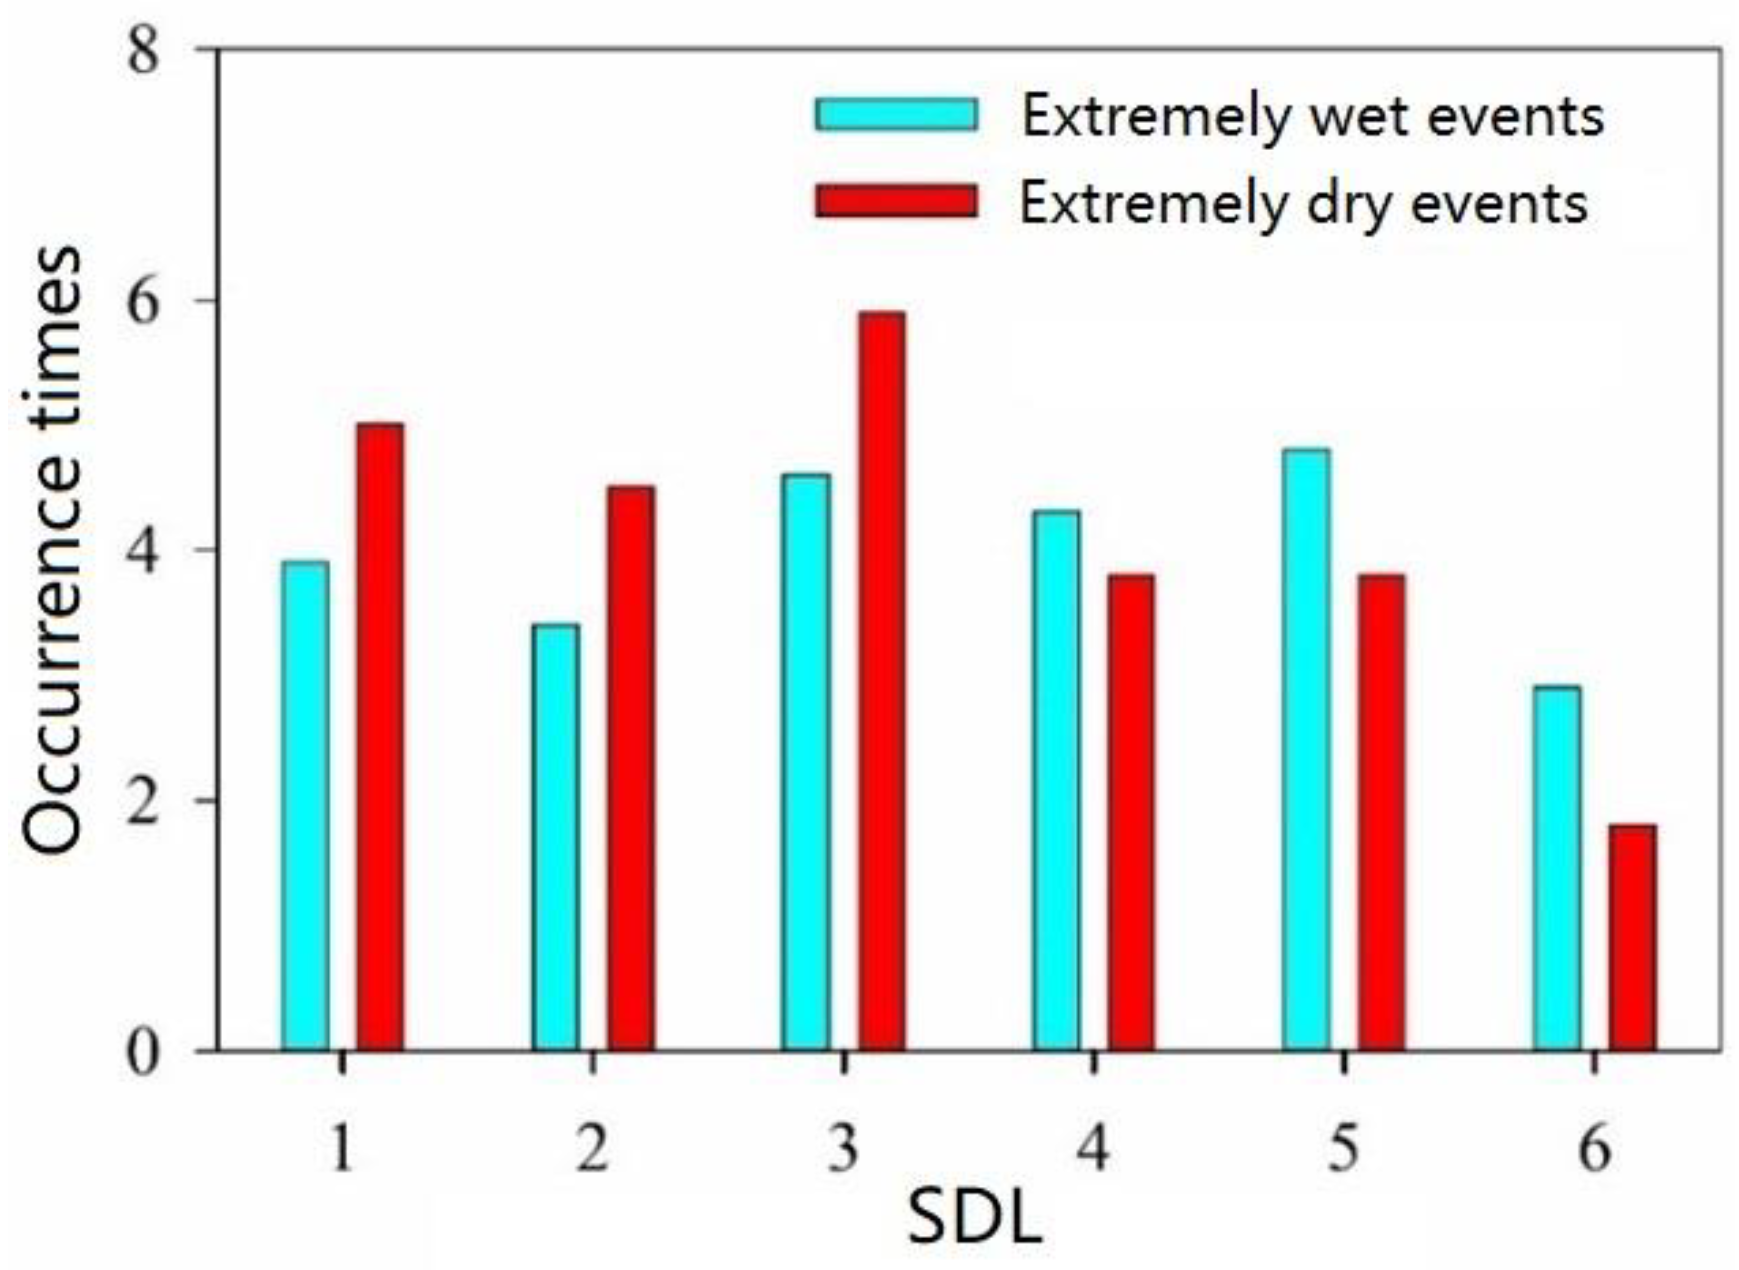
3.6.2. Occurrence of Extremely Wet/Dry Events at Different SDLs

The average occurrence of times of extremely wet/dry events corresponding to the six SDLs during the period 2000–2018 in China’s mainland are illustrated in Figure 9. The extremely wet events occur more often than extreme drought events for levels 4, 5, and 6. The opposite is true for extremely wet events at levels 1, 2, and 3. It indicates that extremely wet events are more severe in developed cities or big municipal cities of high levels, and extreme drought events are more severe in less developed sites of low levels.

4. Discussion

From our classification, the larger the population and the higher the GDP, the higher the SDL. The higher SDL is representative for the higher degree of urbanization. Urbanization development has been accompanied with an obvious urban heat island effect. The most prominent phenomenon is that the urban air temperature is higher than in rural areas, which increases the water-holding capacity and the instability of the atmosphere [39]. It also enhances the condensation nuclear effect. Thus, the urban air pollutants rise, the concentration of pollutant particles in the air increases, pollutant particles produce an enhancement of the condensation nucleus effect, hastens the water vapor condensation catalyst, and, therefore, increases the probability and intensity of urban rainfall [40]. There is also an obvious microtopographic obstruction effect, namely, warm and moist air in the process of movement, encountered in urban high-rise buildings, microtopographic obstruction effect in the climbing process, and rising cooling [41]. All of these changes result in increased precipitation (enhanced urban rain island effect), which increases the risk of extremely wet events. Zheng et al. [42] analyzed the spatial distribution of precipitation in Beijing during the period 1971–2010 and investigated its city effects. The results show that the precipitation has increased trends in urban areas, with decreased trends in the suburb areas. Song et al. [43] analyze the influences of urbanization development on production and confluence in Beijing and the results show that urbanization and human activities result in a drastic adjustment of underlying surface conditions, increasing impermeable areas, increasing run-off coefficients, run-off depth, and flood peak flow in urban catchment areas, which leads to increased risks of urban flooding. Zhang et al. [44] analyze the urban flood and waterlogging in China and indicate that disordered urban development destroys the changes in urban drainage patterns and drainage patterns, and increases the vulnerability of drainage systems, resulting in increased extremely wet events in cities. This research applied SPEI_MAX at different SDLs and shows increasing extremely wet events at high SDLs (developed regions), resulting in the increased risk of extremely wet events.
In addition, by analyzing the linear slopes of precipitation (simplified as PLS), ET0 (simplified as ET0LS), and P-ET0 (simplified as (P-ET0)LS) (Figure 10), an increased PLS, decreased ET0LS, and subsequently decreased (P-ET0)LS are found as the SDL increases, and this also verifies the occurrence of extremely wet events in developed areas. The decreased ET0LS from Figure 10b also indirectly denotes the decreased trends in extremely dry events as the SDL increases. This result partially explains the connections between extremely wet/dry events and human activities, as shown in Figure 7. In addition, urban rain island effect, heat island effect, changes in the underlying surface condition, enhancement of condensation nucleus effect, and change in drainage patterns also indirectly alleviate extremely dry events. Infrastructure construction, including disaster prevention systema and the cultural and educational popularization of water resources protection, in urban areas is far more stable and widespread than that in non-urban areas [45], which gradually relieves the extremely dry events as the level increases. As a result of the comprehensive effect of various factors, extremely wet/dry events have become more and more prominent. There is also a common view, in recent years, that the “dry areas get drier, while the wet regions get wetter” [46,47]. Some measures should be taken to deal with the occurrence of extremely wet/dry events, such as to strengthen the construction of infrastructure, to establish three-dimensional monitoring of extremely wet/dry events, or to improve extremely wet/dry events emergency forecasting systems.
A total 525 sites were divided into six SDLs by population and GDP. However, site distribution in China is uneven, which may lead to some deviations in regional analysis. This research implies the possible impacts of human activity (denoted by population), economic, and social development (denoted by population and GDP) on extremely wet/dry events in China. Although difficult, more efforts should be devoted to identifying the contributions of human activities and climate change on extremely wet/dry events.
The inner reasons for the SDLs affecting extreme wet/dry events are complex [16,17]. The extremely wet/dry events in China are both affected by climate variability and human activities, of which climate change plays a greater role [48]. On one hand, climate has great variability and its changes are affected by diverse factors. For China, the uneven precipitation distribution with synchronized rainfall–heat, as well as the summer monsoons, cause generally wet/hot events in summer and cold/dry events in winter [18,49]. In addition, atmospheric circulations such as ENSO, west Pacific subtropical ridge, tropical cyclones, or typhoons also contribute to the extremely wet/dry events [19,22,23]. On the another hand, various human activities intensify the severity of the wet/dry events [50]. These human activities include industrial activities, which increase greenhouse gas concentrations [51]; agricultural management activities, which consume more water in plantings [52]; water allocation/diversion/adjustment activities, which change the natural water distribution and evapotranspiration patterns of waterbodies and watersheds [53]; and the over-exploration of water resources and urbanization (denoted by increasing population and GDPs), which generate more urban inland inundation events. These human activities disturb the natural processes, induce a more vulnerable and sensitive world, and intensify the occurrence of the extremely wet/dry events. In this paper, we only studied the SDL effects on extremely wet/dry events. The effects of more types of human activities on extremely wet/dry events are necessary in future studies.

5. Conclusions

The selected total 525 sites were divided into six SDLs by population and GDP in 2018. The population and GDP of each level tend to increase, especially in big cities such as Beijing, Shanghai, Guangzhou, and Shenzhen, which belong to SDL 6 and are located mostly in developed eastern China. Extremely wet events denoted by SPEI_MAX have become worse and extremely dry events denoted by SPEI_MIN tend to be milder over time. The years 2016, with average SPEI_MAX of SPEI12-month of 1.83, and 2011, with average SPEI_MIN of SPEI12-month of −1.58, were found to be extremely wet/dry years in China, respectively. This gradual, continuous increase in SPEI_MAX or decrease in SPEI_MIN has been, potentially, affected by the fast expansion of population and rapid growing of GDP and urbanization, especially for SDLs of levels 5 and 6. The extremely wet events are more severe in developed cities at high levels, and the extremely dry events are more severe in less developed sites at low levels.
The main reasons could be the urban rain island effect, heat island effect, and the underlying surface condition changes. This research investigated the variations in extremely wet/dry events in different SDLs in China from social and economic respects. It could be used as a reference for policy makers to prevent extremely wet/dry events for prefecture-level or county-level cities at different levels. Further studies need to be carried out on the contribution of human activities and climate change to extremely wet/dry events.

Supplementary Materials

The following supporting information can be downloaded at: https://www.mdpi.com/article/10.3390/w14233950/s1, Figure S1: The temporal fluctuations of population and GDP between 2000–2018, their linear slopes (LS) variations with different SDLs, and the spatial distribution of PopuLS and GDPLS in mainland China; Figure S2: The boxplot of SPEI_MAX variations for the sites belonging to the six SDLs between 2000–2018; Figure S3: The boxplot of SPEI_MIN variations for the sites belonging to six SDLs between 2000–2018.

Author Contributions

Conceptualization, Q.Z., Y.L. and N.Y.; methodology, Q.H.; software, F.L.; validation, Q.Z., Q.M. and P.F.; formal analysis, X.S.; investigation, Q.Z.; resources and revision, Y.L.; data curation, B.P.; writing, Q.Z. and Q.H.; supervision, revision, and financial support, Y.L. All authors have read and agreed to the published version of the manuscript.

Funding

This research was funded by the Key Research and Development Program of China (No. 2019YFA0606902), National Natural Science Foundation of China (No. 52079114), and High-end Foreign Experts Introduction Project (No. G2022172025L).

Institutional Review Board Statement

Not applicable.

Informed Consent Statement

Not applicable.

Data Availability Statement

Not applicable.

Acknowledgments

The meteorological data were shared by Service Network in China. The anonymous reviewers provided us with helpful comments that helped greatly in improving the manuscript.

Conflicts of Interest

The authors declare no conflict of interest.

References

  1. Stegall, S.T.; Kunkel, K.E. Monthly Extreme Temperature Trends in CMIP5 Hindcast/Prediction Simulations, 1981–2010 and 2006–35. J. Appl. Meteorol. Climatol. 2017, 56, 1141–1154. [Google Scholar] [CrossRef]
  2. Alexander, L.V.; Arblaster, J.M. Historical and projected trends in temperature and precipitation extremes in Australia in observations and CMIP5. Weather Clim. Extrem. 2017, 15, 34–56. [Google Scholar] [CrossRef]
  3. Smith, K.; Morton, M.; Rico, D.; Mohamad Abadi, A.; Luna, I.; Livneh, B.; Munoz-Arriola, F. Hydroclimatology of Extreme Drought and Flood Events in the Northern High Plains, U.S.; Fall Meeting 2014; Abstract Id. H23N-1089; American Geophysical Union: Washington, DC, USA, 2014. [Google Scholar]
  4. Cook, E.R.; Seager, R.; Cane, M.A.; Stahle, D.W. North American drought: Reconstructions, causes, and consequences. Earth-Sci. Rev. 2007, 81, 93–134. [Google Scholar] [CrossRef]
  5. Komori, D.; Nakamura, S.; Kiguchi, M.; Nishijima, A.; Yamazaki, D.; Suzuki, S.; Kawasaki, A.; Oki, K.; Oki, T. Characteristics of the 2011 Chao Phraya River flood in Central Thailand. Hydrol. Res. Lett. 2012, 6, 41–46. [Google Scholar] [CrossRef]
  6. Sena, J.A.; Beser de Deus, L.A.; Freitas, M.A.V.; Costa, L. Extreme Events of Droughts and Floods in Amazonia: 2005 and 2009. Water Resour. Manag. 2012, 26, 1665–1676. [Google Scholar] [CrossRef]
  7. Modarres, R.; Sarhadi, A.; Burn, D.H. Changes of extreme drought and flood events in Iran. Glob. Planet. Chang. 2016, 144, 67–81. [Google Scholar] [CrossRef]
  8. Jayadas, A.; Ambujam, N.K. A quantitative assessment of vulnerability of farming communities to extreme precipitation events in Lower Vellar River sub-basin, India. Environ. Dev. Sustain. 2022. [Google Scholar] [CrossRef]
  9. Jongman, B.; Hochrainer-Stigler, S.; Feyen, L.; Aerts, J.C.J.H.; Mechler, R.; Botzen, W.J.W.; Bouwer, L.M.; Pflug, G.; Rojas, R.; Ward, P.J. Increasing stress on disaster-risk finance due to large floods. Nat. Clim. Chang. 2014, 4, 264–268. [Google Scholar] [CrossRef]
  10. Jonkman, S.N. Global Perspectives on Loss of Human Life Caused by Floods. Nat. Hazards 2005, 34, 151–175. [Google Scholar] [CrossRef]
  11. Spinoni, J.; Barbosa, P.; De Jager, A.; McCormick, N.; Naumann, G.; Vogt, J.V.; Magni, D.; Masante, D.; Mazzeschi, M. A new global database of meteorological drought events from 1951 to 2016. J. Hydrol. Reg. Stud. 2019, 22, 100593. [Google Scholar] [CrossRef]
  12. Shiru, M.S.; Shahid, S.; Chung, E.-S.; Alias, N. Changing characteristics of meteorological droughts in Nigeria during 1901–2010. Atmospheric Res. 2019, 223, 60–73. [Google Scholar] [CrossRef]
  13. Liu, Y.; Cai, W.; Lin, X.; Li, Z. Increased extreme swings of Atlantic intertropical convergence zone in a warming climate. Nat. Clim. Chang. 2022, 12, 828–833. [Google Scholar] [CrossRef]
  14. Collins, M.J. Evidence for Changing Flood Risk in New England Since the Late 20th Century. JAWRA J. Am. Water Resour. Assoc. 2009, 45, 279–290. [Google Scholar] [CrossRef]
  15. Daksiya, V.; Mandapaka, P.V.; Lo, E.Y.M. Effect of climate change and urbanisation on flood protection decision-making. J. Flood Risk Manag. 2021, 14, e12681. [Google Scholar] [CrossRef]
  16. Farhidi, F.; Madani, K.; Crichton, R. Have Extreme Events Awakened Us? Sustainability 2022, 14, 7417. [Google Scholar] [CrossRef]
  17. Brunner, M.I.; Slater, L.; Tallaksen, L.M.; Clark, M. Challenges in modeling and predicting floods and droughts: A review. WIREs Water 2021, 8, e1520. [Google Scholar] [CrossRef]
  18. Wang, W.; Chen, X.; Shi, P.; van Gelder, P.H.A.J.M. Detecting changes in extreme precipitation and extreme streamflow in the Dongjiang River Basin in southern China. Hydrol. Earth Syst. Sci. 2008, 12, 207–221. [Google Scholar] [CrossRef] [Green Version]
  19. Duan, W.; He, B.; Nover, D.; Fan, J.; Yang, G.; Chen, W.; Meng, H.; Liu, C. Floods and associated socioeconomic damages in China over the last century. Nat. Hazards 2016, 82, 401–413. [Google Scholar] [CrossRef]
  20. Zhao, X.; Li, H.; Qi, Y. Are Chinese Cities Prepared to Manage the Risks of Extreme Weather Events? Evidence from the 2021.07.20 Zhengzhou Flood in Henan Province 2022. Available online: https://ssrn.com/abstract=4043303 (accessed on 29 September 2022). [CrossRef]
  21. Fan, J.; Liu, B.; Ming, X.; Sun, Y.; Qin, L. The amplification effect of unreasonable human behaviours on natural disasters. Humanit. Soc. Sci. Commun. 2022, 9, 322. [Google Scholar] [CrossRef]
  22. Yang, J.; Gong, D.; Wang, W.; Hu, M.; Mao, R. Extreme drought event of 2009/2010 over southwestern China. Meteorol. Atmospheric Phys. 2012, 115, 173–184. [Google Scholar] [CrossRef]
  23. Mallapaty, S. China’s extreme weather challenges scientists trying to study it. Nature 2022, 609, 888. [Google Scholar] [CrossRef] [PubMed]
  24. Beguería, S.; Vicente-Serrano, S.M.; Reig, F.; Latorre, B. Standardized precipitation evapotranspiration index (SPEI) revisited: Parameter fitting, evapotranspiration models, tools, datasets and drought monitoring. Int. J. Climatol. 2014, 34, 3001–3023. [Google Scholar] [CrossRef] [Green Version]
  25. Chamberlin, G. Gross domestic product, real income and economic welfare. Econ. Labour Mark. Rev. 2011, 5, 5–25. [Google Scholar] [CrossRef] [Green Version]
  26. Yao, N.; Li, Y.; Lei, T.; Peng, L. Drought evolution, severity and trends in mainland China over 1961–2013. Sci. Total Environ. 2018, 616–617, 73–89. [Google Scholar] [CrossRef] [PubMed]
  27. Yao, N.; Li, Y.; Li, N.; Yang, D.; Ayantobo, O.O. Bias correction of precipitation data and its effects on aridity and drought assessment in China over 1961–2015. Sci. Total Environ. 2018, 639, 1015–1027. [Google Scholar] [CrossRef]
  28. Liu, L.; Wang, Z. The development and application practice of wind–solar energy hybrid generation systems in China. Renew. Sustain. Energy Rev. 2009, 13, 1504–1512. [Google Scholar] [CrossRef]
  29. Ayugi, B.; Ngoma, H.; Babaousmail, H.; Karim, R.; Iyakaremye, V.; Lim Kam Sian, K.T.C.; Ongoma, V. Evaluation and projection of mean surface temperature using CMIP6 models over East Africa. J. Afr. Earth Sci. 2021, 181, 104226. [Google Scholar] [CrossRef]
  30. Polong, F.; Chen, H.; Sun, S.; Ongoma, V. Temporal and spatial evolution of the standard precipitation evapotranspiration index (SPEI) in the Tana River Basin, Kenya. Theor. Appl. Climatol. 2019, 138, 777–792. [Google Scholar] [CrossRef]
  31. Ojara, M.A.; Yunsheng, L.; Babaousmail, H.; Sempa, A.K.; Ayugi, B.; Ogwang, B.A. Evaluation of Drought, Wet Events, and Climate Variability Impacts on Maize Crop Yields in East Africa during 1981–2017. Int. J. Plant Prod. 2022, 16, 41–62. [Google Scholar] [CrossRef]
  32. Allan, R.; Pereira, L.; Smith, M. Crop Evapotranspiration-Guidelines for Computing Crop Water Requirements; FAO Irrigation and Drainage Paper 56; Food and Agriculture Organization: Rome, Italy, 1998; Volume 56. [Google Scholar]
  33. Chen, Y.; Li, Y.; Qi, D. Analysis on effect of south asia high on mid-summer extreme drought and flood in Sichuan-Chongqing region. J. Trop. Meteorol. 2014, 20, 163–172. [Google Scholar] [CrossRef]
  34. Vicente-Serrano, S.M.; Beguería, S.; López-Moreno, J.I. A Multiscalar Drought Index Sensitive to Global Warming: The Standardized Precipitation Evapotranspiration Index. J. Clim. 2010, 23, 1696–1718. [Google Scholar] [CrossRef] [Green Version]
  35. Singh, V.P.; Guo, H.; Yu, F.X. Parameter estimation for 3-parameter log-logistic distribution (LLD3) by Pome. Stoch. Hydrol. Hydraul. 1993, 7, 163–177. [Google Scholar] [CrossRef]
  36. Zhao, X.; Xia, H.; Liu, B.; Jiao, W. Spatiotemporal Comparison of Drought in Shaanxi–Gansu–Ningxia from 2003 to 2020 Using Various Drought Indices in Google Earth Engine. Remote Sens. 2022, 14, 1570. [Google Scholar] [CrossRef]
  37. Li, L.; Yao, N.; Liu, D.L.; Song, S.; Lin, H.; Chen, X.; Li, Y. Historical and future projected frequency of extreme precipitation indicators using the optimized cumulative distribution functions in China. J. Hydrol. 2019, 579, 124170. [Google Scholar] [CrossRef]
  38. Lu, E.; Cai, W.; Jiang, Z.; Zhang, Q.; Zhang, C.; Higgins, R.W.; Halpert, M.S. The day-to-day monitoring of the 2011 severe drought in China. Clim. Dyn. 2014, 43, 1–9. [Google Scholar] [CrossRef]
  39. Li, C.; Shen, D.; Dong, J.; Yin, J.; Zhao, J.; Xue, D. Monitoring of urban heat island in Shanghai, China, from 1981 to 2010 with satellite data. Arab. J. Geosci. 2014, 7, 3961–3971. [Google Scholar] [CrossRef]
  40. Jaqaman, H.; Mekjian, A.Z.; Zamick, L. Nuclear condensation. Phys. Rev. C 1983, 27, 2782–2791. [Google Scholar] [CrossRef]
  41. Yin, S.; Li, W.; Chen, D.; Jeong, J.-H.; Guo, W. Diurnal variations of summer precipitation in the Beijing area and the possible effect of topography and urbanization. Adv. Atmos. Sci. 2011, 28, 725–734. [Google Scholar] [CrossRef]
  42. Zheng, Z.; Gao, H.; Wang, Z.W.; Li, Q.C. Analysis on Spatial Distribution of Precipitation in Beijing and Its City Effect. Plateau Meteorol. 2014, 33, 522–529. (In Chinese) [Google Scholar] [CrossRef]
  43. Song, X.; Zhang, J.; He, R.; Zou, X.; Zhang, C. Urban flood and waterlogging and causes analysis in Beijing. Advances in Water Science. 2019, 30, 153–165. (In Chinese) [Google Scholar] [CrossRef]
  44. Zhang, J.; Wang, Y.; He, R.; Hu, Q.; Song, X. Discussion on the urban flood and waterlogging and causes analysis in China. Adv. Water Sci. 2016, 27, 485–491. [Google Scholar] [CrossRef]
  45. Yang, G.; Ying, S. Evaluating the Demand of Investment and Financing in Rural Infrastructure Construction in Jiangsu Province. Affect. Comput. Intell. Interact. 2012, 137, 891–901. [Google Scholar] [CrossRef]
  46. Feng, H.; Zhang, M. Global land moisture trends: Drier in dry and wetter in wet over land. Sci. Rep. 2016, 5, 18018. [Google Scholar] [CrossRef] [PubMed] [Green Version]
  47. Chou, C.; Neelin, J.D.; Chen, C.; Tu, J. Evaluating the “Rich-Get-Richer” Mechanism in Tropical Precipitation Change under Global Warming. J. Clim. 2009, 22, 1982–2005. [Google Scholar] [CrossRef]
  48. Chen, X.; Li, Y.; Yao, N.; Liu, D.L.; Liu, Q.; Song, X.; Liu, F.; Pulatov, B.; Meng, Q.; Feng, P. Projected dry/wet regimes in China using SPEI under four SSP-RCPs based on statistically downscaled CMIP6 data. Int. J. Climatol. 2022, 1–28. [Google Scholar] [CrossRef]
  49. Javed, T.; Li, Y.; Feng, K.; Ayantobo, O.O.; Ahmad, S.; Chen, X.; Rashid, S.; Suon, S. Monitoring responses of vegetation phenology and productivity to extreme climatic conditions using remote sensing across different sub-regions of China. Environ. Sci. Pollut. Res. 2021, 28, 3644–3659. [Google Scholar] [CrossRef]
  50. Sillmann, J.; Stjern, C.W.; Myhre, G.; Samset, B.H.; Hodnebrog, Ø.; Andrews, T.; Boucher, O.; Faluvegi, G.; Forster, P.; Kasoar, M.R.; et al. Extreme wet and dry conditions affected differently by greenhouse gases and aerosols. Npj Clim. Atmospheric Sci. 2019, 2, 1–7. [Google Scholar] [CrossRef] [Green Version]
  51. Bucchignani, E.; Zollo, A.L.; Cattaneo, L.; Montesarchio, M.; Mercogliano, P. Extreme weather events over China: Assessment of COSMO-CLM simulations and future scenarios. Int. J. Climatol. 2017, 37, 1578–1594. [Google Scholar] [CrossRef]
  52. Wang, X. Managing Land Carrying Capacity: Key to Achieving Sustainable Production Systems for Food Security. Land 2022, 11, 484. [Google Scholar] [CrossRef]
  53. Gerdener, H.; Kusche, J.; Schulze, K.; Ghazaryan, G.; Dubovyk, O. Revising precipitation—Water storages—Vegetation signatures with GRACE-based data assimilation. J. Hydrol. 2022, 612, 128096. [Google Scholar] [CrossRef]
Figure 1. The spatial distribution of digital elevation (m), weather station, and SDLs based on population, GDP, or both (using data from 2018). (a) Elevation and weather station locations. (b) SDL classification by population. (c) SDL classification by GDP. (d) SDL classification by population and GDP.
Water 14 03950 g001
Figure 2. The variations and LSs of SPEI_MAX and SPEI_MIN during the period 2000–2018 at different SDLs. (a) Variations in SPEI_MAX. (b) LSs of SPEI_MAX. (c) Variations in SPEI_MIN. (d) LSs of SPEI_MIN.
Water 14 03950 g002
Figure 3. Spatial distribution of SPEILS (a), SPEI_MAXLS (b), and SPEI_MINLS (c) in mainland China.
Water 14 03950 g003
Figure 4. Relationship between pairs of PopuLS, GDPLS and SPEI_MAXLS, SPEI_MINLS for the different SDLs. (af) shows relationship between pairs of PopuL and SPEI_MAXLS and SPEI_MINLS from SDL of 1 to 6. (aaff) shows relationship between pairs of GDPLS and SPEI_MAXLS and SPEI_MINLS from SDL of 1 to 6.
Water 14 03950 g004
Figure 5. SPEI_MAXLS/SPEI_MINLS vs. average PopuLS (a) and GDPLS (b) for different SDLs.
Water 14 03950 g005
Figure 6. Relationship between PopuLS/GDPLS and SPEI_MAXLS/SPEI_MINLS. (A) SPEI_MAXLS/SPEI_MINLS vs. PopuLS. (B) SPEI_MAXLS/SPEI_MINLS vs. GDPLS.
Water 14 03950 g006
Figure 7. Relationship between SDLs and average SPEILS, SPEI_MAXLS, and SPEI_MINLS. (a) SPEILS vs. SDL. (b) SPEI_MAXLS vs. SDL. (c) SPEI _MINLS vs. SDL.
Water 14 03950 g007
Figure 8. The spatial distribution of the total occurrence of times of extremely wet/dry events during the period 2000–2018 in mainland China. (a) Total occurrence of times of extremely wet events (b) Total occurrence of times of extremely dry events.
Water 14 03950 g008
Figure 9. Comparison of the average occurrence of times of extremely wet/dry events for different SDLs between 2000–2018 in mainland China.
Water 14 03950 g009
Figure 10. Relationship between SDLs, and average PLS, ET0LS, and (Pre-ET0)LS. (a) PreLS vs. SDL. (b) ET0LS vs. SDL. (c) (Pre-ET0)LS vs. SDL.
Water 14 03950 g010
Table 1. SDLs of the selected sites classified by population, GDP, and both. RMB: Chinese currency.
SDLClassified by Population
(×104)
Classified by GDP
(×108 RMB)
Classified by Both Population (×104)
and GDP (×108 RMB)
1<50<100Population < 50 and GDP < 100
250–100100–40050 ≤ Population < 100 and 100 ≤ GDP < 400
3100–300400–1000100 ≤ Population < 300 and 400 ≤ GDP < 1000
4300–5001000–2000300 ≤ Population < 500 and 1000 ≤ GDP < 2000
5500–10002000–10,000500 ≤ Population < 1000 and 2000 ≤ GDP < 10,000
6≥1000≥10,000Population ≥ 1000 and GDP ≥ 10,000
Table 2. Wet/dry severity level classified by SPEI value.
SPEI RangeSeverity LevelSPEI RangeSeverity Level
SPEI ≥ 2Extremely wet−1.0 < SPEI ≤ −0.5Mild drought
1.5 ≤ SPEI < 2Severely wet−1.5 < SPEI ≤ −1.0Moderate drought
1.0 ≤ SPEI < 1.5Moderately wet−2.0 < SPEI ≤ −1.5Severe drought
0.5 ≤ SPEI < 1.0Mildly wetSPEI ≤ −2.0Extreme drought
−0.5 < SPEI < 0.5Normal
Publisher’s Note: MDPI stays neutral with regard to jurisdictional claims in published maps and institutional affiliations.

