Article

Mass Variations in Terrestrial Water Storage over the Nile River Basin and Mega Aquifer System as Deduced from GRACE-FO Level-2 Products and Precipitation Patterns from GPCP Data

1
Astronomical, Physical and Mathematical Geodesy (APMG) Group, Institute of Geodesy and Geoinformation, University of Bonn, 53117 Bonn, Germany
2
Abdullah Alrushaid Chair for Earth Science Remote Sensing Research, Geology and Geophysics Department, College of Science, King Saud University, Riyadh 11451, Saudi Arabia
3
Geodynamics Department, National Research Institute of Astronomy and Geophysics, Helwan 11421, Egypt
4
Department of Geosciences, Western Michigan University, 1903 West Michigan Avenue, Kalamazoo, MI 49008, USA
5
Civil Engineering Department, Faculty of Engineering, Delta University for Science and Technology, Gamasa 11152, Egypt
6
Construction Engineering and Utilities Department, Faculty of Engineering, Zagazig University, Zagazig 44519, Egypt
*
Author to whom correspondence should be addressed.
Water 2022, 14(23), 3920; https://doi.org/10.3390/w14233920
Submission received: 11 October 2022 / Revised: 17 November 2022 / Accepted: 24 November 2022 / Published: 1 December 2022

Abstract

:
Changes in the terrestrial total water storage (TWS) have been estimated at both global and river basin scales from the Gravity Recovery and Climate Experiment (GRACE) mission and are still being detected from its GRACE Follow-On (GRACE-FO) mission. In this contribution, the sixth release of GRACE-FO (RL06) level-2 products applying DDK5 (decorrelation filter) were used to detect water mass variations for the Nile River Basin (NRB) in Africa and the Mega Aquifer System (MAS) in Asia. The following approach was implemented to detect the mass variation over the NRB and MAS: (1) TWS mass (June 2018–June 2021) was estimated by converting the spherical harmonic coefficients from the decorrelation filter DDK 5 of the GRACE-FO Level-2 RL06 products into equivalent water heights, where the TWS had been re-produced after removing the mean temporal signal (2) Precipitation data from Global Precipitation Climatology Project was used to investigate the pattern of change over the study area. Our findings include: (1) during the GRACE-FO period, the mass variations extracted from the RL06-DDK5 solutions from the three official centers—CSR, JPL, and GFZ—were found to be consistent with each other, (2) The NRB showed substantial temporal TWS variations, given a basin average of about 6 cm in 2019 and about 12 cm in 2020 between September and November and a lower basin average of about −9 cm in 2019 and −6 cm in 2020 in the wet seasons between March and May, while mass variations for the MAS had a relatively weaker temporal TWS magnitude, (3) the observed seasonal signal over the NRB was attributed to the high intensity of the precipitation events over the NRB (AAP: 1000–1800 mm yr−1), whereas the lack of the seasonal TWS signal over the MAS was due to the low intensity of the precipitation events over the MAS (AAP:180–500 mm yr−1).

1. Introduction

The large basins around the world witness big changes in their hydrological signals in response to climate change [1,2,3,4,5,6,7,8]. These changes in the hydrological cycle can be reflected in one or more water compartments (surface water storage, ground water storage, snow water storage, or soil moisture storage). Among all water variables, surface and groundwater have been able to accommodate the highest portion of precipitation that reflect in the TWS signal as impressive mass gains [9,10].
Understanding the seasonal pattern of the hydrological cycle and the related changes in the terrestrial water storage (TWS) is considered one of the essential studies that helps in building up precise hydrological models. The TWS is a sum of five main dynamic components responsible for the terrestrial water cycle, which are groundwater, soil moisture, surface waters, snow, and ice. Remote sensing techniques have become commonly used to address hydrological and environmental problems on a global scale [11,12,13,14,15,16]. The Gravity Recovery and Climate Experiment (GRACE) mission [17] was launched on the 17 March 2002 and continued until the 27 of October 2017. GRACE became an essential source of data for continuously monitoring the variation in water fluxes over large basins, e.g., in Africa (e.g., Nubian and Nile basin, [9,10,18,19,20], in Saudi Arabia (e.g., Mega Aquifer [21,22,23]), and in Asia (Tigris Euphrates [24]), in USA (Michigan [25]). The GRACE Follow-On (GRACE-FO) mission was a successive mission launched on the 22nd of May 2018, and it continues to provide accurate estimates of the mean and time-variable components of the gravity field and its corresponding variations in water fluxes, as well the TWS over large basins at a spatial resolution of about 200 km (corresponding to the spherical harmonics expansion of degree 96) over monthly time spans. Study and management of the latter signal (i.e., TWS) is critical for populations in these countries that share a water portion. One of the most important factors causing the inter-annual and annual intensity of the GRACE TWS signal is climate variability.
In this article, two large basins—the Nile River basin (NRB) in Africa and the Mega Aquifer system (MAS) in the Arabian region in Asia—have been selected to investigate the monthly and seasonal variabilities in the TWS in terms of the equivalent water heights (EWH) unit in order to quantify water shortages or water surpluses. Three years (from June 2018 to June 2021) from the sixth’s release of GRACE-FO (RL06) level-2 products (see Section 2) were used for this study. The precipitation pattern was also investigated over both basins for the same period using the GPCP data (Global Precipitation Climatology Project) to show the behavior of precipitation as a response to the mass changes in water storage.
The Nile River (NR), it is considered the longest river on the Earth, with a length of about 6695 km composing a river basin and an area of about 3,761,542 km2. Its catchment area covers around a tenth of the area of Africa and is home to almost a quarter of the African population, for whom the river is the most important freshwater reservoir in the region. The NR passes through ten African countries known as the Nile Basin countries: Egypt, Sudan, South Sudan, Ethiopia, Uganda, Kenya, Tanzania, the DR Congo, Rwanda, and Burundi. The NR basin (see Figure 1) for some of these countries, such as the DR Congo, forms only a very small part of their territory, while for other countries, such as Egypt, Sudan, South Sudan, Burundi, Rwanda and Uganda, they are almost completely integrated into the Nile basin as the main water source.
The NR is originated from two main sources; namely the White Nile and the Blue Nile. The White Nile originates in the Great Lakes region in Central Africa, the farthest source is found in southern Rwanda and flows from northern Tanzania to Lake Victoria, to Uganda and then to southern Sudan. The Blue Nile begins in Lake Tana located in the Ethiopian heights and then flows to Sudan from the southeast. Both rivers meet at the Sudanese capital of Khartoum composing the main Nile River, which flows along Egypt until it is divided into two main branches (Rashid and Damietta) that form the Nile Delta and drain into the Mediterranean Sea. The flow originates from the highlands in the south of the NR during the winter season (March–May and August–December) where the areas receive most of the precipitation. The precipitation over the mountains in Ethiopia feeds the river systems and recharges the aquifers, especially those in the downstream countries (Sudan and Egypt) (Figure 1).
One should mention here that it is pretty essential to investigate the temporal mass changes in the TWS signal and precipitation pattern of the NRB because there are variations in the water level heights of Lake Victoria, which is one of the primary water sources of the NR. These variations are attributed more or less to the heavy rainfall over the lake and its tributaries and the evaporation process. Accordingly, they affect the water storage content of the NRB water level temporally. Another important consideration is the investigation of the impact of the recent human activities (i.e., construction of the Renaissance Dam on the Blue Nile in the northern western region of Ethiopian side) on the variability in seasonal the TWS signal and precipitation patterns of the NRB.
Regarding to the Mega Aquifer System (MAS) in Asia, it extends for some 236.3 × 10⁴ km2 in the northern and central part of the Arabian Peninsula underlying the extreme deserts of the Arabian Peninsula and crosses borders between Saudi Arabia, Iraq, Jordan, Oman, Yemen, and the United Arab Emirates (see Figure 1). The aquifer is subdivided into two major aquifer systems—the Upper and Lower Mega Aquifer Systems. The Upper Mega Aquifer System includes Aruma, Umm Er Radhuma, Rus, Dammam Biyadh, and Wasia formations. The Lower Mega Aquifer System includes the Tawil, Minjur, Dhruma Saq, Wajid, and Tabuk formations. The groundwater storage is recharged mainly from precipitation over the highlands in the southwest Red Sea Hills and flows toward the center of the Arabian Peninsula and the Arabian Gulf (Figure 1).
Our goal was to study the MAS as one of the largest aquifer systems of the arid world. Thus, the mapping of mass changes in the TWS and precipitation pattern would provide a clear picture of the groundwater level increment or depletion across some regions of Saudi Arabia, whose population is growing.
In the following, the GRACE-FO and precipitation data used in this study are presented in Section 2. Section 3 describes the methodology to estimate the TWS from the GRACE-FO level-2 products and the monthly precipitation from the GPCP data. In Section 4, the results in the spectral and spatial domains are discussed. Finally, a relevant conclusion is outlined in Section 5.

2. GRACE-FO Level-2 Products and Precipitation Data
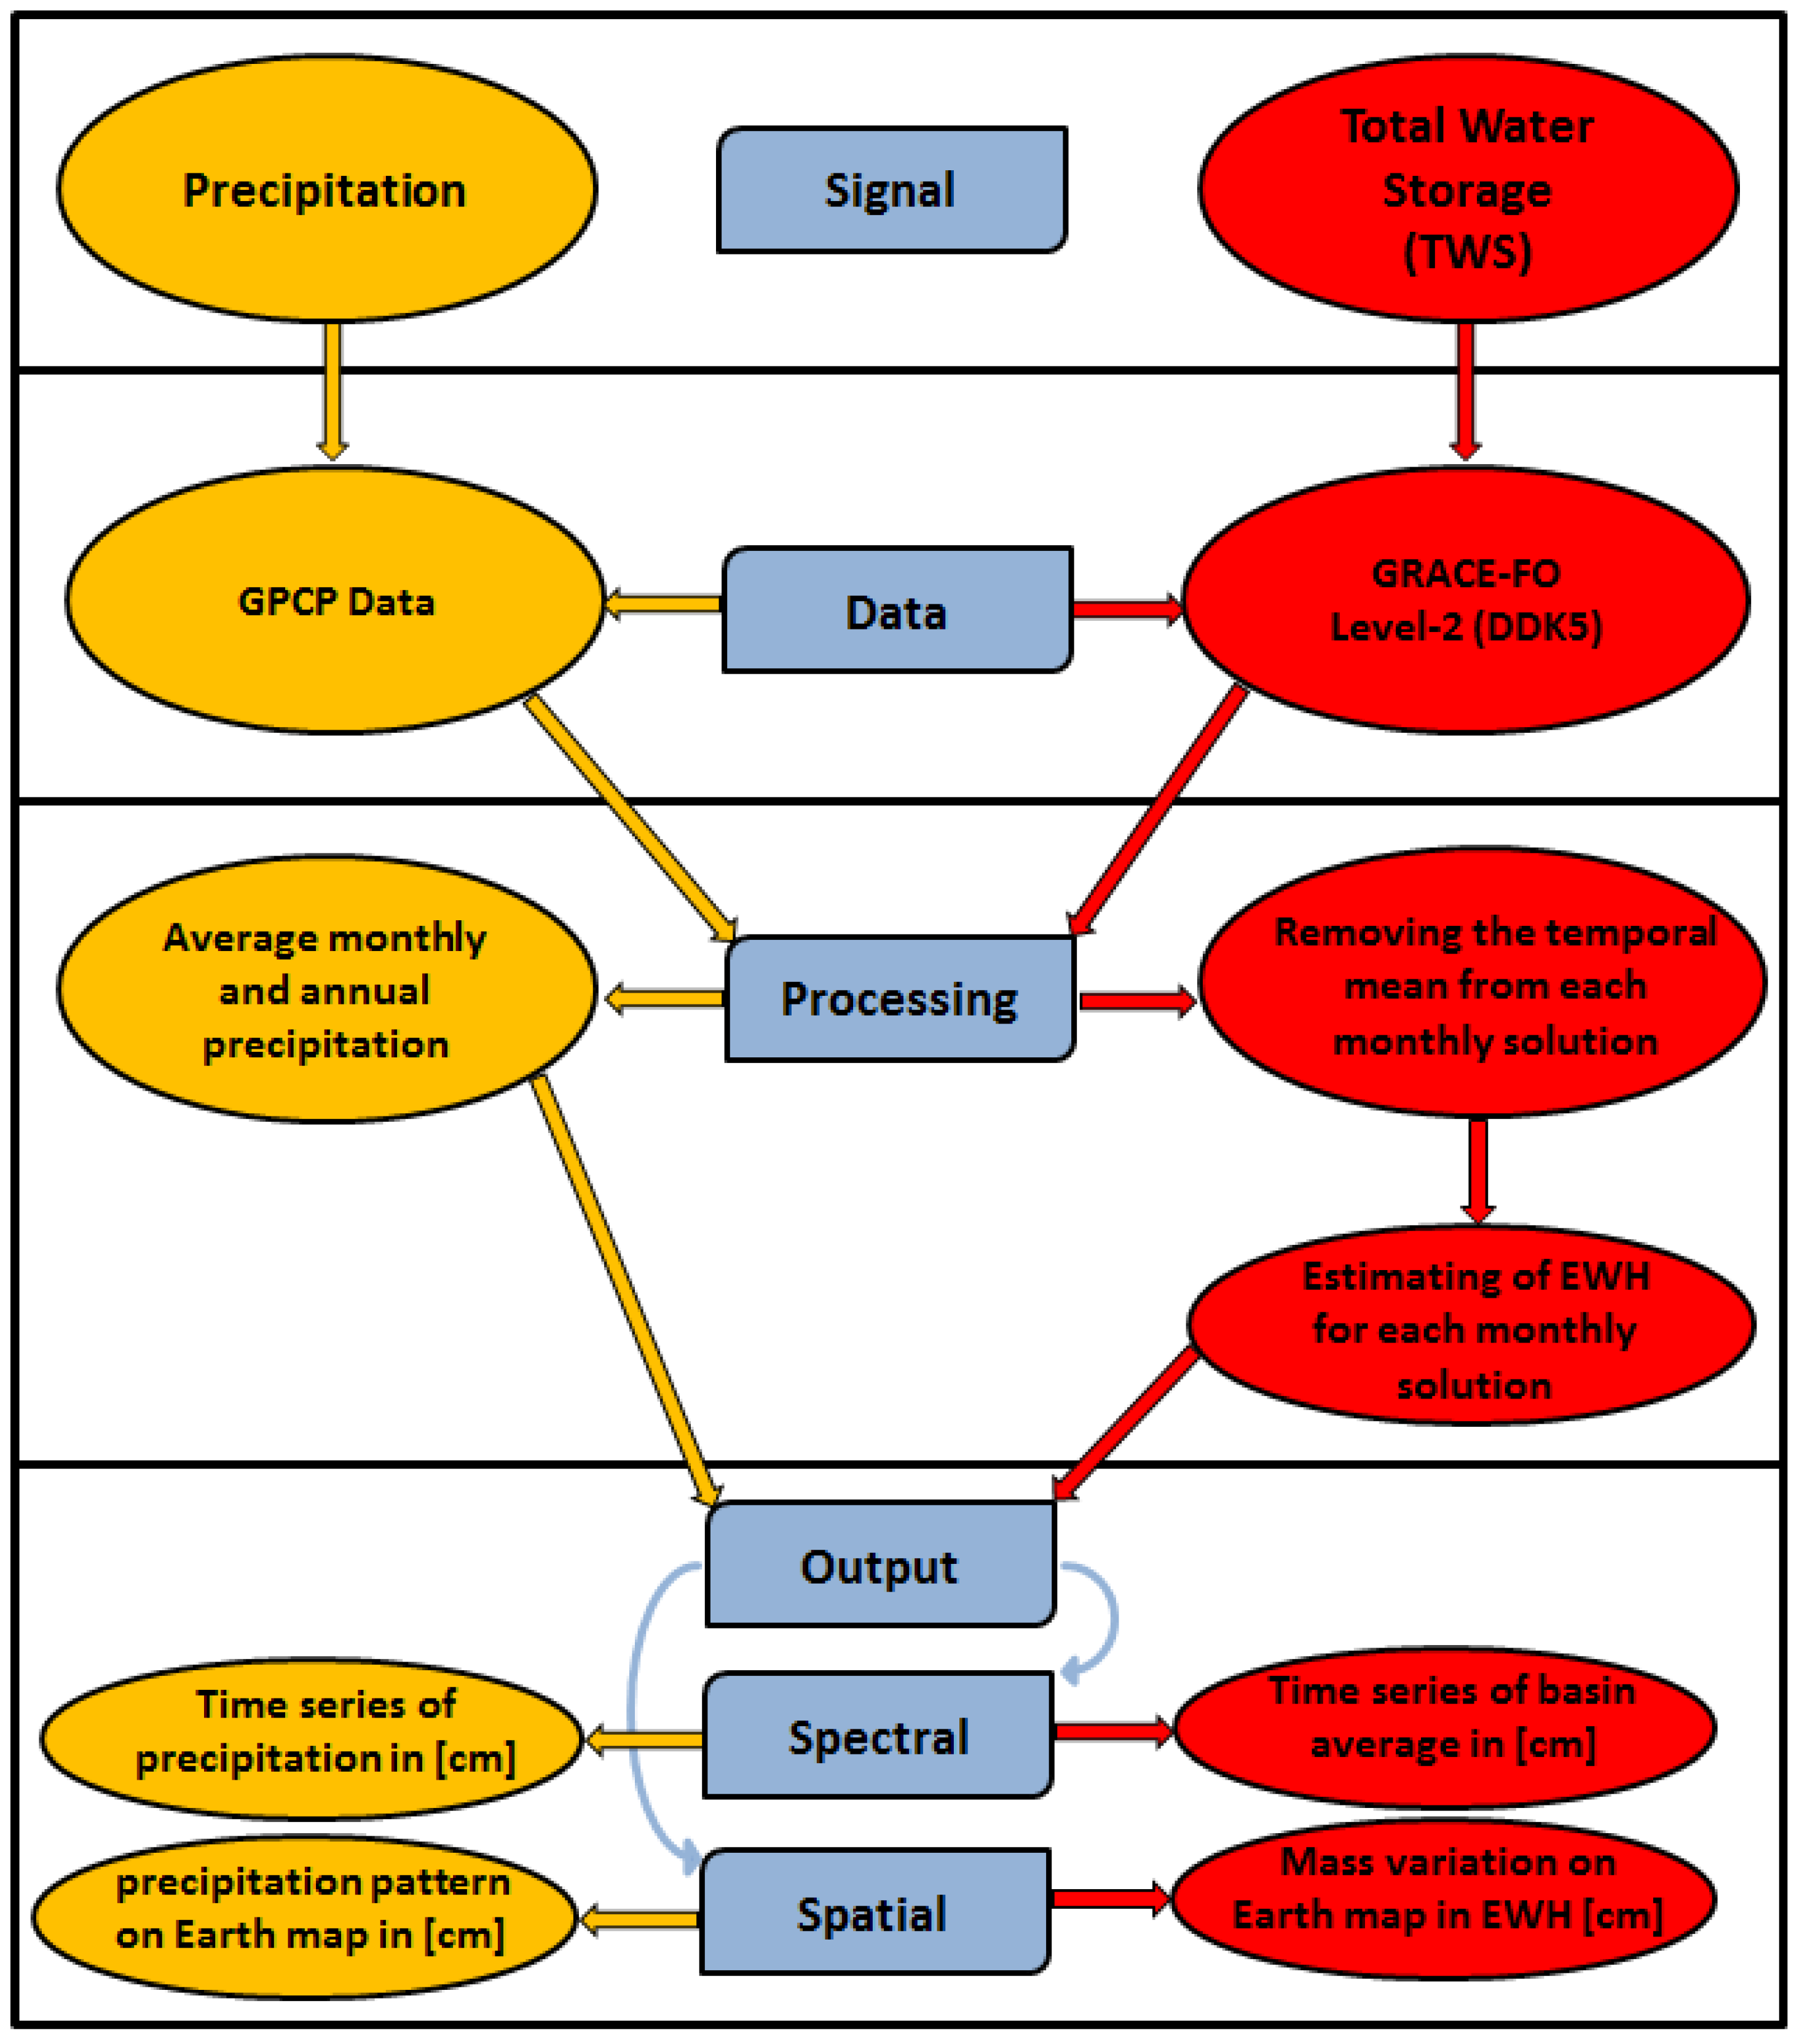
Officially, three main centers are responsible for producing the developed releases of the GRACE-FO products (monthly gravity solutions); namely the GFZ (the German Research Center for Geosciences), the JPL (NASA’s Jet Propulsion Laboratory), and the CSR (Center for Space Research) centers. These three centers were identified in the mission proposal as the GRACE Science Data System (SDS) and were considered the official continuously released monthly GRACE-FO geopotential gravity models. The GRACE-FO SDS is responsible for converting the raw data (Level 0) received from the GRACE-FO spacecraft scientific instruments into observations (Level 1), e.g., orbital data (positions, velocities, and accelerations), satellite-to-satellite tracking observables (range, range-rate, and range acceleration), star camera data for attitude determination, and accelerometer data representing the sum of the non-gravitational accelerations. All these data are used in the gravity analysis procedure to derive the monthly gravity field spherical harmonic coefficients (SHC) known as Level-2 data. The gravity field products of the GRACE-FO RL06 are provided over approximately a month (30-day interval) (i.e., monthly solutions) in two forms of SHC degree and order (d/o) 60/60 and 96/96, which correspond to the spatial resolutions of 333 km and 208 km, respectively. In this article, the RL06 products from the GFZ [26], JPL [27] and CSR [28] centers at d/o 96/96 were selected because they provide better spatial gravity field resolution. The GRACE_FO RL06 is available in this study for the period between June 2018 and July 2021, except for the months of July–August 2018.
It should be mentioned here that determining high frequency temporal signals, such as the TWS signal from GRACE-FO observations, suffers from the same problems that the GRACE satellite mission faced before, mainly, the temporal aliasing problem. The temporal aliasing errors [17,29,30] are defined as errors that result from the temporal under-sampling of geophysical signals which have periods less than twice the (orbital) sampling period of the GRACE-FO mission (i.e., one month) according to the Nyquist sampling theorem. In other words, the GRACE-FO mission provides 30-day solutions, and within them are alias parts (e.g., hourly, daily, weekly, sub-monthly) of un-required high-frequency mass variations of the TWS signal detected by the GRACE-FO satellite mission. Therefore, applying an appropriate smoothing approach (i.e., filtering) would solve this temporal aliasing issue; however, this may lead to the loss of some of the mass variation signals. Different smoothing techniques have been applied for the GRACE/GRACE-FO products, e.g., the Gaussian filter [31,32], in addition to the decorrelation methods [33,34] or using an a priori synthetic model of the observation geometry [35,36,37]. The latter filters utilize error-covariance information. Due to the superiority of the decorrelation filters, the GRACE-FO RL06 type DDK5 products were applied in this study.
We should note here that there are eight decorrelation filters (DDK1–DDK8) of different kernel radii as developed by [37], which are applied to eliminate the striping errors associating the GRACE/GRACE-FO temporal gravity solutions. The differences between DDK1 to DDK8 are dependent on the selection of the weighting factor (a), which is multiplied in the signal and error covariance matrices to down-weight their values (see Equation (3) of [37]). For instance, weighting factors a = 1 × 10¹⁴, 1 × 10¹³, 1 × 10¹², 5 × 10¹¹, 1 × 10¹¹, 5 × 10¹⁰, 1 × 10¹⁰, 5 × 10⁹ represent the decorrelation filters DDK1, DDK2, …, DDK7, DDK8, respectively. The DDK5 (a = 1 × 10¹¹) of the GRACE-FO RL06 products were applied in this paper since they provide a medium kernel radius which de-stripes GRACE-FO solutions over the northern part of the NRB without highly smoothing the TWS signal with respect to DDK1–DDK4, and without showing the noisy signal over the NRB that the DDK6–DDK8 show (regarding the solutions of the decorrelation filters DDK1–DDK8 of [38], cf. Figure 7a,b).
Regarding to the precipitation data, the average annual precipitation (AAP) for the period between June 2018 and July 2021 over the Nile Basina and Mega aquifer was derived from the GPCP of monthly combined observations and satellite precipitation data. The entire data monthly product with a spatial resolution of 2.5° is available through the National Oceanic and Atmospheric Administration (NOAA) [39].

3. Methodology

In order to estimate the TWS change over the NRB and the MAS, monthly variations in terms of equivalent water heights were computed from the Level-2 data given in the SHC time series of the decorrelation filter DDK5 of the GRACE-FO RL06 (Source: http://icgem.gfz-potsdam.de/series, accessed on 1 September 2021) using the following formulae:
  TWS ( φ , λ ) = R E ρ 3   n = 0 N max 2 n + 1 1 + k n m = 0 n P ¯ nm sin φ C nm cos m λ + S nm sin m λ
where the terms (φ,λ) are geodetic latitude and longitude of a point, respectively, RE is the mean radius of the Earth (applied in our study as 6,387,136.3 m), ρ is the average density of the Earth (5517 kg/m3), kn are the load Love numbers, Pnm(sin φ) is the fully normalized associated Legendre function, and n and m are the degree and order of spherical harmonics, respectively. The value Nmax is the maximum applied degree.
In order to compute the TWS variations without the effect of the mean temporal signal, the spherical harmonics represented in (1) were re-produced after removing the mean temporal signal, as was done in [31]:
  TWS ( φ , λ ) = R E ρ 3   n = 0 N max 2 n + 1 1 + k n m = 0 n P ¯ nm sin φ Δ C nm cos m λ + Δ S nm sin m λ
with
Δ C nm = C nm m e a n ( C nm )
Δ S nm = S nm m e a n ( S nm )
In the following, the TWS results are given in terms of EWH, which is computed for 36 months (from June 2018 till June 2021).
Regarding the precipitation, the GPCP product is an integrated analysis that estimates precipitation from low-orbit satellite microwave data, surface rain gauge observations, and geosynchronous-orbit satellite infrared data. This integrated approach utilizes the better accuracy of the low-orbit microwave measurements to calibrate the more frequent geosynchronous infrared measurements. The period before the microwave technique depended on infrared-only observations calibrated to the microwave-based analysis of the coming years. The integrated satellite-based product is calibrated by the rain gauge data combined with field data.
Accurate mapping of the spatial distribution of precipitation is important for many applications in hydrology, climatology, agronomy, ecology, and other environmental sciences. In this study, we generated the average monthly and annual precipitation over the NRB and MAS using ArcGIS with data from the GPCP. The description of the processing procedure of the TWS and precipitation pattern is shown in Figure 2.

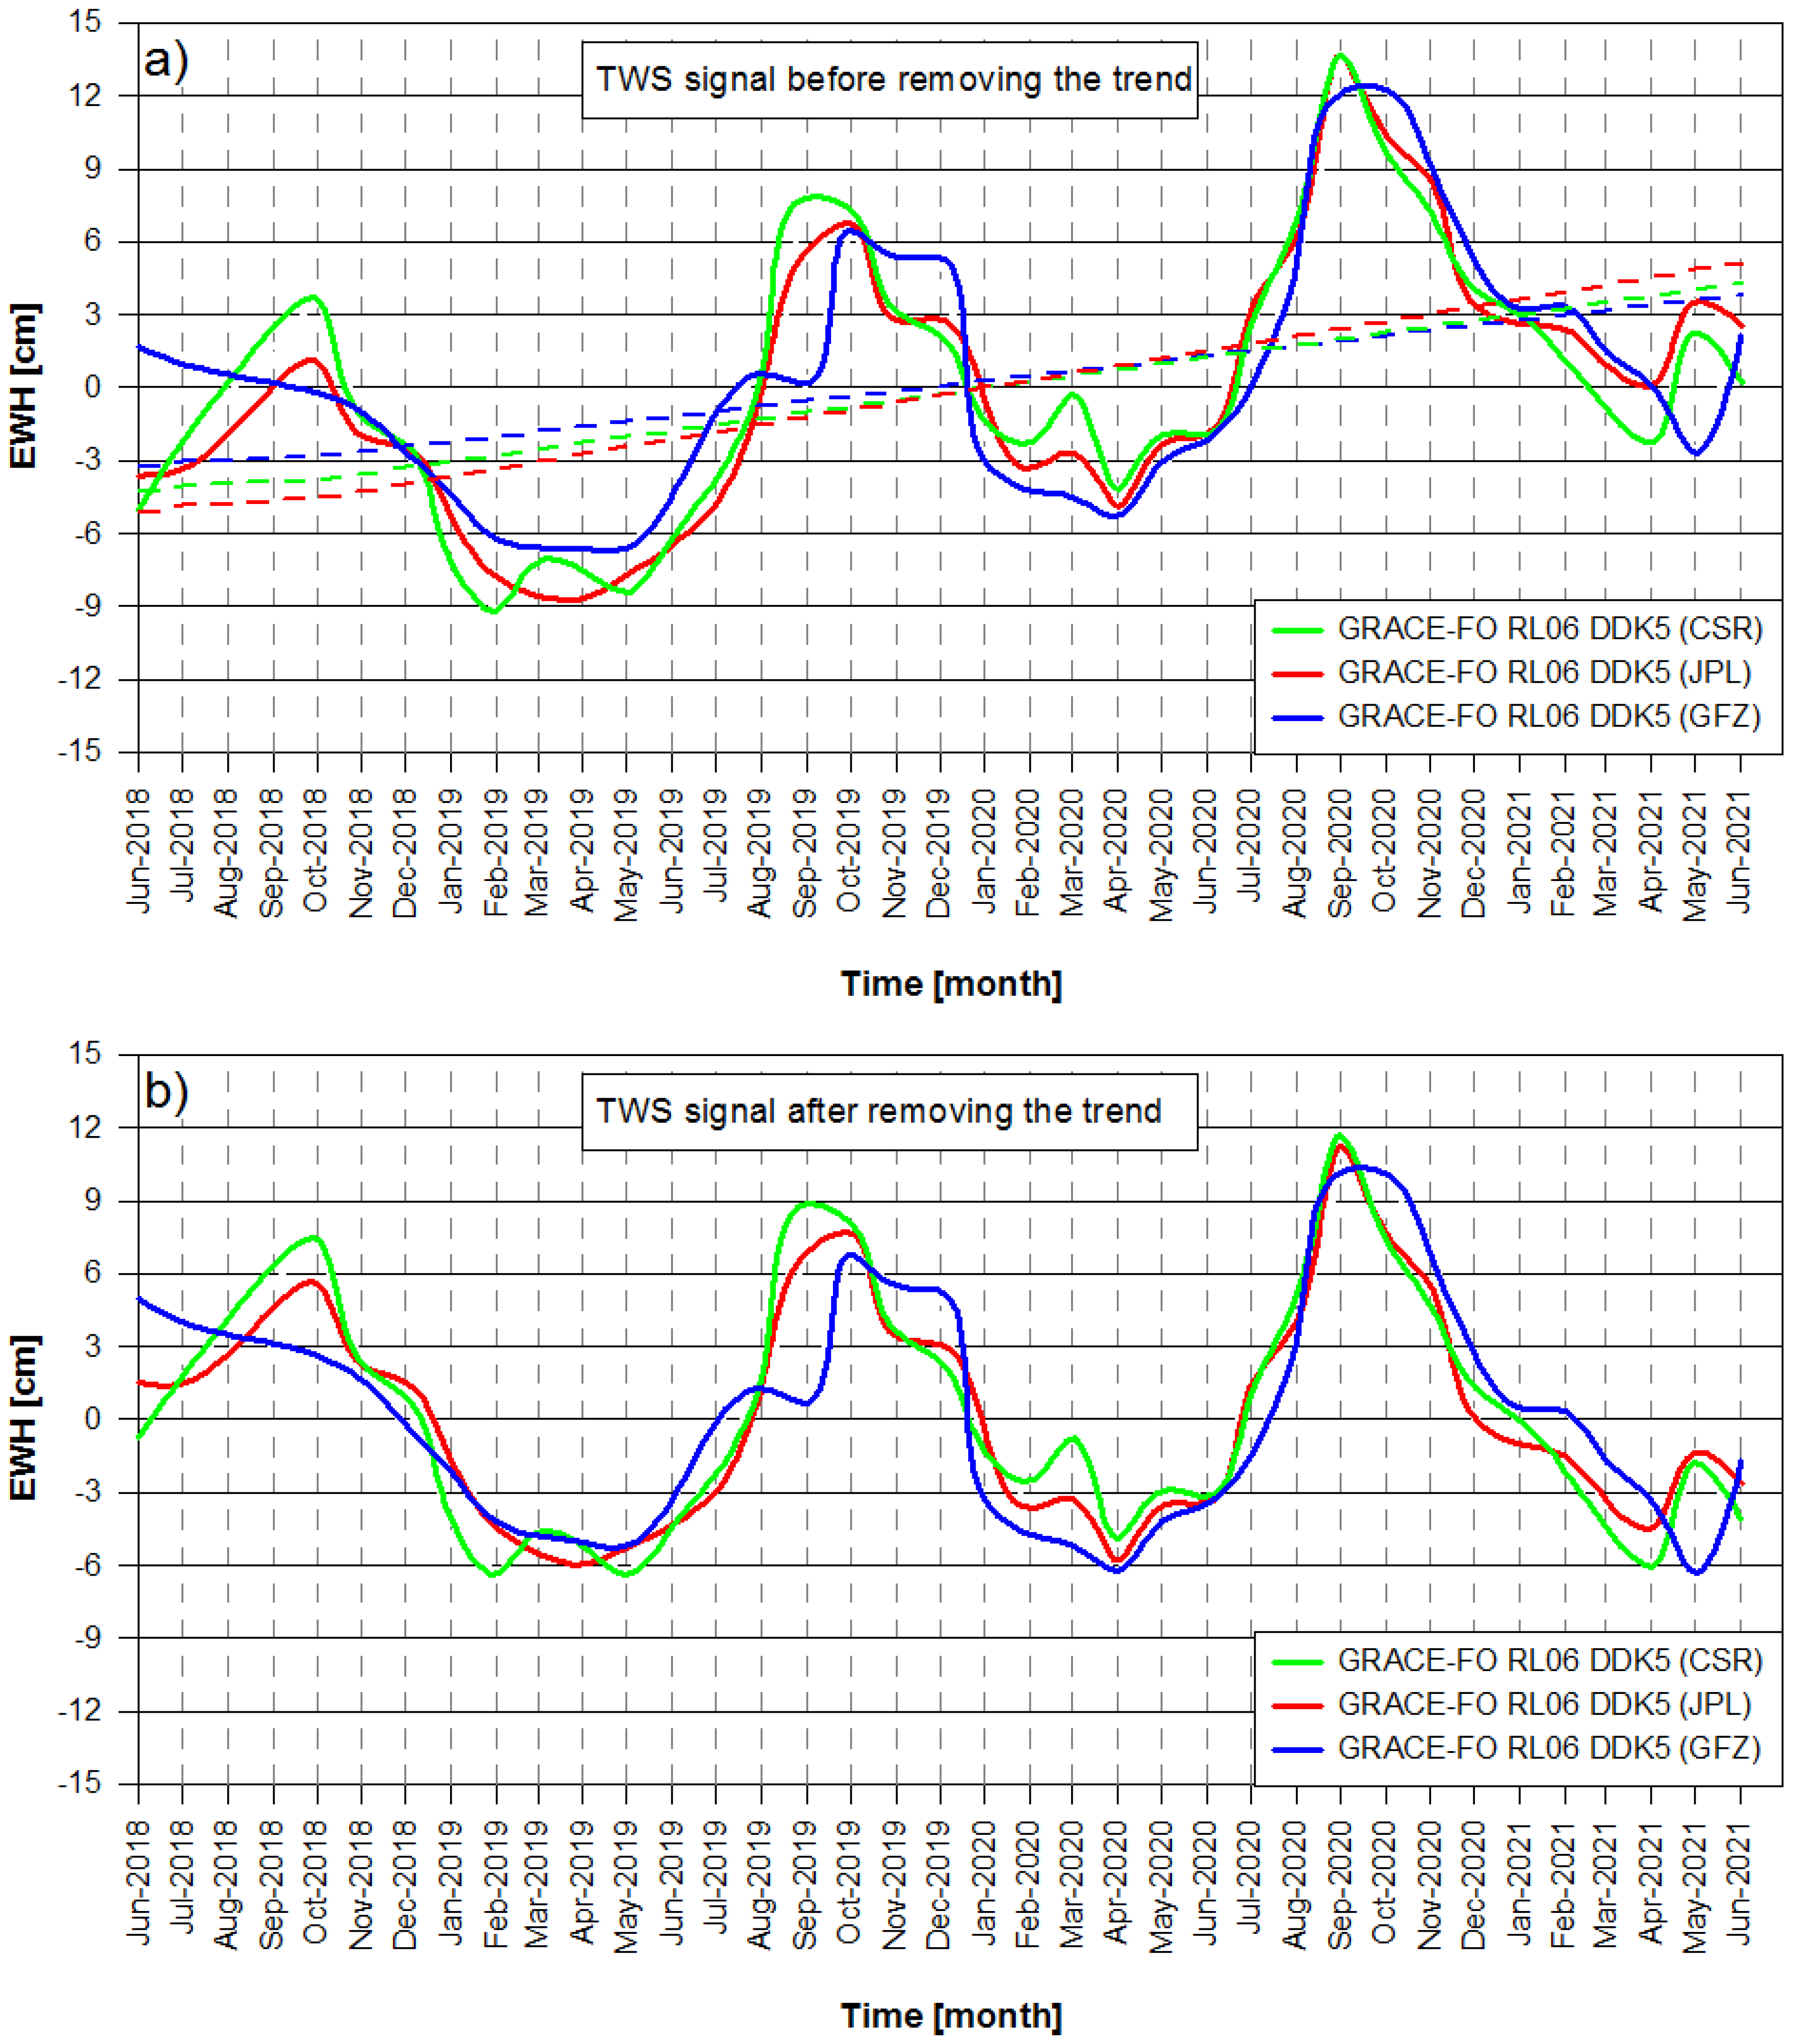
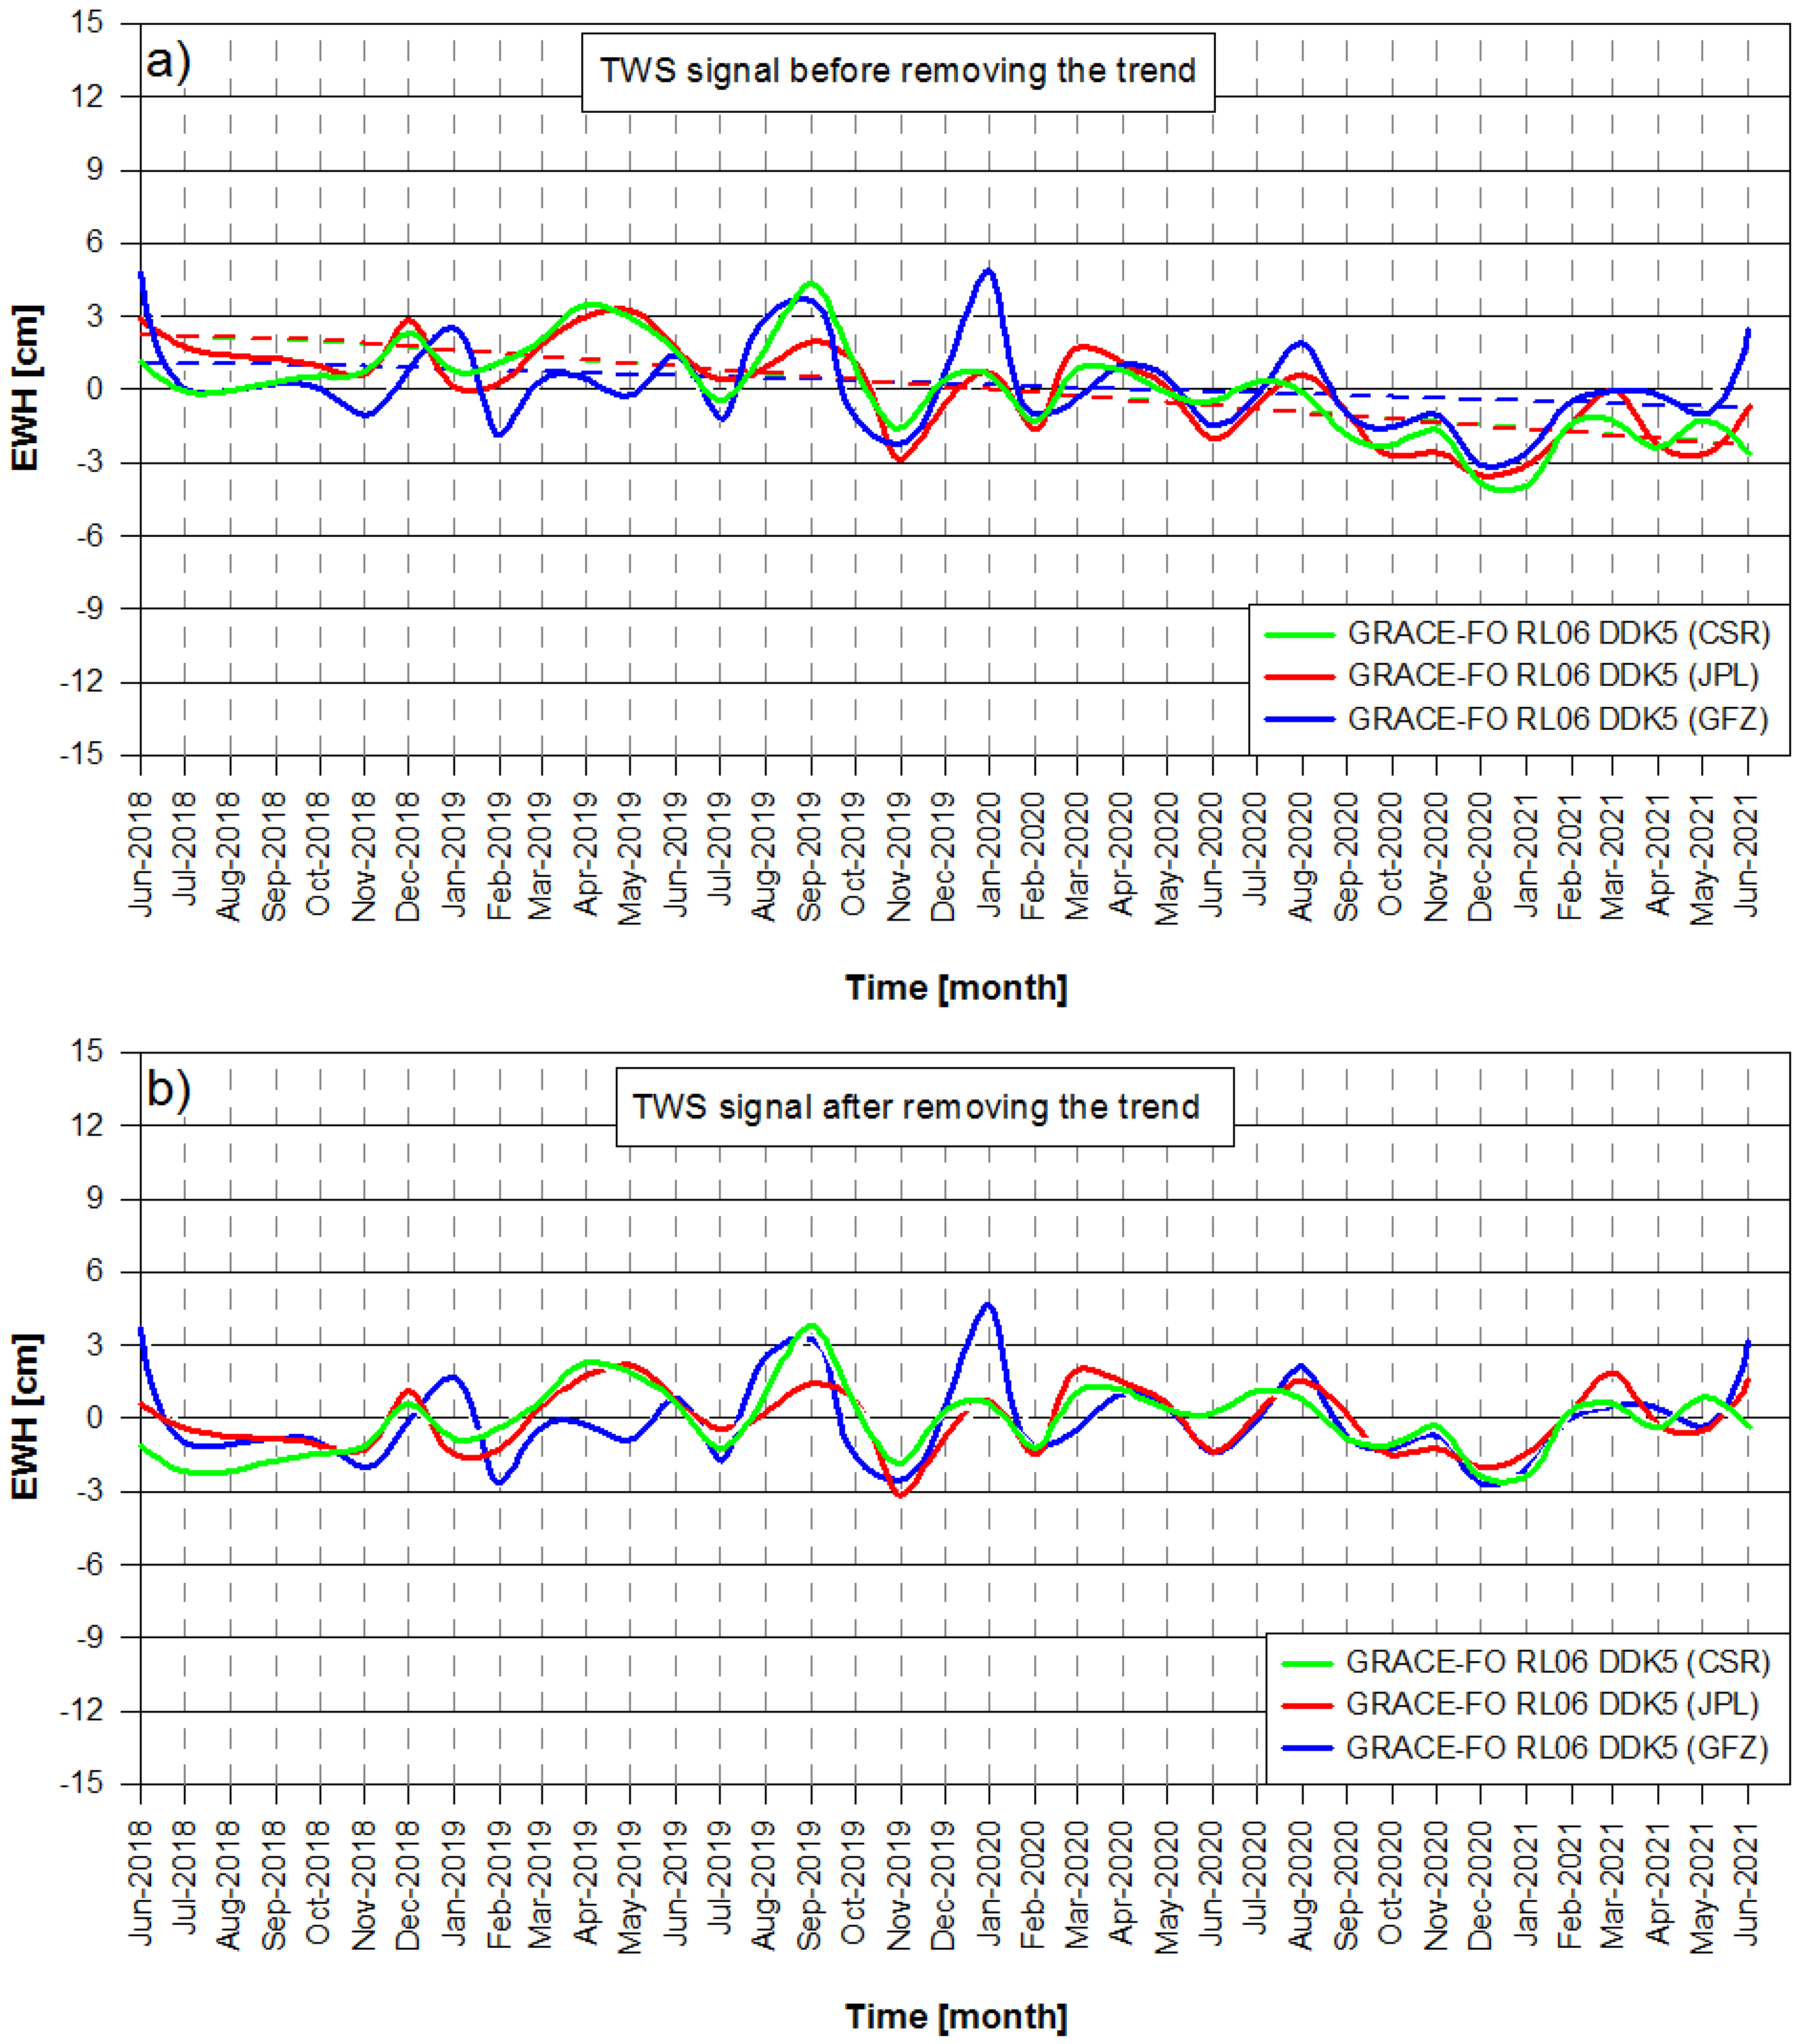
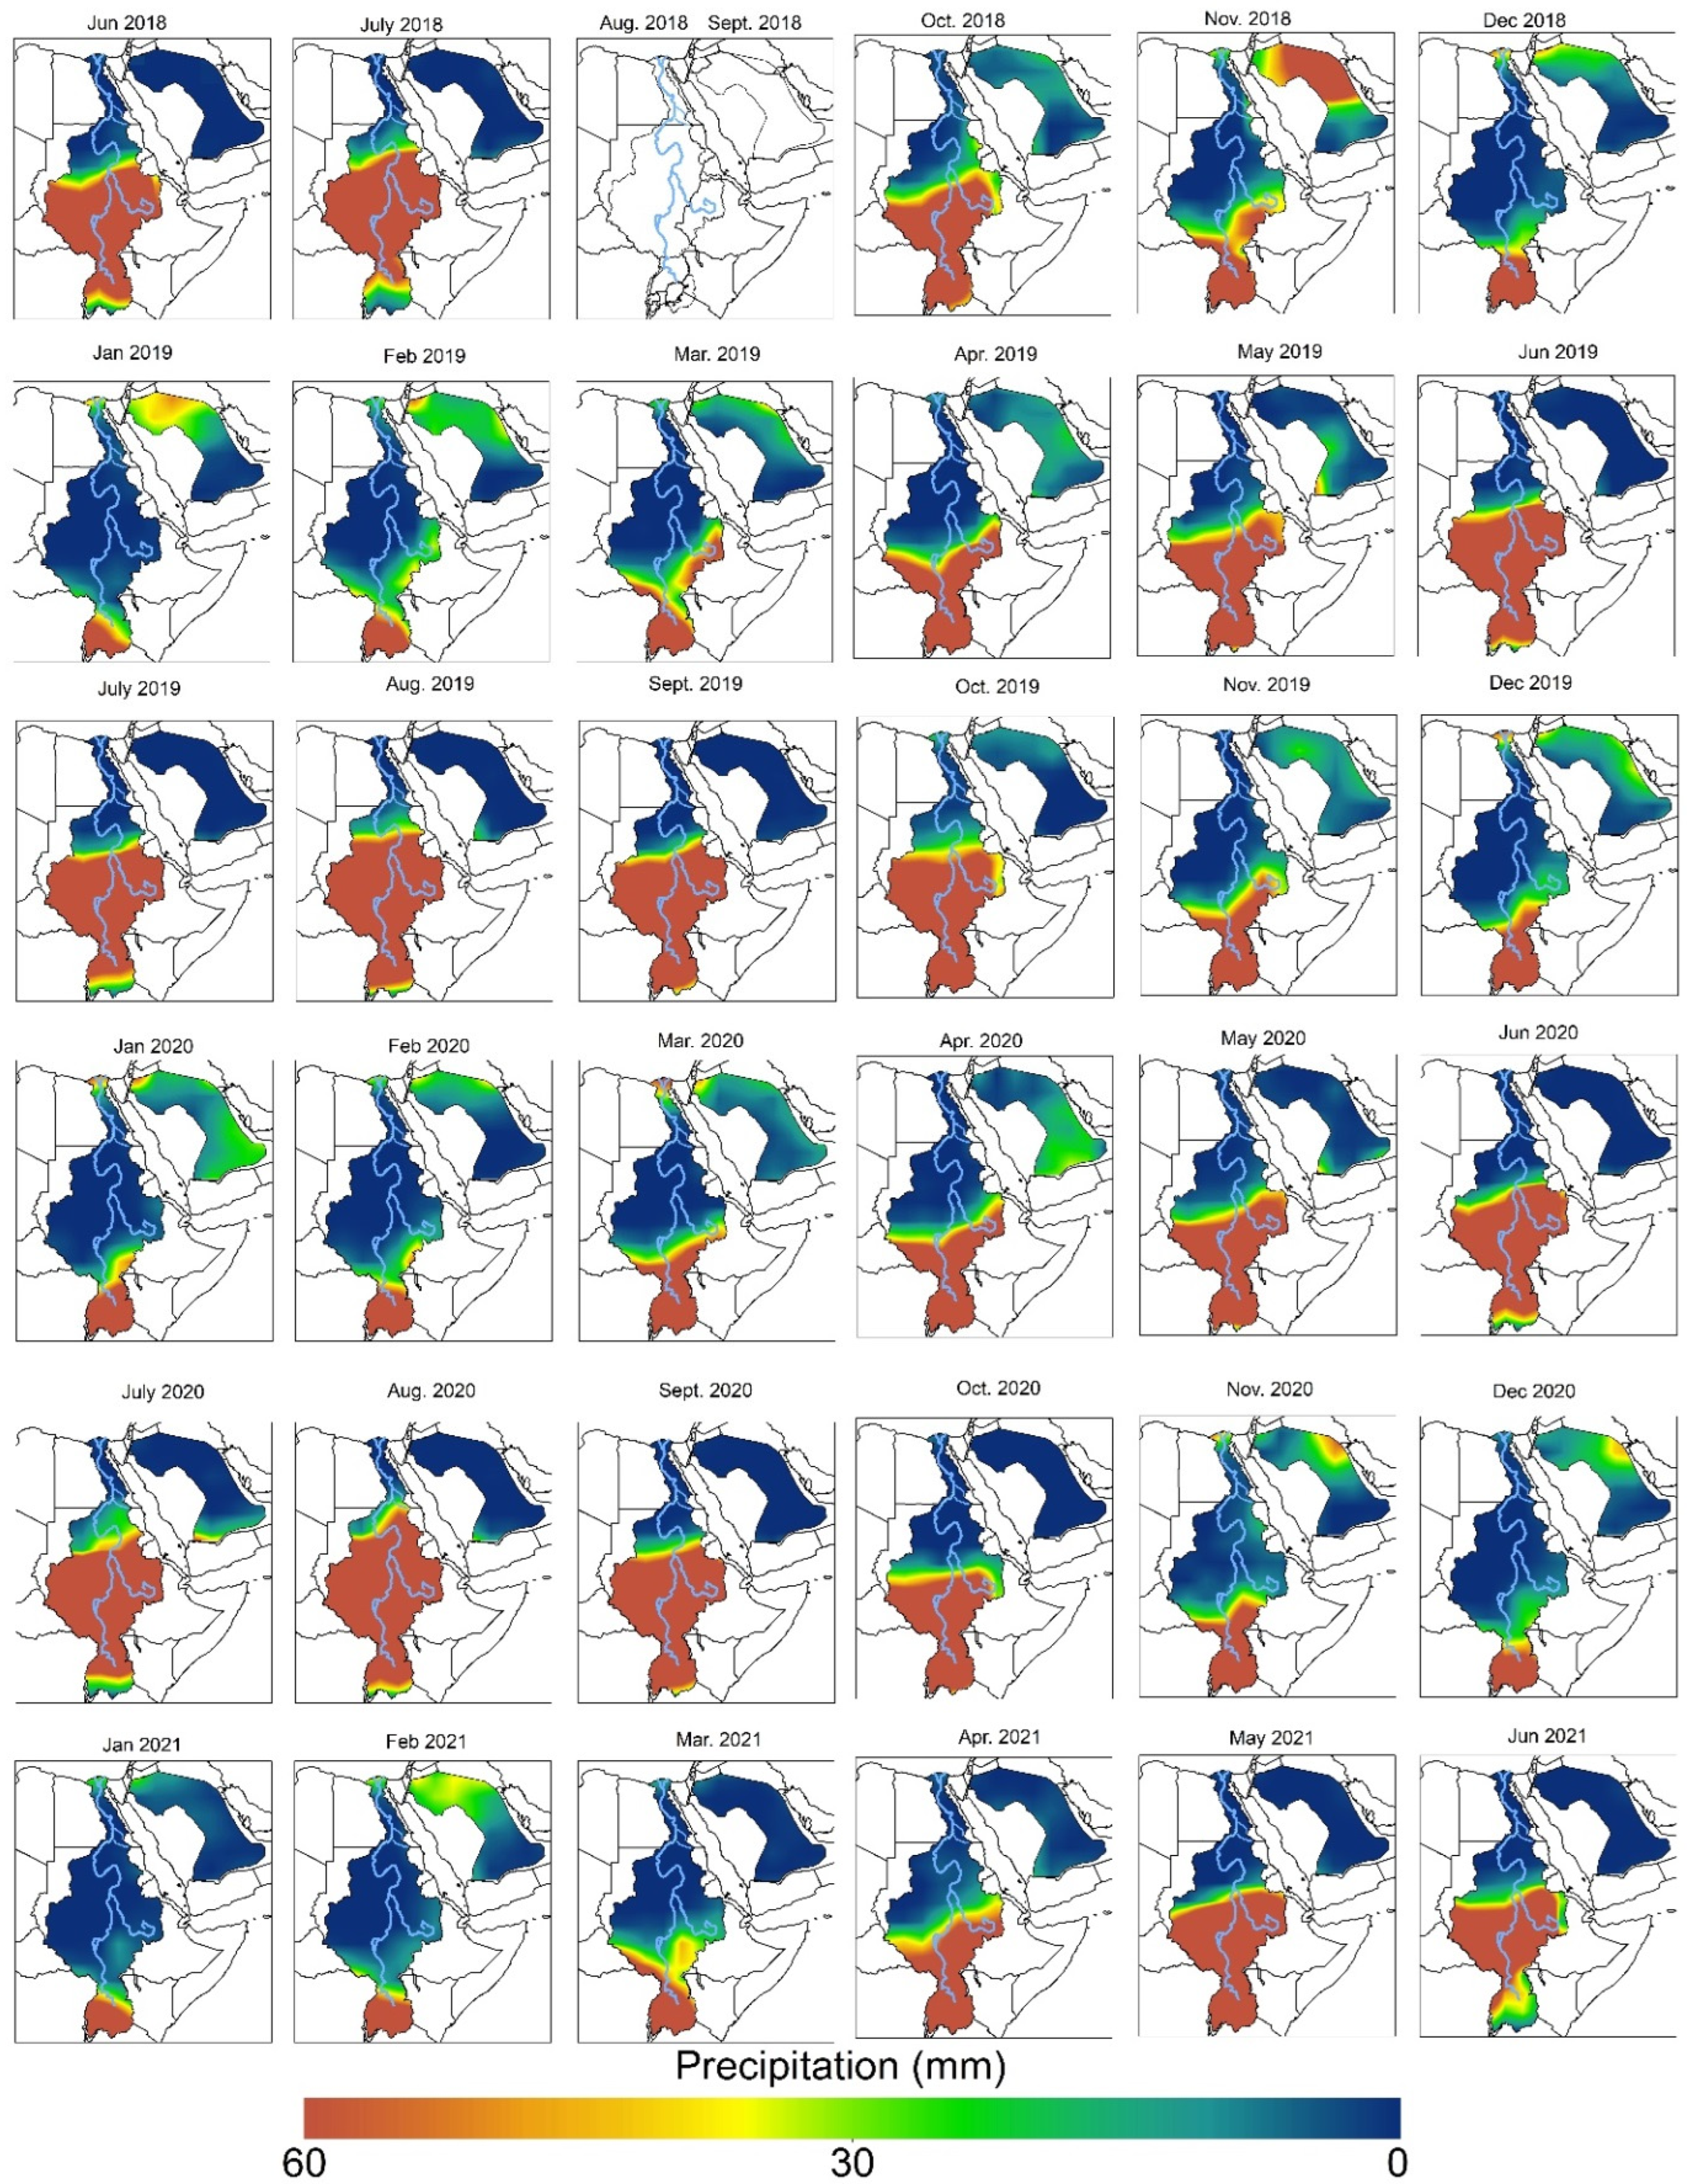
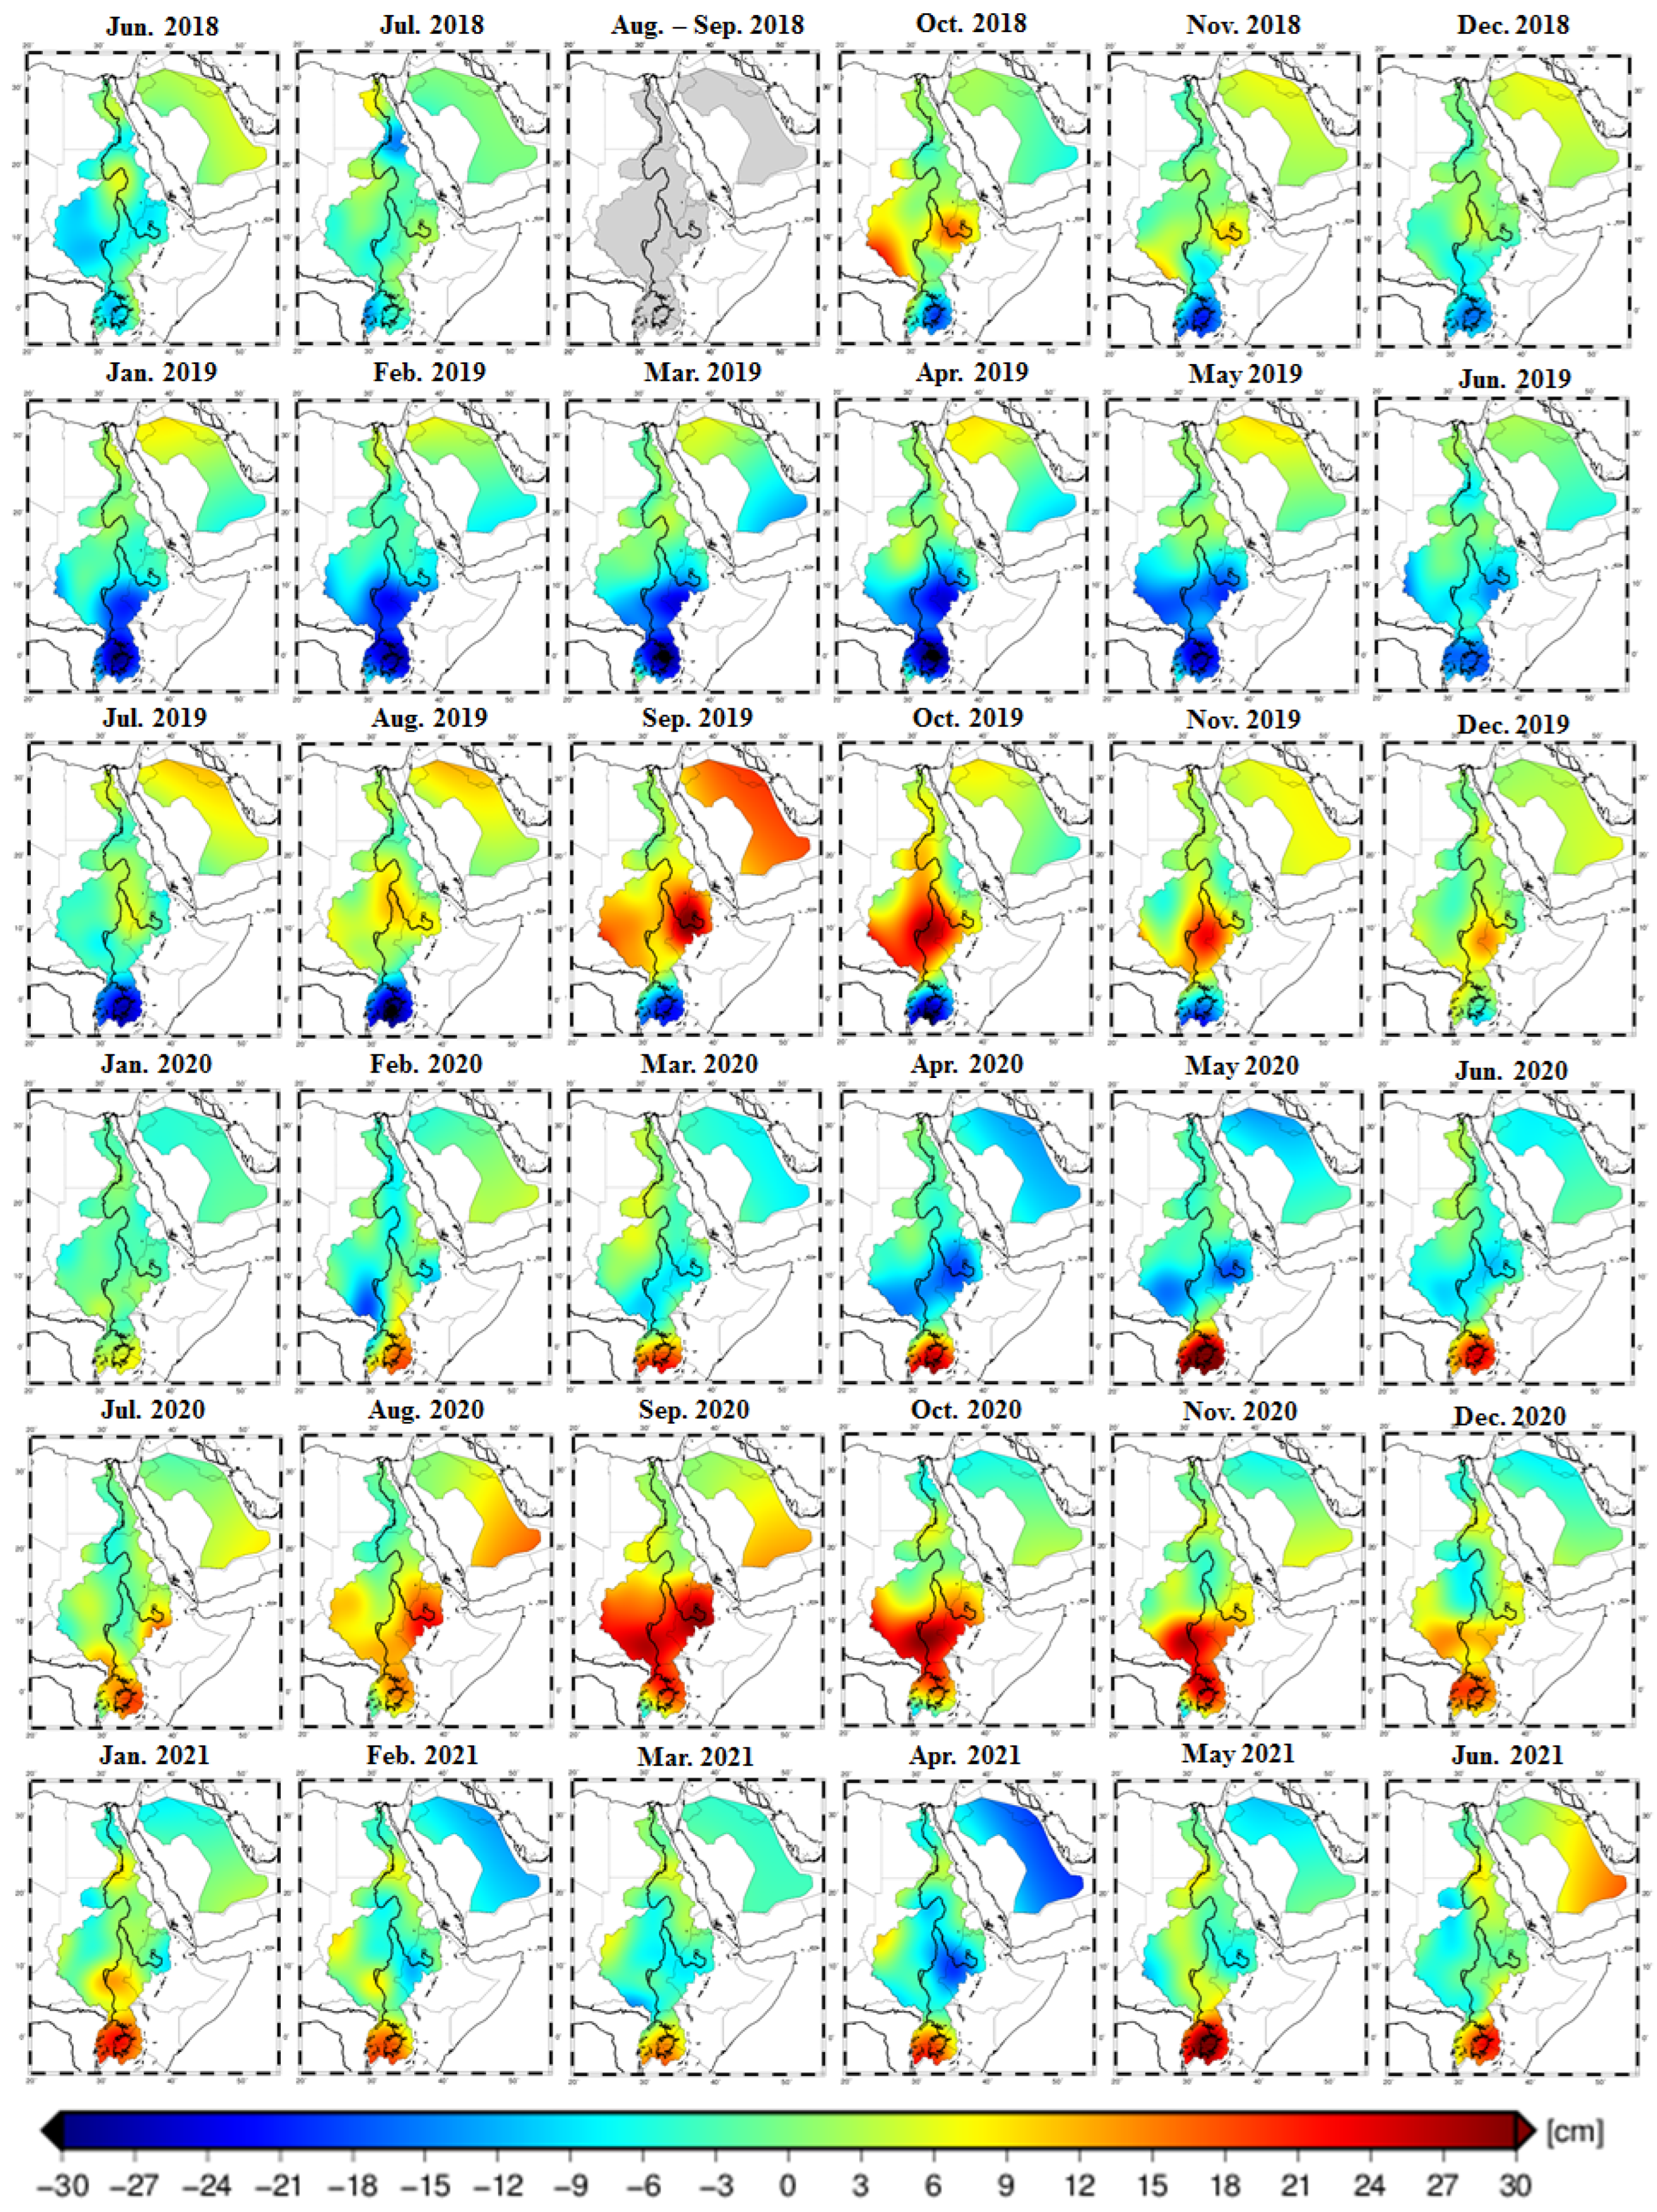
4. Results and Discussion

In this paper, the decorrelation filtered monthly gravity field solutions (DDK5) of the latest release (RL06) of the GRACE-FO mission during the time period from June 2018 to June 2021 were analyzed. The monthly gravity solutions were processed first by calculating the temporal mean signal representing the temporal variation values and subtracting it from the monthly gravity field solutions as given in Equations (3) and (4). The removal of the temporal mean signal is essential, according to [31], in order to eliminate the long term mean of monthly stokes coefficients. The resulting spherical harmonic differences were converted to terrestrial water storage estimates in terms of EWH. Figure 3 and Figure 4 represent the monthly mass changes in the TWS signal as basin averages (see Table 1) for the NRB and MAS, and show this information spatially in Figure 5. Figure 6 and Figure 7 illustrate the precipitation solutions in spectral and spatial domains, respectively, as extracted from GPCP satellite data over the NRB and MAS. The corresponding statistics in terms of basin average and precipitation are given in Table 1.
Figure 3 shows the EWH over the NRB as derived from the main GRACE-FO solutions (CSR, JPL and GFZ) with the DDK5 applied. There was general agreement between the three solutions over the NRB, with a large amplitude of the seasonal cycle (Average Amplitude: 12 cm). On the contrary, Figure 4 shows very low amplitude of the seasonal signal of EWH (Average Amplitude: 4 cm), where the well correlation between the three solutions continued to exist over the MAS. The precipitation over the NRB (Figure 6) was found to be the main driver of the high EWH amplitude. The peaks of the EWH time series were mainly dominated by the seasonal rainfall during the wet and dry seasons over the NRB as shown in Figure 3a. The higher peaks appeared between September and November and provided basin averages of about 30 mm, 60 mm, and 120 mm in 2018, 2019, and 2020, respectively. One should note here that these rates were affected by a positive trend of about 3 cm yr−1 during the investigated period. Figure 3b represents the monthly variabilities after removing the trend components for the whole studied period (from June 2018 to June 2021). This observed trend was due to the highly intensive rainfall (AAP: 1000–1800 mm yr−1) over the upstream countries in the southern and eastern parts of the NRB, which mainly occurs during the summer season (from June to August).
We have to mention here that our outcome agrees with the previous studies published recently over the NRB, such as [19,40,41] found that the TWS over 10 sub-basins of the NRB had a main gaining trend value almost equal to 2.2 cm/month as GRACE TWS trends. Their outcome regarding the TWS values of the Main Nile, Atbara, Blue Nile and sub-basins ranged seasonally between ±6cm, ±15, and ±20, respectively, and for all the NR Basin were about ±15 cm. Reference [41] used both GRACE (2002–2017) and GRACE-FO (only 2018–2020). Regarding the GRACE-FO, they recorded similar behavior that the wet cycles exhibited a significant TWS increase in the wetness levels during the year from June 2019 to June 2020. In addition, they showed an overall average negative trend between 2002 and 2013, which fluctuated lately to a positive trend from 2014 to 2020, which agrees with the outcome of our current work.
The effect of the precipitation pattern can be seen in Figure 5, where EWH increased in the autumn season from September to November of 2019 and 2020 (for any Values). Whereas the winter season (from December to February) represents the minimum of rainfall changes, and provided the lowest EWH basin average of about −60 mm after removing the trend (Figure 3b). The effect can be seen in Figure 5 as discharging of the TWS that took place in the spring season between March and May (see e.g., April 2019, 2020, and 2021). One can infer from Figure 5 that the areas experiencing significant TWS variations were in the southern and eastern parts of the NRB, where the Lake Victoria and Lake Tana exist. In the northern part of the NRB located in the Egyptian territory, one can observe that there was almost a decrease in the TWS signal. This may have been due to the Sahara area that is occupied by the extensive Saharan aquifers, which are attributed to an increase in groundwater extraction from the underlying fossil aquifers and possibly to rising temperatures in these areas, as stated by [42]. In addition, groundwater levels in the Western Desert oases (northwest of the NRB) declined by some 60 m, and the artesian wells and springs were replaced by deep wells.
For the Mega Aquifer System, slight TWS variations occurred, causing the EWH to range by ±3 cm yr−1 as shown in Figure 4a. This observed decrease in EWH was related to the climate conditions that cause a low amount of rainfall over the Arabian Peninsula in general and the MAS in particular. A relatively weak negative trend was observed over the MAS that went as low as −1.56 cm yr−1. This low trend was found to be smaller than that of the NRB. Figure 4b shows the monthly variabilities in the TWS after removing the trend where the seasonal component is the main component of the remnant signal.
For the monthly precipitation pattern, the most significant amount of precipitation in the NRB fell on the southern highlands and Ethiopian mountains during the wet seasons (March–May and September–November) with an AAP of 1200 and 1800 mm yr−1 (see Figure 6). The precipitation rates went lower as we moved northward from the NRB, from a moderate AAP of ~500 mm yr−1 over the Atbara sub-basin and southern Sudan to a low AAP of < 50 mm over Southern Egypt (Figure 7). The most considerable amount of precipitation per area in the Kingdom of Saudi Arabia fell on the southern parts of the Red Sea Hills, where precipitation averages 500 mm yr−1 and can reach up to 700 mm yr−1. In general, precipitation over the Arabian Peninsula is scarce except for that occurring over the mountainous areas as shown spatially in Figure 7.
To sum up, the findings in terms of equivalent water heights (EWH) showed higher seasonal peaks of about 6 cm in 2019 and about 12 cm in 2020 over the NRB between September and November, and a lower TWS basin average of about −9 cm in 2019 and −6 cm in 2020 (Figure 3). Regarding the MAS, a slight TWS basin average took place to provide the EWH with about ±3 cm per year due to the scarce amount of rainfall over the Arabian Peninsula (Figure 4). Regarding the precipitation results, the most considerable AAP was found during the wet seasons (March–May and September–November) with 1200 and 1800 mm yr−1 in the NRB (Figure 6) on the southern highlands and Ethiopian mountains, whereas the APP was getting lower to about ~500 mm yr−1 over the Atbara sub-basin and south Sudan, to the lowest AAP of < 50 mm over Southern Egypt (Figure 7). For the MAS, the largest amount of precipitation per area in the Kingdom of Saudi Arabia fell on the southern parts of the Red Sea Hills, where precipitation averages 500 mm yr−1 and can reach up to 700 mm yr−1.

5. Conclusions

In this article, the mass change in the Nile River Basin (NRB) and Mega Aquifer System (MAS) as measured by total water storage (TWS) and annual average precipitation (AAP) were investigated using three years (from June 2018 to June 2021) from the DDK5 solutions of the sixth release of the GRACE-FO (RL06) level-2 products.
Regarding the NRB, we can conclude that higher TWS seasonal peaks were shown at about 6 cm in 2019 and about 12 cm in 2020 over the NRB between September and November, and a lower TWS basin average was presented at about −9 cm in 2019 and −6 cm in 2020 in the wet seasons between March and May. This was supported by AAP results that provided the largest annual rates of about 1200 and 1800 mm yr−1 during the wet seasons (September–November) on the southern highlands and Ethiopian mountains. The APP reduced by about ~500 mm yr−1 over the Atbara sub-basin and south Sudan to its lowest AAP of <50 mm over Southern Egypt.
Regarding the MAS, a slight TWS basin average took place over the Arabian Peninsula providing the EWH with about ±3 cm per year, due to the low amount of rainfall. The AAP results provided the most immense amount of precipitation per area in the Kingdom of Saudi Arabia, which fell on the southern parts of the Red Sea Hills, and precipitation averages of about 500 mm yr−1 can reach up to 700 mm yr−1.
The observation of the GRACE TWS pattern as extracted from RL06 solutions with the DDK5 filter showed a general agreement between the three solutions (CSR, JPL, and GFZ). Moreover, the mass variations extracted from the CSR’s RL06 DDK5 were found to have the most promising detection of the TWS signal over both the NRB and MAS. Furthermore, the observed seasonal signal over the NRB (Average Amplitude: 12 cm) was attributed to the high intensity of the precipitation events over the NRB (AAP: 1000–1800 mm yr−1), where the lack of the seasonal TWS signal over the MAS (Average amplitude: 4 cm) was due to the low intensity of the precipitation events over the MAS (AAP: 180–500 mm yr−1). Finally, the interaction between both basins and other neighboring basins, as well as the separation in the TWS signal (run-off, precipitation, and evapotranspiration) should be investigated in order to extract more information about water recharging and discharging processes to help in understanding the hydrological situation in these areas with precise hydrological models. This task is a scope of our future research work.

Author Contributions

Conceptualization, B.E. and K.A.; methodology, B.E., K.A. and F.A.; validation, K.A. and B.E.; investigation, B.E. and K.A.; data curation, B.E., K.A. and F.A.; writing—original draft preparation, B.E. and K.A.; writing—review and editing, B.E., K.A., F.A., M.E.-A. and A.Z.; supervision, B.E. and K.A.; project administration, F.A. and K.A.; funding acquisition, F.A. All authors have read and agreed to the published version of the manuscript.

Funding

This research was funded by Abdullah Alrushaid Chair for Earth Science Remote Sensing Research at King Saud University, Riyadh, Saudi Arabia.

Acknowledgments

The authors would like firstly to thank the the Abdullah Alrushaid Chair for Earth Science Remote Sensing Research for funding. The spatial representation of the results has been plotted using the GMT5 (Generic Mapping Tools) software [43].

Conflicts of Interest

The authors declare no conflict of interest.

Abbreviations

AAPAverage Annual Precipitation
AMPAverage Monthly Precipitation
CSRthe Center for Space Research (University of Texas in Austin)
DDKDecorrelation filter
EWHEquivalent Water Heights
GFZGeoForschungsZentrum (the German Center forGeosciences), Potsdam
GPCPGlobal Precipitation Climatology Project
GRACEGravity Recovery And Climate Experiment
GRACE-FOGravity Recovery And Climate Experiment Follow-On
JPLJet Propulsion Laboratory
MASAquifer System
NRBNile River Basin
RL06ReLease number 06
SHCSpherical Harmonic Coefficients
SDSScience Data System
TWSTotal Water Storage

References

  1. Trenberth, K.E.; Dai, A.; Rasmussen, R.M.; Parsons, D.B. The changing character of precipitation. Bull. Am. Meteorol. Soc. 2003, 84, 1205–1218. [Google Scholar] [CrossRef]
  2. Watterson, I.G.; Dix, M.R. Simulated changes due to global warming in daily precipitation means and extremes and their interpretation using the gamma distribution. J. Geophys. Res. Atmos. 2003, 108, 4379. [Google Scholar] [CrossRef]
  3. Sun, Y.; Solomon, S.; Dai, A.; Portmann, R.W. How often will it rain? J. Clim. 2007, 20, 4801–4818. [Google Scholar] [CrossRef]
  4. Trenberth, K.E. Changes in precipitation with climate change. Clim. Res. 2011, 47, 123–138. [Google Scholar] [CrossRef] [Green Version]
  5. Lau, W.K.M.; Wu, H.T.; Kim, K.M. A canonical response of precipitation characteristics to global warming from CMIP5 models. Geophys. Res. Lett. 2013, 40, 3163–3169. [Google Scholar] [CrossRef]
  6. Westra, S.; Fowler, H.J.; Evans, J.P.; Alexander, L.V.; Berg, P.; Johnson, F.; Kendon, E.J.; Lenderink, G.; Roberts, N.M. Future changes to the intensity and frequency of short-duration extreme rainfall. Rev. Geophys. 2014, 52, 522–555. [Google Scholar] [CrossRef] [Green Version]
  7. Donat, M.G.; Lowry, A.L.; Alexander, L.V.; O’Gorman, P.A.; Maher, N. More extreme precipitation in the world’s dry and wet regions. Nat. Clim. Chang. 2016, 6, 508–513. [Google Scholar] [CrossRef]
  8. Dai, A.; Rasmussen, R.M.; Liu, C.; Ikeda, K.; Prein, A.F. A new mechanism for warm-season precipitation response to global warming based on convection-permitting simulations. Clim. Dyn. 2020, 55, 343–368. [Google Scholar] [CrossRef]
  9. Abdelmohsen, K.; Sultan, M.; Ahmed, M.; Save, H.; Elkaliouby, B.; Emil, M.; Yan, E.; Abotalib, A.Z.; Krishnamurthy, R.V.; Abdelmalik, K. Response of deep aquifers to climate variability. Sci. Total Environ. 2019, 677, 530–544. [Google Scholar] [CrossRef]
  10. Abdelmohsen, K.; Sultan, M.; Save, H.; Abotalib, A.Z.; Yan, E. What can the GRACE seasonal cycle tell us about lake-aquifer interactions? Earth-Sci. Rev. 2020, 211, 103392. [Google Scholar] [CrossRef]
  11. Sataer, G.; Sultan, M.; Emil, M.K.; Yellich, J.A.; Palaseanu-Lovejoy, M.; Becker, R.; Gebremichael, E.; Abdelmohsen, K. Remote Sensing Application for Landslide Detection, Monitoring along Eastern Lake Michigan (Miami Park, MI). Remote Sens. 2022, 14, 3474. [Google Scholar] [CrossRef]
  12. Hakimi, M.H.; Varfolomeev, M.A.; Kahal, A.Y.; Gharib, A.F.; Alshehri, F.; Rahim, A.; Al Faifi, H.J.; Al-Muntaser, A.A.; Qaysi, S.; Abdelmohsen, K. Conventional and unconventional petroleum potentials of the Late Jurassic Madbi organic-rich shales from the Sunah oilfield in the Say’un--Masilah Basin, Eastern Yemen. J. Asian Earth Sci. 2022, 231, 105221. [Google Scholar] [CrossRef]
  13. Izadi, M.; Sultan, M.; El Kadiri, R.; Ghannadi, A.; Abdelmohsen, K. A Remote Sensing and Machine Learning—Based Approach to Forecast the Onset of Harmful Algal Bloom. Remote Sens. 2021, 13, 3863. [Google Scholar] [CrossRef]
  14. Aljammaz, A.; Sultan, M.; Izadi, M.; Abotalib, A.Z.; Elhebiry, M.S.; Emil, M.K.; Abdelmohsen, K.; Saleh, M.; Becker, R. Land Subsidence Induced by Rapid Urbanization in Arid Environments: A Remote Sensing-Based Investigation. Remote Sens. 2021, 13, 1109. [Google Scholar] [CrossRef]
  15. Pankratz, H.G.; Sultan, M.; Abdelmohsen, K.; Sauck, W.A.; Alsefry, S.; Alharbi, H.; Emil, M.K.; Gebremichael, E.; Asaeidi, A.; Alshehri, F.; et al. Use of Geophysical and Radar Interferometric Techniques to Monitor Land Deformation Associated with the Jazan Salt Diapir, Jazan city, Saudi Arabia. Surv. Geophys. 2021, 42, 177–200. [Google Scholar] [CrossRef]
  16. AbouAly, N.; Abdelmohsen, K.; Becker, M.; Mohamed, A.-M.S.; Abotalib, A.Z.; Saleh, M.; Zahran, K.H. Evaluation of annual and semiannual total mass variation over the Mediterranean Sea from satellite data. Arab. J. Geosci. 2021, 14, 1–13. [Google Scholar] [CrossRef]
  17. Tapley, B.D.; Bettadpur, S.; Ries, J.C.; Thompson, P.F.; Watkins, M.M. GRACE Measurements of Mass Variability in the Earth System. Science 2004, 305, 503–505. [Google Scholar] [CrossRef] [Green Version]
  18. Ahmed, M.; Abdelmohsen, K. Quantifying modern recharge and depletion rates of the Nubian Aquifer in Egypt. Surv. Geophys. 2018, 39, 729–751. [Google Scholar] [CrossRef]
  19. Abdelmalik, K.W.; Abdelmohsen, K. GRACE and TRMM mission: The role of remote sensing techniques for monitoring spatio-temporal change in total water mass, Nile basin. J. Afr. Earth Sci. 2019, 160, 103596. [Google Scholar] [CrossRef]
  20. Sahour, H.; Sultan, M.; Abdellatif, B.; Emil, M.; Abotalib, A.Z.; Abdelmohsen, K.; Vazifedan, M.; Mohammad, A.T.; Hassan, S.M.; Metwalli, M.R.; et al. Identification of shallow groundwater in arid lands using multi-sensor remote sensing data and machine learning algorithms. J. Hydrol. 2022, 614, 128509. [Google Scholar] [CrossRef]
  21. Sultan, M.; Sturchio, N.C.; Alsefry, S.; Emil, M.K.; Ahmed, M.; Abdelmohsen, K.; AbuAbdullah, M.M.; Yan, E.; Save, H.; Alharbi, T.; et al. Assessment of age, origin, and sustainability of fossil aquifers: A geochemical and remote sensing–based approach. J. Hydrol. 2019, 576, 325–341. [Google Scholar] [CrossRef]
  22. Othman, A.; Sultan, M.; Becker, R.; Alsefry, S.; Alharbi, T.; Gebremichael, E.; Alharbi, H.; Abdelmohsen, K. Use of Geophysical and Remote Sensing Data for Assessment of Aquifer Depletion and Related Land Deformation. Surv. Geophys. 2018, 39, 543–566. [Google Scholar] [CrossRef] [PubMed] [Green Version]
  23. Othman, A.; Abdelmohsen, K. A Geophysical and Remote Sensing-Based Approach for Monitoring Land Subsidence in Saudi Arabia. In Applications of Space Techniques on the Natural Hazards in the MENA Region; Springer: Cham, Switzerland, 2022; pp. 477–494. [Google Scholar]
  24. Abdelmohsen, K.; Sultan, M.; Save, H.; Abotalib, A.Z.; Yan, E.; Zahran, K.H. Buffering the impacts of extreme climate variability in the highly engineered Tigris Euphrates river system. Sci. Rep. 2022, 12, 1–13. [Google Scholar] [CrossRef] [PubMed]
  25. Sahour, H.; Sultan, M.; Vazifedan, M.; Abdelmohsen, K.; Karki, S.; Yellich, J.A.; Gebremichael, E.; Alshehri, F.; Elbayoumi, T.M. Statistical Applications to Downscale GRACE-Derived Terrestrial Water Storage Data and to Fill Temporal Gaps. Remote Sens. 2020, 12, 533. [Google Scholar] [CrossRef] [Green Version]
  26. Flechtner, F. GFZ Level-2 Processing Standards Document for Level-2 Product Release 0003. GeoForschungszentrum Potsdam Geod. Remote Sens. 2005. Available online: https://gfzpublic.gfz-potsdam.de/rest/items/item_61197_3/component/file_61227/content (accessed on 10 October 2022).
  27. Watkins, M.M.; Wiese, D.N.; Yuan, D.-N.; Boening, C.; Landerer, F.W. Improved methods for observing Earth’s time variable mass distribution with GRACE using spherical cap mascons. J. Geophys. Res. Solid Earth 2015, 120, 2648–2671. [Google Scholar] [CrossRef]
  28. Save, H. CSR GRACE RL06 Mascon Solutions. Available online: https://dataverse.tdl.org/dataset.xhtml?persistentId=doi:10.18738/T8/UN91VR (accessed on 24 December 2019).
  29. Kusche, J.; Schrama, E.J.O. Surface mass redistribution inversion from global GPS deformation and Gravity Recovery and Climate Experiment (GRACE) gravity data. J. Geophys. Res. 2005, 110, B09409. [Google Scholar] [CrossRef] [Green Version]
  30. Aiazzi, B.; Alparone, L.; Baronti, S.; Garzelli, A. Context-driven fusion of high spatial and spectral resolution images based on oversampled multiresolution analysis. Ieee Trans. Geosci. Remote Sens. 2002, 40, 2300–2312. [Google Scholar] [CrossRef]
  31. Wahr, J.; Molenaar, M.; Bryan, F. Time variability of the Earth’s gravity field: Hydrological and oceanic effects and their possible detection using GRACE. J. Geophys. Res. 1998, 103, 30205–30229. [Google Scholar] [CrossRef]
  32. Jekeli, C. Alternative Methods to Smooth the Earth’s Gravity Field; Department of Civil and Environmental Engineering and Geodetic Science, Ohio State University: Columbus, OH, USA, 1981. [Google Scholar]
  33. Swenson, S.; Wahr, J. Estimating large-scale precipitation minus evapotranspiration from GRACE satellite gravity measurements. Geophys. Res. Lett. 2006, 7, 252–270. [Google Scholar] [CrossRef] [Green Version]
  34. Wouters, B.; Schrama, E.J.O. Improved accuracy of GRACE gravity solutions through empirical orthogonal function filtering of spherical harmonics. Geophys. Res. Lett. 2007, 34, L23711. [Google Scholar] [CrossRef]
  35. Kusche, J. Approximate decorrelation and non-isotropic smoothing of time-variable GRACE-type gravity field models. J. Geod. 2007, 81, 733–749. [Google Scholar] [CrossRef] [Green Version]
  36. Klees, R.; Zapreeva, E.A.; Winsemius, H.C.; Savenije, H.G. The bias in GRACE estimates of continental water storage variations. Hydrol. Earth Syst. Sci. 2007, 11, 1227–1241. [Google Scholar] [CrossRef] [Green Version]
  37. Kusche, J.; Schmidt, R.; Petrovic, S.; Rietbroek, R. Decorrelated GRACE time-variable gravity solutions by GFZ, and their validation using a hydrological model. J. Geod. 2009, 83, 903–913. [Google Scholar] [CrossRef] [Green Version]
  38. Elsaka, B.; El-Ashquer, M. Comparison between Gaussian and decorrelation filters of GRACE-based RL05 temporal gravity solutions over Egypt. Surv. Rev. 2021, 54, 233–242. [Google Scholar] [CrossRef]
  39. Adler, R.F.; Huffman, G.J.; Chang, A.; Ferraro, R.; Xie, P.-P.; Janowiak, J.; Rudolf, B.; Schneider, U.; Curtis, S.; Bolvin, D.; et al. The Version-2 Global Precipitation Climatology Project (GPCP) Monthly Precipitation Analysis (1979 Present). J. Hydrometeorol. 2003, 4, 1147. [Google Scholar] [CrossRef]
  40. Elsaka, B. Evaluation of Terrestrial Total Water Height Variations over the Nile River Basin Based on Two Full-Years of GRACE-FO Gravity Field Monthly Solutions. Int. Res. J. Adv. Eng. Sci. 2021, 6, 90–95. [Google Scholar]
  41. Hasan, E.; Tarhule, A.; Kirstetter, P.E. Twentieth and twenty-first century water storage changes in the nile river basin from grace/grace-fo and modeling. Remote Sens. 2021, 13, 953. [Google Scholar] [CrossRef]
  42. Ahmed, M.; Sultan, M.; Wahr, J.; Yan, E. The use of GRACE data to monitor natural and anthropogenic induced variations in water availability across Africa. Earth-Sci. Rev. 2014, 136, 289–300. [Google Scholar] [CrossRef]
  43. Wessel, P.; Smith, W.H.F.; Scharroo, R.; Luis, J.F.; Wobbe, F. Generic mapping tools: Improved version released. EOS Trans. AGU 2013, 94, 409–410. [Google Scholar] [CrossRef]
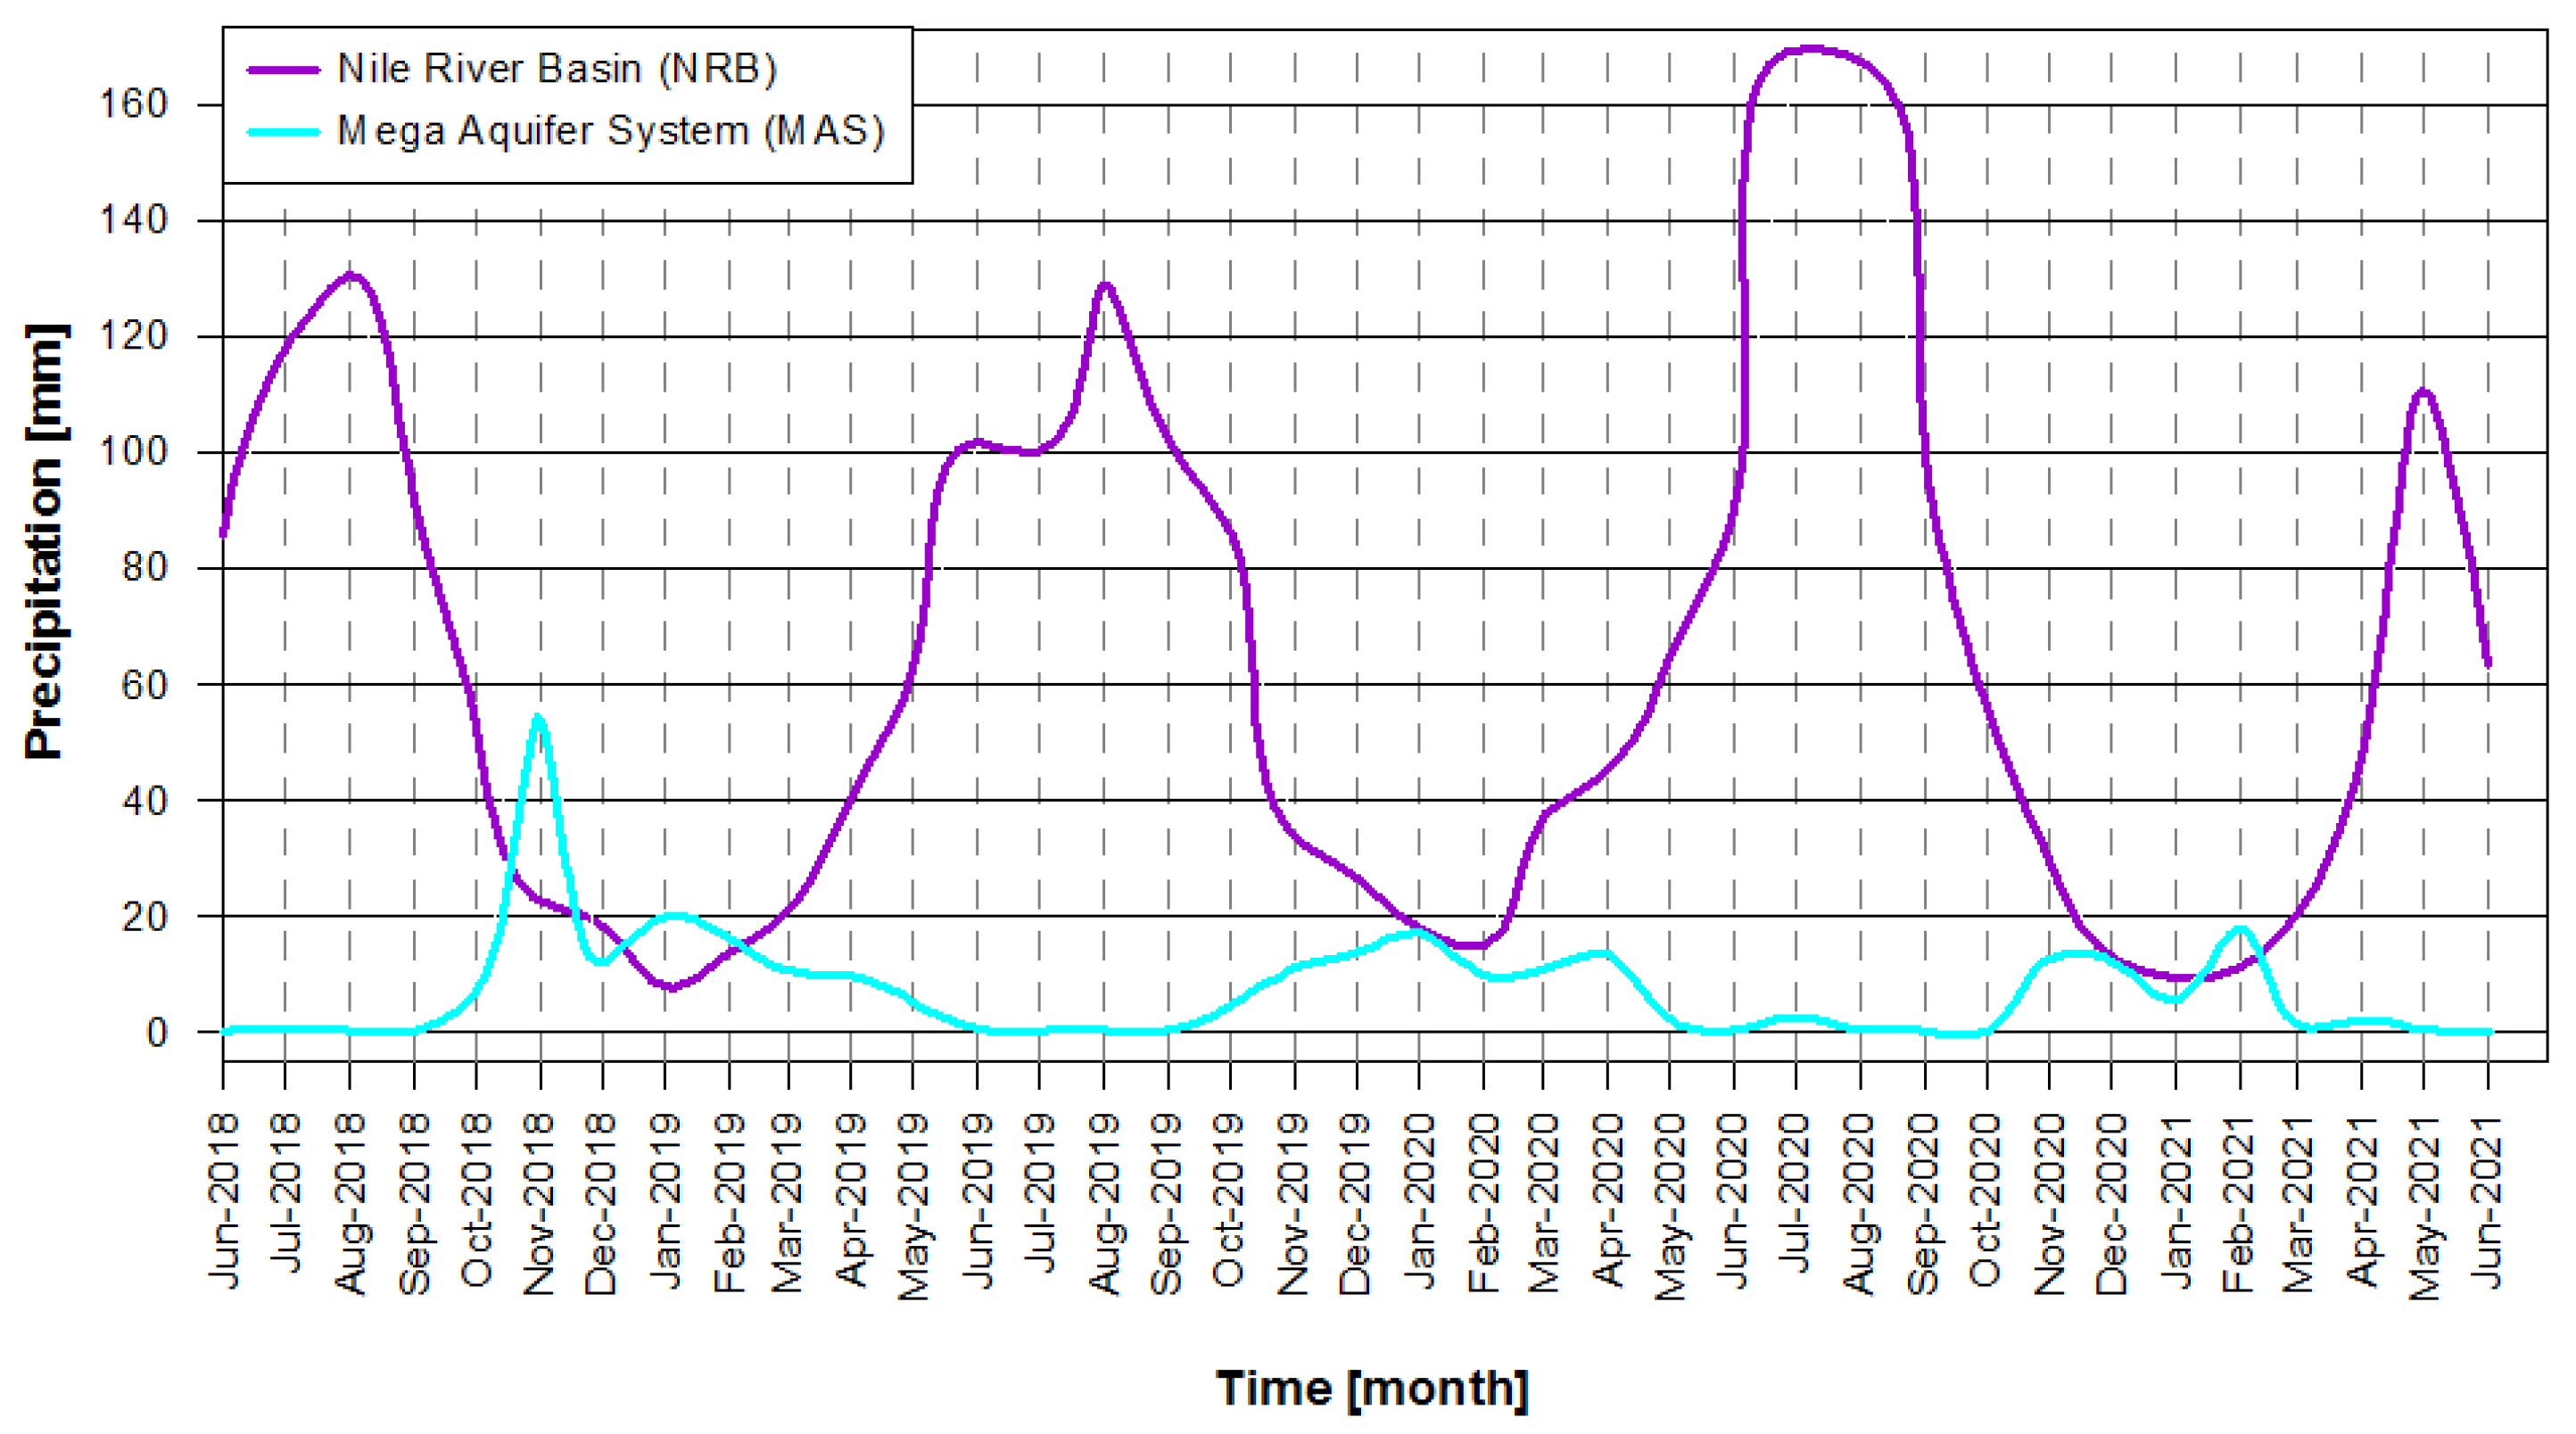
Figure 1. The study area represents the Nile River Basin in Africa and the Mega Aquifer in Asia (represented by blue polygons) shown on a topographic map.
Water 14 03920 g001
Figure 2. Flowchart describing the estimation procedure of the TWS signal in terms of EWH [cm] and the precipitation pattern.
Water 14 03920 g002
Figure 3. Mean basin average of the TWS signal in terms of EWH [in cm] over the NRB; (a) before and (b) after removing the trend (dashed lined) as derived from the DDK5 of GRACE-FO (RL06) products from the three official centers GFZ, CSR, and JPL.
Water 14 03920 g003
Figure 4. Mean Basin average of the TWS signal in terms of EWH [in cm] over the MAS; (a) before and (b) after removing the trend (dashed lined) as derived from the DDK5 of GRACE-FO (RL06) products from the three official centers GFZ, CSR, and JPL.
Water 14 03920 g004
Figure 5. Mass variations in the TWS in terms of EWH [in cm] over the NRB and the MAS as derived from the DDK5 of GRACE-FO (RL06) products from the CSR official data center.
Water 14 03920 g005
Figure 6. Average monthly precipitation in mm over the NRB and the MAS from June 2018 to June 2021.
Water 14 03920 g006
Figure 7. Spatial distribution map showing the average monthly precipitation in mm over the NRB and MAS for the whole study period.
Water 14 03920 g007
Table 1. Mean Basin average of the TWS signal [in cm] and average monthly precipitation [cm] over the NRB and MAS. The TWS statistics are derived from the DDK5 of GRACE-FO (RL06) gravity field products from GFZ, CSR, and JPL official centers, while the precipitation ones are derived from the GPCP data.
Months of Year NILE River BasinMega Aquifer
TWS [cm]Precipitation
[cm]
TWS [cm]Precipitation
[cm]
GFZCSRJPLGFZCSRJPL
2018-061.686−5,066−3.6128.5674.8261.1532.8910.029
2018-070.987−2,240−3.39211.760.063−0.0691.7610.061
2018-08---------13.04---------0.036
2018-09---------9.176---------0.021
2018-10−0.2013.6421.0795.3650.0210.5500.9460.690
2018-11−1.000−1.254−2.0232.258−1.0530.7450.6105.466
2018-12−2.641−2.339−2.4191.8700.8072.3242.8801.217
2019-01−4.373−7.204−5.3430.7412.5180.7480.1161.993
2019-02−6.251−9.153−7.7861.361−1.9001.0890.2391.609
2019-03−6.581−7.143−8.5512.0740.3682.0311.8361.054
2019-04−6.631−7.501−8.6954.0610.4423.4902.9660.976
2019-05−6.587−8.410−7.7116.287−0.2642.9353.2610.516
2019-06−4.481−6.191−6.48610.161.4071.5881.7130.044
2019-07−1.097−3.750−4.76710.00−1.200−0.4330.4220.026
2019-080.5680.417−0.22612.902.9521.6880.8810.036
2019-090.1457.8355.62310.223.7044.3401.9640.046
2019-106.4887.3156.7908.633−1.1850.9581.1400.435
2019-115.3883.1042.7913.370−2.227−1.586−2.8691.092
2019-125.3722.2132.8142.6730.5950.432−0.6381.358
2020-01−3.017−1.349−0.5041.7664.8750.5970.7231.713
2020-02−4.222−2.283−3.3411.483−1.004−1.321−1.6170.969
2020-03−4.488−0.237−2.6583.703−0.3670.8171.7301.088
2020-04−5.294−4.171−4.8964.5221.0100.7601.0661.339
2020-05−3.077−1.917−2.3436.4660.467−0.1730.0790.208
2020-06−2.125−1.932−1.9038.976−1.465−0.450−2.0160.032
2020-070.0212.5353.15116.94−0.2470.316−0.6750.256
2020-084.9566.7416.16316.761.919−0.1200.5780.057
2020-0912.1313.7113.6510.08−1.036−1.882−0.9620.024
2020-1012.299.77910.475.642−1.555−2.247−2.7110.017
2020-119.1647.2018.5322.904−1.004−1.651−2.5801.261
2020-125.2814.0673.3981.273−3.092−3.834−3.5001.235
2021-013.2433.0192.6450.931−2.556−3.965−3.0810.557
2021-023.3381.1672.4241.103−0.469−1.399−1.4431.800
2021-031.511−0.8690.9392.050−0.076−1.260−0.0260.135
2021-040.104−2.2880.0444.783−0.217−2.367−2.2850.205
2021-05−2.6992.2923.52111.09−1.027−1.264−2.6650.052
2021-062.0740.2592.6176.3702.381−2.539−0.7380.030
Publisher’s Note: MDPI stays neutral with regard to jurisdictional claims in published maps and institutional affiliations.

