Evolution and Influencing Factors of Landscape Pattern in the Yellow River Basin (Henan Section) Due to Land Use Changes
Abstract
:1. Introduction
2. Materials and Methods
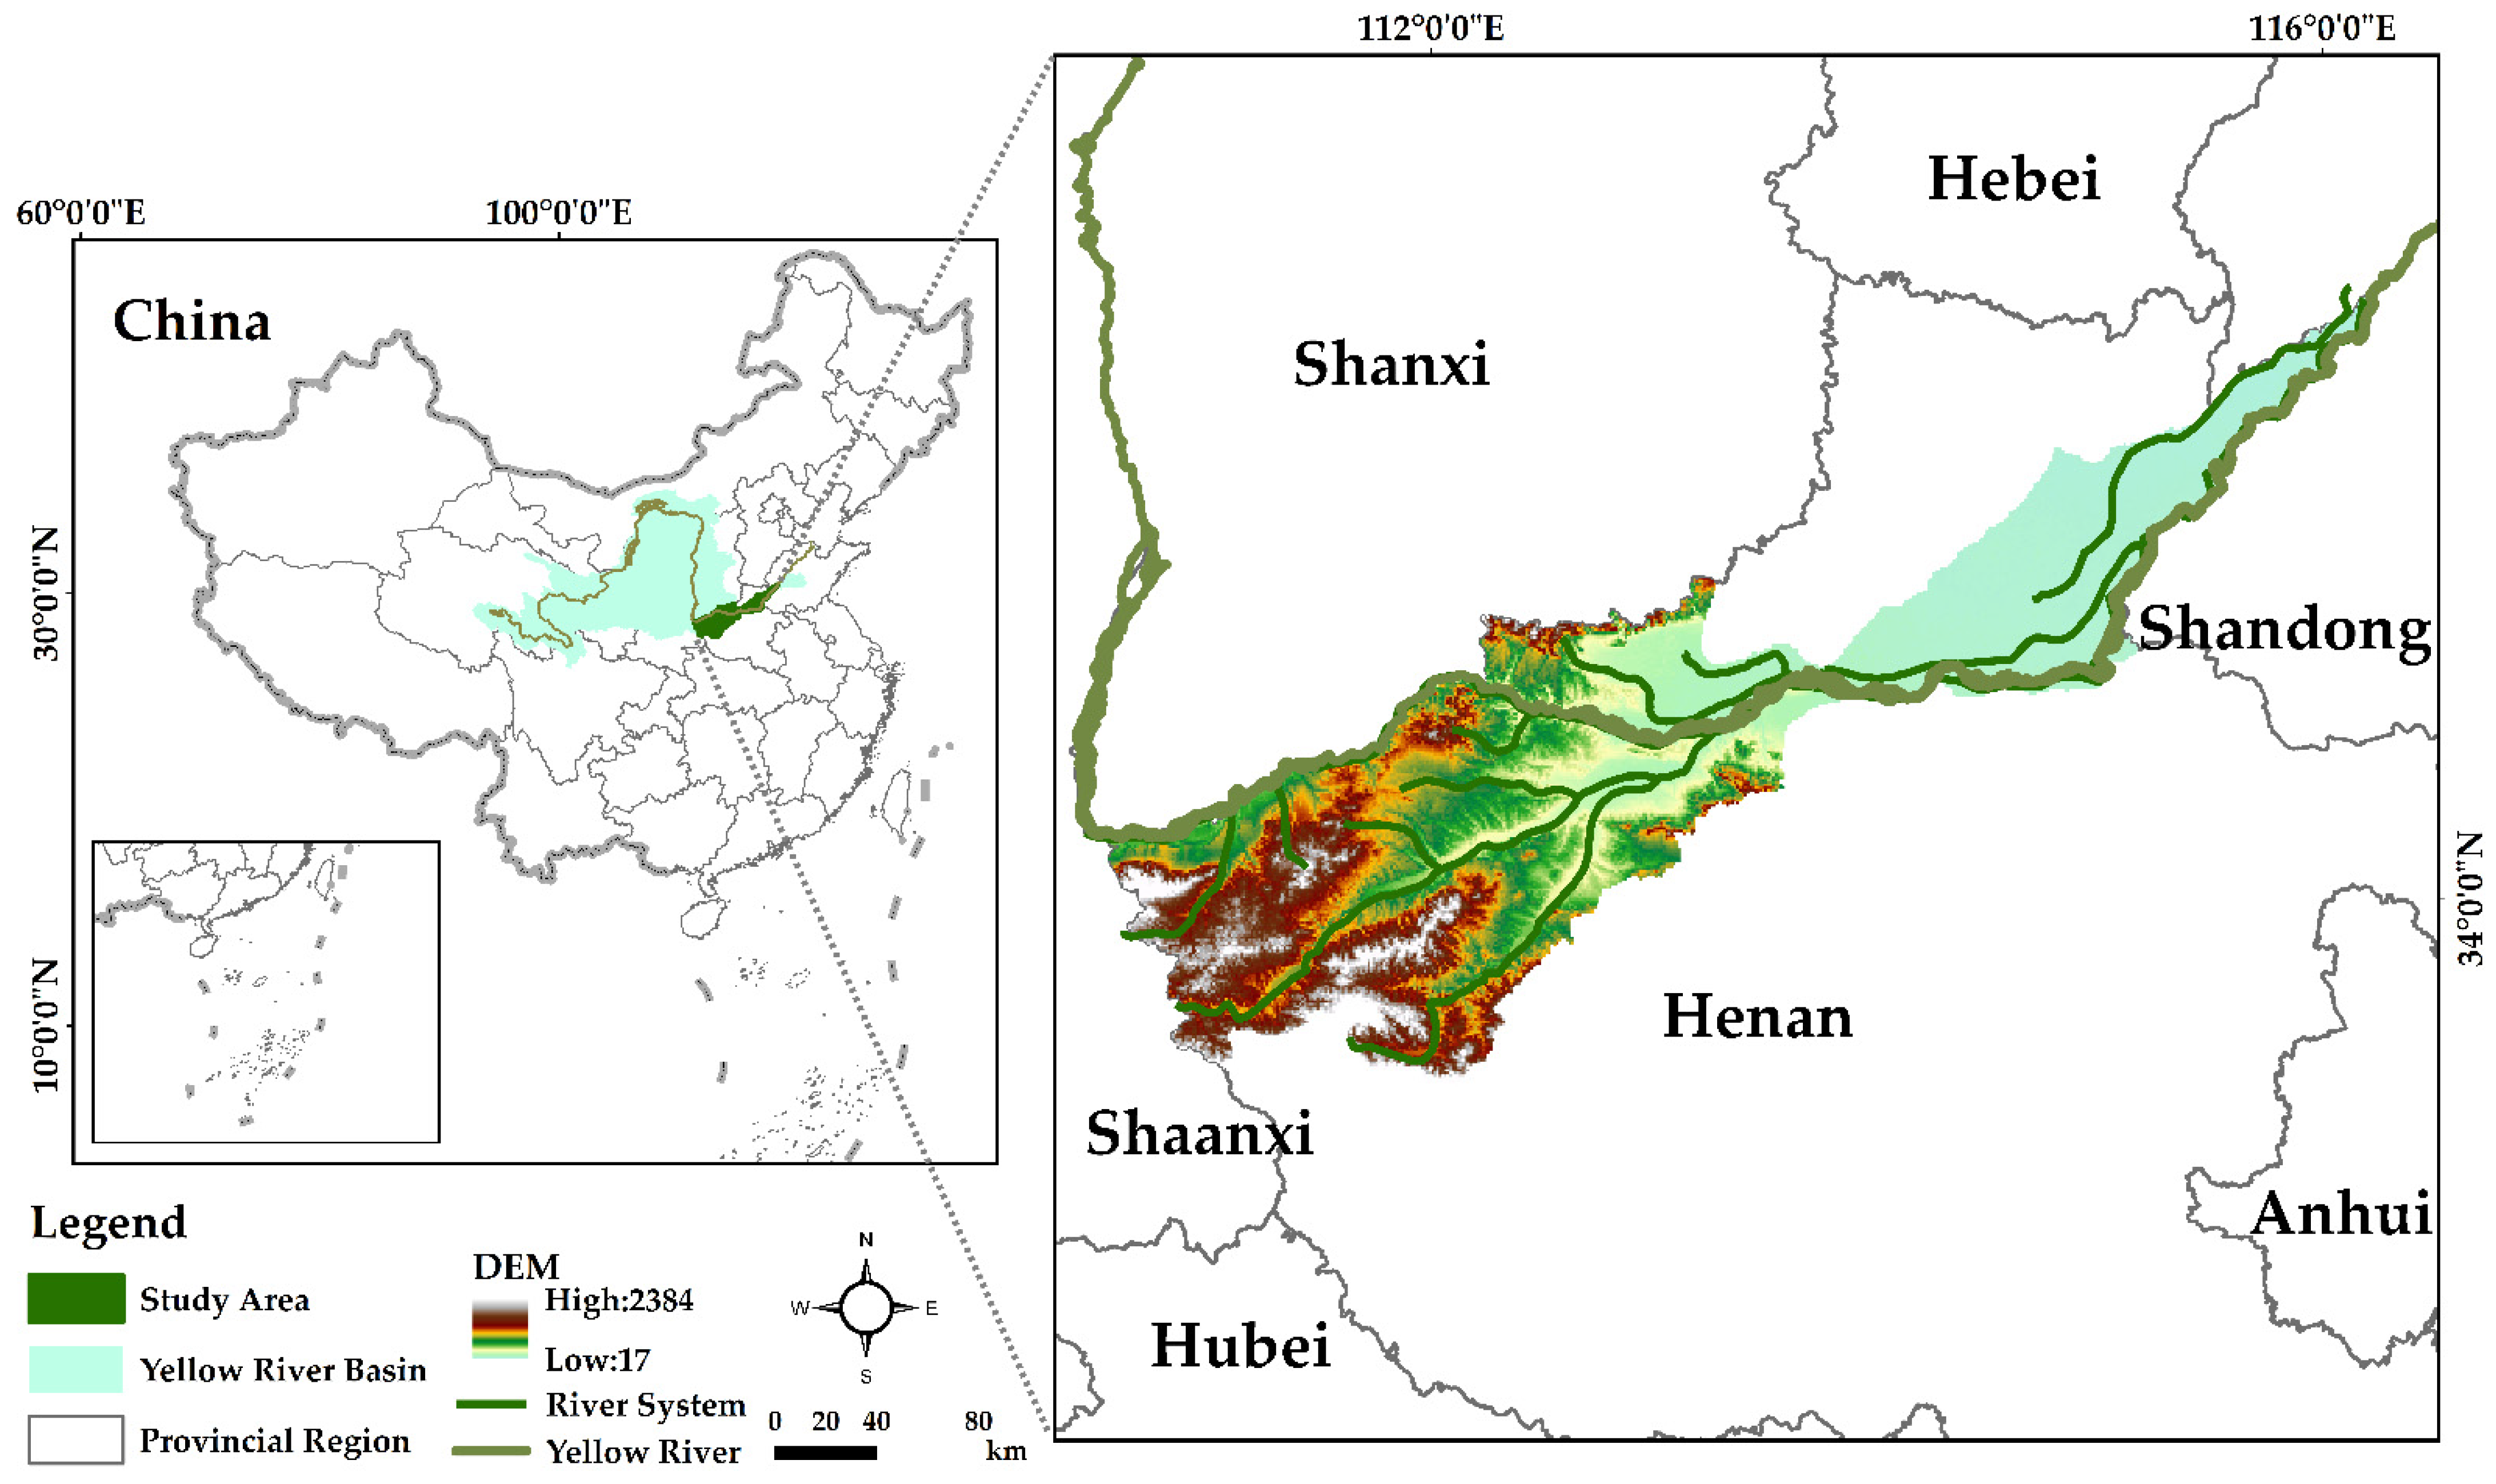
2.1. Overview of Study Area
2.2. Source of Data
2.3. Study Methods
2.3.1. Land Use Transfer Matrix
2.3.2. Land Use Information Atlas
2.3.3. Landscape Pattern Index and Its Influencing Factors
- (1)
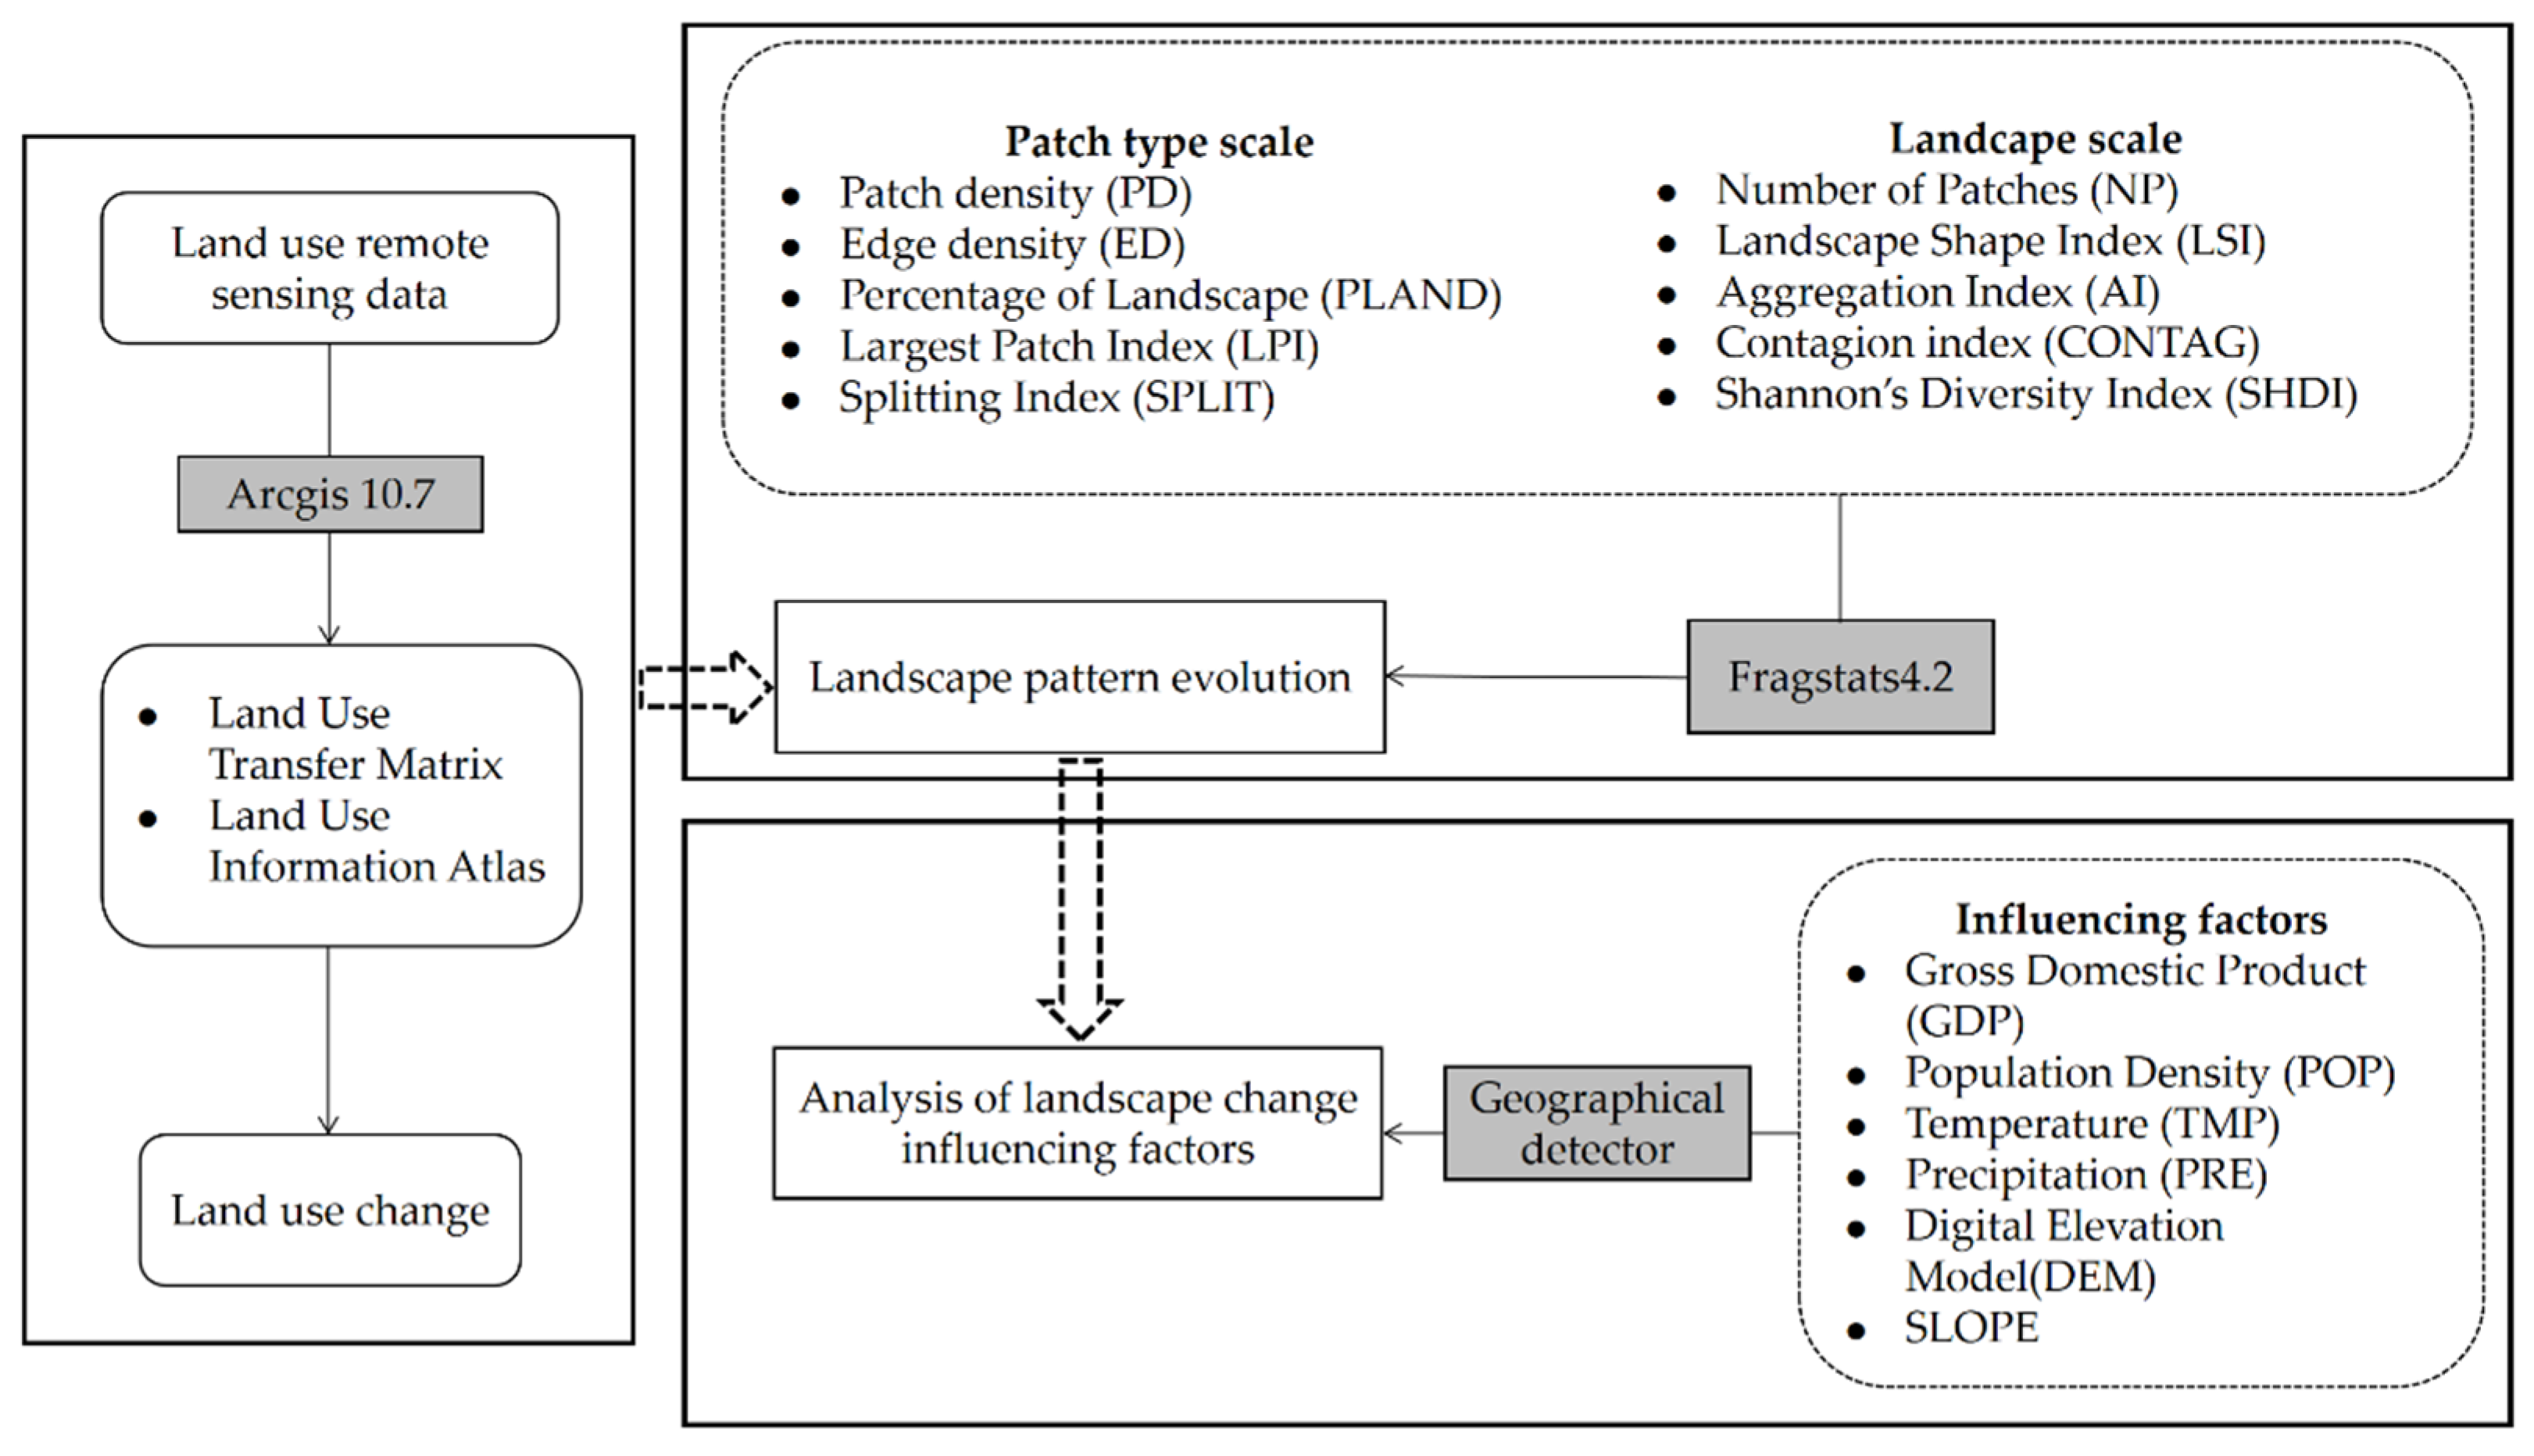
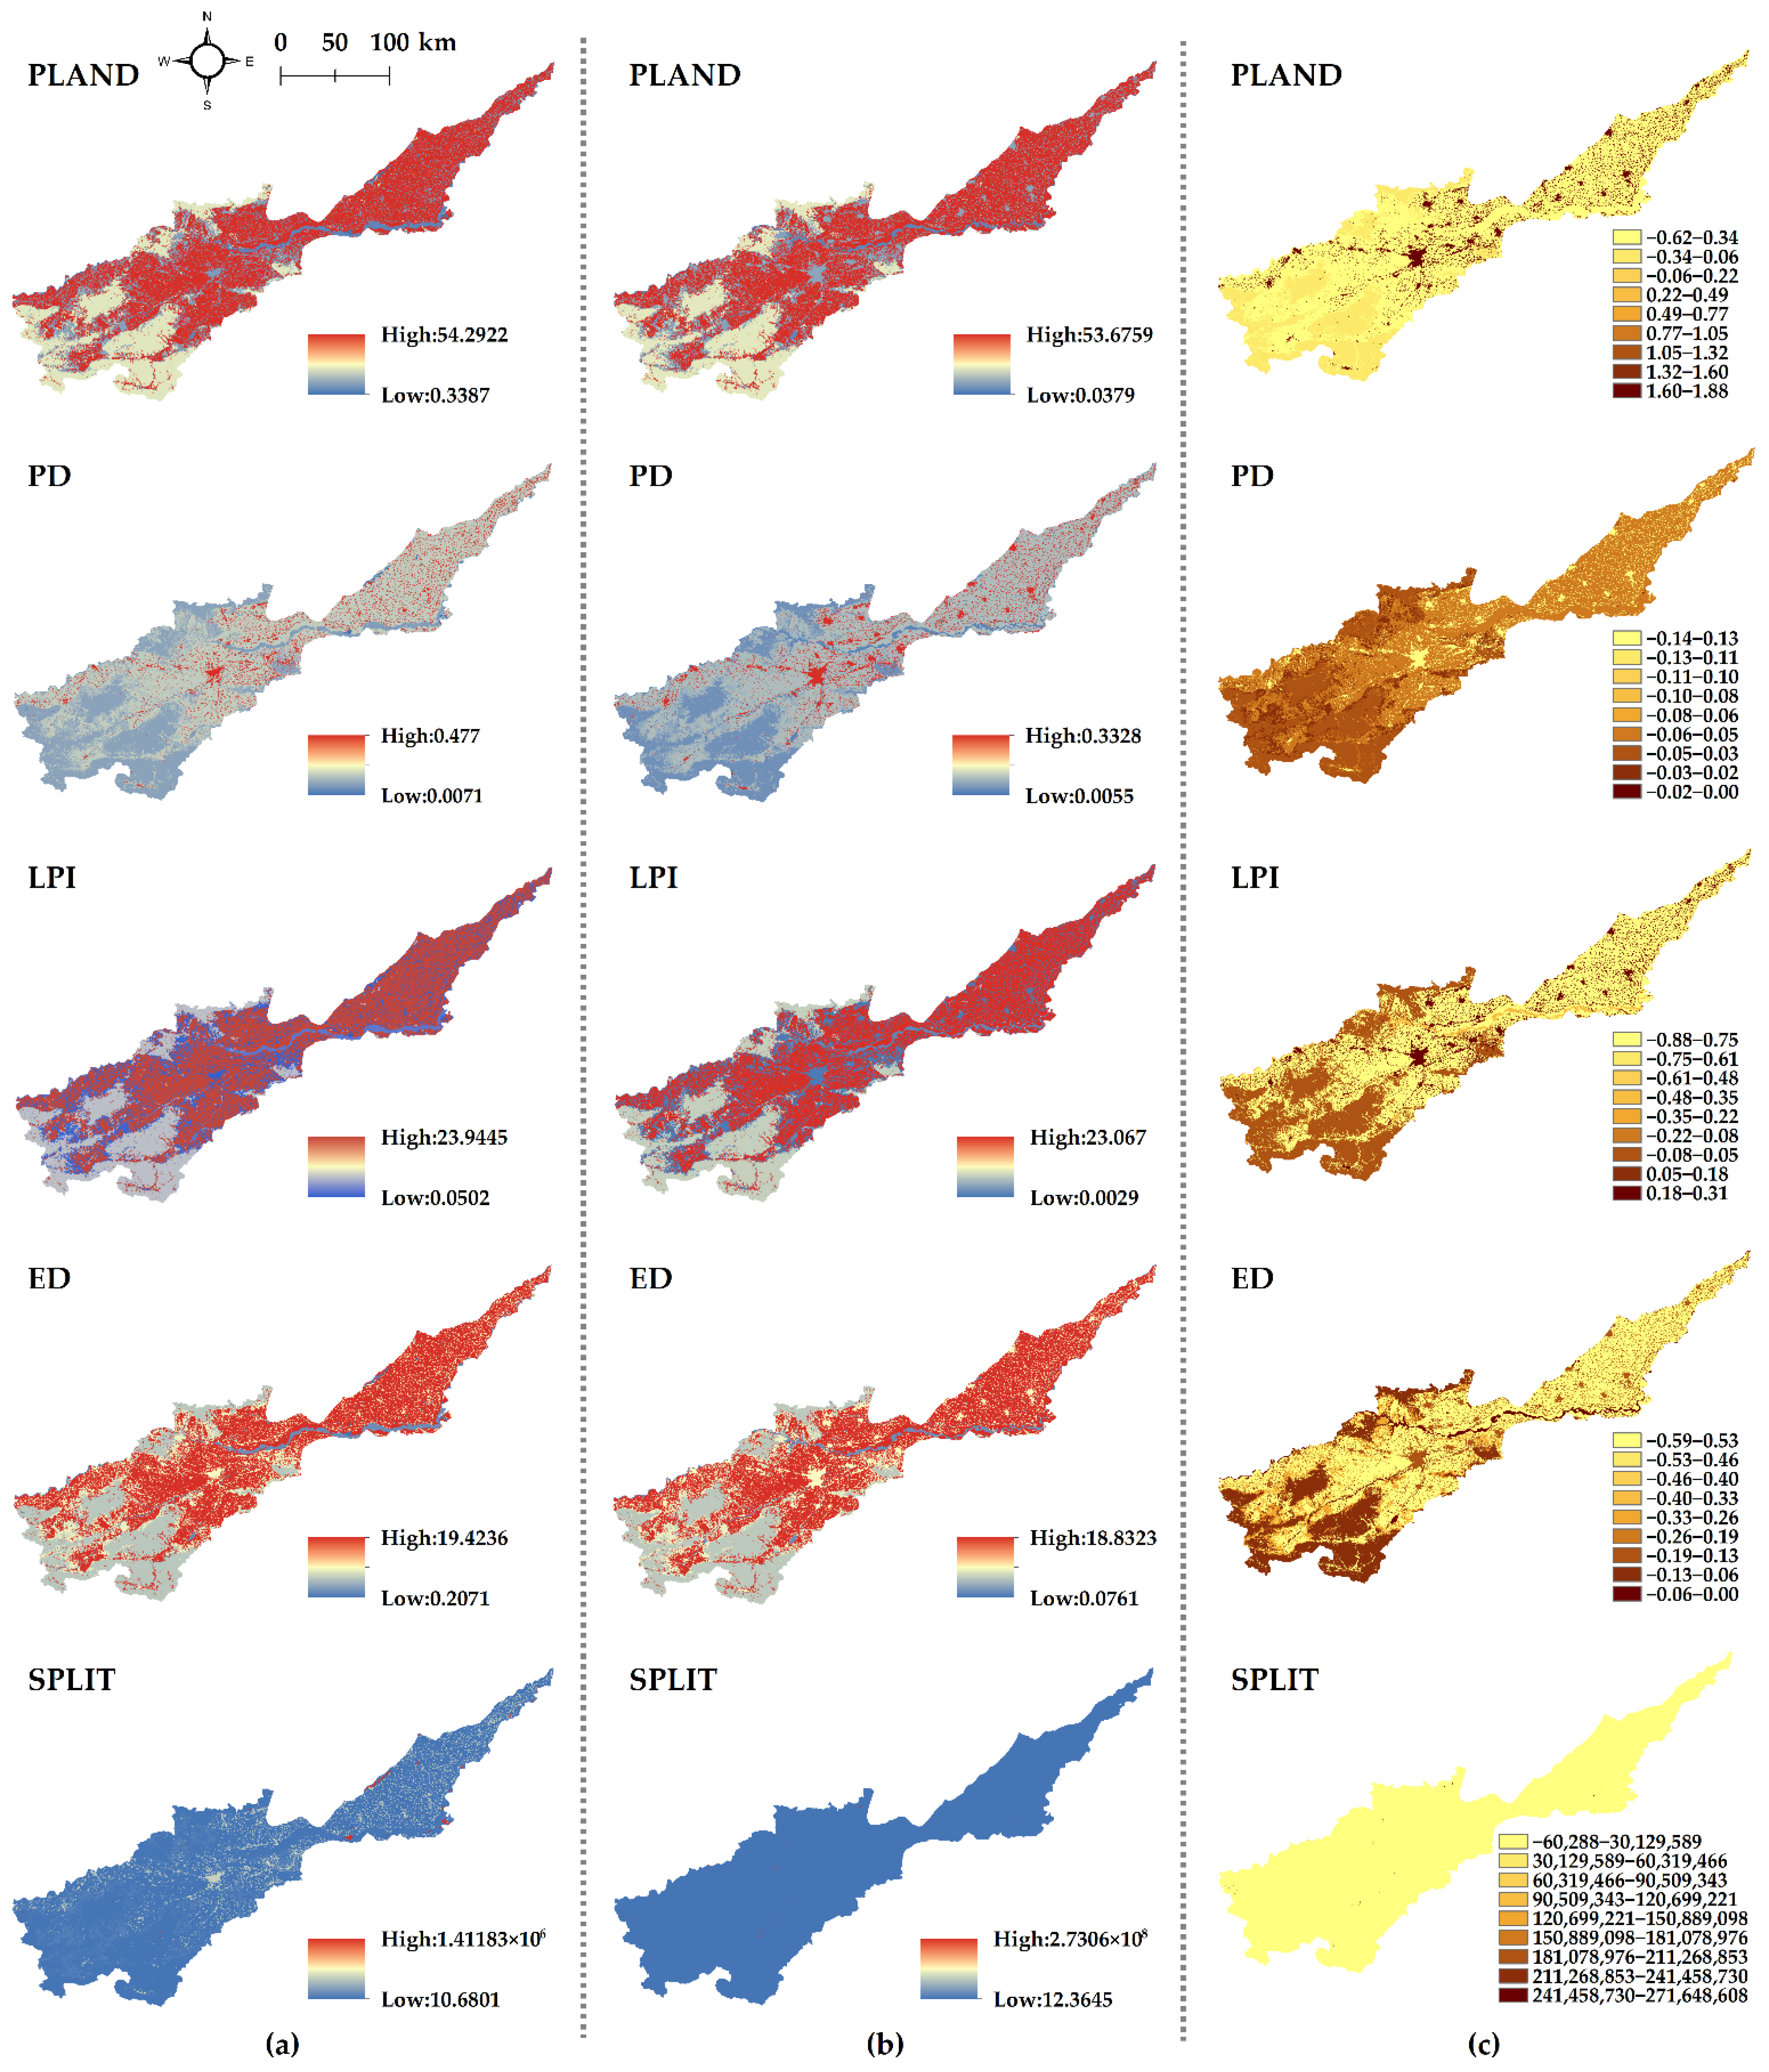
- Landscape pattern index: Landscape pattern index is a quantitative research method to describe landscape changes, which can effectively reflect the spatial distribution and structural characteristics of landscape patterns [54]. To fully reflect the landscape spatial pattern characteristics of the Yellow River Basin (Henan section), based on previous studies and the land use situation in the study area, the ecological significance of each landscape pattern index was comprehensively considered [55]. In this study, a series of landscape pattern indicators (Table 4) were selected at the patch-type scale and landscape scales, and the characteristics of quantity, shape, and spatial distribution of landscape elements in the Yellow River Basin (Henan section) were analyzed. The patch type scale refers to the spatial distribution characteristics of each land use type landscape, and the landscape scale refers to the spatial distribution characteristics of the whole landscape.
- (2)
- Selection of influencing factors of landscape change: The influencing factors of landscape development are different in different time and space scales, and most studies divide them into natural factors and socio-economic factors [56]. This study mainly analyzes the spatial differences of landscape heterogeneity caused by natural factors and socio-economic factors. Therefore, this study selects the spatial distribution data of Gross Domestic Product (GDP) and Population Density (POP) to represent the spatial differences between socio-economic level and population density. In addition, it is found that climatic conditions have a small impact on the landscape spatial distribution of small-scale watersheds [57], and landscape spatial heterogeneity can be explained by terrain factors [58,59]. Therefore, this study selects the spatial data of Temperature (TMP) and Precipitation (PRE) to represent the climatic conditions. The meteorological data comes from the temperature and precipitation of meteorological stations around the Yellow River Basin (Henan section) provided by the Resources and Environment Data Center of China Academy of Sciences (https://www.resdc.cn/ (accessed on 9 September 2021)). Temperature is characterized by the average temperature of 12 months, and precipitation is characterized by the total precipitation of 12 months. Moreover, topographic variables (DEM and SLOPE) are also considered.
2.3.4. Analysis of Landscape Influencing Factors
- (1)
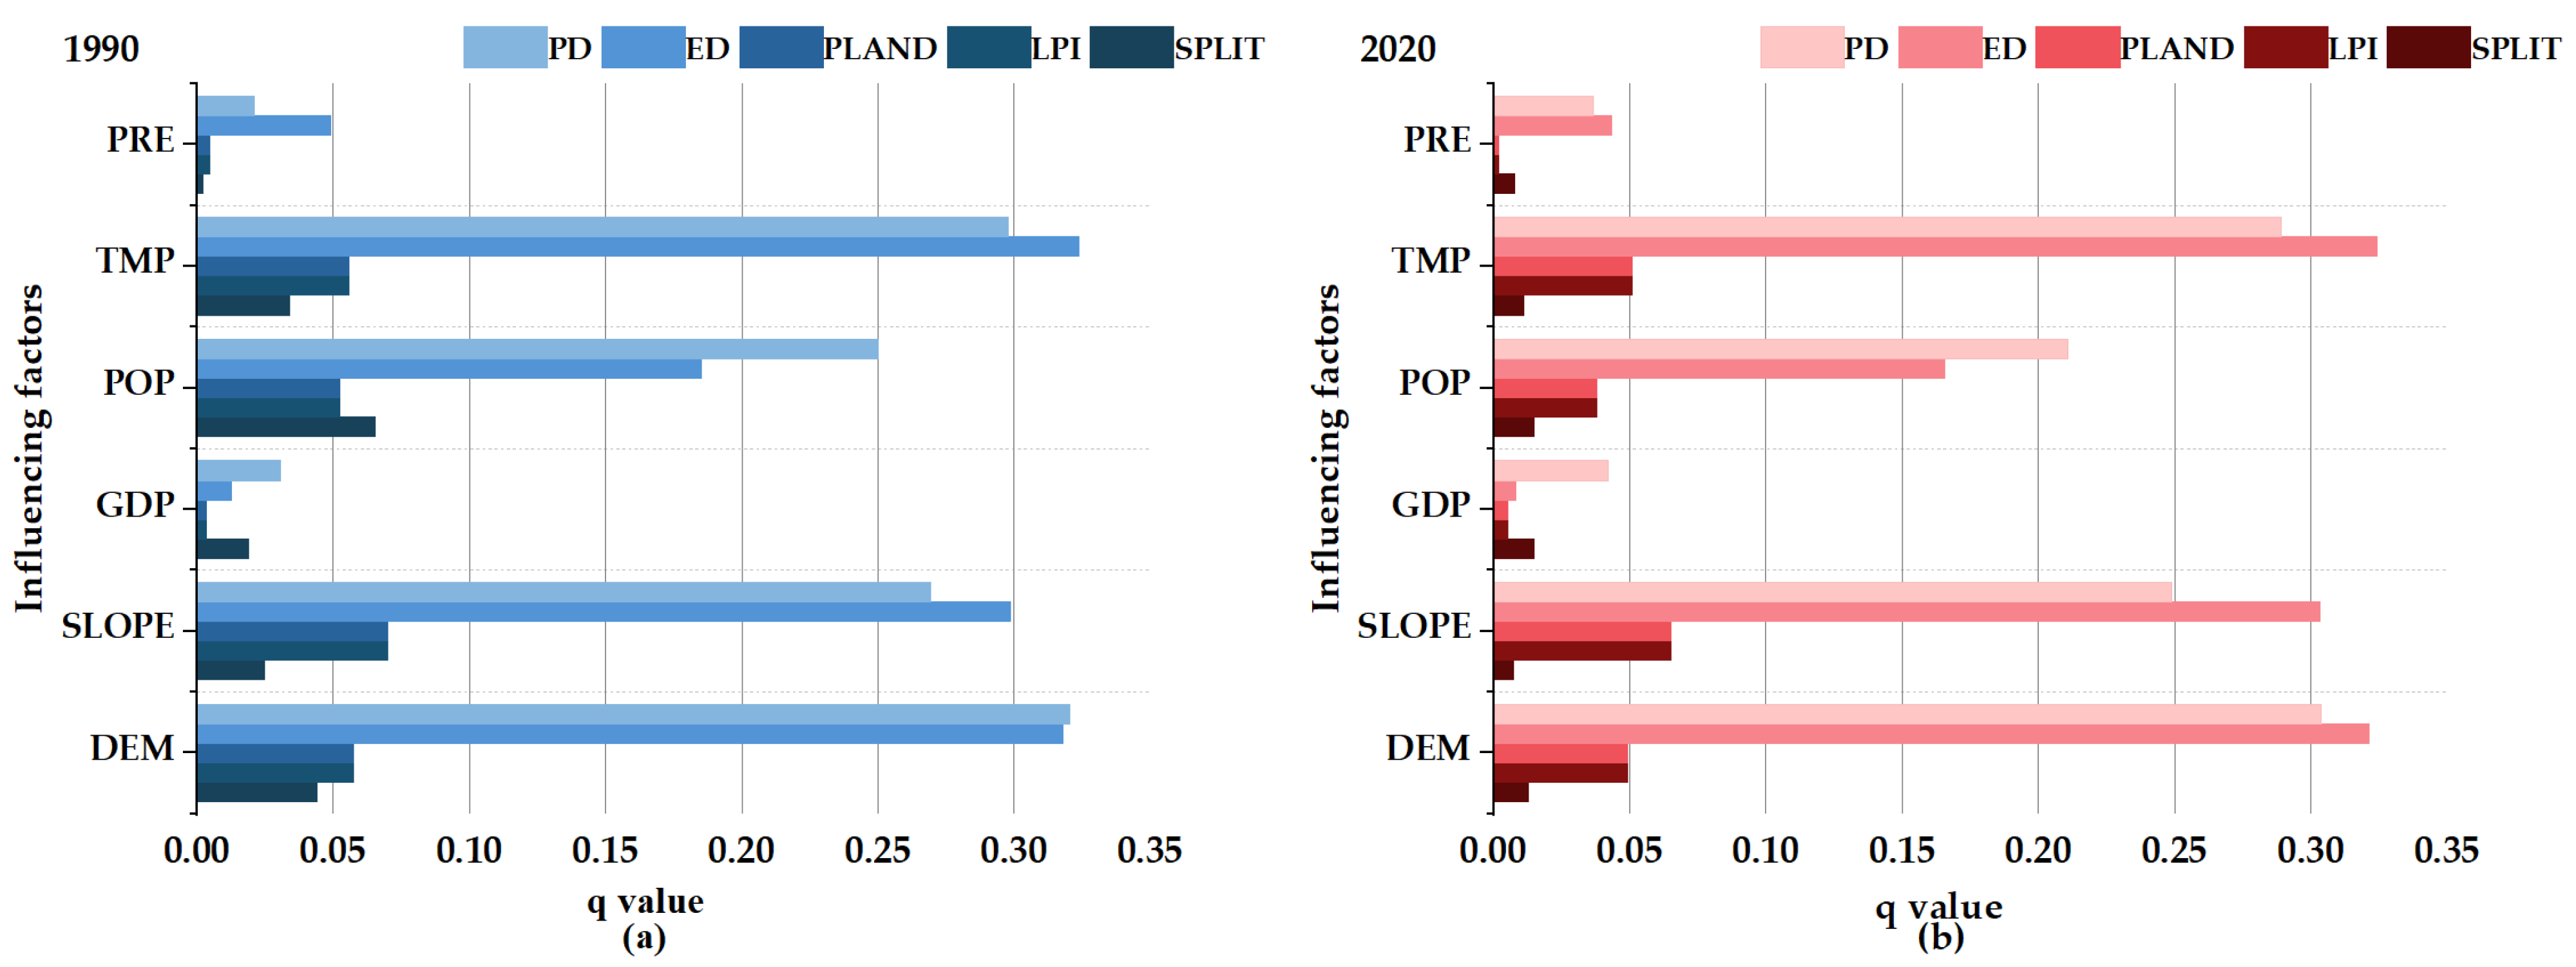
- Factor detection: Detect the explanatory power of each influence factor X to the target factor Y, measured by q-value, and the expression is:
- (2)
- Interactive detection: This method can be used to identify the interaction between different influencing factors X, that is, to evaluate whether the interaction of two influencing factors X1 and X2 will increase or decrease the explanatory power of dependent variable Y, or whether the influences of these factors on Y are independent of each other. The evaluation method is to first calculate the q-values of two factors X1 and X2 for Y: q(X1) and q(X2), respectively, and calculate their interactive values: q(X1∩X2), and compare q(X1), q(X2), and q(X1∩X2). The relationship between the two factors can be divided into the following categories (Table 5):
3. Results
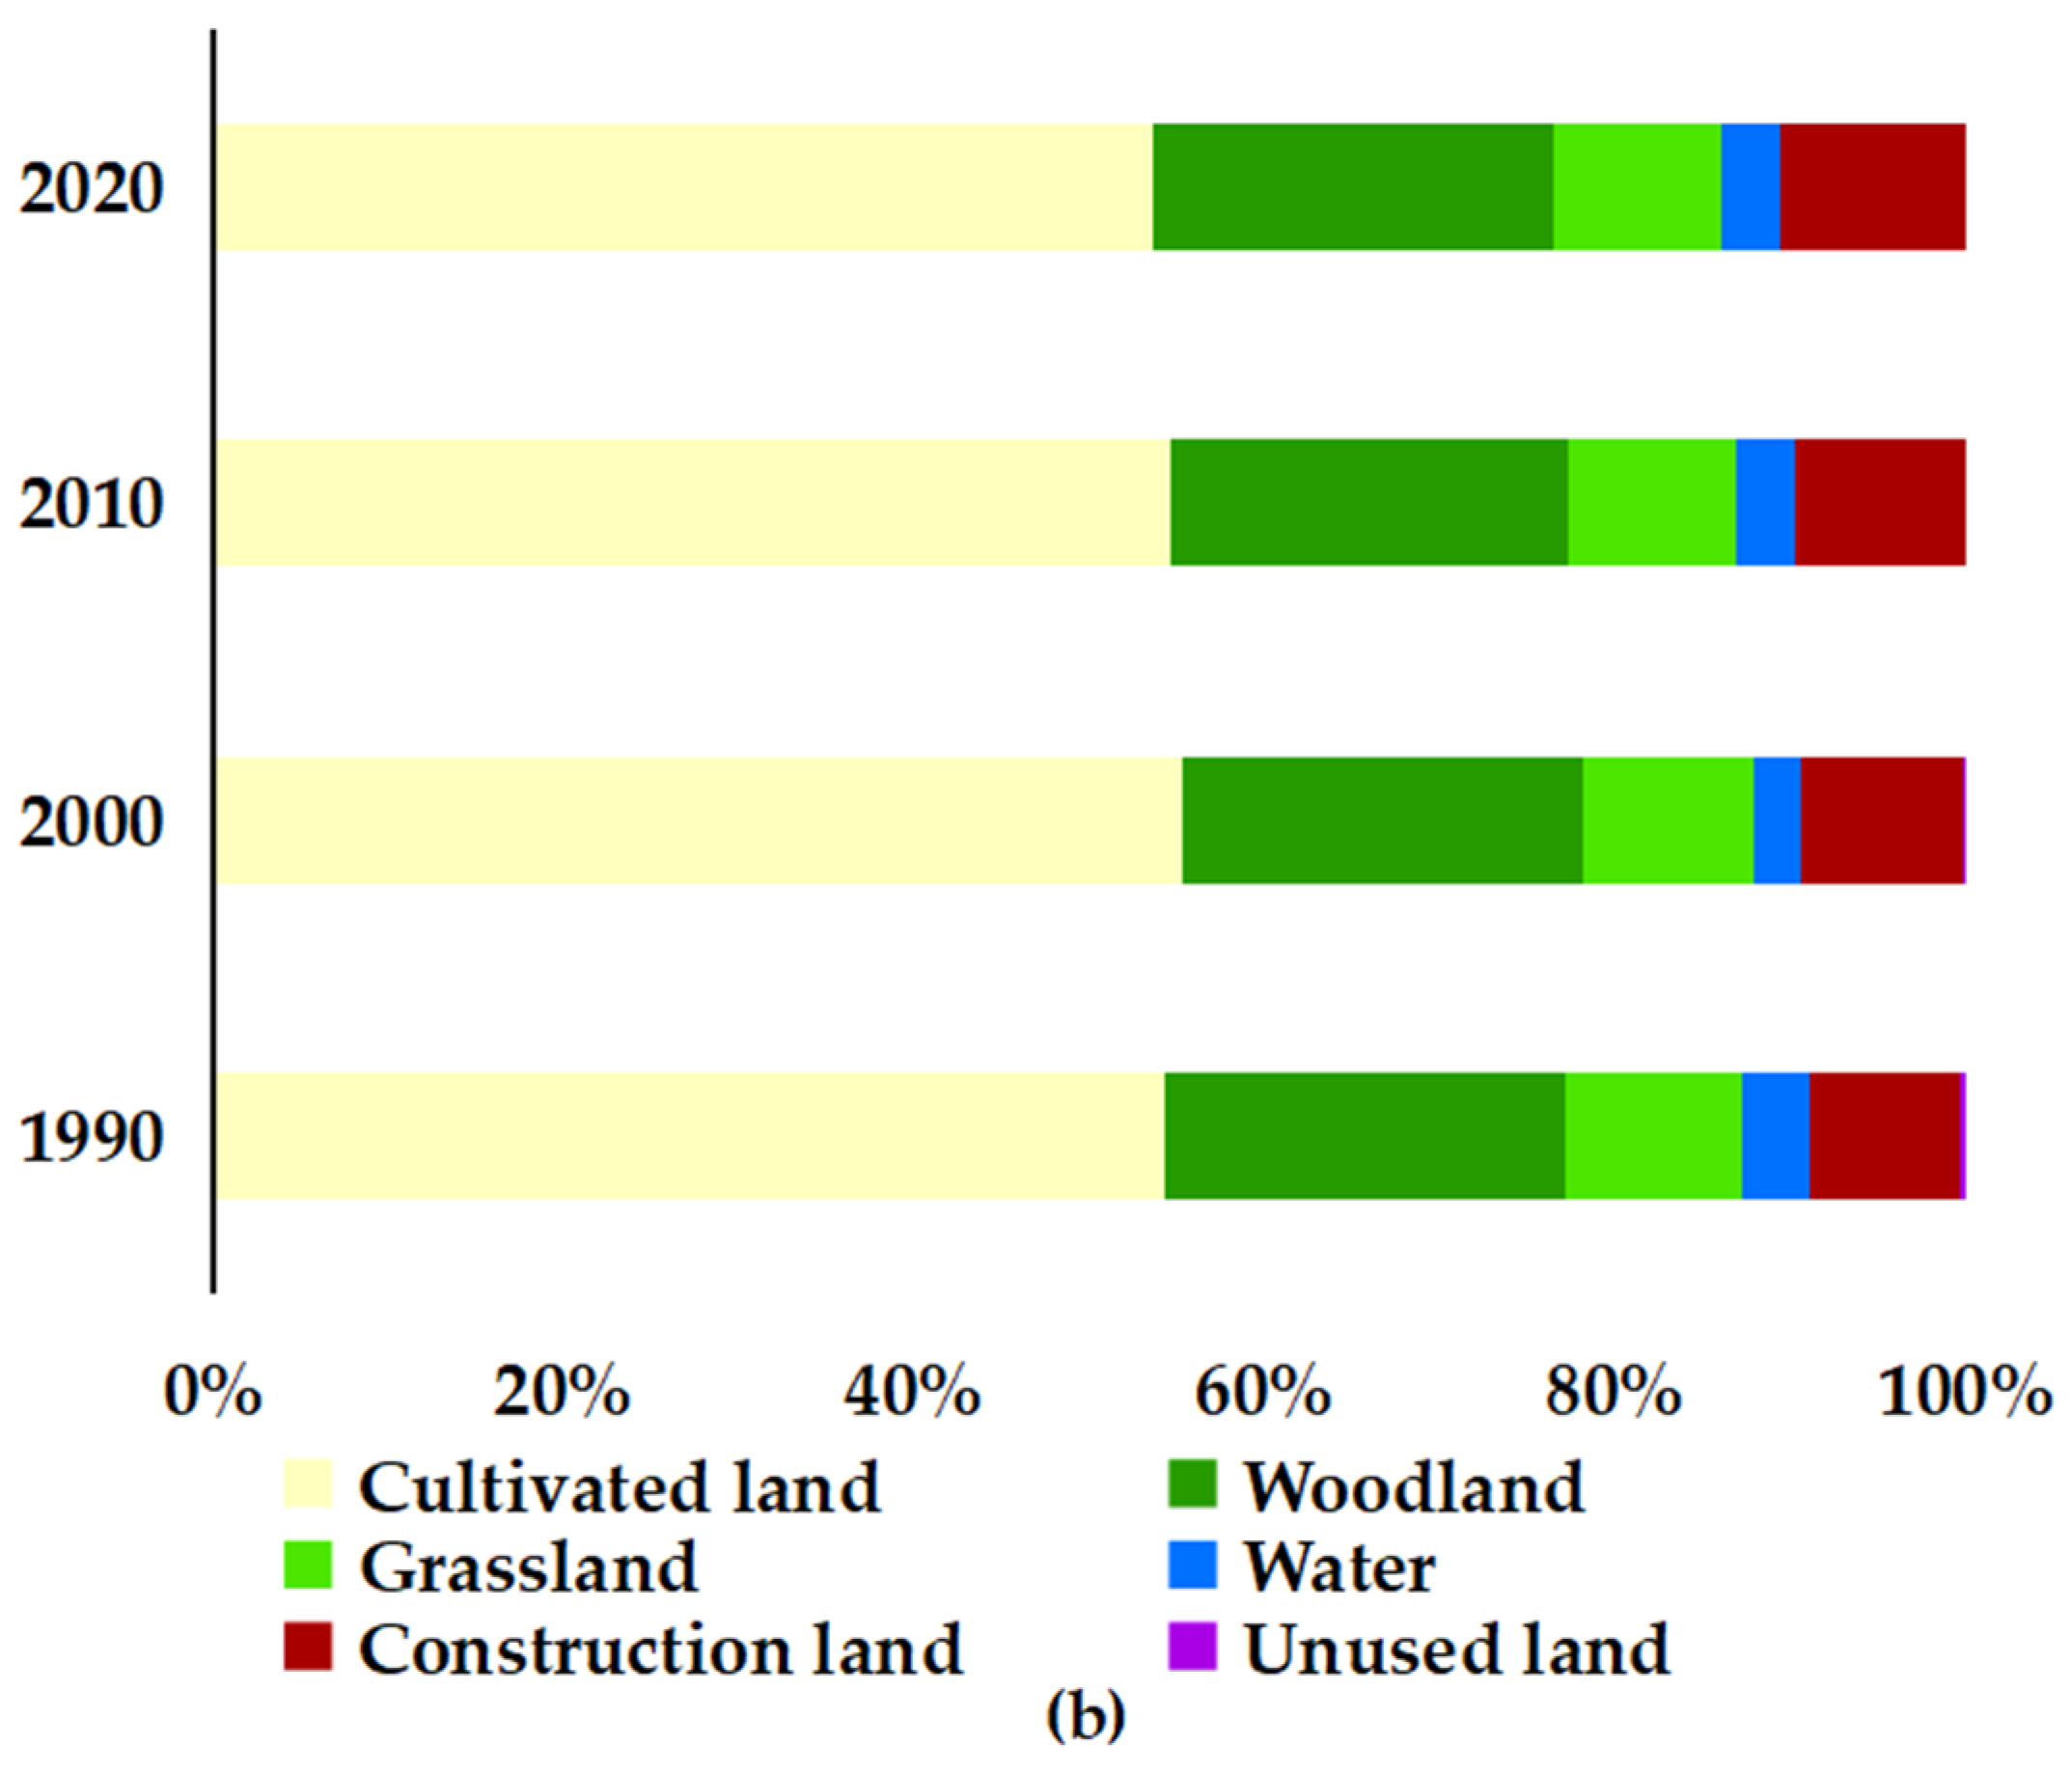
3.1. Land Use Space and Area Distribution
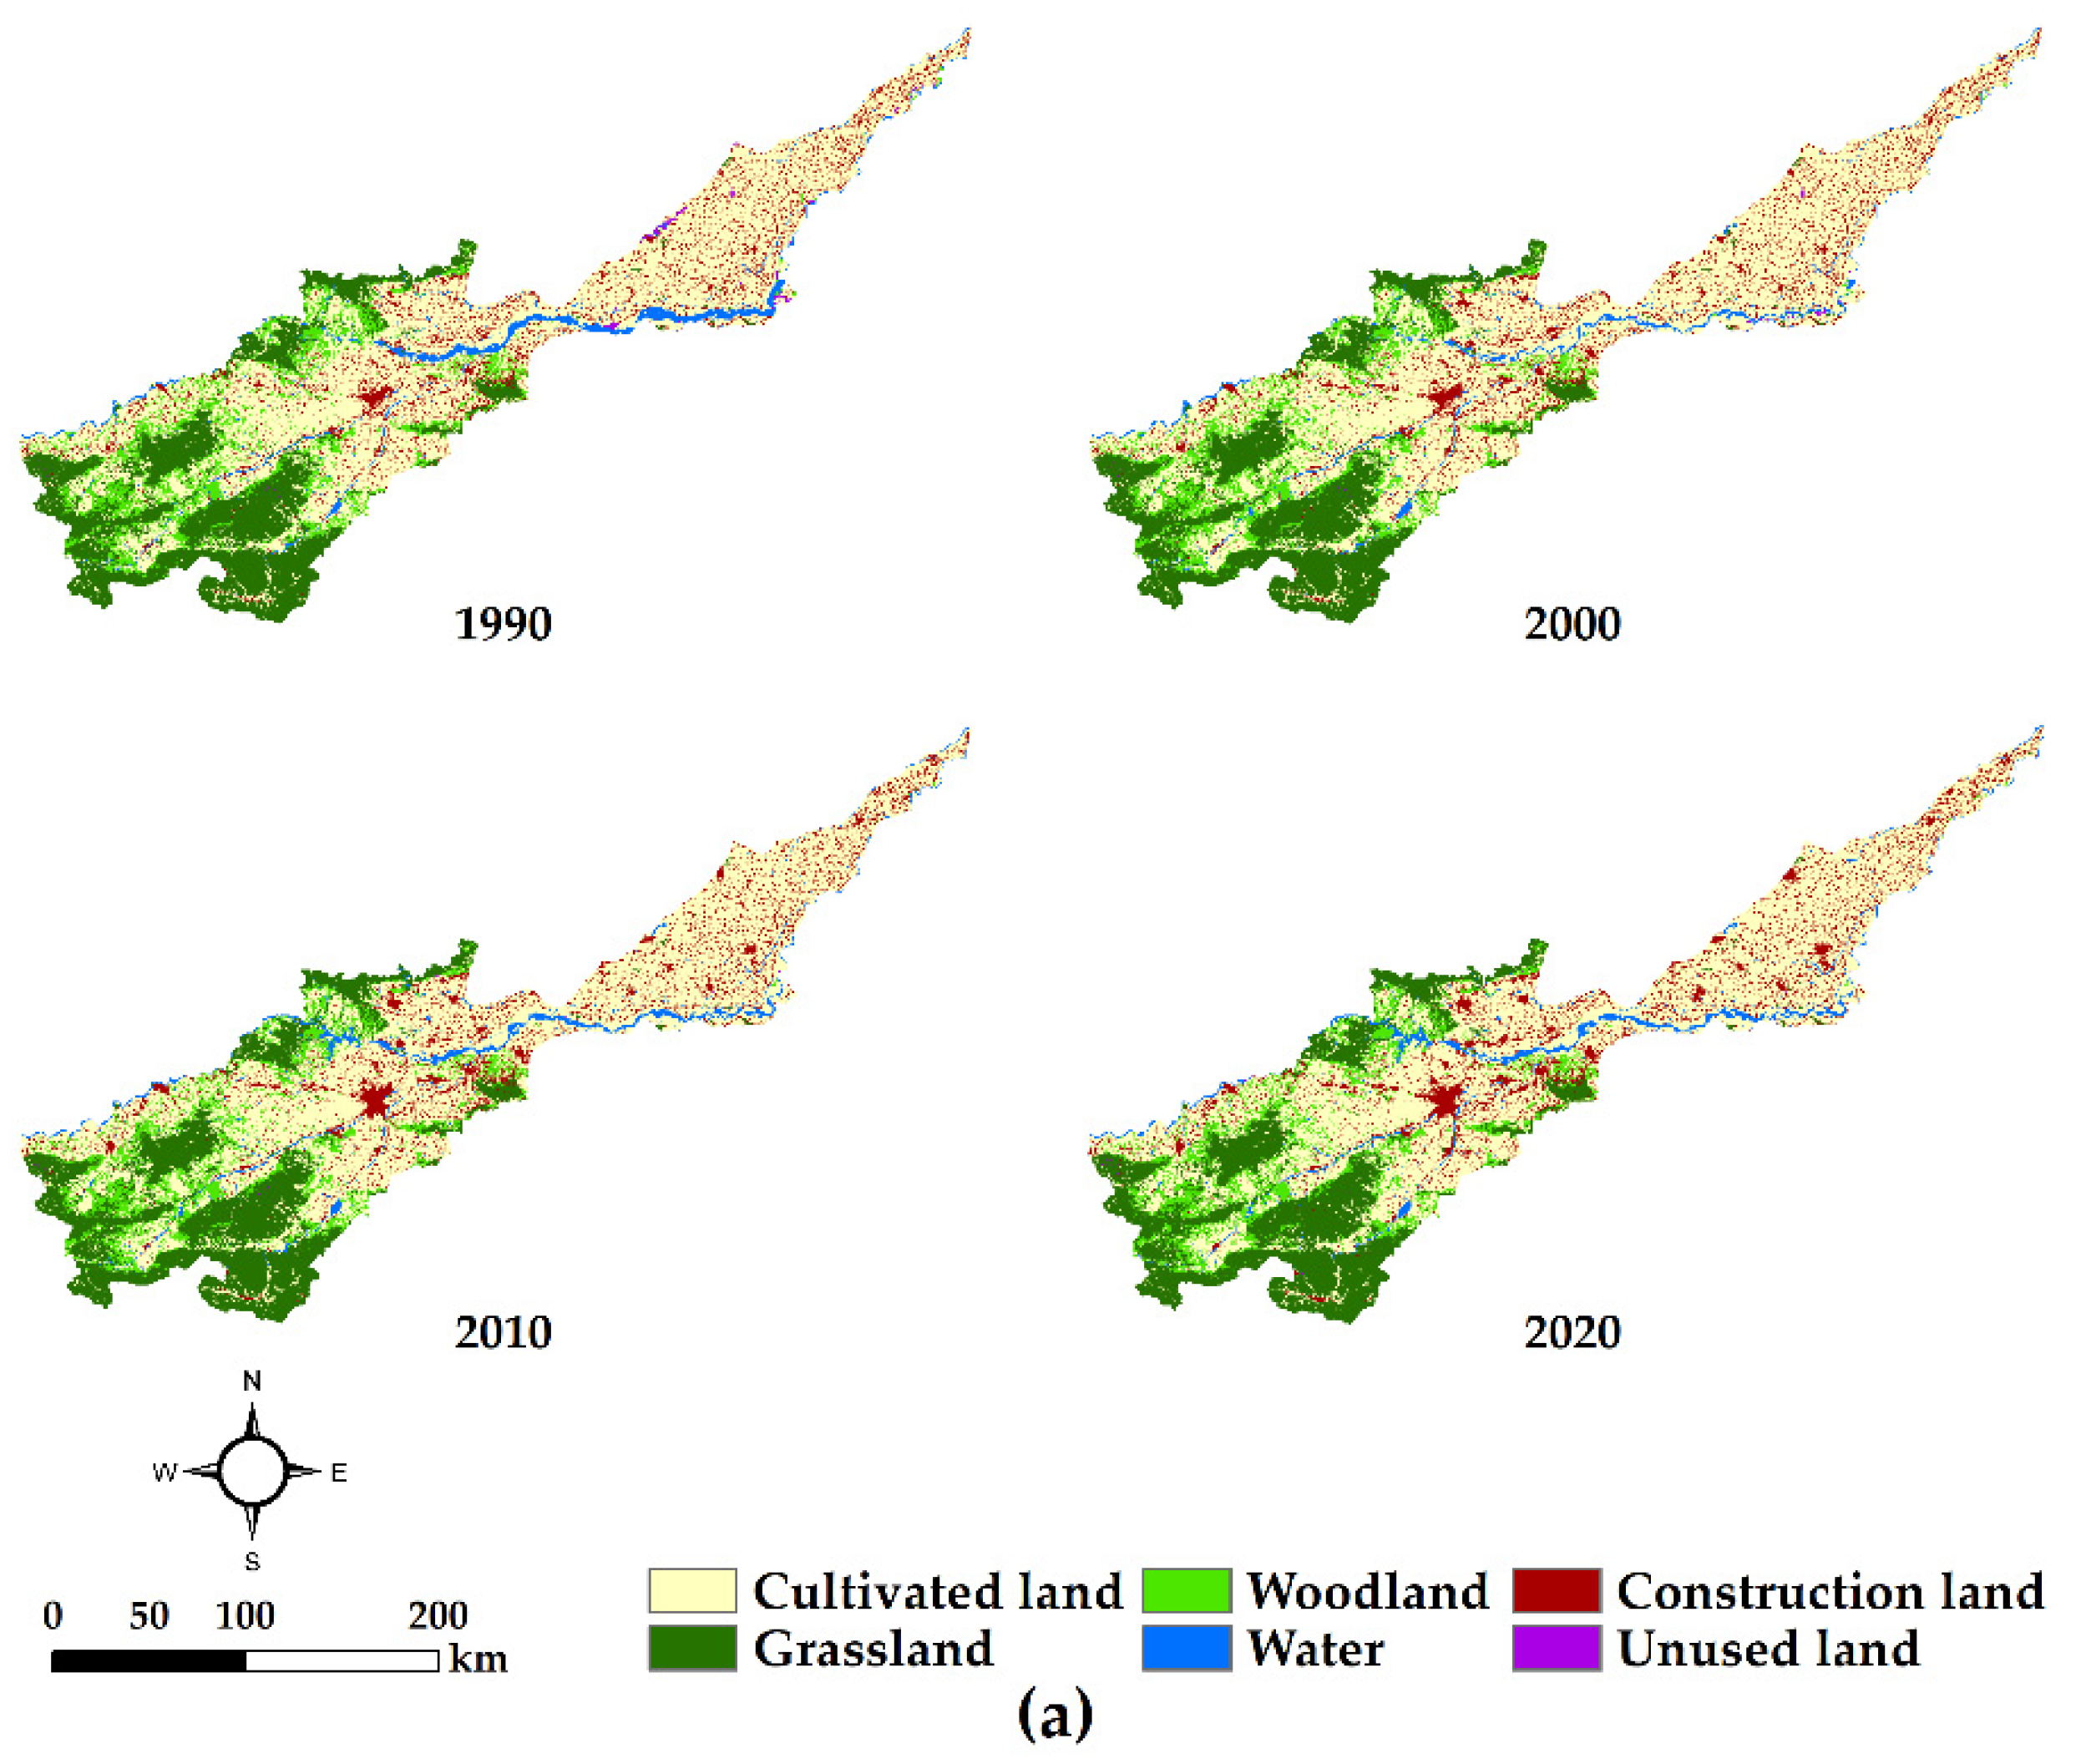
3.2. Temporal and Spatial Change of Land Use
3.3. Spatial-Temporal Change of Landscape Pattern
3.4. Analysis of Landscape Change Influencing Force
4. Discussion
5. Conclusions
- (1)
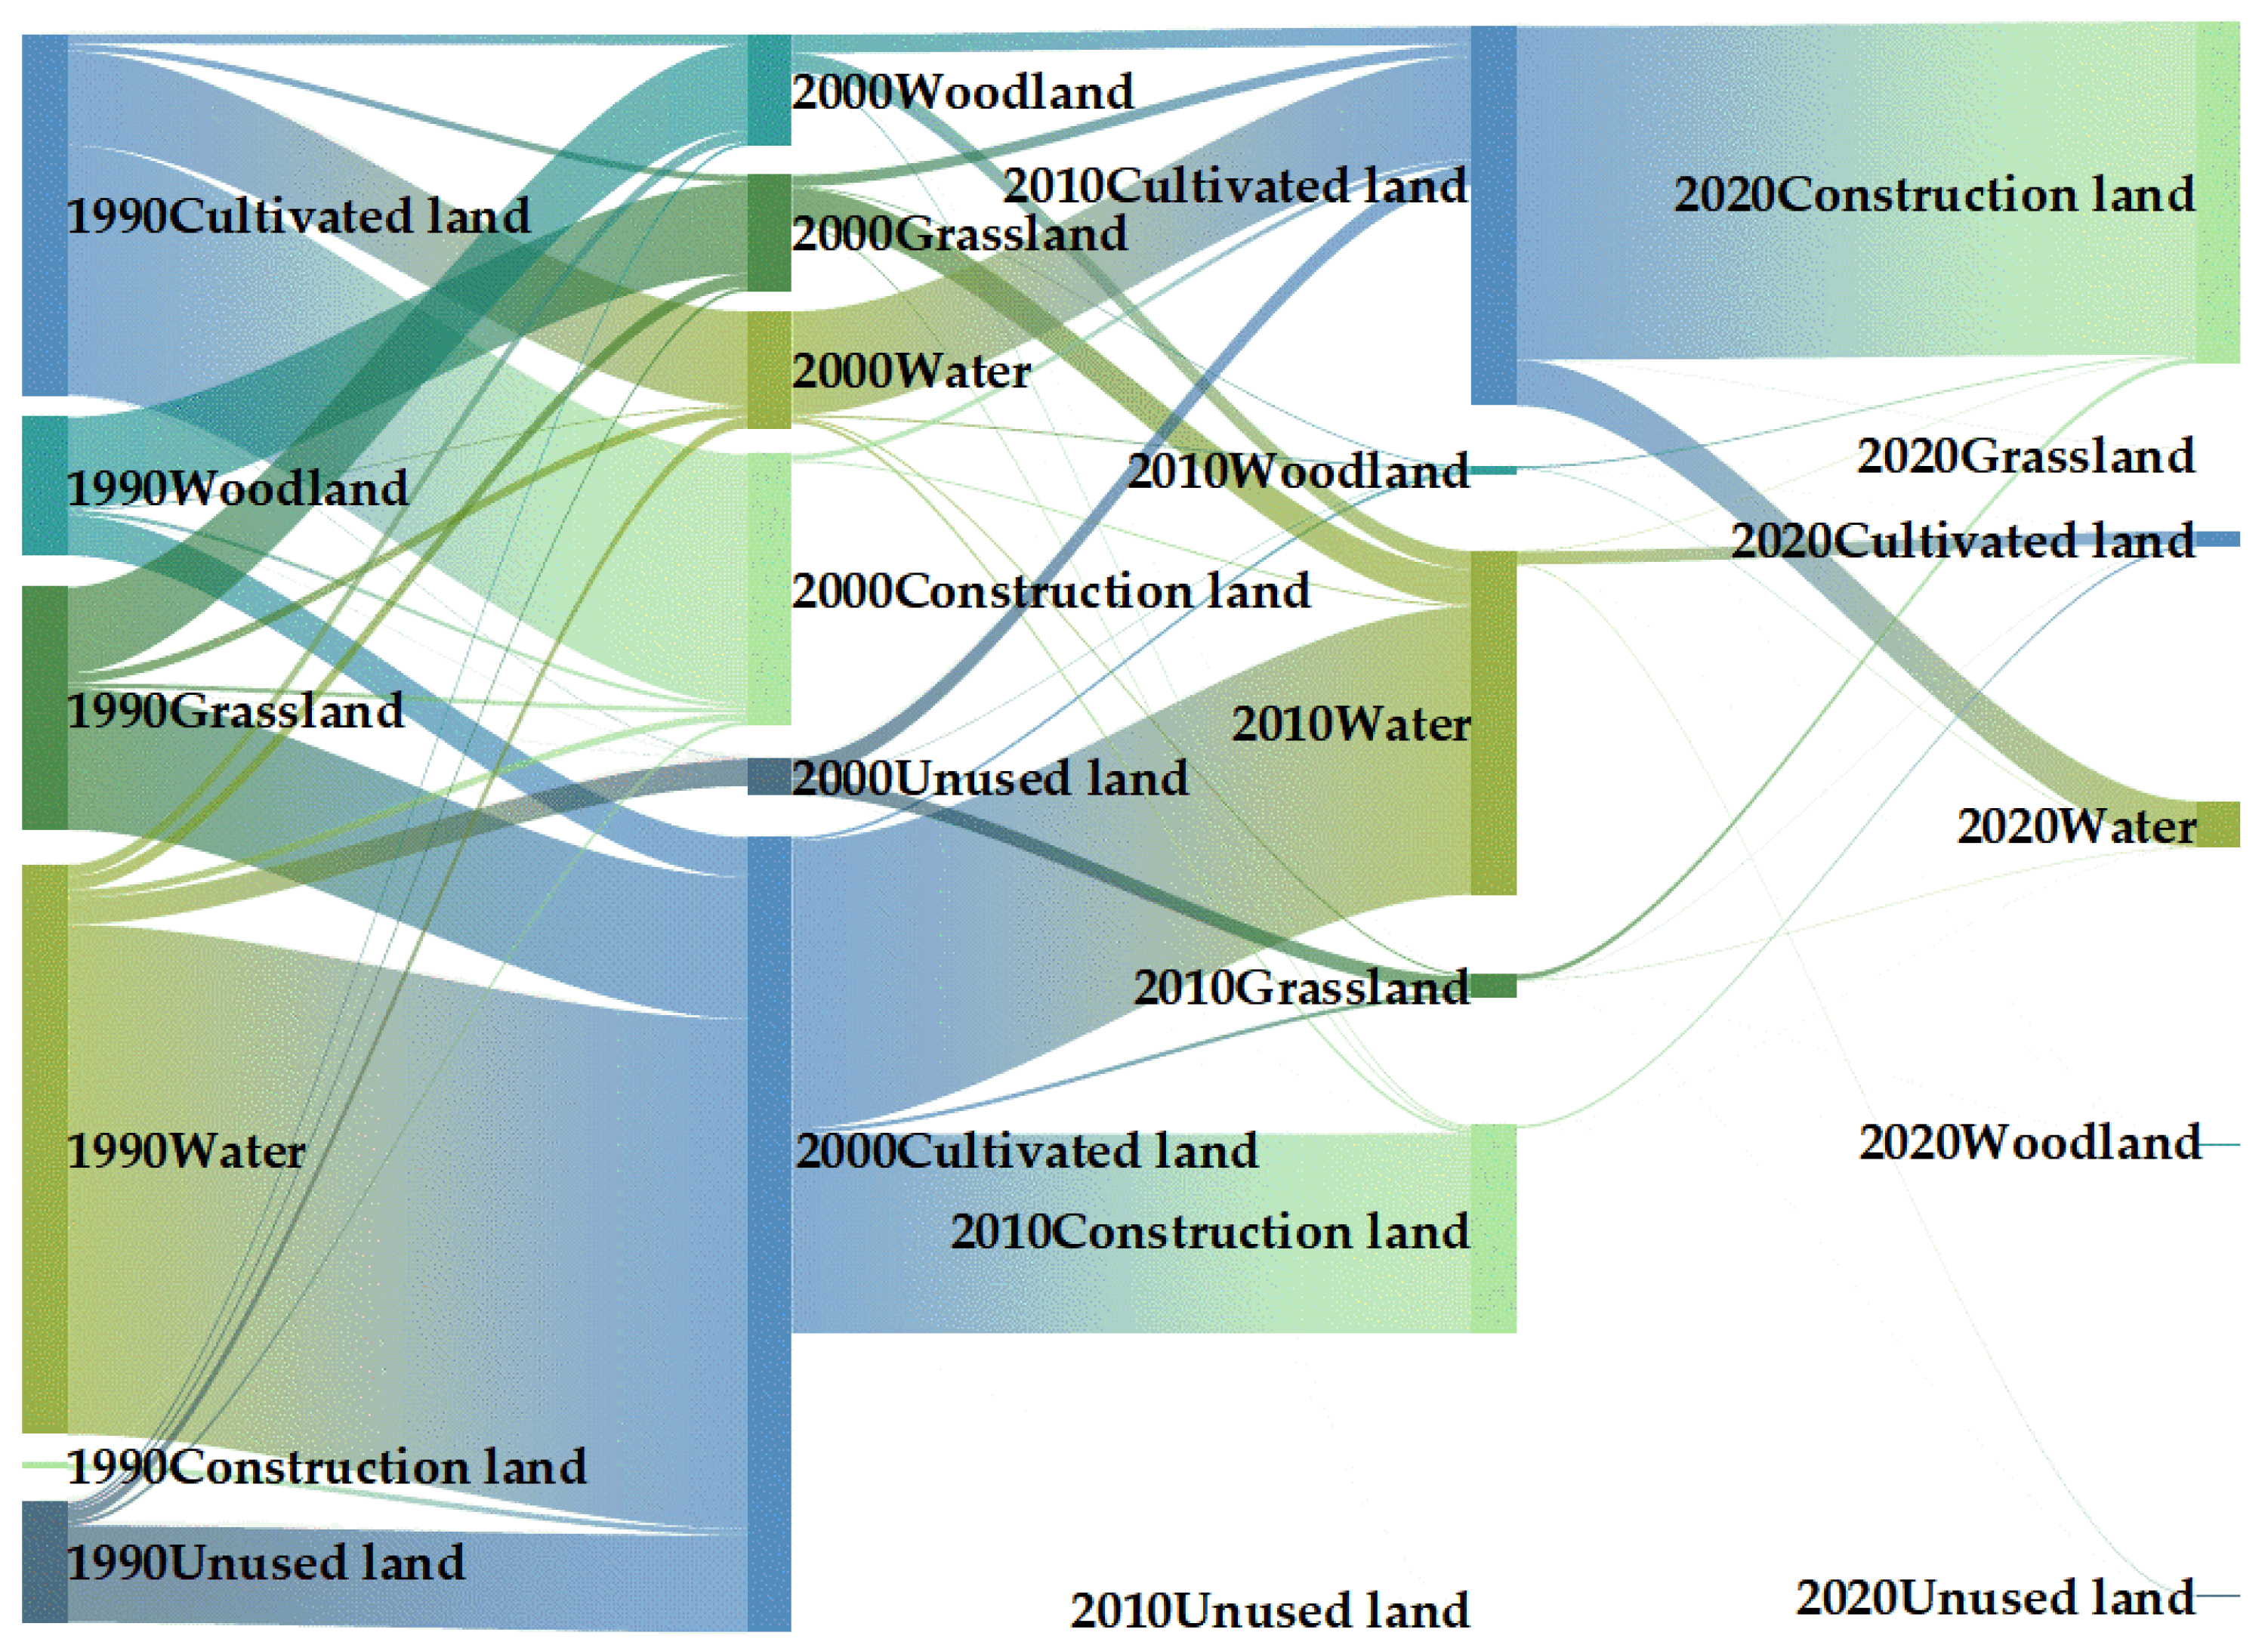
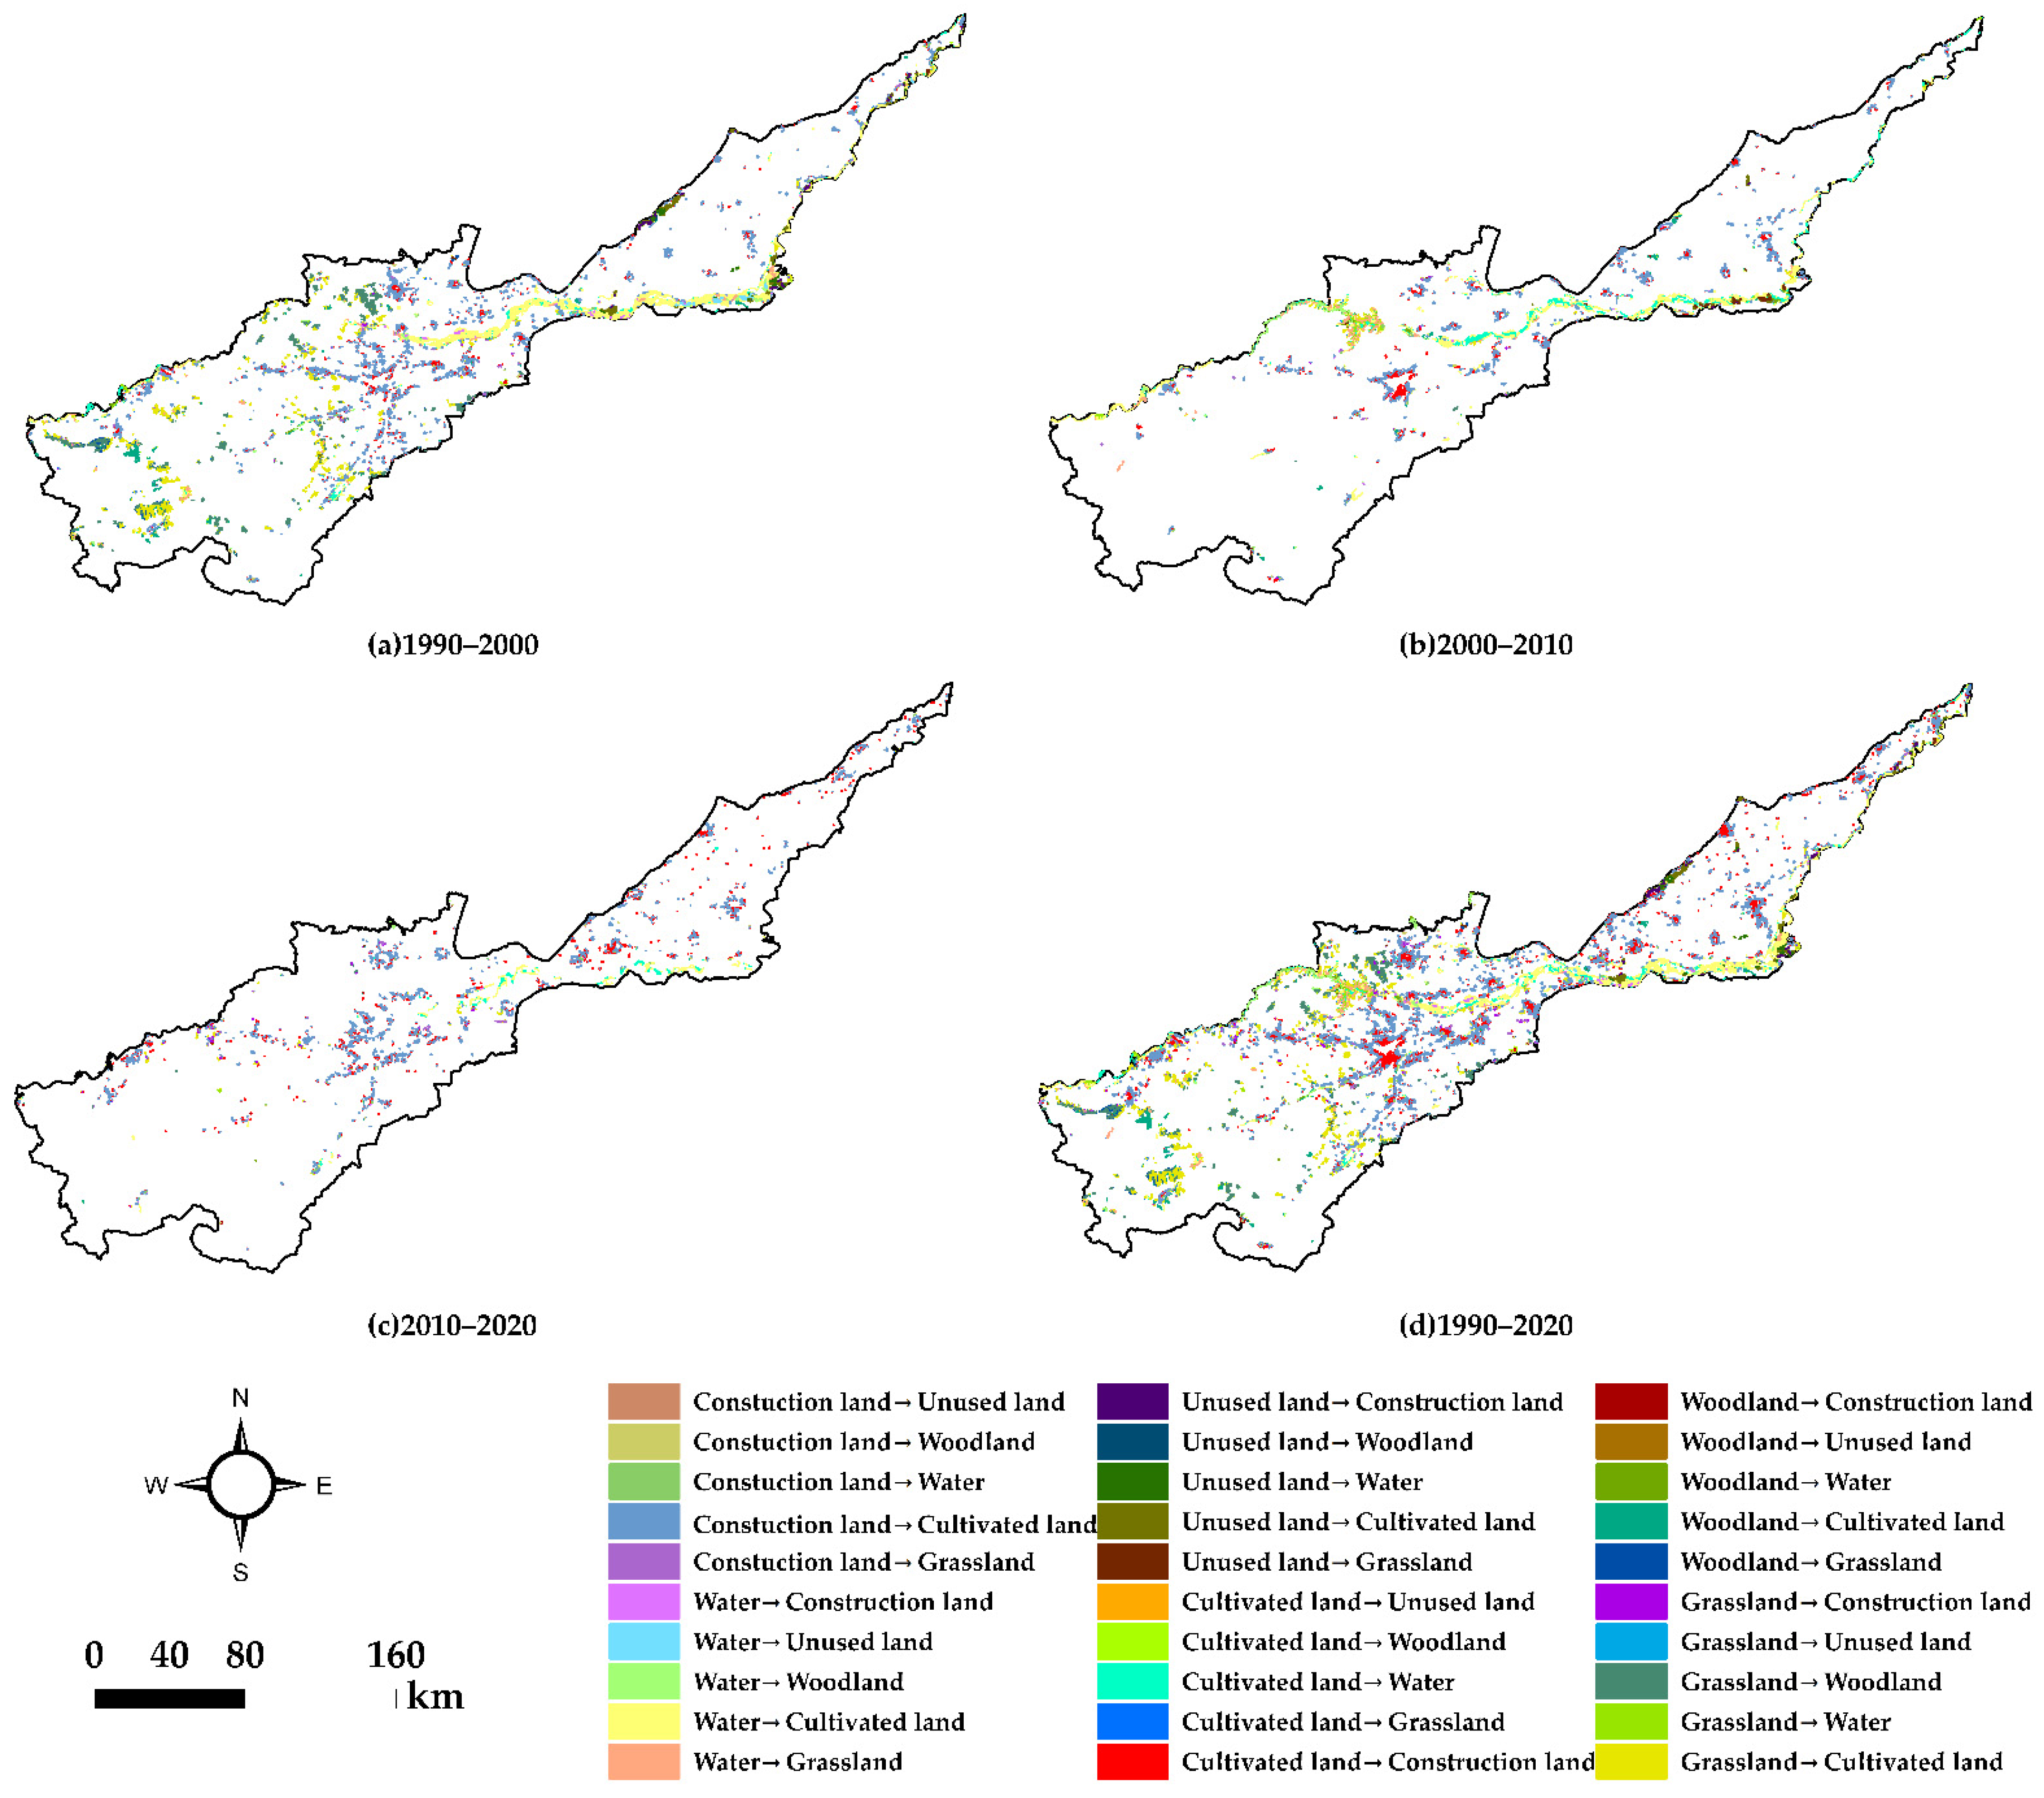
- The structure of land use in the Yellow River Basin (Henan section) was obviously clustered, and the main land use types were cultivated land, woodland, grassland, water area, construction land and unused land. From 1990 to 2020, the mutual transformation of land use types in the Yellow River Basin (Henan section) was frequent, and the transformation tracks were diversified. Among them, the outflow behavior is mainly manifested in the transformation from cultivated land to construction land, and the inflow behavior is mainly manifested in the transformation from grassland and water to cultivated land. The most obvious feature of land use change is the large-scale transition from cultivated land and woodland to construction land.
- (2)
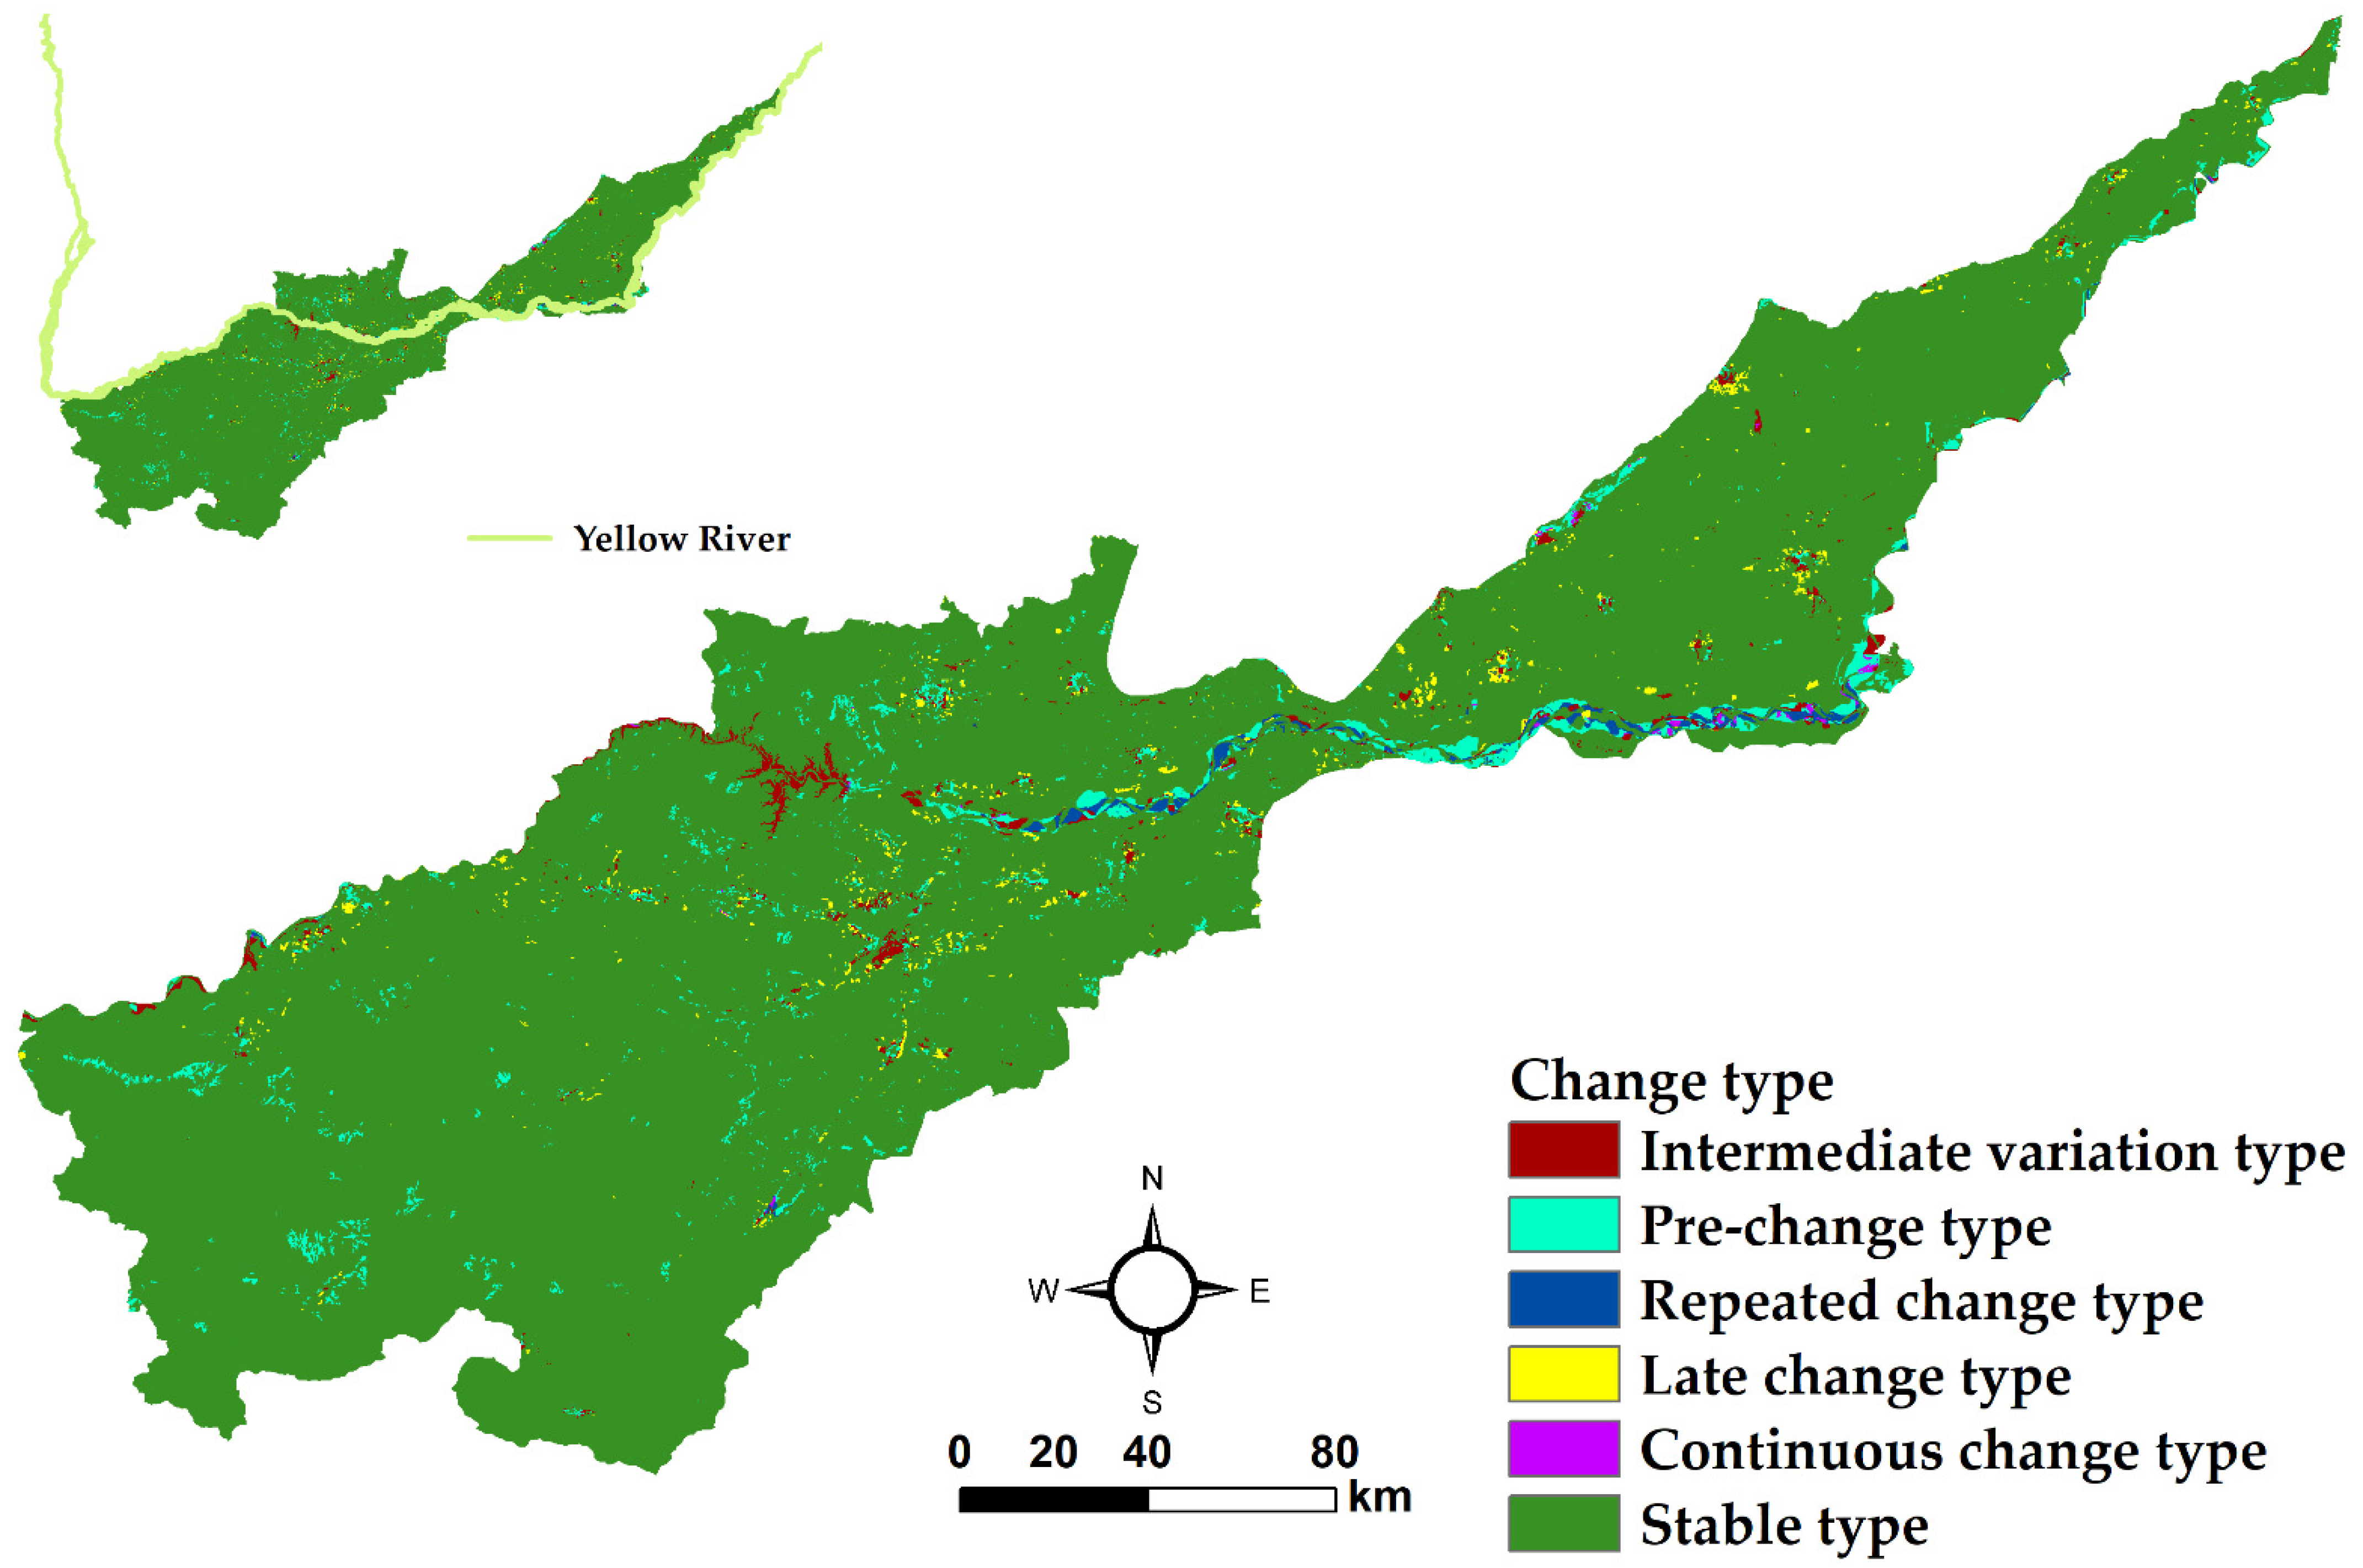
- In the information map of land use change in the Yellow River Basin (Henan section) from 1990 to 2020, stable structural change has the widest distribution range, accounting for 94.63% of the whole basin area. In the early stage, the changing area of the changing structure accounted for 2.74% of the whole basin area, and in the early stage, it was mainly the conversion of water area to cultivated land, cultivated land to construction land, and grassland to cultivated land. The Intermediate variation type were mainly “cultivated land-cultivated land-construction land-construction land” and “cultivated land-cultivated land-water area-water area”. In the later stage, the change type mostly manifested as the conversion from cultivated land to water area. Repeated changes were mainly manifested in the mutual transformation between cultivated land and waters, namely “waters-cultivated land-waters-waters” and “cultivated land-waters-cultivated land-cultivated land”. Although the continuous change type accounted for only 0.10% of the watershed area, the changes among various land use types were very drastic.
- (3)
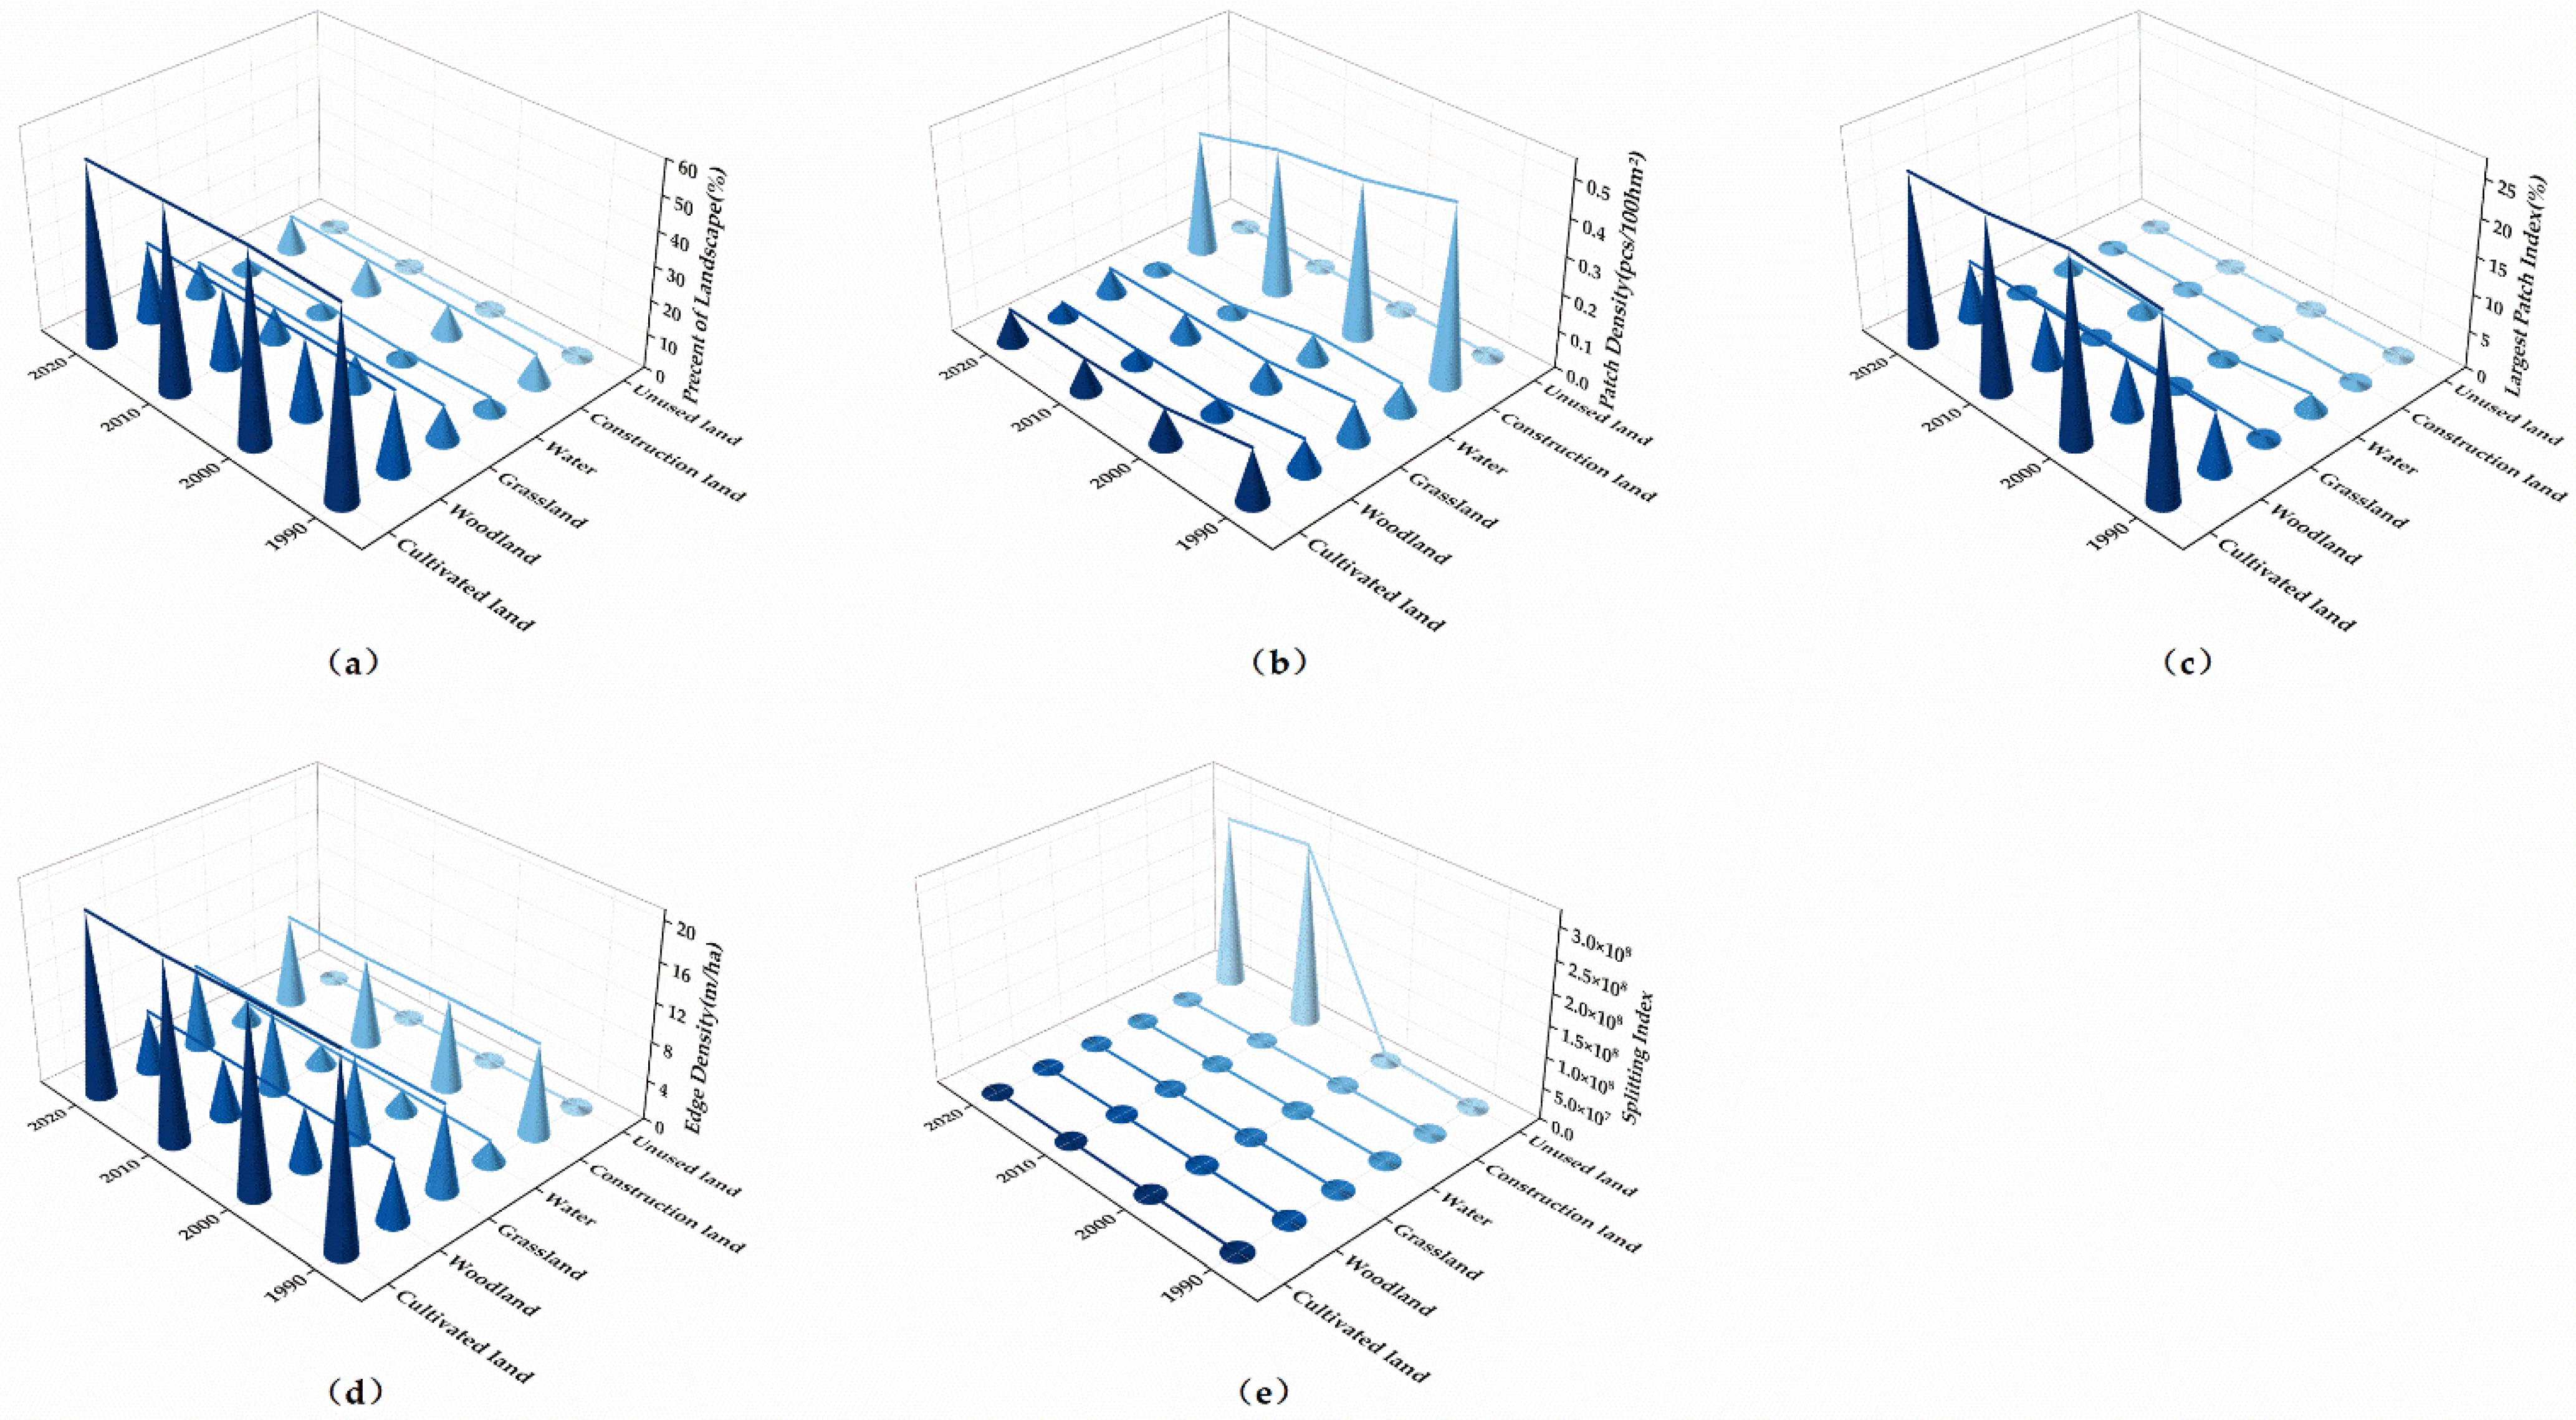
- After analyzing the landscape pattern evolution characteristics of the Yellow River Basin (Henan section) from the five landscape indexes at the landscape level, it can be concluded that the landscape fragmentation of the basin has been reduced, the landscape heterogeneity has been enhanced, and the landscape patch types have been constantly balanced in the last 30 years. According to the analysis of different landscape pattern indexes at the level of land use, the landscape dominance of cultivated land decreases, whereas that of construction land increases. The occupation of construction land was the main reason for the fragmentation and homogenization of cultivated land.
- (4)
- Through geographical exploration, we found many natural factors and socio-economic factors that might influence the landscape pattern evolution. Compared with the spatial differences of socio-economic factors such as GDP and population density, the spatial differences of natural factors such as slope, elevation, temperature and precipitation can better reflect the spatial heterogeneity of landscape pattern in the Yellow River Basin (Henan section), and the influence of any two driving factors on the spatial distribution characteristics of landscape pattern is greater than that of a single factor, indicating that the formation of spatial heterogeneity in the Yellow River Basin (Henan section) is the result of the interaction of various driving factors.
Author Contributions
Funding
Data Availability Statement
Acknowledgments
Conflicts of Interest
Appendix A
| DEM | SLOPE | GDP | POP | TMP | PRE | |
|---|---|---|---|---|---|---|
| PD | 0.320265 | 0.269227 | 0.030555 | 0.249925 | 0.297511 | 0.021016 |
| ED | 0.317664 | 0.298653 | 0.012679 | 0.185272 | 0.323857 | 0.049003 |
| PLAND | 0.057356 | 0.068945 | 0.003199 | 0.051945 | 0.056169 | 0.004931 |
| LPI | 0.057186 | 0.069836 | 0.003442 | 0.052241 | 0.055672 | 0.004846 |
| SPLIT | 0.043870 | 0.024579 | 0.018951 | 0.06542 | 0.034021 | 0.002010 |
| DEM | SLOPE | GDP | POP | TMP | PRE | |
|---|---|---|---|---|---|---|
| PD | 0.303486 | 0.248857 | 0.04203 | 0.21082 | 0.288939 | 0.036415 |
| ED | 0.321365 | 0.303087 | 0.008251 | 0.165651 | 0.323940 | 0.043316 |
| PLAND | 0.047560 | 0.064782 | 0.004896 | 0.038845 | 0.051109 | 0.001829 |
| LPI | 0.049030 | 0.064894 | 0.004991 | 0.037977 | 0.050909 | 0.001734 |
| SPLIT | 0.012620 | 0.007354 | 0.014943 | 0.014789 | 0.011247 | 0.007602 |
| DEM | SLOPE | GDP | POP | TMP | PRE | |
|---|---|---|---|---|---|---|
| DEM | 0.320265 | |||||
| SLOPE | 0.366379 | 0.269227 | ||||
| GDP | 0.326063 | 0.278900 | 0.030555 | |||
| POP | 0.352265 | 0.344493 | 0.259322 | 0.249925 | ||
| TMP | 0.339093 | 0.353331 | 0.302255 | 0.342300 | 0.297511 | |
| PRE | 0.347441 | 0.298648 | 0.048802 | 0.334315 | 0.339730 | 0.021016 |
| DEM | SLOPE | GDP | POP | TMP | PRE | |
|---|---|---|---|---|---|---|
| DEM | 0.317664 | |||||
| SLOPE | 0.387969 | 0.298653 | ||||
| GDP | 0.326882 | 0.302781 | 0.012679 | |||
| POP | 0.336864 | 0.334696 | 0.193830 | 0.185272 | ||
| TMP | 0.356540 | 0.395255 | 0.326194 | 0.339173 | 0.323857 | |
| PRE | 0.374806 | 0.361172 | 0.061956 | 0.333414 | 0.389954 | 0.049003 |
| DEM | SLOPE | GDP | POP | TMP | PRE | |
|---|---|---|---|---|---|---|
| DEM | 0.057356 | |||||
| SLOPE | 0.083462 | 0.068945 | ||||
| GDP | 0.067369 | 0.078631 | 0.003199 | |||
| POP | 0.079342 | 0.088952 | 0.057369 | 0.051945 | ||
| TMP | 0.062908 | 0.083681 | 0.062764 | 0.073216 | 0.056169 | |
| PRE | 0.066765 | 0.078011 | 0.019010 | 0.073906 | 0.069120 | 0.004931 |
| DEM | SLOPE | GDP | POP | TMP | PRE | |
|---|---|---|---|---|---|---|
| DEM | 0.057186 | |||||
| SLOPE | 0.081694 | 0.069836 | ||||
| GDP | 0.069208 | 0.075461 | 0.003442 | |||
| POP | 0.077554 | 0.089637 | 0.059201 | 0.052241 | ||
| TMP | 0.062402 | 0.081454 | 0.061516 | 0.071548 | 0.055672 | |
| PRE | 0.068275 | 0.077914 | 0.016770 | 0.071807 | 0.067510 | 0.004846 |
| DEM | SLOPE | GDP | POP | TMP | PRE | |
|---|---|---|---|---|---|---|
| DEM | 0.04387 | |||||
| SLOPE | 0.046222 | 0.024579 | ||||
| GDP | 0.056009 | 0.039179 | 0.018951 | |||
| POP | 0.073137 | 0.068457 | 0.068585 | 0.065420 | ||
| TMP | 0.044943 | 0.038447 | 0.046465 | 0.070756 | 0.034021 | |
| PRE | 0.048021 | 0.029017 | 0.022987 | 0.076758 | 0.039991 | 0.002010 |
| DEM | SLOPE | GDP | POP | TMP | PRE | |
|---|---|---|---|---|---|---|
| DEM | 0.303486 | |||||
| SLOPE | 0.347119 | 0.248857 | ||||
| GDP | 0.314081 | 0.265913 | 0.042030 | |||
| POP | 0.33608 | 0.310521 | 0.213333 | 0.210820 | ||
| TMP | 0.328339 | 0.339372 | 0.301340 | 0.327140 | 0.288939 | |
| PRE | 0.347989 | 0.303457 | 0.066416 | 0.324448 | 0.346093 | 0.036415 |
| DEM | SLOPE | GDP | POP | TMP | PRE | |
|---|---|---|---|---|---|---|
| DEM | 0.321365 | |||||
| SLOPE | 0.390951 | 0.303087 | ||||
| GDP | 0.331398 | 0.306532 | 0.008251 | |||
| POP | 0.331089 | 0.328772 | 0.175638 | 0.165651 | ||
| TMP | 0.358784 | 0.395712 | 0.328311 | 0.334229 | 0.323940 | |
| PRE | 0.384677 | 0.369056 | 0.052370 | 0.306907 | 0.396613 | 0.043316 |
| DEM | SLOPE | GDP | POP | TMP | PRE | |
|---|---|---|---|---|---|---|
| DEM | 0.047560 | |||||
| SLOPE | 0.075211 | 0.064782 | ||||
| GDP | 0.067396 | 0.078950 | 0.004896 | |||
| POP | 0.064758 | 0.079236 | 0.045332 | 0.038845 | ||
| TMP | 0.058121 | 0.07698 | 0.064861 | 0.061562 | 0.051109 | |
| PRE | 0.061357 | 0.072691 | 0.013734 | 0.058267 | 0.062946 | 0.001829 |
| DEM | SLOPE | GDP | POP | TMP | PRE | |
|---|---|---|---|---|---|---|
| DEM | 0.049030 | |||||
| SLOPE | 0.074544 | 0.064894 | ||||
| GDP | 0.067172 | 0.076780 | 0.004991 | |||
| POP | 0.063646 | 0.079321 | 0.047001 | 0.037977 | ||
| TMP | 0.055395 | 0.075560 | 0.064553 | 0.063485 | 0.050909 | |
| PRE | 0.064105 | 0.073934 | 0.013237 | 0.056173 | 0.063852 | 0.001734 |
| DEM | SLOPE | GDP | POP | TMP | PRE | |
|---|---|---|---|---|---|---|
| DEM | 0.317664 | |||||
| SLOPE | 0.387969 | 0.298653 | ||||
| GDP | 0.326882 | 0.302781 | 0.012679 | |||
| POP | 0.336864 | 0.334696 | 0.193830 | 0.185272 | ||
| TMP | 0.356540 | 0.395255 | 0.326194 | 0.339173 | 0.323857 | |
| PRE | 0.374806 | 0.361172 | 0.061956 | 0.333414 | 0.389954 | 0.049003 |
References
- Lambin, E.F.; Turner, B.L.; Geist, H.J.; Agbola, S.B.; Angelsen, A.; Bruce, J.W.; Coomes, O.T.; Dirzo, R.; Fischer, G.; Folke, C.; et al. The causes of land-use and land-cover change: Moving beyond the myths. Global. Environ. Chang. 2001, 11, 261–269. [Google Scholar] [CrossRef]
- Chen, W.; Li, J.; Zeng, J.; Ran, R.; Yang, B. Spatial heterogeneity and formation mechanism of eco-environmental effect of land use change in China. Geogra. Resaust. 2019, 38, 2173–2187. [Google Scholar] [CrossRef]
- Grainger, A. The Future Role of Tropical Rain Forests in the World Forest Economy. Ph.D. Thesis, University of Oxford, Oxford, UK, 1986. [Google Scholar]
- Long, H. Land Use Transition: A New Integrated Approach of Land Use/Cover Change Study. Geogr. Geo-Inf. Sci. 2003, 19, 87–90. [Google Scholar] [CrossRef]
- Li, X. Theoretical Hypotheses about Agricultural Land use Changes and the Relevant Propositions about Environmental Impacts. Adv. Earth. Sci. 2008, 11, 1124–1129. [Google Scholar] [CrossRef]
- Hosonuma, N.; Herold, M.; De Sy, V.; De Fries, R.S.; Brockhaus, M.; Verchot, L.; Angelsen, A.; Romijn, E. An assessment of deforestation and forest degradation drivers in developing countries. Environ. Res. Lett. 2012, 7, 044009. [Google Scholar] [CrossRef]
- Chen, L.; Zhou, S.; Zhou, B.; Lu, L.; Chang, T. Characteristics and Driving Forces of Regional Land Use Transition Based on the Leading Function Classification: A Case Study of Jiangsu Province. Econ. Geogr. 2015, 35, 155–162. [Google Scholar] [CrossRef]
- Guo, L.; Li, D.; Gang, L.; Luo, Q.; Gao, M. GIS-based detection of land use transformation in the Loess Plateau: A case study in Baota District, Shaanxi Province, China. J. Geogr. Sci. 2015, 25, 12. [Google Scholar] [CrossRef] [Green Version]
- Luo, H.; Hu, S.; Wu, S. Research Trends and Development Trends of Land Use Transformation in China. Nat. Resour. Econ. China 2019, 32, 65–74. [Google Scholar] [CrossRef]
- Song, X. Discussion on land use transition research framework. Acta. Geogr. Sin. 2017, 72, 471–487. [Google Scholar] [CrossRef]
- Liu, Y.; Long, H. Land use transitions and their dynamic mechanism in the Huang-Huai-Hai Plain. Acta. Geogr. Sin. 2017, 72, 471–487. [Google Scholar] [CrossRef]
- Ashraf, J.; Pandey, R.; Jong, W.D. Assessment of bio-physical, social and economic drivers for forest transition in Asia-Pacific region. Forest. Policy. Econ. 2017, 76, 35–44. [Google Scholar] [CrossRef]
- Wang, J.; Zhao, C.; Han, M. Evalution of coordinated development betweeen Urban-Rural construction land transition and rural transformation and diagnosis of obstacle factors. Chin. J. Agric. Resour. Reg. Plan. 2022, 43, 140–152. [Google Scholar] [CrossRef]
- Liao, L.; Long, H.; Gao, X.; Ma, E. Effects of land use transitions and rural aging on agricultural production in China’s farming area: A perspective from changing labor employing quantity in the planting industry. Land Use Policy 2019, 88, 104152. [Google Scholar] [CrossRef]
- Lu, X.; Tang, Y.; Yi, J.; Jiang, X. Study on the Impact of Cultivated Land Use Transition on Agricultural Economic Growth based on Spatial Econometric Model. China Land Sci. 2019, 33, 53–61. [Google Scholar] [CrossRef]
- Dong, J.; Zhang, Z.; Da, X.; Zhang, W.; Feng, X. Eco-environmental effects of land use transformation and its driving forces from the perspective of “production-living-ecological” spaces: A case study of Gansu Province. Acta. Ecol. Sin. 2021, 41, 5919–5928. [Google Scholar] [CrossRef]
- Liu, Y.; Long, H.; Ting, T.; Shuang, S. Land use transitions and their effects on water environment in Huang-Huai-Hai Plain, China. Land Use Policy 2015, 47, 293–301. [Google Scholar] [CrossRef]
- Shi, Y.; Lu, X.; Guo, G.; Gong, C. Temporal-Spatial Pattern and Driving Mechanism of Cultivated Land Use Transition Based on GIS and Spatial Econometric Model. China Land Sci. 2019, 33, 51–60. [Google Scholar] [CrossRef]
- Long, H.; Li, X. Rual Housing Land Transition in Transect of the Yangtse River. Acta. Geogr. Sin. 2005, 2, 179–188. [Google Scholar] [CrossRef]
- Xu, F.; Lu, X.; Chen, C. Spatial-temporal Pattern of Urban-rural Construction Land Transition in Shandong Province. J. Nat. Resour. 2017, 32, 1554–1567. [Google Scholar] [CrossRef]
- Almeida, C.M.; Monteiro, A.; Camara, G. Modeling the Urban Evolution of Land Use Transitions Using Cellular Automata and Logistic Regression. In Proceedings of the 2003 IEEE International Geoscience and Remote Sensing Symposium, Toulouse, France, 21–25 July 2003; pp. 1564–1566. [Google Scholar]
- Xu, X.; Wang, X.; Zhu, X.; Jia, H.; Han, D. Landscape Pattern Changes in Alpine Wetland of Bayanbulak Swan Lake during 1996-2015. J. Nat. Resour. 2018, 33, 1897–1911. [Google Scholar]
- Sarker, S.; Veremyev, A.; Boginski, V.; Singh, A. Critical Nodes in River Networks. Sci Rep. 2019, 9, 11178. [Google Scholar] [CrossRef]
- Gao, Y.; Sarker, S.; Sarker, T.; Leta, O.T. Analyzing the critical locations in response of constructed and planned dams on the Mekong River Basin for environmental integrity. Environ. Res. Commun. 2022, 4, 101001. [Google Scholar] [CrossRef]
- Chen, L.; Liu, Y.; Lu, Y.; Feng, X.; Fu, B. Landscape pattern analysis in landscape ecology: Current, challenges and future. Acta. Ecol. Sin. 2008, 28, 5521–5531. [Google Scholar] [CrossRef]
- Zhang, Q.; Fu, B.; Chen, L. Several Problems about Landscape Pattern Change Research. Sci. Geogr. Sin. 2003, 7, 264–270. [Google Scholar] [CrossRef]
- Buyantuyev, A.; Wu, J.; Gries, C. Multiscale analysis of the urbanization pattern of the Phoenix metropolitan landscape of USA: Time, space and thematic resolution. Landsc. Urban. Plan. 2015, 94, 206–217. [Google Scholar] [CrossRef]
- Wu, H.; Zeng, G.; Liang, J.; Chen, J.; Xu, J.; Dai, J.; Sang, L.; Li, X.; Ye, S. Responses of landscape pattern of China’s two largest freshwater lakes to early dry season after the impoundment of Three-Gorges Dam. Int. J. Appl. Earth Obs. Geoinf. 2017, 56, 36–43. [Google Scholar] [CrossRef]
- Li, D. The Influence of Channel and Coastline Evolution on Landscape Pattern in Yellow River Delta Based on Geo-information Map. Master’s Thesis, Lu Dong University, Yantai, China, 2018. [Google Scholar]
- Li, H.; Zhang, J.; Guo, J. Spatio-temporal evolution pattern of wetland landscape in the Yellow River Basin. Bull. Surv. Mapp. 2021, 6, 28–33. [Google Scholar] [CrossRef]
- Dadashpoor, H.; Azizi, P.; Moghadasi, M. Land use change, urbanization, and change in landscape pattern in a metropolitan area. Sci. Total. Environ. 2019, 655, 707–719. [Google Scholar] [CrossRef]
- Zhu, Z.; Liu, B.; Wang, H.; Hu, M. Analysis of the Spatiotemporal Changes in Watershed Landscape Pattern and Its Influencing Factors in Rapidly Urbanizing Areas Using Satellite Data. Remote Sens. 2021, 13, 1168. [Google Scholar] [CrossRef]
- Wei, Y.; Chen, W.J. RS and GIS based Analysis of Landscape Pattern due to Land-use Change. Shaanxi For. Sci. Technol. 2018, 46, 5–8. [Google Scholar] [CrossRef]
- Cabral, A.I.; Costa, F.L. Land cover changes and landscape pattern dynamics in Senegal and Guinea Bissau borderland. Appl. Geogr. 2017, 82, 115–128. [Google Scholar] [CrossRef]
- Yang, Y.; Tang, X.; Li, Z.; Jia, Y. Spatial-temporal Evolution of Landscape Pattern of Land Use in the Yangtze River Basin and Analysis of Its Driving Factors: A Case Study from2008 to 2018. J. Northwest For. Univ. 2021, 36, 220–230. [Google Scholar] [CrossRef]
- Xu, Q.; Wang, J.; Shi, W. Influence of Landscape Pattern Changes in Large-scale Open-pit Coal Mining Area on Soil Erosion: A Case Study on Pingshuo Mining Area in Shanxi Province. China Land Sci. 2022, 36, 96–106. [Google Scholar] [CrossRef]
- Eker, M.; Coban, H.O. Impact of road network on the structure of a multifunctional forest landscape unit in southern Turkey. J. Environ. Biol. 2010, 31, 157. [Google Scholar]
- Yu, H.; Zhang, F.; Kung, H.T.; Johnson, V.C.; Bane, C.S.; Wang, J.; Ren, Y.; Zhang, Y. Analysis of land cover and landscape change patterns in Ebinur Lake Wetland National Nature Reserve, China from 1972 to 2013. Wetl. Ecol. Manag. 2017, 25, 619–637. [Google Scholar] [CrossRef]
- Wang, L.; Yuan, Y.; Dong, H.; Huang, X.; Huang, P.; Zhang, C. Research on spatial scale effect of landscape pattern of land use in Wuhan City. World Reg. Stud. 2020, 29, 96–103. [Google Scholar]
- Lu, Q.; Zhao, C.; Wang, J.; Yang, X. Research on the Temporal and Spatial Evolution of Landscape Pattern Vulnerability in Guizhou Karst Mountains in the Past 30 Years. Resour. Environ. Yangtze Basin 2022, 31, 634–646. [Google Scholar] [CrossRef]
- Ruberti, D.; Vigliotti, M. Land use and landscape pattern changes driven by land reclamation in a coastal area: The case of Volturno delta plain, Campania Region, southern Italy. Environ. Earth. Sci. 2017, 76, 694. [Google Scholar] [CrossRef]
- Ludwig, J.A.; Bastin, G.N.; Chewings, V.H.; Eager, R.W.; Liedloff, A.C. Leakiness: A new index for monitoring the health of arid and semiarid landscapes using remotely sensed vegetation cover and elevation data. Ecol. Indic. 2007, 7, 442–454. [Google Scholar] [CrossRef]
- Hu, C.; Guo, X.; Lian, G.; Zhang, Z. Effects of land use change on ecosystem service value in rapid urbanization areas in Yangtze River Delta: A case study of Jiaxing City. Resour. Environ. Yangtze Basin 2017, 26, 333–340. [Google Scholar] [CrossRef]
- Zhang, Y.; Zhang, J.; Gong, J. Landscape pattern vulnerability and its influencing factors on a semi-arid lake basin: A case study of LiangCheng County. Arid. Zone. Res. 2022, 39, 1259–1269. [Google Scholar] [CrossRef]
- Zheng, D.; Jia, C.; Yuan, H. Spatial and temporal evolution of landscape pattern in downtown area of Jixi City, China. Eur. J. Remote. Sens. 2020, 53, 104–113. [Google Scholar] [CrossRef] [Green Version]
- Wang, X.; Pan, P.; Wang, X.; Wang, X. Simulation of landscape pattern for land use in Hebei province based on GeoSOS—FLUS model. Jiangsu J. Agric. Sci. 2021, 37, 667–675. [Google Scholar] [CrossRef]
- Jiao, N.; Zheng, X.; Yin, J. Coupling Coordinative Analysis and Influencing Factors of Tourism Economy and Ecological Environment in the Yellow River Basin. Resour. Dev. Mark. 2020, 36, 591–598. [Google Scholar] [CrossRef]
- Zhang, M.; Rong, G.; Han, A.; Riao, D.; Liu, X.; Zhang, J.; Tong, Z. Spatial-Temporal Change of Land Use and Its Impact on Water Quality of East-Liao River Basin from 2000 to 2020. Water 2021, 13, 1955. [Google Scholar] [CrossRef]
- Wang, Y.; Liu, X.; Li, J.; Wang, Y.; Bai, J.; Zhou, Z. Quantifying the spatial flow of soil conservation service to optimize land-use pattern under ecological protection scenarios. Front. Earth Sci. 2022, 10, 957520. [Google Scholar] [CrossRef]
- Peng, L.; Zhang, L.; Li, X.; Wang, Z.; Wang, H.; Jiao, L. Spatial expansion effects on urban ecosystem services supply-demand mismatching in Guanzhong Plain Urban Agglomeration of China. J. Geogr. Sci. 2022, 32, 806–828. [Google Scholar] [CrossRef]
- Liu, R.; Zhu, D. Methods for Detecting Land Use Changes Based on the Land Use Transition Matrix. Resour. Sci. 2010, 32, 1544–1550. [Google Scholar]
- Li, S.; Shen, Z.; Liu, K.; Xu, Z.; Wang, H.; Jiao, S.; Liu, X.; Lei, Y. Analysis of terrain gradient effects of land use change in Daqing River Basin. Trans. Chin. Soc. Agric. Eng. 2021, 37, 275–284. [Google Scholar] [CrossRef]
- Ding, Z.; Hua, H.; Wang, P.; Li, Y. Land use change geo-spectrum and its topographic gradient effect in the core areas of Hani Terraces, a World Heritage Site. Trans. Chin. Soc. Agric. Eng. 2021, 37, 225–234. [Google Scholar] [CrossRef]
- Wang, R. Connotation and Characteristics of Landscape Scale, Process and Pattern (LSPP) Research. Trop. Geogr. 2018, 38, 458–464. [Google Scholar] [CrossRef]
- Wu, J. Landscape Ecology—Concept and Theories. Chin. J. Ecol. 2000, 11, 42–52. [Google Scholar] [CrossRef]
- Su, C.; Fu, B.; Lu, Y.; Nan, L.; Yuan, Z.; He, A.; Lamparski, H. Land use change and anthropogenic driving forces: A case study in YanHe River Basin. Chin. Geogr. Sci. 2011, 21, 13. [Google Scholar] [CrossRef]
- Wang, L.J.; Wu, L.; Hou, X.Y.; Zheng, B.H.; Li, H.; Norra, S. Role of reservoir construction in regional land use change in Pengxi River basin upstream of the Three Gorges Reservoir in China. Environ. Earth. Sci. 2016, 75, 1–15. [Google Scholar] [CrossRef]
- Shi, Y.; Yamaguchi, Y. Quantifying the spatial differences of landscape change in the Hai River Basin, China, in the 1990s. Int. J. Remote. Sens. 2012, 33, 4482–4501. [Google Scholar] [CrossRef]
- Liu, X.; Li, Y.; Shen, J.; Fu, X. Landscape pattern changes at a catchment scale: A case study in the upper Jinjing River catchment in subtropical central China from 1933 to 2005. Landsc. Ecol. Eng. 2014, 10, 263–276. [Google Scholar] [CrossRef]
- Ju, H.; Zhang, Z.; Zuo, L.; Wang, J.; Zhang, S.; Wang, X.; Zhao, X. Driving forces and their interactions of built-up land expansion based on the geographical detector—A case study of Beijing, China. Int. J. Geogr. Inf. Sci. 2016, 30, 2188–2207. [Google Scholar] [CrossRef]
- Wang, J.; Li, X.; Christakos, G.; Liao, Y.; Zhang, T.; Gu, X.; Zheng, X. Geographical Detectors-Based Health Risk Assessment and its Application in the Neural Tube Defects Study of the Heshun Region, China. Int. J. Geogr. Inf. Sci. 2010, 24, 107–127. [Google Scholar] [CrossRef]
- Ováková, K.K.; Semerádová, S.; Mudrochová, M.; Skalo, J. Landscape functions and their change—A review on methodological approaches. Ecol. Eng. 2015, 75, 378–383. [Google Scholar] [CrossRef]
- Xin, L.; Ling, L.; Cheng, G.; Xiao, H. Quantifying landscape structure of the Heihe River Basin, north-west China using FRAGSTATS. J. Arid. Environ. 2001, 48, 521–535. [Google Scholar] [CrossRef]
- Tang, J.; Li, Y.; Cui, S.; Xu, L.; Ding, S. Linking land-use change, landscape patterns, and ecosystem services in a coastal watershed of southeastern China. Glob. Ecol. Conserv. 2020, 23, e1177. [Google Scholar] [CrossRef]
- Hamere, Y.; Teshome, S.; Mekuria, A.; Ashraf, D. Impact of landscape pattern changes on hydrological ecosystem services in the Beressa watershed of the Blue Nile Basin in Ethiopia. Sci. Total Environ. 2021, 793, 145790. [Google Scholar] [CrossRef]
- Gong, Y.; Li, J.; Li, Y. Spatiotemporal characteristics and driving mechanisms of arable land in the Beijing-Tianjin-Hebei region during 1990-2015. Socio-Econ. Plan. Sci. 2019, 70, 100720. [Google Scholar] [CrossRef]
- Wang, S.Y.; Liu, J.S.; Ma, T.B. Dynamics and changes in spatial patterns of land use in Yellow River Basin, China. Land Use Policy 2010, 27, 313–323. [Google Scholar] [CrossRef]
- Su, S.; Wang, Y.; Luo, F.; Mai, G.; Jian, P. Peri-urban vegetated landscape pattern changes in relation to socioeconomic development. Ecol. Indic. 2014, 46, 477–486. [Google Scholar] [CrossRef]
- Gong, C.; Yu, S.; Joesting, H.; Chen, J. Determining socioeconomic drivers of urban forest fragmentation with historical remote sensing images. Landsc. Urban. Plan. 2013, 117, 57–65. [Google Scholar] [CrossRef]


| Data | Type | Source | Website Link |
|---|---|---|---|
| Land use type | Grid | Resource and Environment Science and Data Center | https://www.resdc.cn/ (accessed on 9 September 2021) |
| Social economy, population density | Grid | Resource and Environment Science and Data Center | https://www.resdc.cn/ (accessed on 9 September 2021) |
| DEM | Grid | Geospatial Data Cloud | https://www.gscloud.cn/ (accessed on 9 September 2021) |
| Precipitation, temperature, etc. | Num | National Meteorological Science Data Center | http://data.cma.cn/ (accessed on 9 September 2021) |
| Land Use Types | Description |
|---|---|
| Cultivated land | Paddy fields and dry land |
| Woodland | Natural and semi-natural manmade woodland, including closed forest land, shrub, open woodland, nursery, garden and other woodlands |
| Grassland | Natural and artificial grassland |
| Water | Rivers, creeks, canals, ponds, lakes, reservoirs, and bays |
| Construction land | Mainly urban and rural settlements, mining land, transportation land, and other special construction land |
| Unused land | Mainly land without vegetation cover and difficult to use, including bare soil, sandy land, desert, saline, and landfills |
| Type | Description |
|---|---|
| Stable type | The land use pattern has not changed from 1990 to 2020. |
| Pre-change type | Only from 1990 to 2000 has the land use pattern changed. |
| Late change type | Only from 2010 to 2020 has the land use pattern changed. |
| Intermediate variation type | The land use pattern changed only once from 2000 to 2010. |
| Repeated change type | There were more than two changes from 1990 to 2020, and the land use patterns in 1990 and 2020 were the same. |
| Continuous change type | There were more than two changes from 1990 to 2020, and the land use patterns in 2005 and 2020 were different. |
| Scale Level | Index Selection | Equation | Ecological Significance |
|---|---|---|---|
| Patch type | Patch density (PD) | The larger the number of patches per unit area, the higher the fragmentation degree. | |
| Edge density (ED) | Indicates the complexity of the boundary shape | ||
| Percentage of Landscape (PLAND) | Reflects the dominant types of landscape | ||
| Largest Patch Index (LPI) | The change of this value can reflect the influence of human activities on land use types, determine the dominant landscape types, and reflect the degree of landscape disturbance. | ||
| Splitting Index (SPLIT) | Directly indicates the overall fragmentation degree of the landscape. The higher the value, the greater the impact of human activities on the landscape. | ||
| Landscape | Number of Patches (NP) | Reflects the spatial pattern of the landscape and describes its heterogeneity and fragmentation. | |
| Landscape Shape Index (LSI) | Reflects the change law of patch shape in the landscape. The larger the value, the more irregular the shape of a patch in the landscape. | ||
| Aggregation Index (AI) | Indicates the aggregation degree of a patch type in the landscape. The larger the value, the more compact the aggregation degree. | ||
| Contagion index (CONTAG) | Indicates the degree of aggregation or extension among different patch types in the landscape. | ||
| Shannon’s Diversity Index (SHDI) | Focuses on the heterogeneity of the landscape. |
| Judgment Basis | Interaction Type |
|---|---|
| q(X1∩X2) < Min(q(X1), q(X2)) | Reduction of nonlinearity |
| Min(q(X1), q(X2)) < q(X1∩X2) < Max(q(X1), q(X2)) | Nonlinear attenuation of single factor |
| q(X1∩X2) > Max(q(X1), q(X2)) | Two-factor enhancement |
| q(X1∩X2) = q(X1) + q(X2) | Mutual independence of factors |
| q(X1∩X2) > q(X1) + q(X2) | Enhancement of nonlinearity |
| Land Use Types | 1990 | 2000 | 2010 | 2020 | ||||
|---|---|---|---|---|---|---|---|---|
| Area | Ratio | Area | Ratio | Area | Ratio | Area | Ratio | |
| Farmland | 19,898.43 | 54.29 | 20,272.34 | 55.31 | 19,983.48 | 54.52 | 19,672.54 | 53.68 |
| Woodland | 8385.25 | 22.879 | 8362.09 | 22.816 | 8335.33 | 22.743 | 8332.71 | 22.736 |
| Grassland | 3674.53 | 10.03 | 3566.16 | 9.73 | 3529.15 | 9.63 | 3523.52 | 9.61 |
| Water | 1414.17 | 3.86 | 1024.58 | 2.80 | 1237.48 | 3.38 | 1265.40 | 3.45 |
| Construction land | 3154.10 | 8.61 | 3380.83 | 9.22 | 3552.33 | 9.69 | 3842.56 | 10.48 |
| Unused land | 124.14 | 0.34 | 44.61 | 0.12 | 12.84 | 0.04 | 13.88 | 0.04 |
| 1990 | 2020 | 1990 Total | |||||
|---|---|---|---|---|---|---|---|
| Cultivated Land | Woodland | Grassland | Water | Construction Land | Unused Land | ||
| Cultivated land | 19,029.44 | 10.29 | 8.19 | 193.53 | 656.91 | 0.06 | 19,898.43 |
| Woodland | 42.13 | 8243.43 | 78.12 | 13.47 | 7.69 | 0.41 | 8385.25 |
| Grassland | 125.70 | 74.42 | 3429.21 | 33.89 | 10.90 | 0.41 | 3674.53 |
| Water | 382.04 | 4.56 | 5.96 | 1009.16 | 10.86 | 1.59 | 1414.17 |
| Construction land | 3.37 | 0.00 | 0.15 | 1.37 | 3149.20 | 0.00 | 3154.10 |
| Unused land | 89.86 | 0.00 | 1.89 | 13.98 | 7.00 | 11.41 | 124.14 |
| 2020 total | 19,672.54 | 8332.71 | 3523.52 | 1265.40 | 3842.56 | 13.88 | |
Publisher’s Note: MDPI stays neutral with regard to jurisdictional claims in published maps and institutional affiliations. |
© 2022 by the authors. Licensee MDPI, Basel, Switzerland. This article is an open access article distributed under the terms and conditions of the Creative Commons Attribution (CC BY) license (https://creativecommons.org/licenses/by/4.0/).
Share and Cite
Niu, H.; Zhao, X.; Xiao, D.; Liu, M.; An, R.; Fan, L. Evolution and Influencing Factors of Landscape Pattern in the Yellow River Basin (Henan Section) Due to Land Use Changes. Water 2022, 14, 3872. https://doi.org/10.3390/w14233872
Niu H, Zhao X, Xiao D, Liu M, An R, Fan L. Evolution and Influencing Factors of Landscape Pattern in the Yellow River Basin (Henan Section) Due to Land Use Changes. Water. 2022; 14(23):3872. https://doi.org/10.3390/w14233872
Chicago/Turabian StyleNiu, Haipeng, Xiaoming Zhao, Dongyang Xiao, Mengmeng Liu, Ran An, and Liangxin Fan. 2022. "Evolution and Influencing Factors of Landscape Pattern in the Yellow River Basin (Henan Section) Due to Land Use Changes" Water 14, no. 23: 3872. https://doi.org/10.3390/w14233872
APA StyleNiu, H., Zhao, X., Xiao, D., Liu, M., An, R., & Fan, L. (2022). Evolution and Influencing Factors of Landscape Pattern in the Yellow River Basin (Henan Section) Due to Land Use Changes. Water, 14(23), 3872. https://doi.org/10.3390/w14233872


