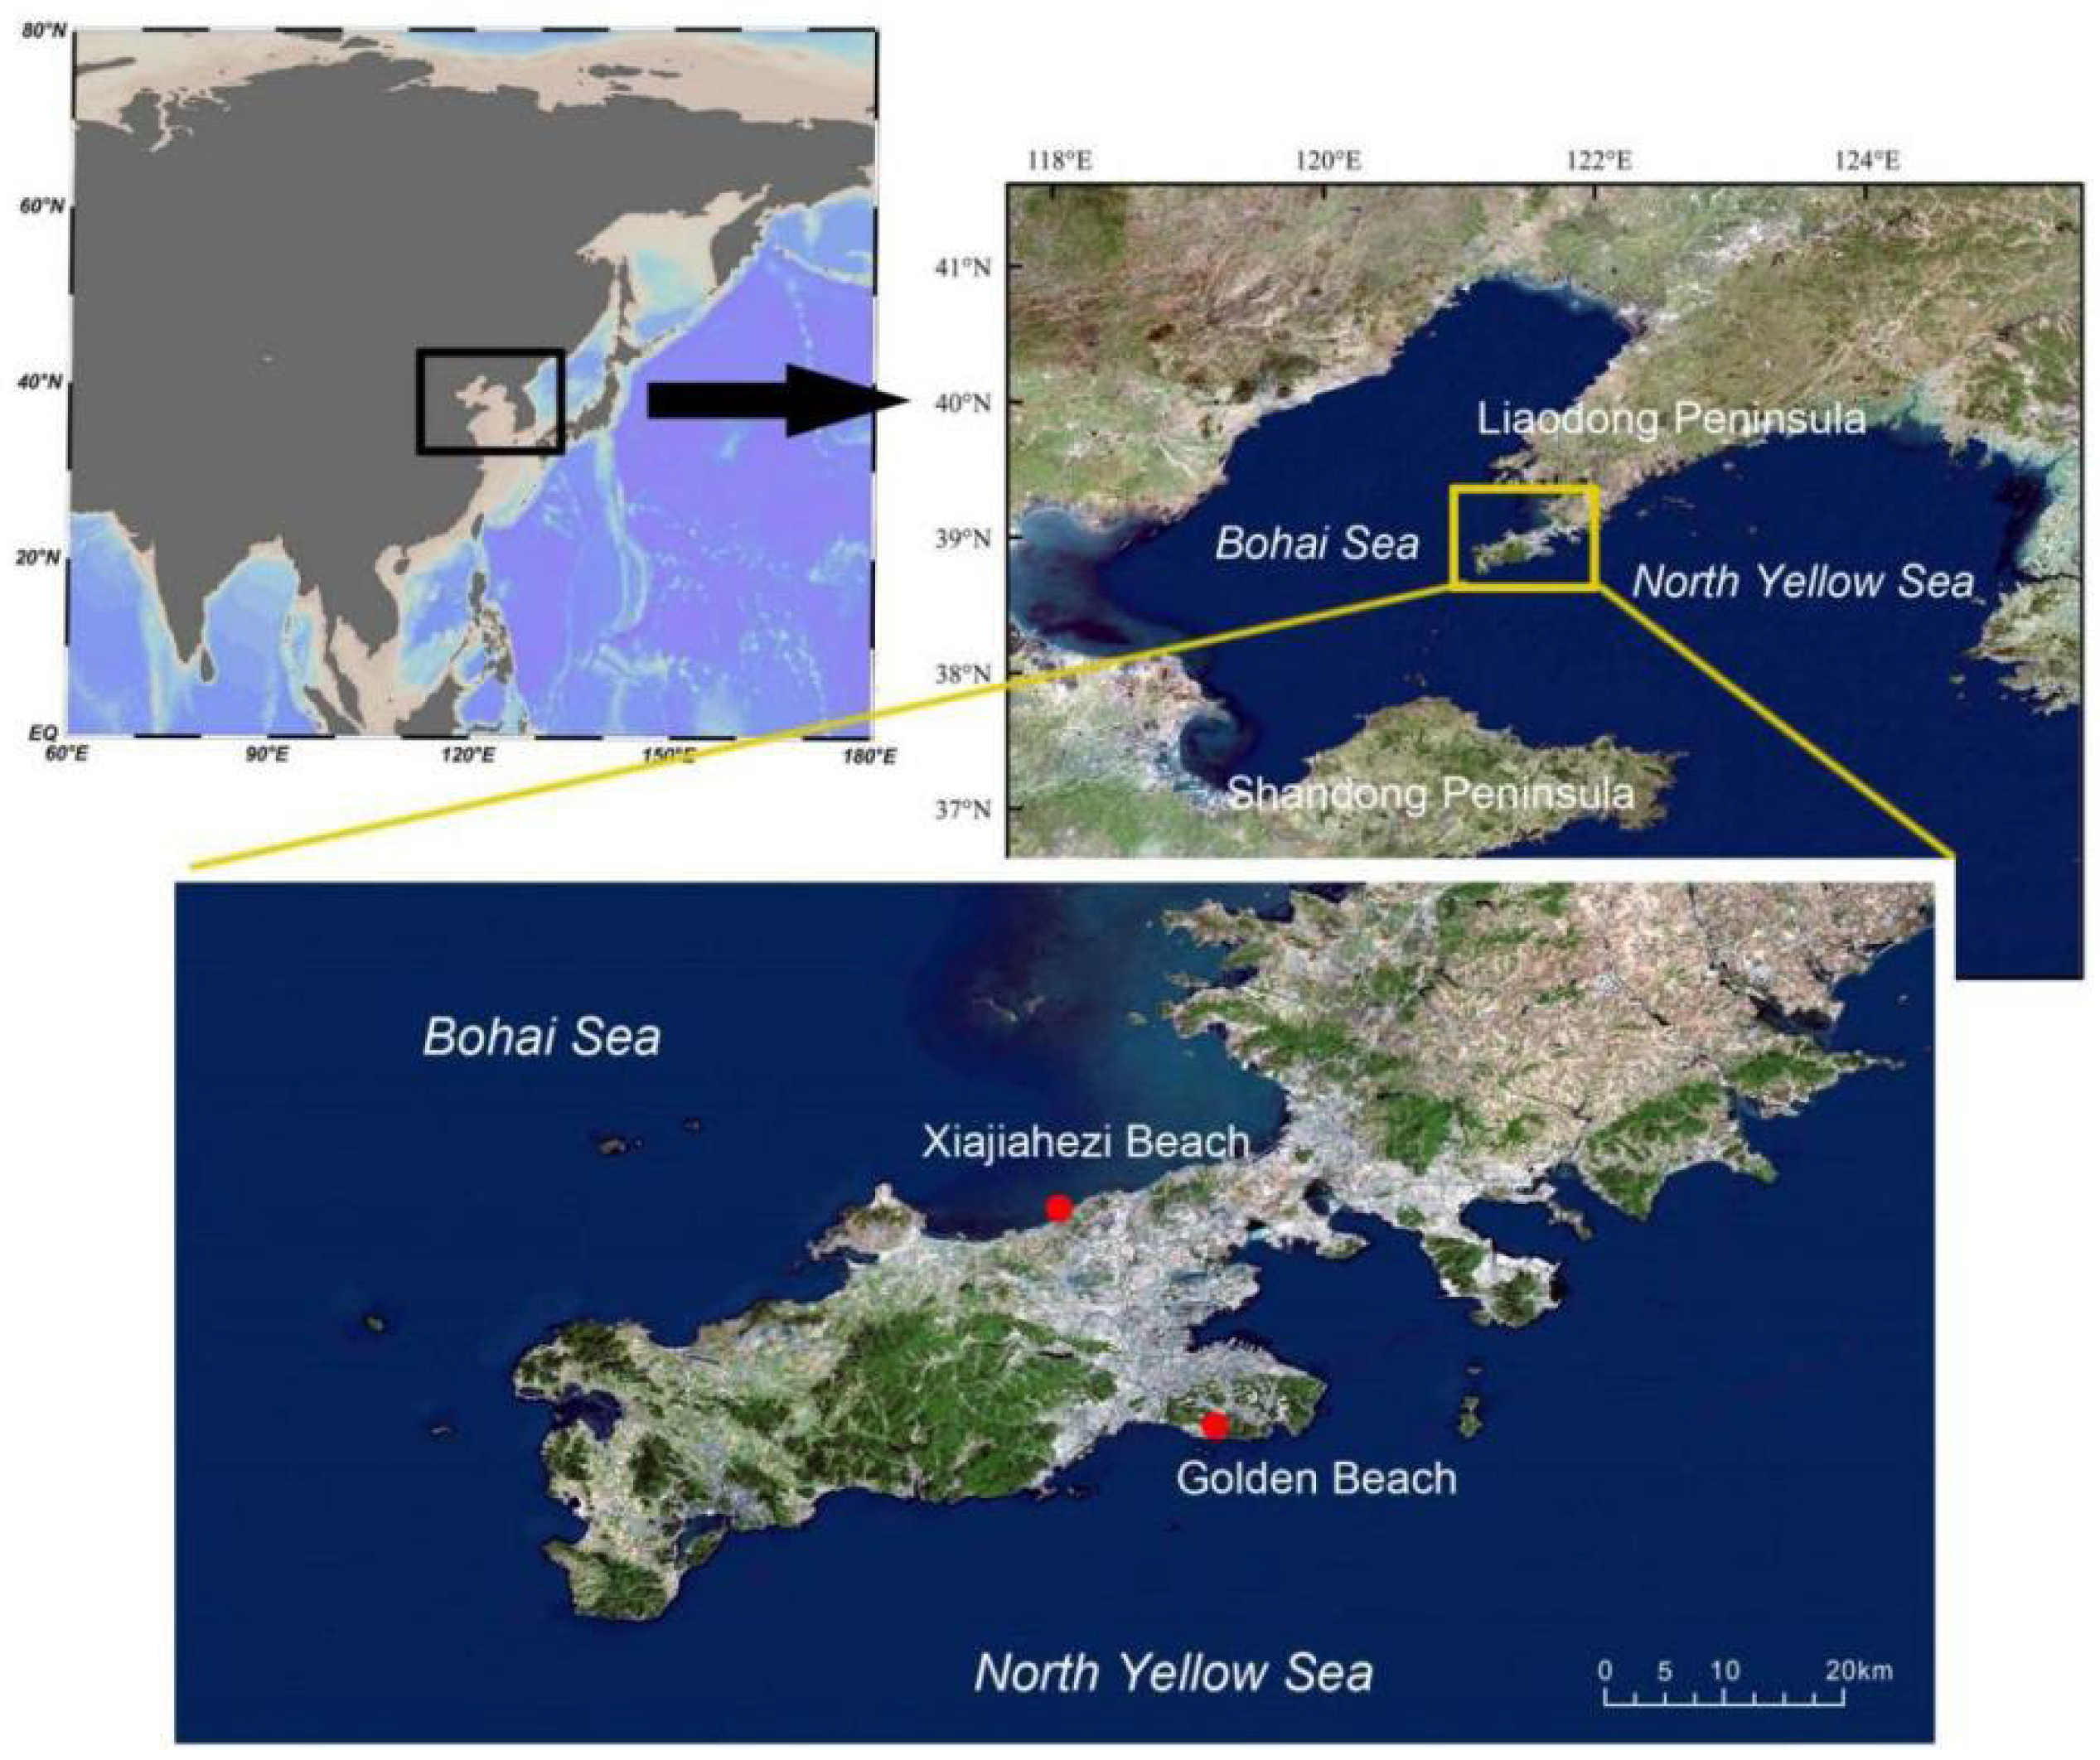
Figure 1.
Map of sampling sandy beaches.
Figure 1.
Map of sampling sandy beaches.
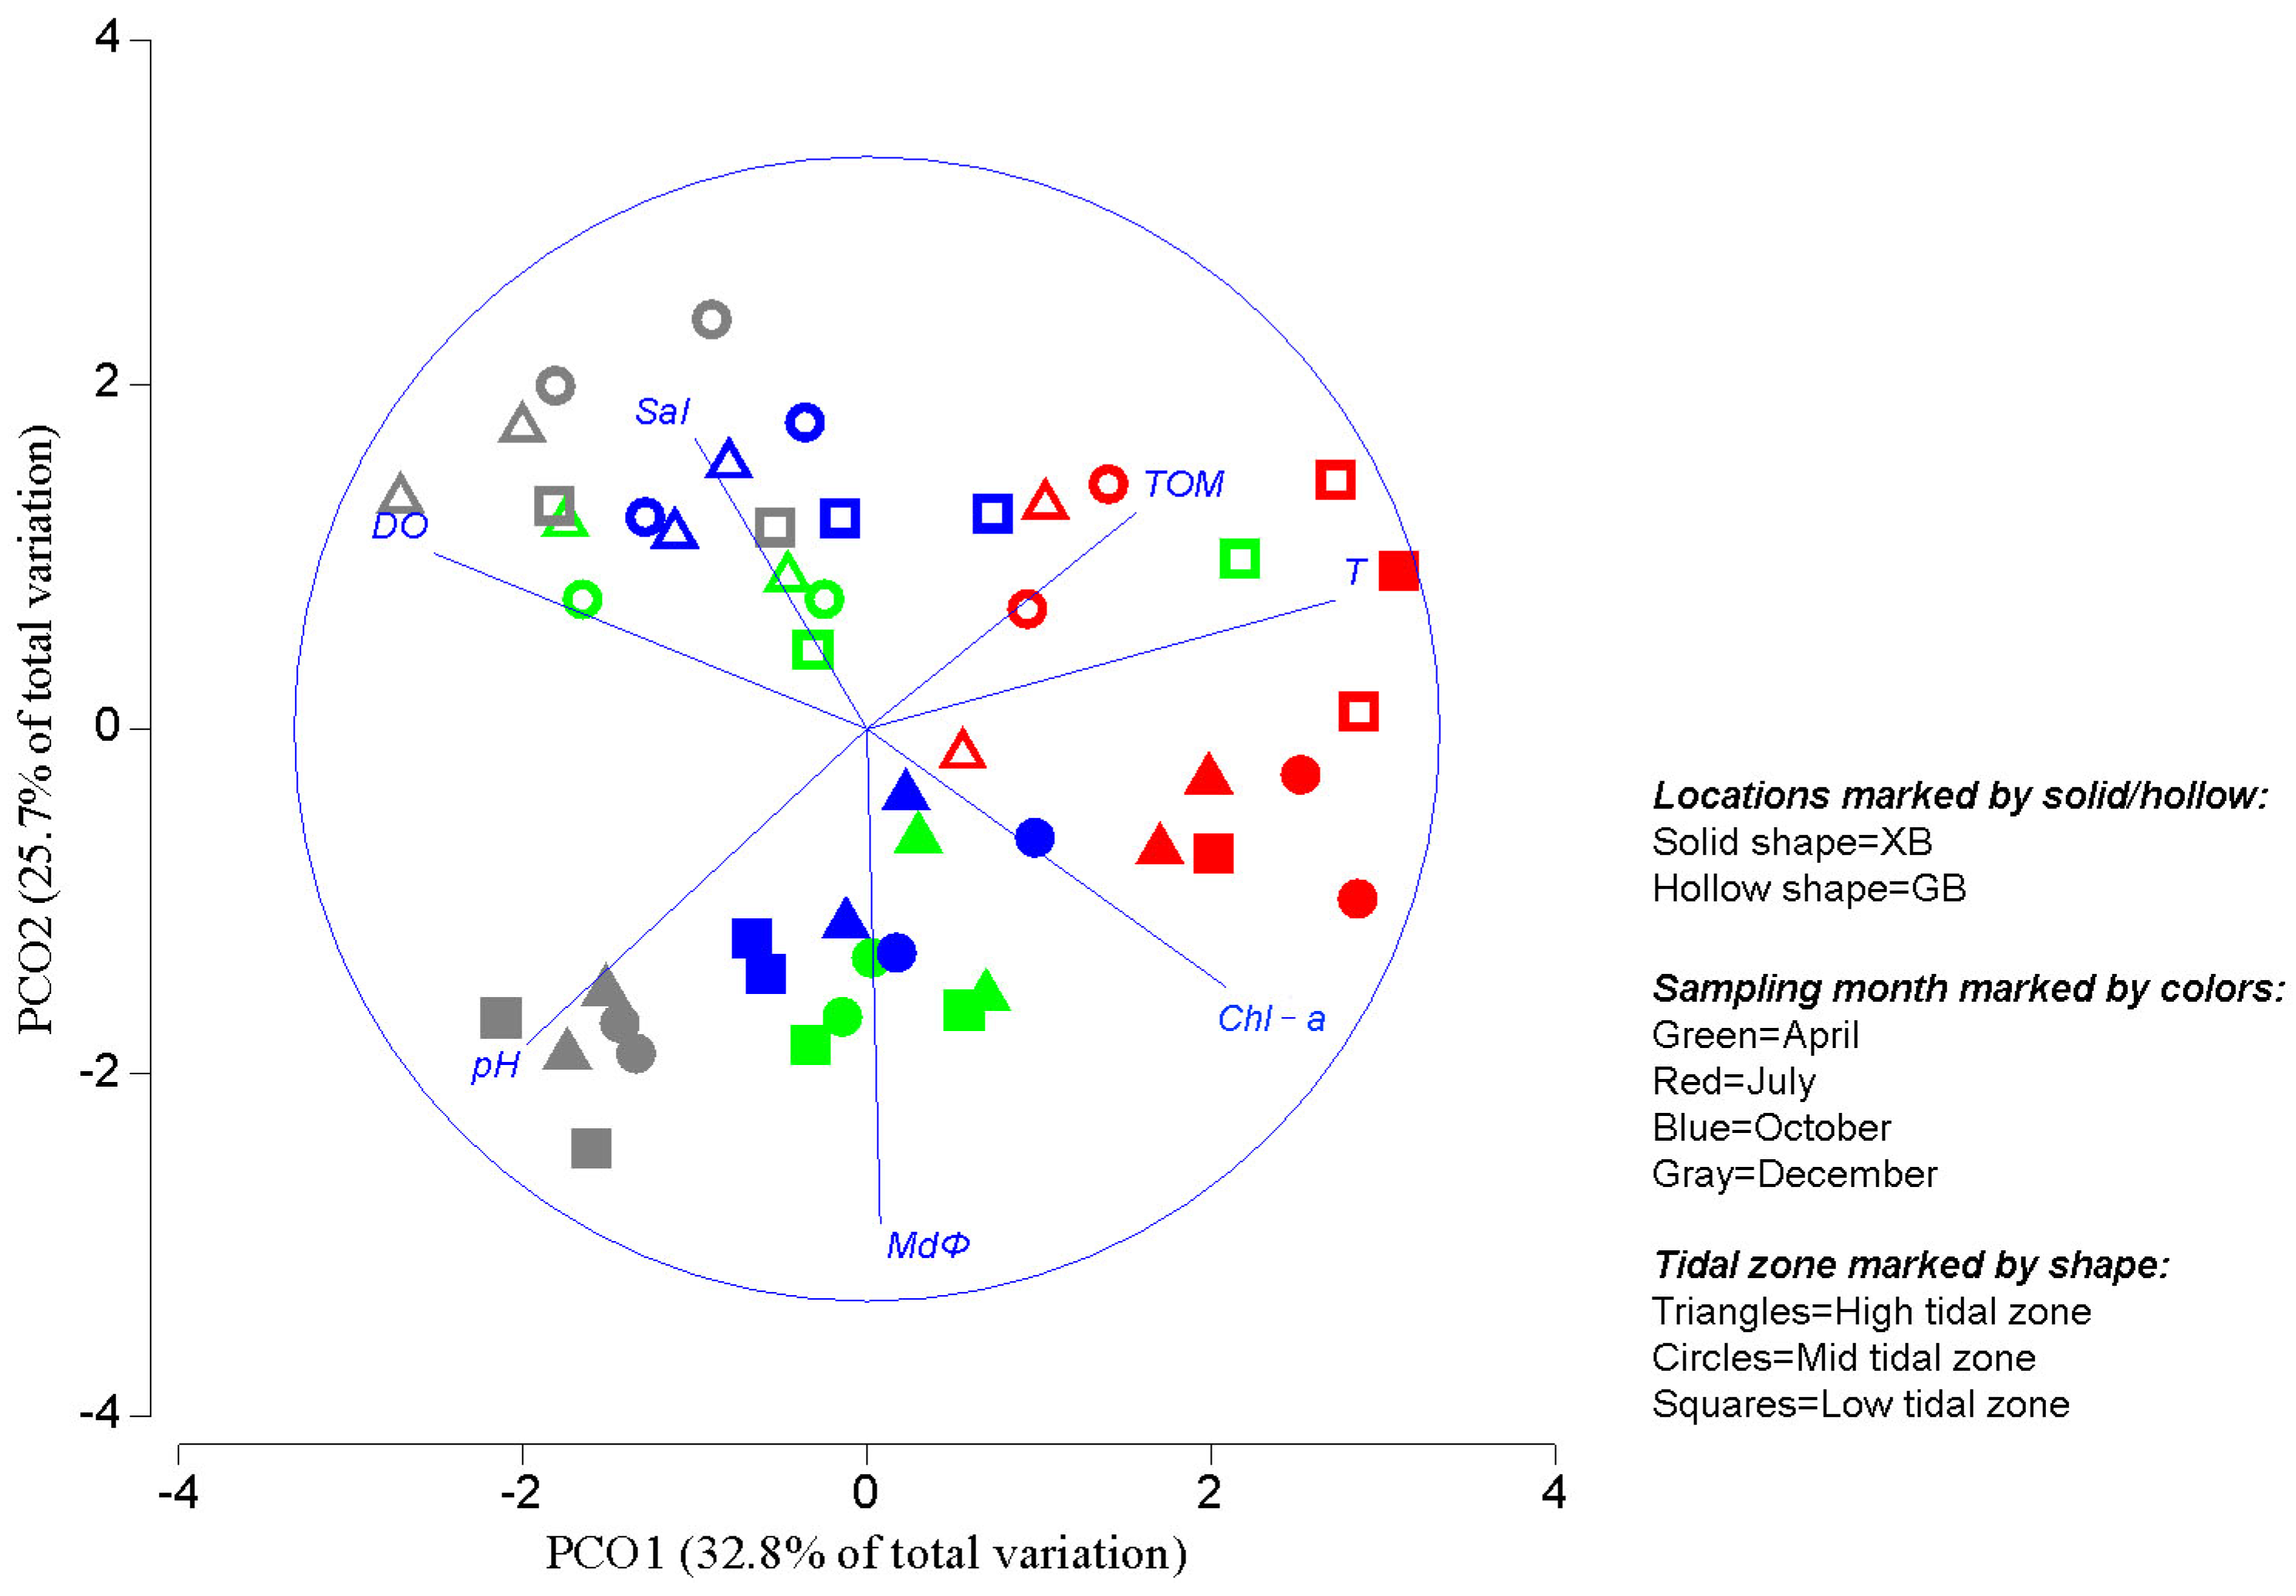
Figure 2.
Principal coordinates analysis (PCO) output based on environmental variables. Vectors are the Pearson correlations of variables with the PCO axes. Abbreviations: XB, Xiajiahezi Beach; GB, Golden Beach; T, sea water temperature; Sal, sea water salinity; DO, sea water dissolved oxygen; Chl-a, Chlorophyll-a; TOM, total organic matter; MdΦ, medium particle diameter.
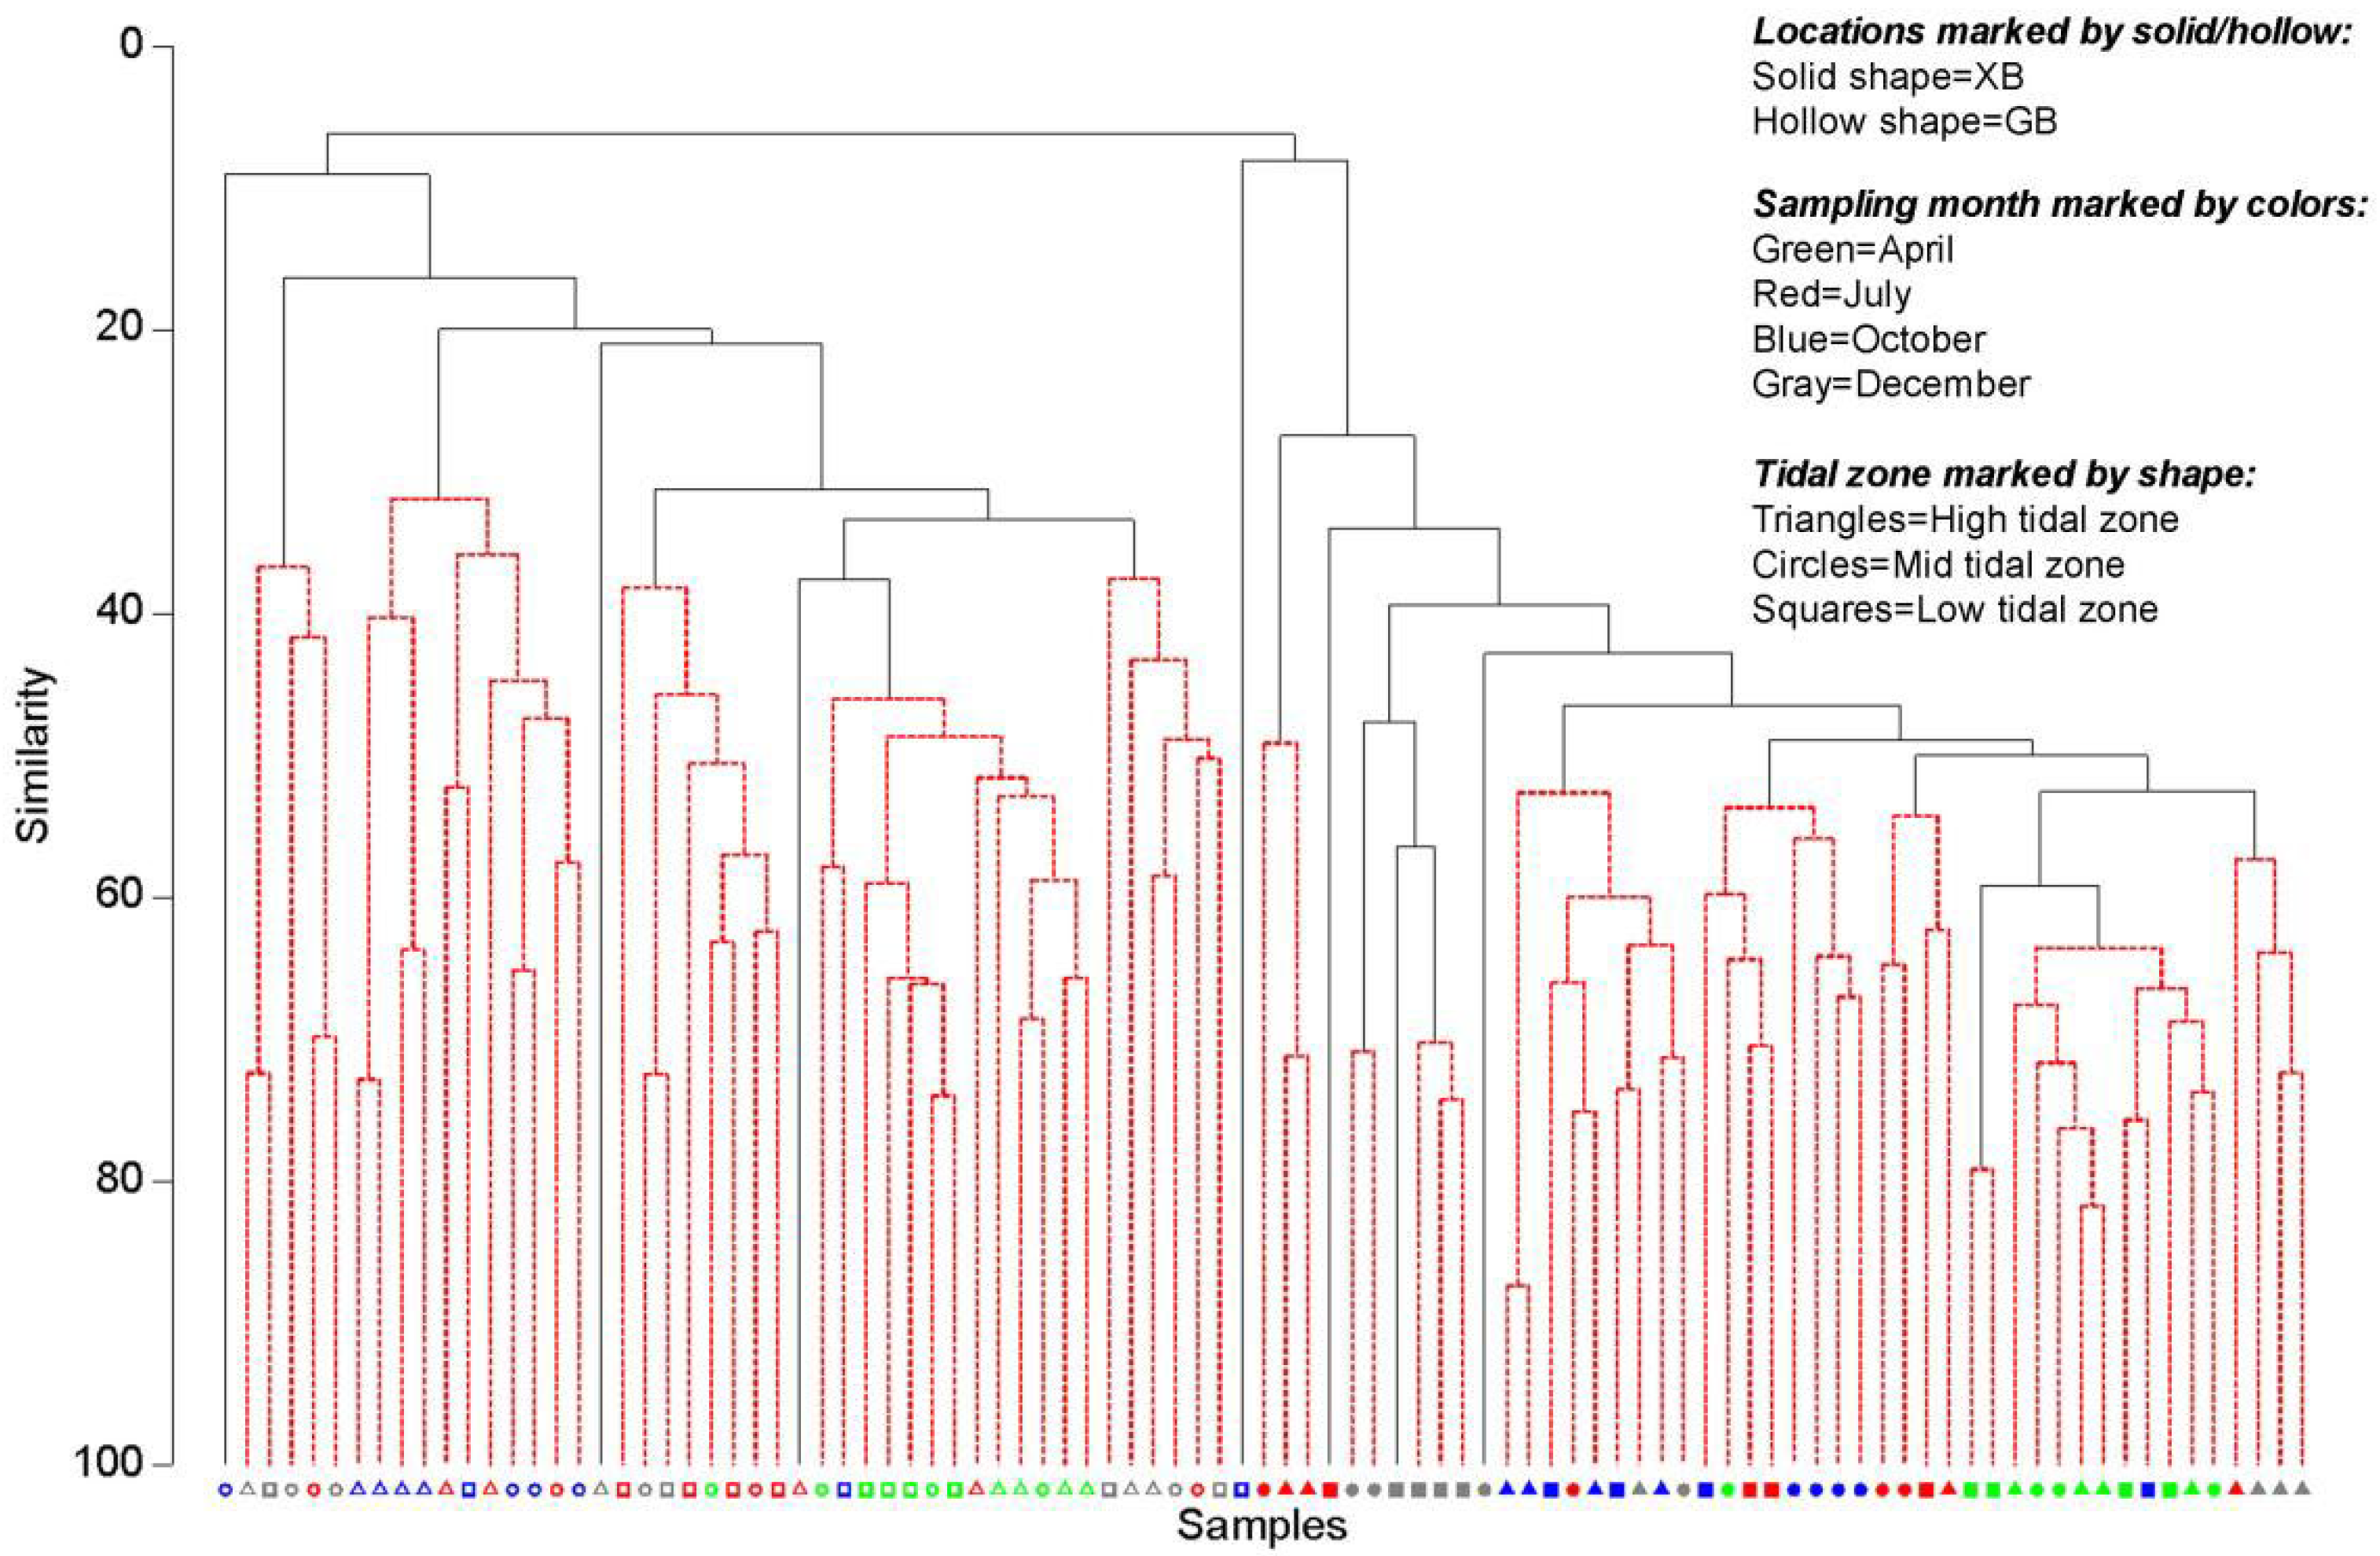
Figure 3.
Cluster analysis of the nematode community. Nematode species data were standardized and fourth root transformed, SIMPROF analysis at 5% significance level.
Figure 3.
Cluster analysis of the nematode community. Nematode species data were standardized and fourth root transformed, SIMPROF analysis at 5% significance level.
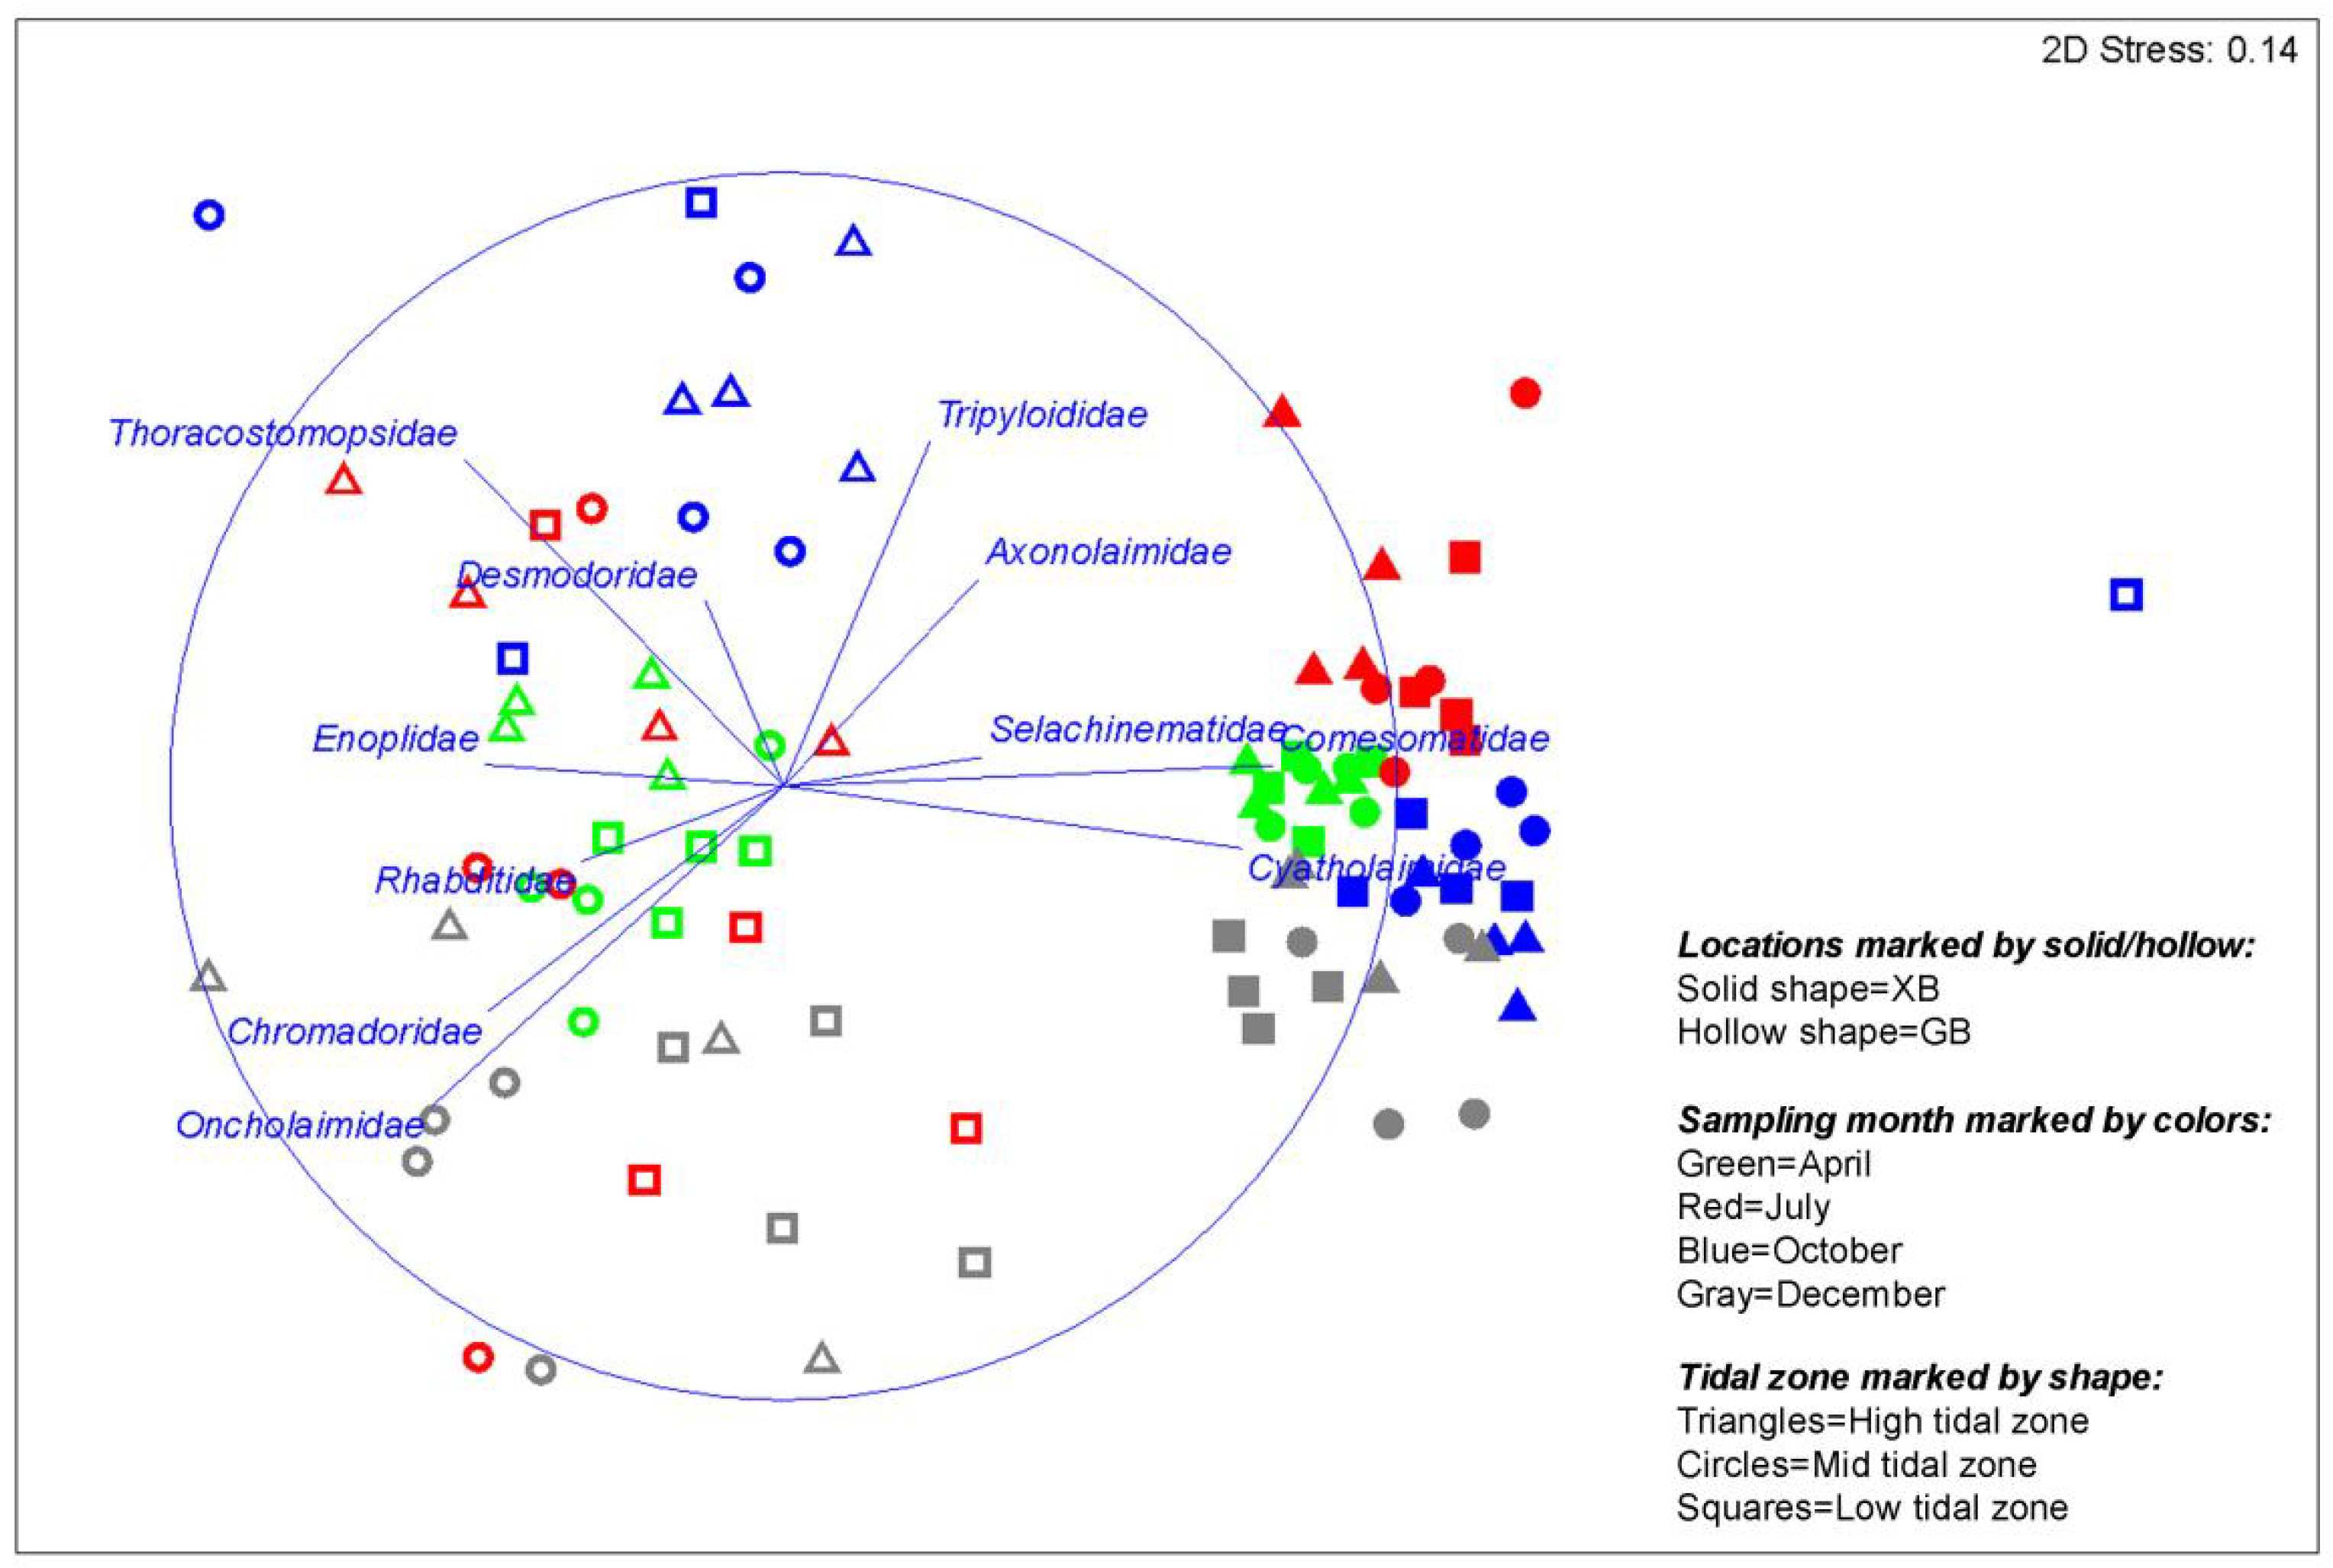
Figure 4.
Non-metric multidimensional scaling (nMDS) of nematode community. Nematode species data were standardized and fourth root transformed. Vectors overlain on plot show correlations of families (>0.3) with nMDS axes, indicating important families that differentiate the communities.
Figure 4.
Non-metric multidimensional scaling (nMDS) of nematode community. Nematode species data were standardized and fourth root transformed. Vectors overlain on plot show correlations of families (>0.3) with nMDS axes, indicating important families that differentiate the communities.
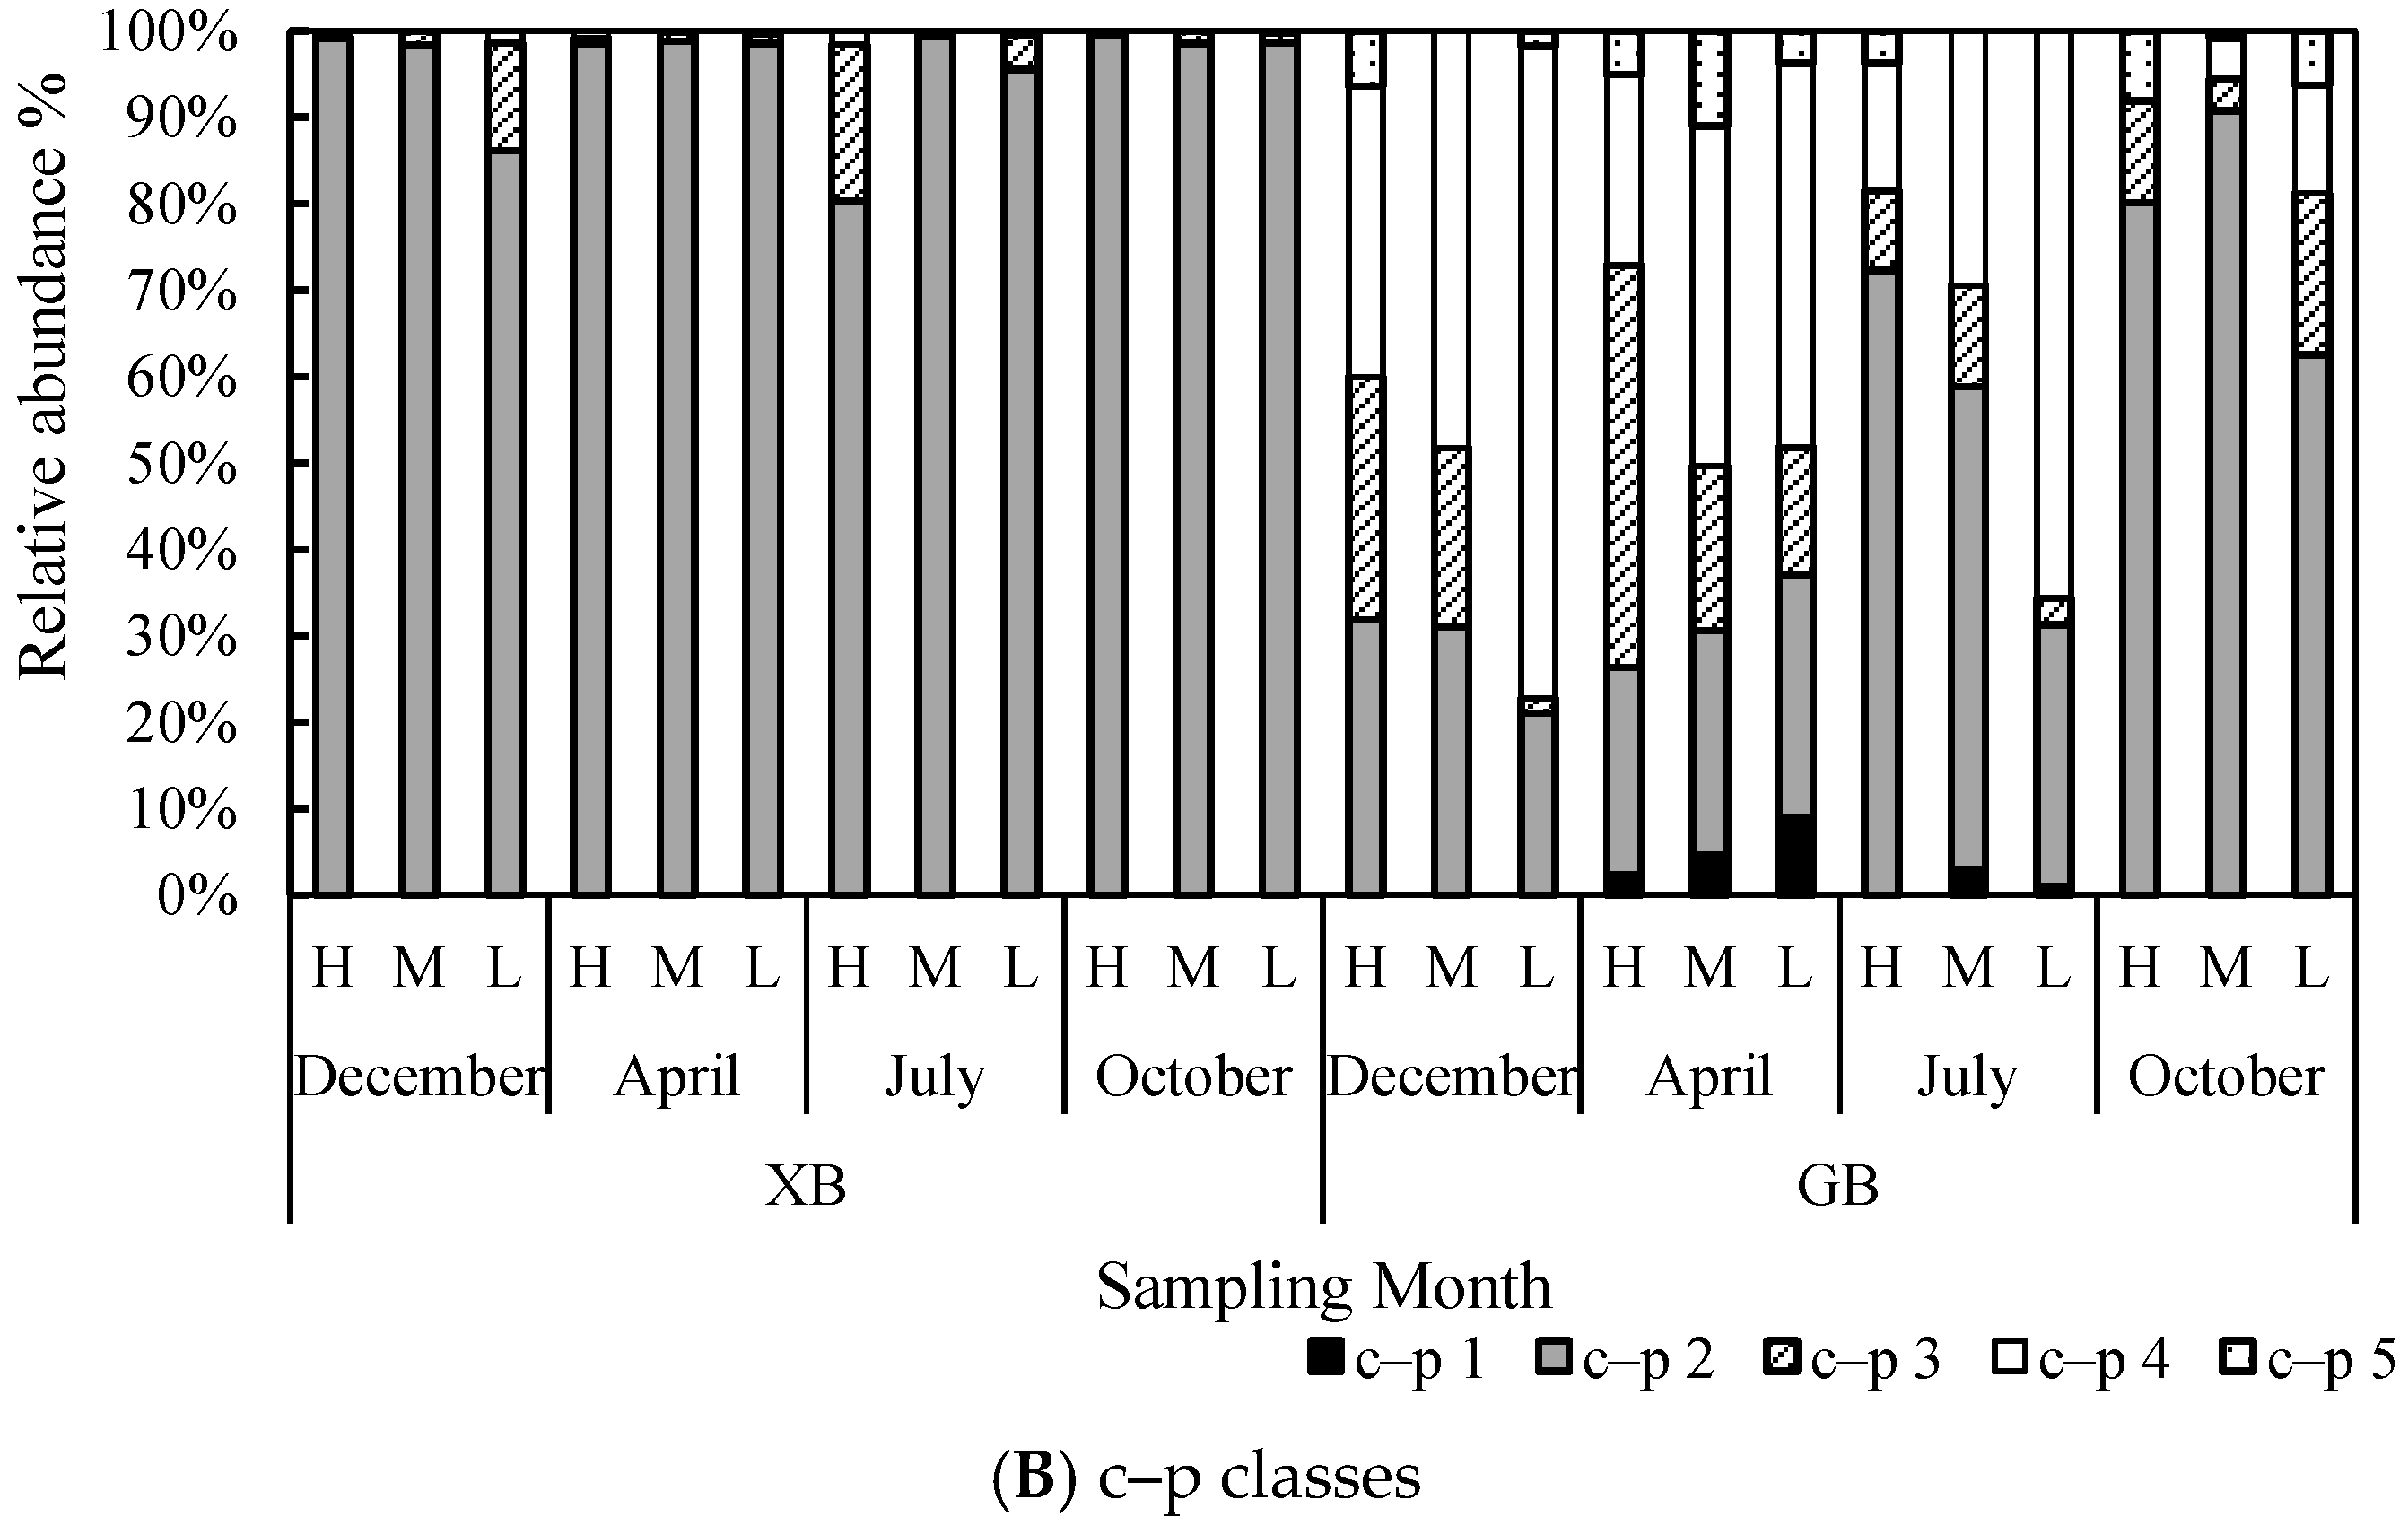
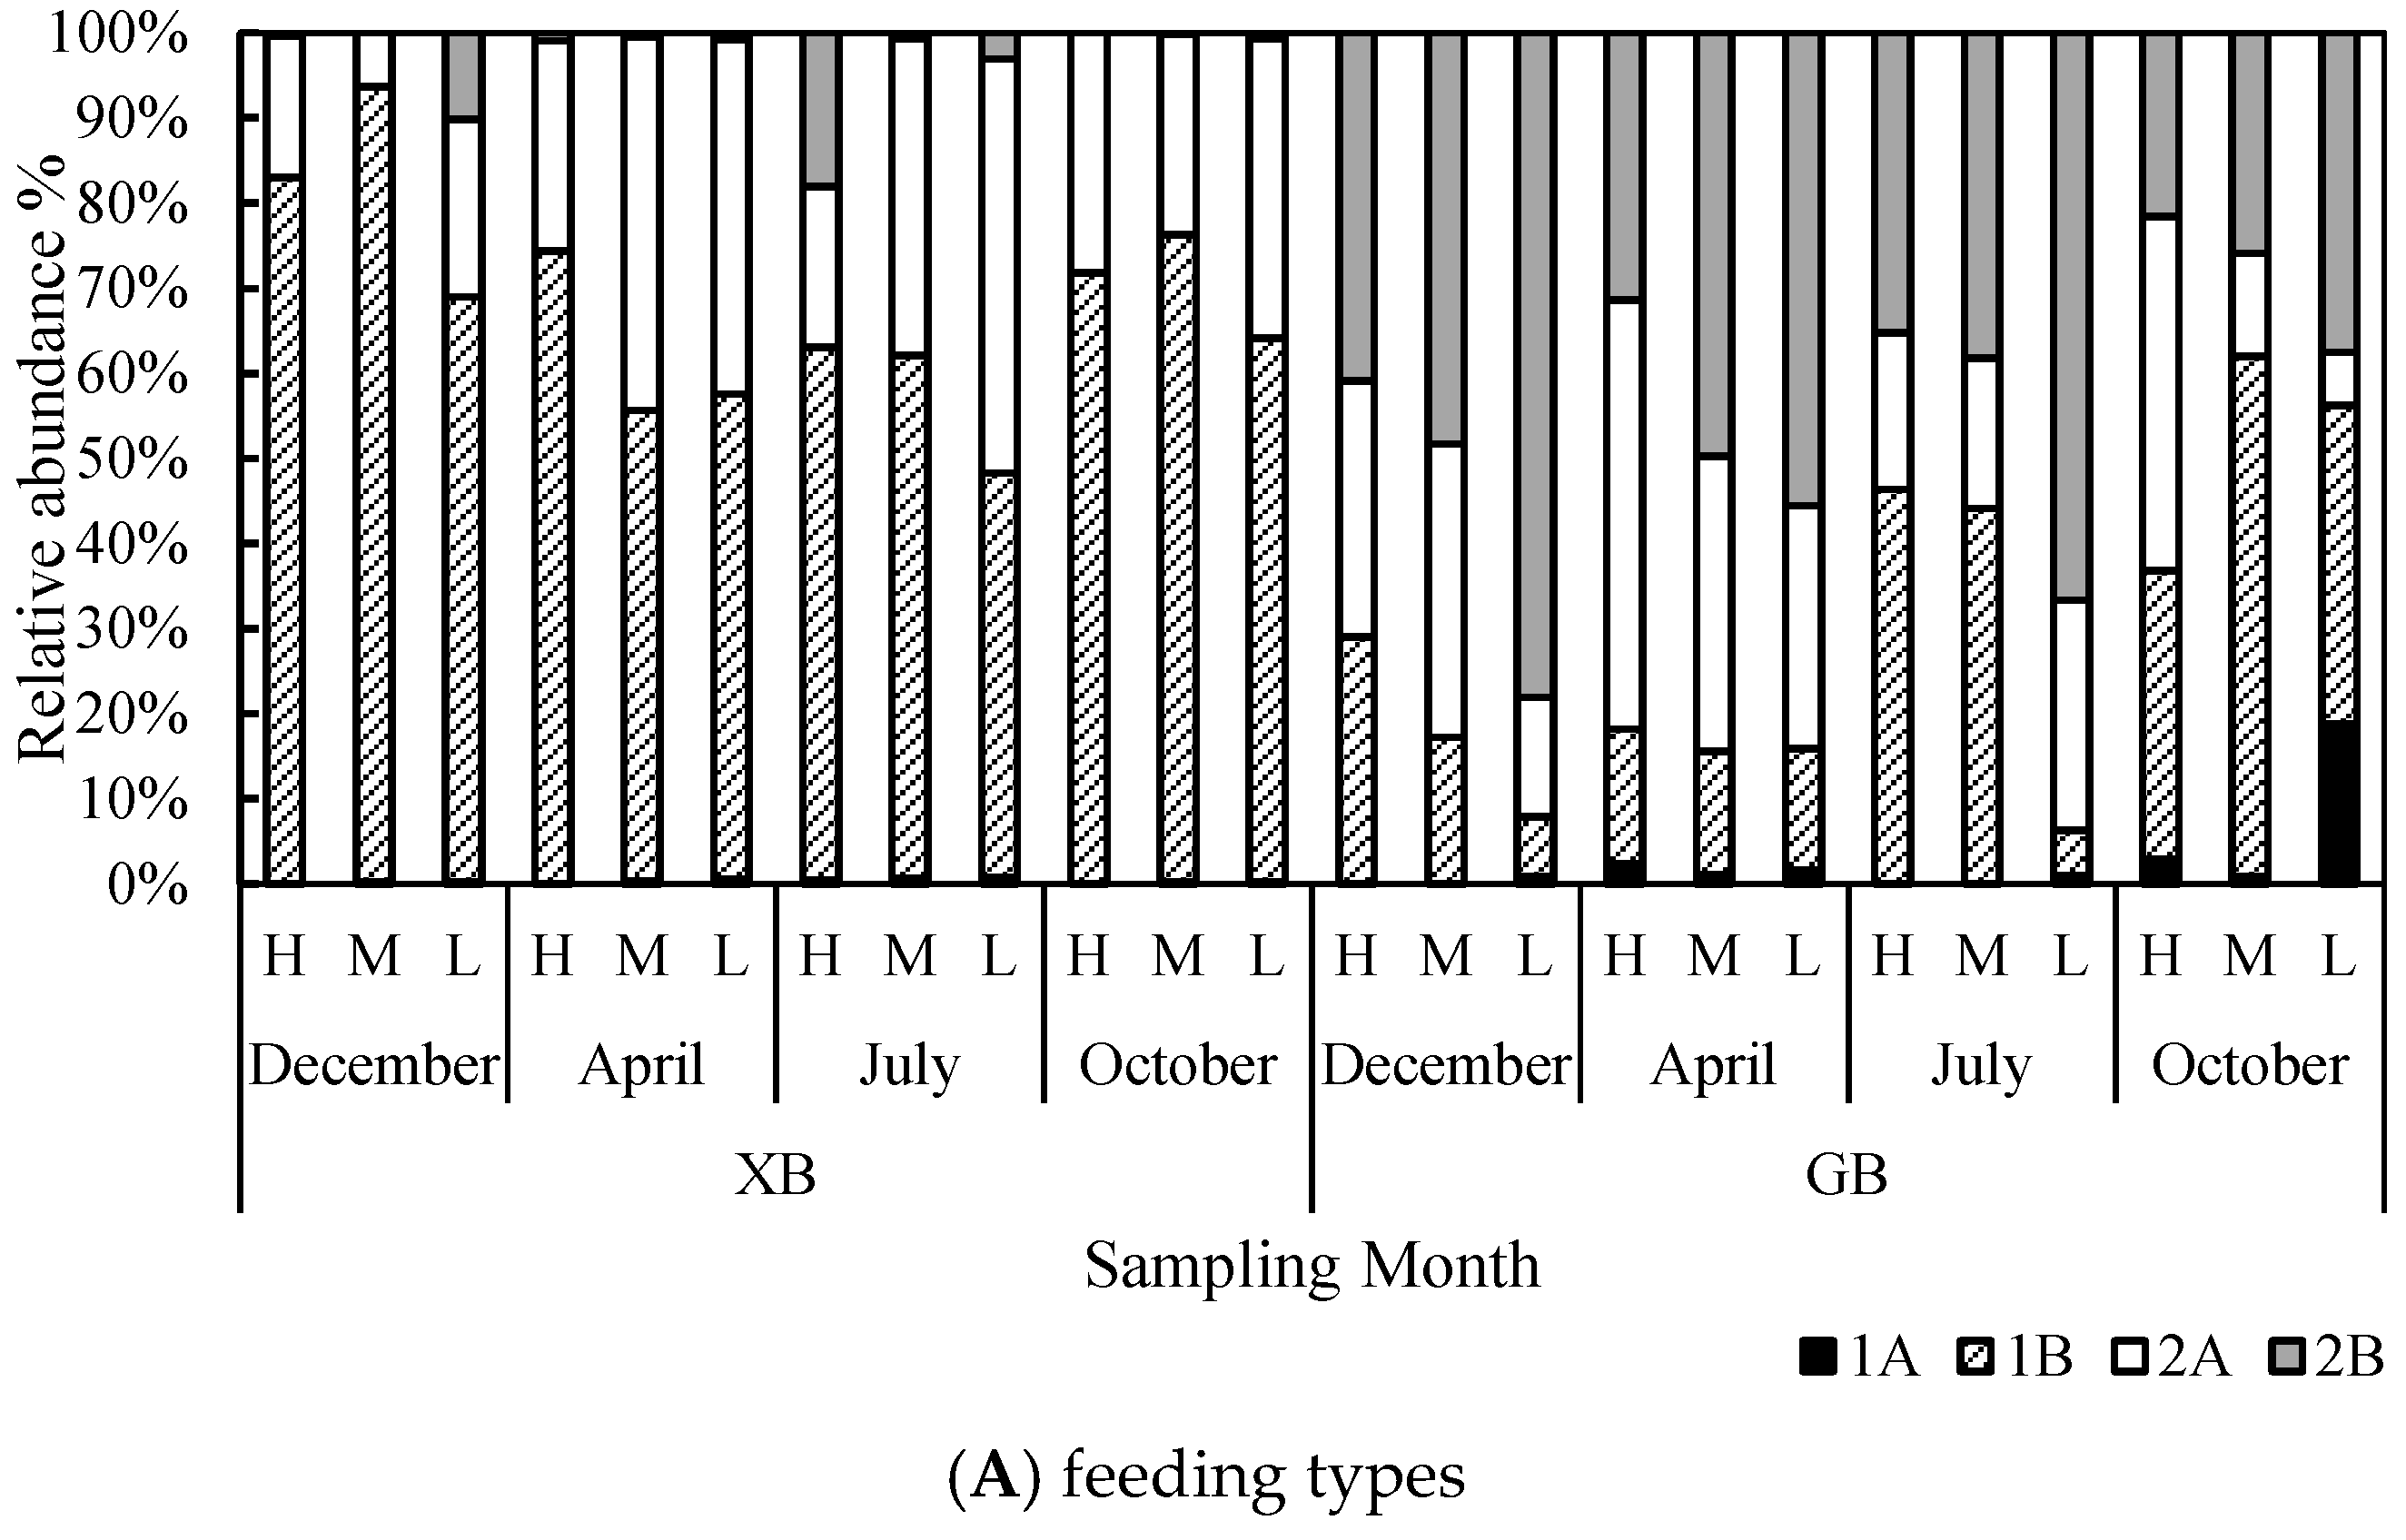
Figure 5.
Relative abundance of feeding types (A) and c–p classes (B) of nematodes at study locations over different sampling months.
Figure 5.
Relative abundance of feeding types (A) and c–p classes (B) of nematodes at study locations over different sampling months.
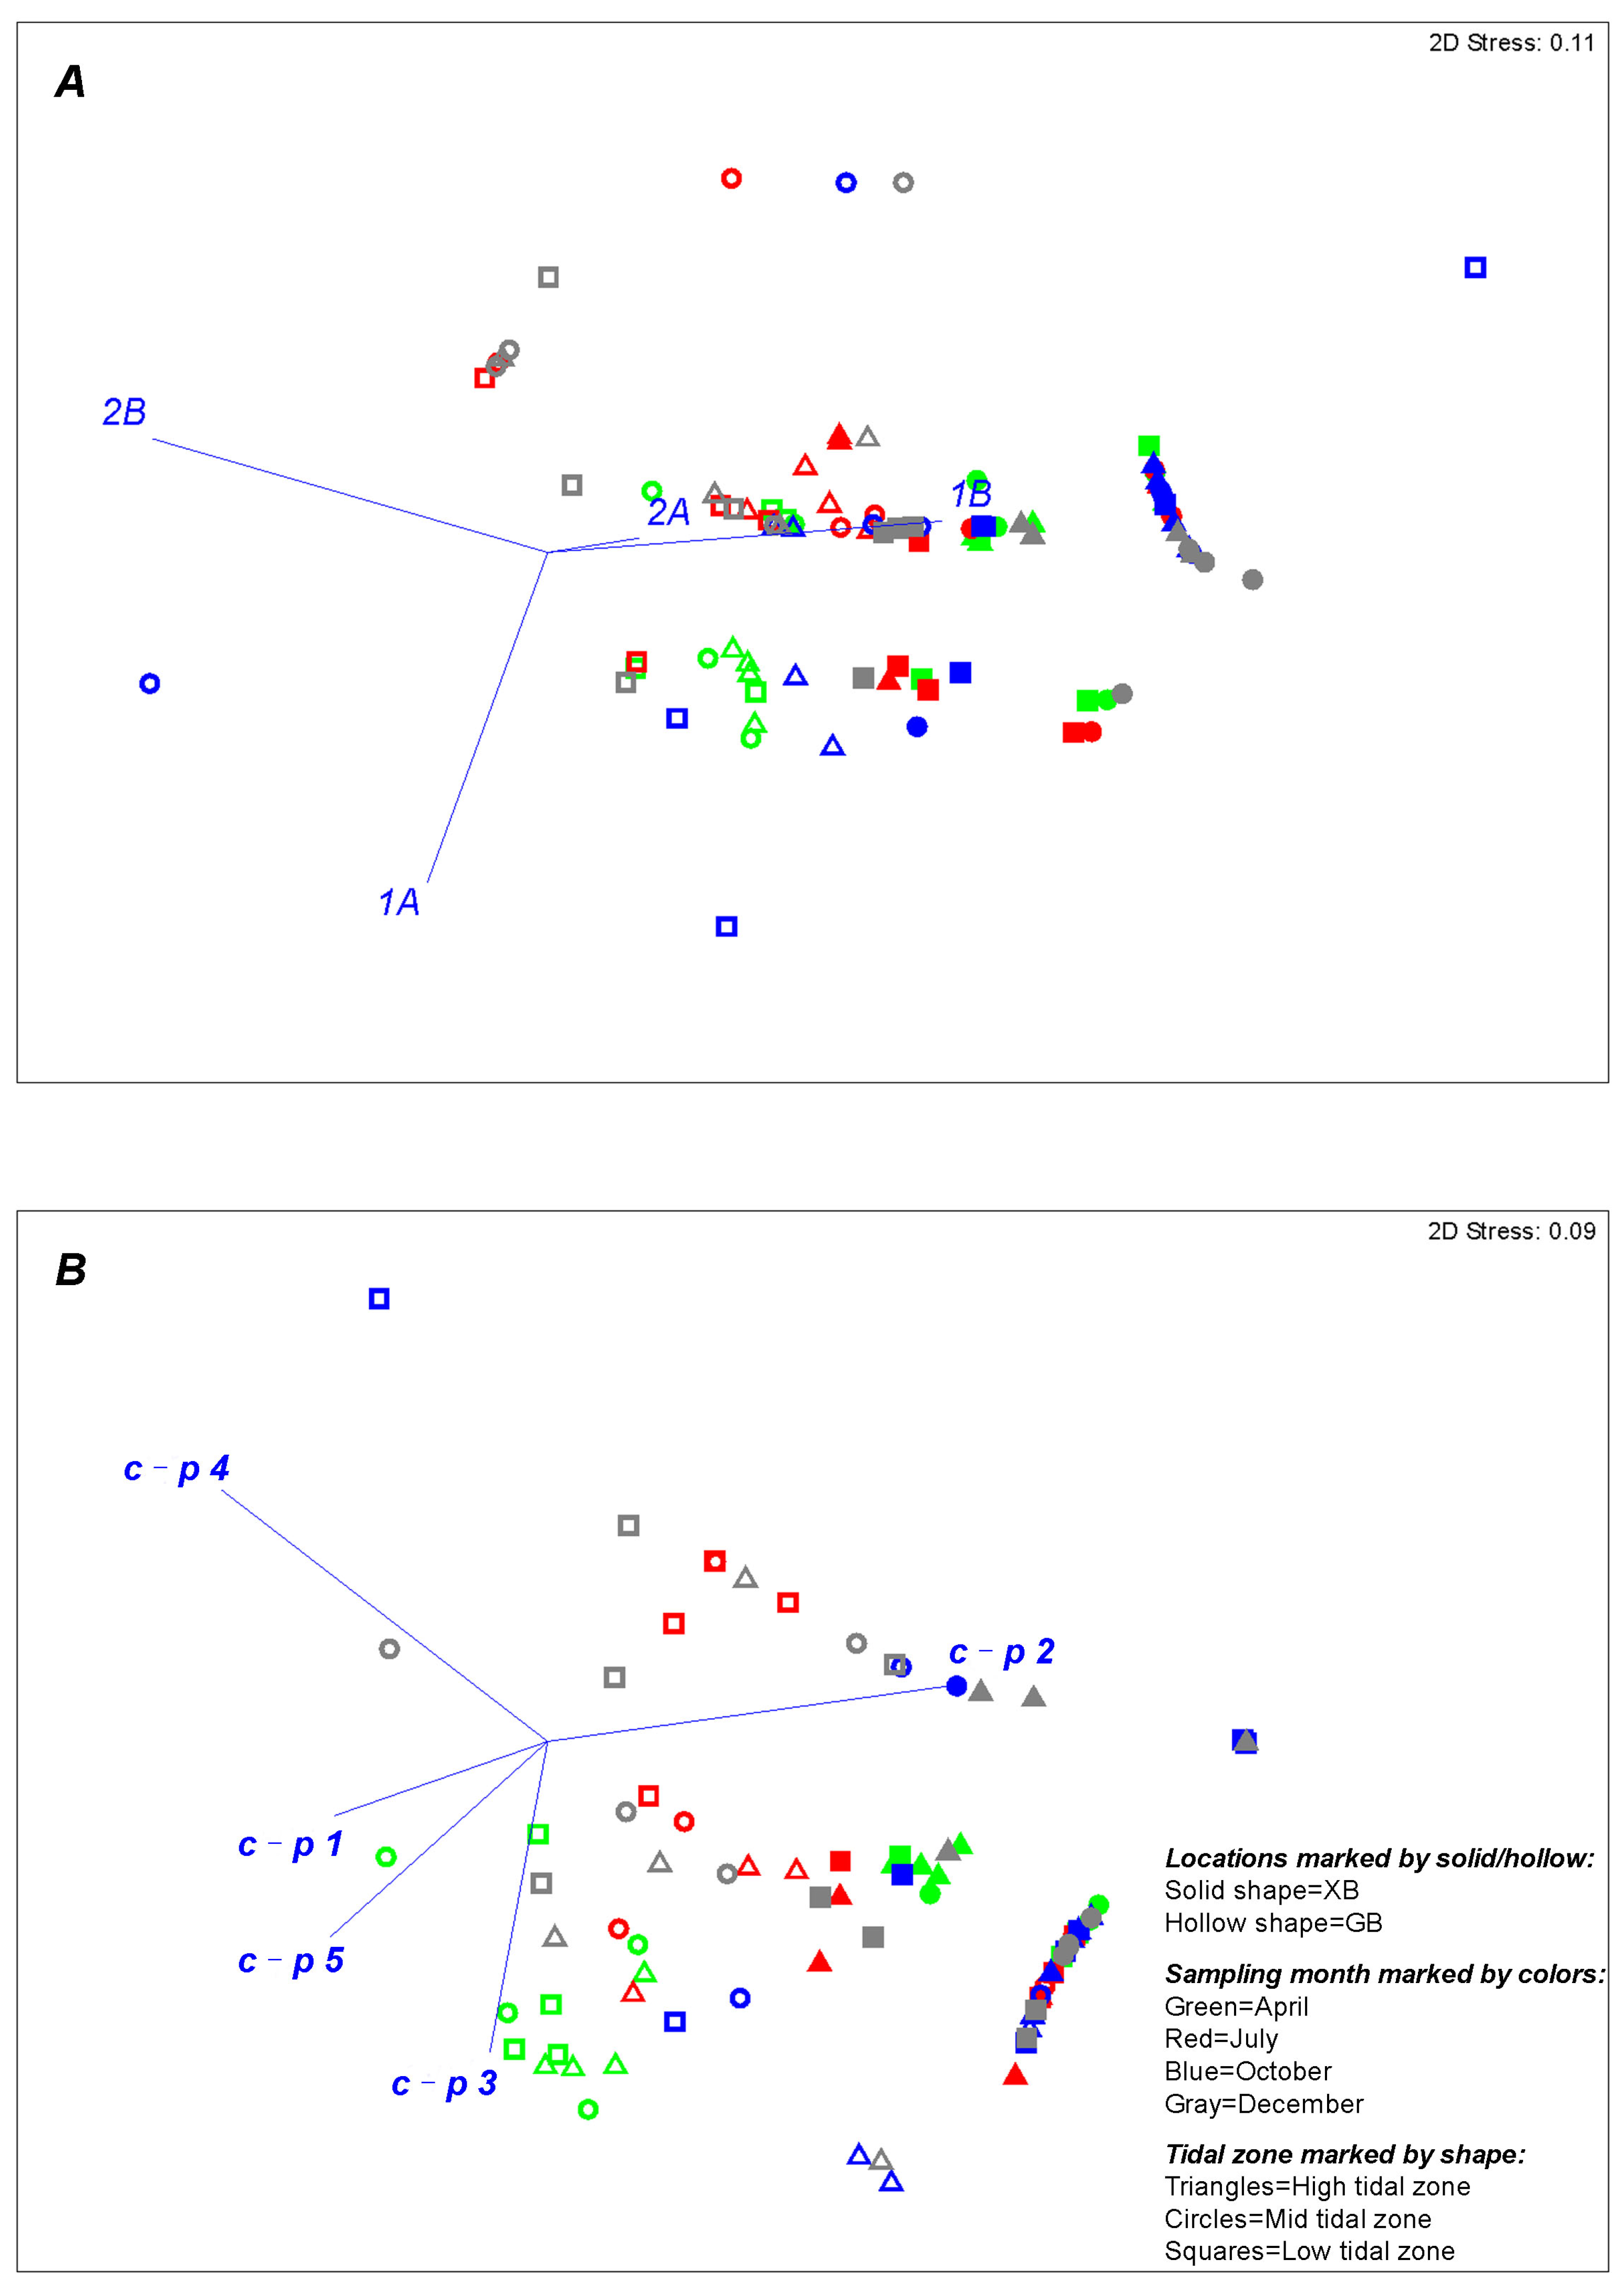
Figure 6.
nMDS plots of feeding types (A) and c–p classes (B) data of nematodes at study locations over different sampling months. Vectors overlain on plot show correlations of traits, indicating important traits that differentiate the assemblages.
Figure 6.
nMDS plots of feeding types (A) and c–p classes (B) data of nematodes at study locations over different sampling months. Vectors overlain on plot show correlations of traits, indicating important traits that differentiate the assemblages.
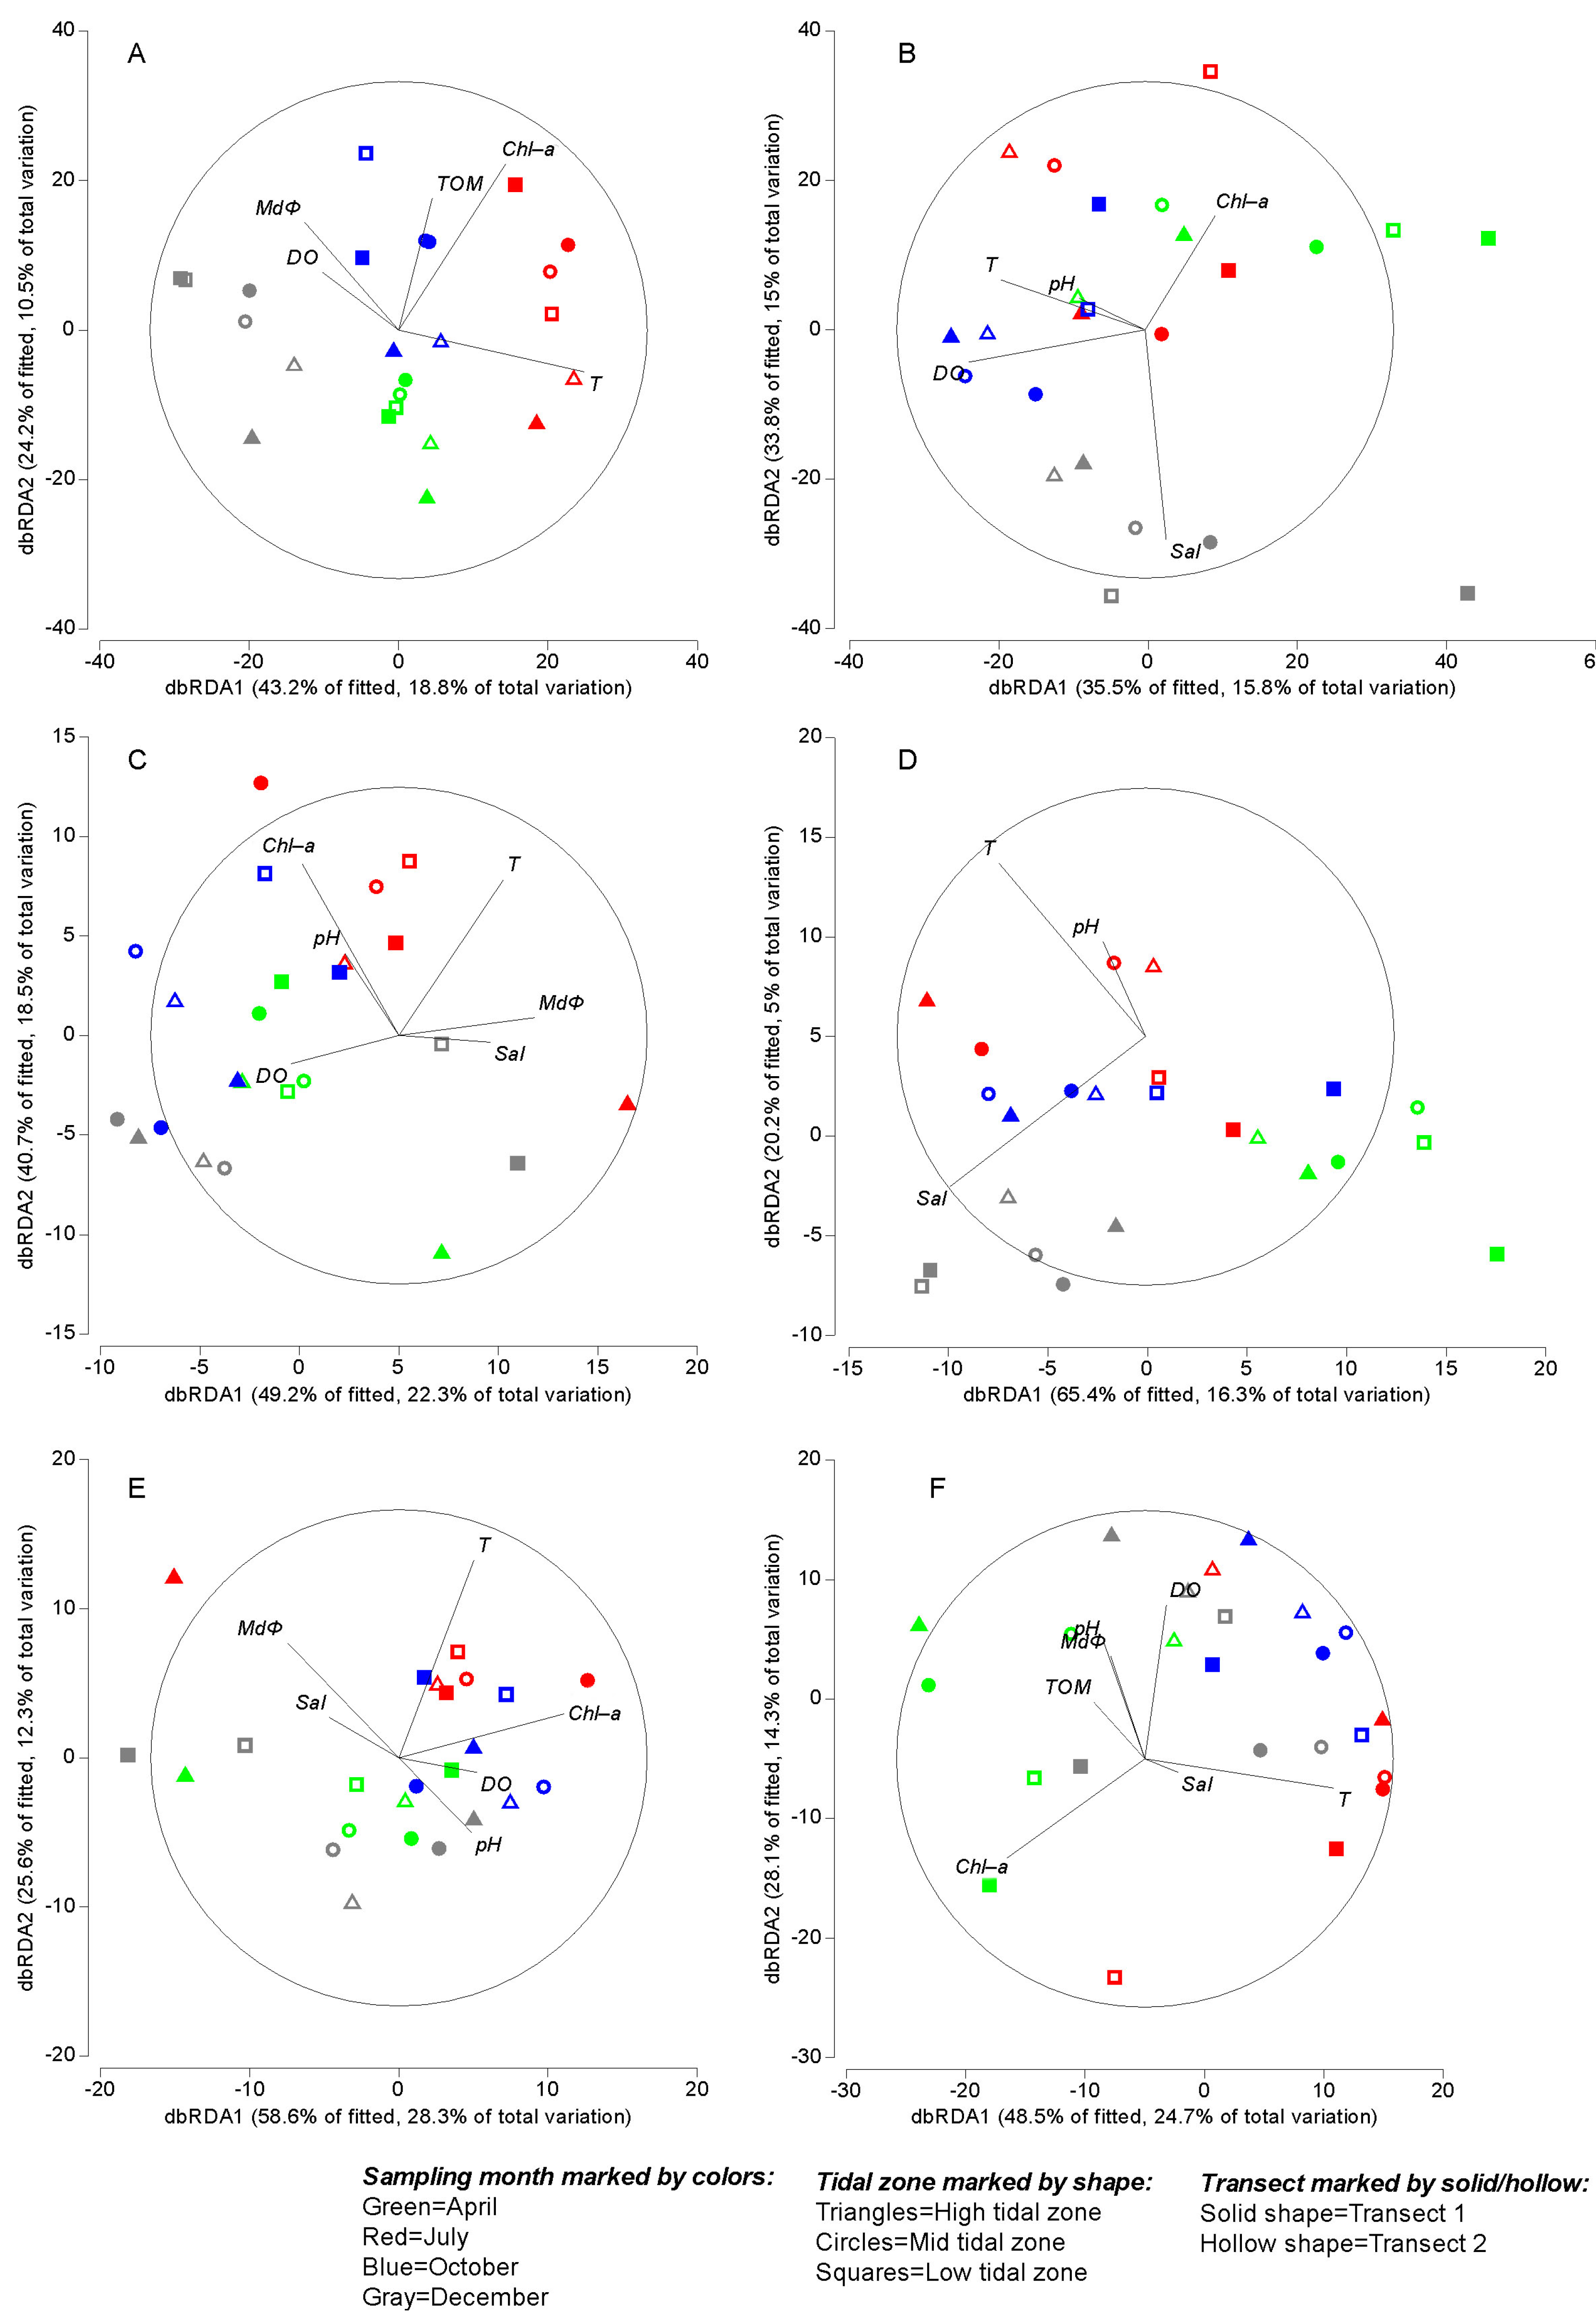
Figure 7.
dbRDA ordination for the fitted model of nematode data (based on Bray–Curtis after fourth root transformation of abundances) versus environmental variables at XB (A,C,E) and GB (B,D,F) separately. (A–B) species composition; (C–D) feeding types; (E–F) c–p classes. When categorical variables are included in a DistLM analysis, then the length of each categorical vector is a measure of the strength of the relationship between that category and the dbRDA axes.
Table 1.
Environmental characteristics of the study locations.
Table 1.
Environmental characteristics of the study locations.
| Characteristics | Golden Beach | Xiajiahezi Beach |
|---|
| Geographic location | 121°35′ E, 38°52′ N | 121°30′ E, 39°02′ N |
| Length (m) | 1000 | 1200 |
| Slope (°) | 9 | 1.3 |
| Beach exposure | Exposed | Exposed |
| Sediment texture | Coarse sand (CS) | Fine sand (FS) |
| Median grain size (μm) | 939 ± 315 | 159 ± 21 |
| Sediment sorting | 0.87 ± 0.42 (moderate-sorted) | 0.41 ± 0.06 (well-sorted) |
| Human impact | Disturbed | Disturbed |
Table 2.
Environmental variables of the two studied beaches in four sampling months. Abbreviations: XB, Xiajiahezi Beach; GB, Golden Beach; T, sea water temperature; Sal, sea water salinity; DO, sea water dissolved oxygen; Chl-a, Chlorophyll-a; TOM, total organic matter; MdΦ, medium particle diameter. H, high tidal zone; M, mid-tidal zone; L, low tidal zone.
| Sampling Month | Tidal Zone | T (°C) | pH | DO (μg/L) | Salinity | Chl-a (μg/g) | TOM (%) | Mdφ | Sediment Texture |
|---|
| XB |
| December | H | 2.45 | 8.33 | 5.53 | 28.80 | 1.07 | 0.10 | 2.59 | Fine sand |
| | M | 1.19 | 8.23 | 5.53 | 28.80 | 1.76 | 0.04 | 2.72 | Fine sand |
| | L | 0.74 | 8.47 | 3.86 | 30.20 | 0.73 | 0.04 | 3.14 | Fine sand |
| April | H | 13.94 | 7.93 | 2.17 | 29.45 | 1.62 | 0.09 | 2.48 | Fine sand |
| | M | 11.56 | 8.27 | 1.83 | 30.90 | 2.14 | 0.29 | 2.51 | Fine sand |
| | L | 12.29 | 8.13 | 2.77 | 28.35 | 1.84 | 0.06 | 2.61 | Fine sand |
| July | H | 27.39 | 7.73 | 2.64 | 31.60 | 3.46 | 0.08 | 2.66 | Fine sand |
| | M | 28.15 | 7.98 | 1.84 | 30.45 | 4.13 | 2.25 | 2.53 | Fine sand |
| | L | 28.09 | 8.06 | 2.27 | 31.85 | 3.42 | 3.46 | 2.53 | Fine sand |
| October | H | 15.44 | 8.15 | 5.65 | 30.65 | 2.70 | 1.15 | 2.50 | Fine sand |
| | M | 14.88 | 7.91 | 5.26 | 31.00 | 4.26 | 0.36 | 2.57 | Fine sand |
| | L | 14.84 | 8.27 | 6.88 | 32.15 | 3.83 | 0.13 | 2.95 | Fine sand |
| GB |
| December | H | 7.00 | 8.12 | 9.21 | 34.00 | 0.09 | 0.84 | 0.47 | Coarse sand |
| | M | 8.10 | 7.82 | 7.07 | 33.95 | 0.19 | 0.80 | −0.32 | Very coarse sand |
| | L | 7.79 | 7.91 | 5.22 | 35.00 | 0.44 | 0.75 | 1.30 | Coarse sand |
| April | H | 9.20 | 8.04 | 7.60 | 31.70 | 1.66 | 0.84 | −0.10 | Very coarse sand |
| | M | 8.39 | 8.10 | 5.94 | 31.10 | 1.32 | 0.80 | −0.21 | Very coarse sand |
| | L | 9.77 | 7.67 | 2.12 | 30.25 | 2.23 | 0.75 | −0.15 | Very coarse sand |
| July | H | 25.88 | 8.01 | 3.55 | 29.70 | 0.58 | 0.88 | 0.55 | Coarse sand |
| | M | 25.76 | 7.91 | 2.53 | 29.70 | 0.74 | 0.83 | −0.46 | Very coarse sand |
| | L | 23.66 | 7.48 | 1.70 | 29.15 | 3.99 | 0.78 | −0.34 | Very coarse sand |
| October | H | 17.07 | 8.02 | 7.65 | 31.45 | 0.08 | 0.88 | 0.31 | Coarse sand |
| | M | 17.65 | 8.01 | 6.94 | 32.00 | 0.09 | 0.83 | 0.08 | Coarse sand |
| | L | 18.59 | 7.80 | 5.05 | 29.85 | 0.56 | 0.78 | −0.12 | Very coarse sand |
Table 3.
The species primarily providing the discrimination between locations, tidal zones, and sampling months (SIMPER, cumulative contribution >90%).
Table 3.
The species primarily providing the discrimination between locations, tidal zones, and sampling months (SIMPER, cumulative contribution >90%).
| Species | December | April | July | October |
|---|
| H | M | L | H | M | L | H | M | L | H | M | L |
|---|
| XB | | | | | | | | | | | | |
| Axonolaimus sp. 1 | 5.5 | | | 7.3 | | | 7.5 | | | | | |
| Axonolaimus sp. 2 | | | | | | | 8.9 | | | | | |
| Bathylaimus sp. 1 | 6.3 | | | 12.4 | 8.3 | 11.9 | 28.1 | 28.6 | 8.3 | | | |
| Chromaspirina sp. 1 | | | | 2.5 | | | | | | | | |
| Cobbia sp. 1 | | 2.8 | | | | | | | 1.8 | | | |
| Daptonema sp. 1 | 12.3 | 33.6 | 14.4 | 11.8 | 10.5 | 13.3 | | | | 25.8 | 15.6 | 5.1 |
| Daptonema sp. 2 | 14.2 | 24.3 | 14.8 | 11.9 | 13.6 | 11.9 | 8.9 | 8.2 | 4.1 | 17.7 | 5.7 | 13.9 |
| Daptonema sp. 3 | 15.4 | | | 5.2 | 12.3 | 12.4 | | | 4.9 | | 20.9 | 17.4 |
| Daptonema sp. 5 | | | | | 3.1 | | | 3.8 | | | 5.2 | |
| Daptonema sp. 6 | | | | | | | | | 4.0 | | 12.4 | |
| Dichromadora sp. 1 | | | | 9.6 | 8.4 | 15.2 | | | | | | |
| Linhomoeus sp. 1 | | | | | | | | | 3.7 | | | |
| Metalinhomoeus sp. 1 | | | | | | | | | 3.0 | | | |
| Odontophora sp. 2 | | | | | | | | | 9.9 | | | |
| Paracomesoma sp. 1 | | | | | | | | | 3.5 | | | |
| Paracyatholaimus sp. 1 | | | 9.6 | 10.4 | 13.3 | 11.8 | 8.6 | 24.5 | 14.0 | 22.5 | 15.8 | 19.4 |
| Prochromadorella sp. 1 | 14.1 | | 13.3 | 6.6 | 10.3 | | | 8.7 | 10.5 | | | 7.1 |
| Sabatieria sp. 2 | 11.9 | | | 8.7 | 9.4 | 11.5 | 18.2 | 18.3 | 11.2 | 20.8 | 9.9 | 10.9 |
| Setosabatieria sp. 1 | | 19.1 | 15.7 | | 3.1 | 4.5 | | | 12.9 | | 5.5 | 18.2 |
| Theristus sp. 1 | 14.3 | 11.8 | 11.9 | 5.0 | | | | | | 8.3 | | |
| Viscosia sp. 1 | | | 12.9 | | | | 11.3 | | | | | |
| GB | | | | | | | | | | | | |
| Axonolaimus sp. 3 | | | | | | | | | | 34.6 | | |
| Bathylaimus sp. 1 | | | | | | | | | | 11.8 | | |
| Bathylaimus sp. 2 | | | | | | | | | | 12.7 | 24.7 | |
| Chromadorita sp. 1 | 33.7 | 25.5 | | 18.7 | 11.1 | 14.1 | | 25.2 | | 4.9 | | |
| Chromadorita sp. 2 | | | | 13.8 | | | 6.1 | | | | | |
| Daptonema sp. 1 | | | 4.7 | | | | | | | | | |
| Dichromadora sp. 1 | | | | | 21.0 | 19.5 | | 7.4 | 42.0 | | | |
| Enoplolaimus sp. 1 | 5.7 | | | 11.8 | | | 23.2 | | | 13.9 | 23.7 | 52.5 |
| Enoplolaimus sp. 2 | | | | | | | | | | | 5.8 | |
| Enoplus sp. 1 | 9.3 | | | 12.4 | 18.4 | 7.2 | | | | 5.5 | | |
| Metalinhomoeus sp. 3 | | | | 4.9 | | 6.4 | 5.9 | | | | | |
| Neochromadora sp. 1 | | 8.1 | 7.8 | | | | | | | | | |
| Oncholaimus sp. 1 | 36.4 | 58.5 | 64.4 | 18.0 | 25.5 | 15.0 | 17.9 | 30.3 | | | 5.9 | |
| Oncholaimus sp. 2 | | | 8.3 | | 8.9 | 16.5 | | 8.8 | 49.4 | | | |
| Prochromadorella sp. 1 | | | 5.5 | | | | | | | | 7.0 | |
| Promonhystera sp. 1 | | | | 12.2 | | | 37.9 | 10.5 | | 10.2 | 28.0 | 47.5 |
| Rhabditis sp. 1 | | | | | 12.4 | 14.7 | | | | | | |
| Theristus sp. 2 | 9.3 | | | | | | | 10.5 | | | | |
Table 4.
Results of the DistLM sequential test for nematode datasets. SS, sum of square; F, F statistic; Prop, the proportion of the variability explained; T, sea water temperature; Sal, sea water salinity; DO, sea water dissolved oxygen; Chl-a, Chlorophyll-a; TOM, total organic matter; MdΦ, median particle diameter. **, p < 0.01; *, p < 0.05. Statistically significant correlations are indicated in bold.
| Datasets | Variable | Adjusted R2 | SS (Trace) | Pseudo-F | p | Prop. | Cumul. |
|---|
| Species | MdΦ | 0.35361 | 50744 | 26.711 | 0.001 ** | 0.367 | 0.367 |
| | T | 0.39126 | 6878.9 | 3.8449 | 0.001 ** | 0.050 | 0.417 |
| | DO | 0.42678 | 6383.4 | 3.7891 | 0.001 ** | 0.046 | 0.463 |
| | Sal | 0.44807 | 4375 | 2.6971 | 0.008 ** | 0.032 | 0.495 |
| | Chl-a | 0.46599 | 3833.8 | 2.4428 | 0.010 ** | 0.028 | 0.523 |
| | pH | 0.47721 | 2921.3 | 1.9013 | 0.038 * | 0.021 | 0.544 |
| Feeding type | MdΦ | 0.29595 | 4940.5 | 20.757 | 0.001 ** | 0.311 | 0.311 |
| | Sal | 0.35133 | 1080.6 | 4.9277 | 0.018 ** | 0.068 | 0.379 |
| | Chl-a | 0.35991 | 346.85 | 1.6028 | 0.213 | 0.022 | 0.401 |
| | DO | 0.36772 | 329.99 | 1.5437 | 0.276 | 0.021 | 0.422 |
| c–p class | MdΦ | 0.44308 | 11106 | 38.392 | 0.001 ** | 0.455 | 0.455 |
| | Chl-a | 0.468 | 871.76 | 3.1548 | 0.037 * | 0.036 | 0.491 |
| | T | 0.48811 | 735.97 | 2.768 | 0.069 | 0.030 | 0.521 |
| | pH | 0.52019 | 982.33 | 3.9416 | 0.025 * | 0.040 | 0.561 |
| | Sal | 0.54054 | 693.15 | 2.9045 | 0.084 | 0.028 | 0.589 |
| | DO | 0.56051 | 663.97 | 2.9086 | 0.065 | 0.027 | 0.617 |
Table 5.
Results of the DistLM sequential test for nematode datasets of XB. SS, sum of square; F, F statistic; Prop, the proportion of the variability explained; T, sea water temperature; Sal, sea water salinity; DO, sea water dissolved oxygen; Chl-a, Chlorophyll-a; TOM, total organic matter; MdΦ, median particle diameter. **, p < 0.01; *, p < 0.05. Statistically significant correlations are indicated in bold.
| Datasets | Variable | Adjusted R2 | SS (Trace) | Pseudo-F | p | Prop. | Cumul. |
|---|
| Species | T | 0.14377 | 5461.1 | 4.8619 | 0.001 ** | 0.181 | 0.181 |
| | MdΦ | 0.19345 | 2491.7 | 2.355 | 0.009 ** | 0.082583 | 0.26358 |
| | Chl-a | 0.24221 | 2337.4 | 2.3512 | 0.014 * | 0.077468 | 0.34105 |
| | TOM | 0.26493 | 1560.5 | 1.6183 | 0.085 | 0.051719 | 0.39277 |
| | DO | 0.27968 | 1312.6 | 1.3891 | 0.178 | 0.043505 | 0.43627 |
| Feeding type | T | 0.072248 | 477.63 | 2.7911 | 0.052 | 0.11258 | 0.11258 |
| | MdΦ | 0.13865 | 428.33 | 2.6959 | 0.071 | 0.10096 | 0.21355 |
| | Chl-a | 0.21654 | 446.25 | 3.088 | 0.060 | 0.10519 | 0.31873 |
| | pH | 0.24107 | 230.46 | 1.6463 | 0.248 | 0.054324 | 0.37306 |
| | DO | 0.25432 | 183.99 | 1.3377 | 0.300 | 0.043369 | 0.41643 |
| | Sal | 0.26035 | 156.45 | 1.1468 | 0.336 | 0.036878 | 0.4533 |
| c–p class | Chl-a | 0.12532 | 813.26 | 4.2954 | 0.014 * | 0.16335 | 0.16335 |
| | Sal | 0.16523 | 370.75 | 2.0518 | 0.156 | 0.074469 | 0.23782 |
| | pH | 0.2073 | 362.81 | 2.1144 | 0.156 | 0.072875 | 0.31069 |
| | MdΦ | 0.25933 | 385.56 | 2.4048 | 0.118 | 0.077444 | 0.38814 |
| | T | 0.29537 | 300.75 | 1.9718 | 0.184 | 0.060409 | 0.44855 |
| | DO | 0.29929 | 166.97 | 1.1008 | 0.348 | 0.033537 | 0.48209 |
Table 6.
Results of the DistLM sequential test for nematodes datasets of GB. SS, sum of square; F, F statistic; Prop, the proportion of the variability explained; T, sea water temperature; Sal, sea water salinity; DO, sea water dissolved oxygen; Chl-a, Chlorophyll-a; TOM, total organic matter; MdΦ, median particle diameter. **, p < 0.01; *, p < 0.05. Statistically significant correlations are indicated in bold.
| Datasets | Variable | Adjusted R2 | SS (trace) | Pseudo-F | p | Prop. | Cumul. |
|---|
| Species | Sal | 0.091863 | 7340.8 | 3.3266 | 0.002 ** | 0.13135 | 0.13135 |
| | DO | 0.18032 | 6720.7 | 3.3742 | 0.002 ** | 0.12025 | 0.2516 |
| | T | 0.26204 | 5963.2 | 3.3255 | 0.002 ** | 0.1067 | 0.3583 |
| | pH | 0.27664 | 2467.4 | 1.4037 | 0.193 | 0.044148 | 0.40244 |
| | Chl-a | 0.28886 | 2292 | 1.3264 | 0.195 | 0.04101 | 0.44345 |
| Feeding type | Sal | 0.035052 | 782.95 | 1.8355 | 0.162 | 0.077006 | 0.077006 |
| | T | 0.13367 | 1342 | 3.5043 | 0.033 * | 0.132 | 0.209 |
| | pH | 0.13633 | 406.54 | 1.0648 | 0.362 | 0.039985 | 0.24899 |
| c–p class | Chl-a | 0.094041 | 1838.5 | 3.3875 | 0.027 * | 0.13343 | 0.13343 |
| | T | 0.19001 | 1750.1 | 3.6066 | 0.019 * | 0.12701 | 0.26044 |
| | DO | 0.23754 | 1054.7 | 2.309 | 0.099 | 0.076546 | 0.33699 |
| | pH | 0.2515 | 615.75 | 1.3732 | 0.271 | 0.044689 | 0.38168 |
| | MdΦ | 0.26062 | 546.69 | 1.2342 | 0.311 | 0.039676 | 0.42135 |
| | TOM | 0.27757 | 615.58 | 1.4223 | 0.274 | 0.044676 | 0.46603 |
| | Sal | 0.29318 | 582.43 | 1.3755 | 0.282 | 0.04227 | 0.5083 |


