Article

Spatial Distribution and Ecological Risk Assessment of Heavy Metals in the Sediment of a Tropical Mangrove Wetland on Hainan Island, China

1
School of Earth Sciences and Engineering, Hohai University, Nanjing 210098, China
2
Hainan Key Laboratory of Marine Geological Resources and Environment, Haikou 570206, China
3
Hainan Geological Survey Institute, Haikou 570206, China
*
Authors to whom correspondence should be addressed.
Water 2022, 14(22), 3785; https://doi.org/10.3390/w14223785
Submission received: 16 October 2022 / Revised: 14 November 2022 / Accepted: 17 November 2022 / Published: 21 November 2022
(This article belongs to the Section Water Quality and Contamination)

Abstract

:
Mangroves have a high ecological service value and play an important role in achieving carbon neutrality. However, mangrove wetland soil quality is constantly being affected, and the ecological services provided are gradually declining due to the threat of various pollutants, especially heavy metal pollution. Exploring the sources and ecological risks of heavy metals in mangrove sediments will be helpful in improving mangrove protection. In 2020, sediments were collected from terrestrial and aquatic areas of Dongzhai Harbor mangrove wetland in Hainan, China, and were analyzed for the concentrations of nine heavy metals (As, Cd, Cr, Cu, Hg, Pb, Ni, Zn, Co). The results showed that there were obvious spatial distributions of heavy metals in sediments. The high concentrations of heavy metals occurred largely in terrestrial areas and in 0–20 cm of the sediment surface layer. Correlation analysis and cluster analysis indicated that As mainly originated from ships and aquaculture in the harbor waters, Cd and Hg from agriculture, Cr, Cu, Ni, Zn and Co from the weathering of parent rocks, and Pb from soot emitted from metal smelters and automobile exhaust. The individual potential ecological risk index (Eir) indicated that contaminating elements were mainly Cd and Hg. The potential ecological risk index (RI) and multiple probable effect concentrations quality (mPECQs) indicated that the areas with high heavy metal concentration and the 0–20 cm range of sediment surface layer were more susceptible to heavy metal contamination. Although there were no obvious ecological risks in the area, these results could facilitate the understanding of the distribution of heavy metal pollution in mangroves and provide information to achieve sustainable development of mangroves.

1. Introduction

Mangrove forests usually grow in intertidal areas of warm temperate, subtropical and tropical coastlines [1,2]. Mangrove ecosystems are of great importance in coastal protection [3], biological survival [4] and socio-economic development. Because of the combined effect of marine and terrestrial ecosystems, mangrove forests contribute significantly to carbon sequestration and emission reduction as well as promoting the accumulation of various substances, including heavy metals. Thus, mangrove wetland has also become important as a long-term carbon sink [5]. However, in the past few decades, mangrove wetlands have received a large number of different pollutants from human activities. Although forest systems are able to receive a lot of pollutants carried by tides, rivers and surface runoff, they also have become an important contamination source [6]. Among all the types of pollutants, heavy metals are extremely difficult to be biodegraded [7]. Although many metals are biologically essential elements, they also have a potential toxicity to biota if their concentrations surpass certain thresholds [8]. For example, Cd pollution causes retarded growth or even death of plants [9]; excessive Mn causes damage to plant chloroplasts [10]. In addition, heavy metal pollution is characterized as a long-term and insidious problem [11]. Consequently, heavy metals are considered the most toxic pollutants in the ecosystem, which have attracted widespread attention worldwide and are also listed as priority pollutants for monitoring and control [12,13].
Hainan Island is located in the southernmost part of China, with a tropical maritime monsoon climate. The wetlands in Hainan not only have the richest and most diverse mangrove forests and hundreds of rare animal species [14], but also play an important role in shoreline stability, biodiversity conservation, sediment preservation, and storm protection [15]. Over the past half-century, the coastal areas of Hainan have experienced tremendous population growth, and the economic industries such as agriculture, aquaculture, and tourism have flourished, greatly contributing to Hainan’s economy [16]. However, the consequent pollution has also posed a huge health threat to Hainan’s environment, especially to the unique mangrove ecosystem. Studies have shown that changes in land use patterns were significantly and positively correlated with the distribution of heavy metal deposition in mangrove wetlands [17]. Li et al. [18] also concluded that transformations of land use in mangrove forests on Hainan Island have altered the accumulation capacity of sediments for heavy metals and brought different degrees of heavy metal pollution to wetlands. In recent years, studies on heavy metals in Hainan sediments have mostly focused on cities, rivers, farmlands and other areas, but few were conducted on mangrove wetlands [19,20,21]. Additionally, most studies on heavy metals focus on the surface layer of sediments, while studies on the distribution and ecological risks of heavy metals in sediment profiles are not common [22,23,24]. Thus, it is of great importance to pay attention to the spatial distribution of heavy metals in sediments, to explore the impact of heavy metals in sediments on the environment, and to investigate the main sources of heavy metals in sediments for the protection of wetland ecology and the sustainable development of coastal areas.
In this study, major heavy metal pollutants (As, Cd, Cr, Cu, Hg, Pb, Ni, Zn and Co) in the mangrove sediments of Dongzhai Harbor, Hainan Province, are analyzed. The main purposes are to determine the spatial distribution, main sources, and ecological risks of heavy metals in mangrove wetland sediments in Dongzhai Harbor, Hainan, with a view to providing a scientific basis for heavy metal pollution control and ecosystem protection in mangroves.

2. Materials and Methods
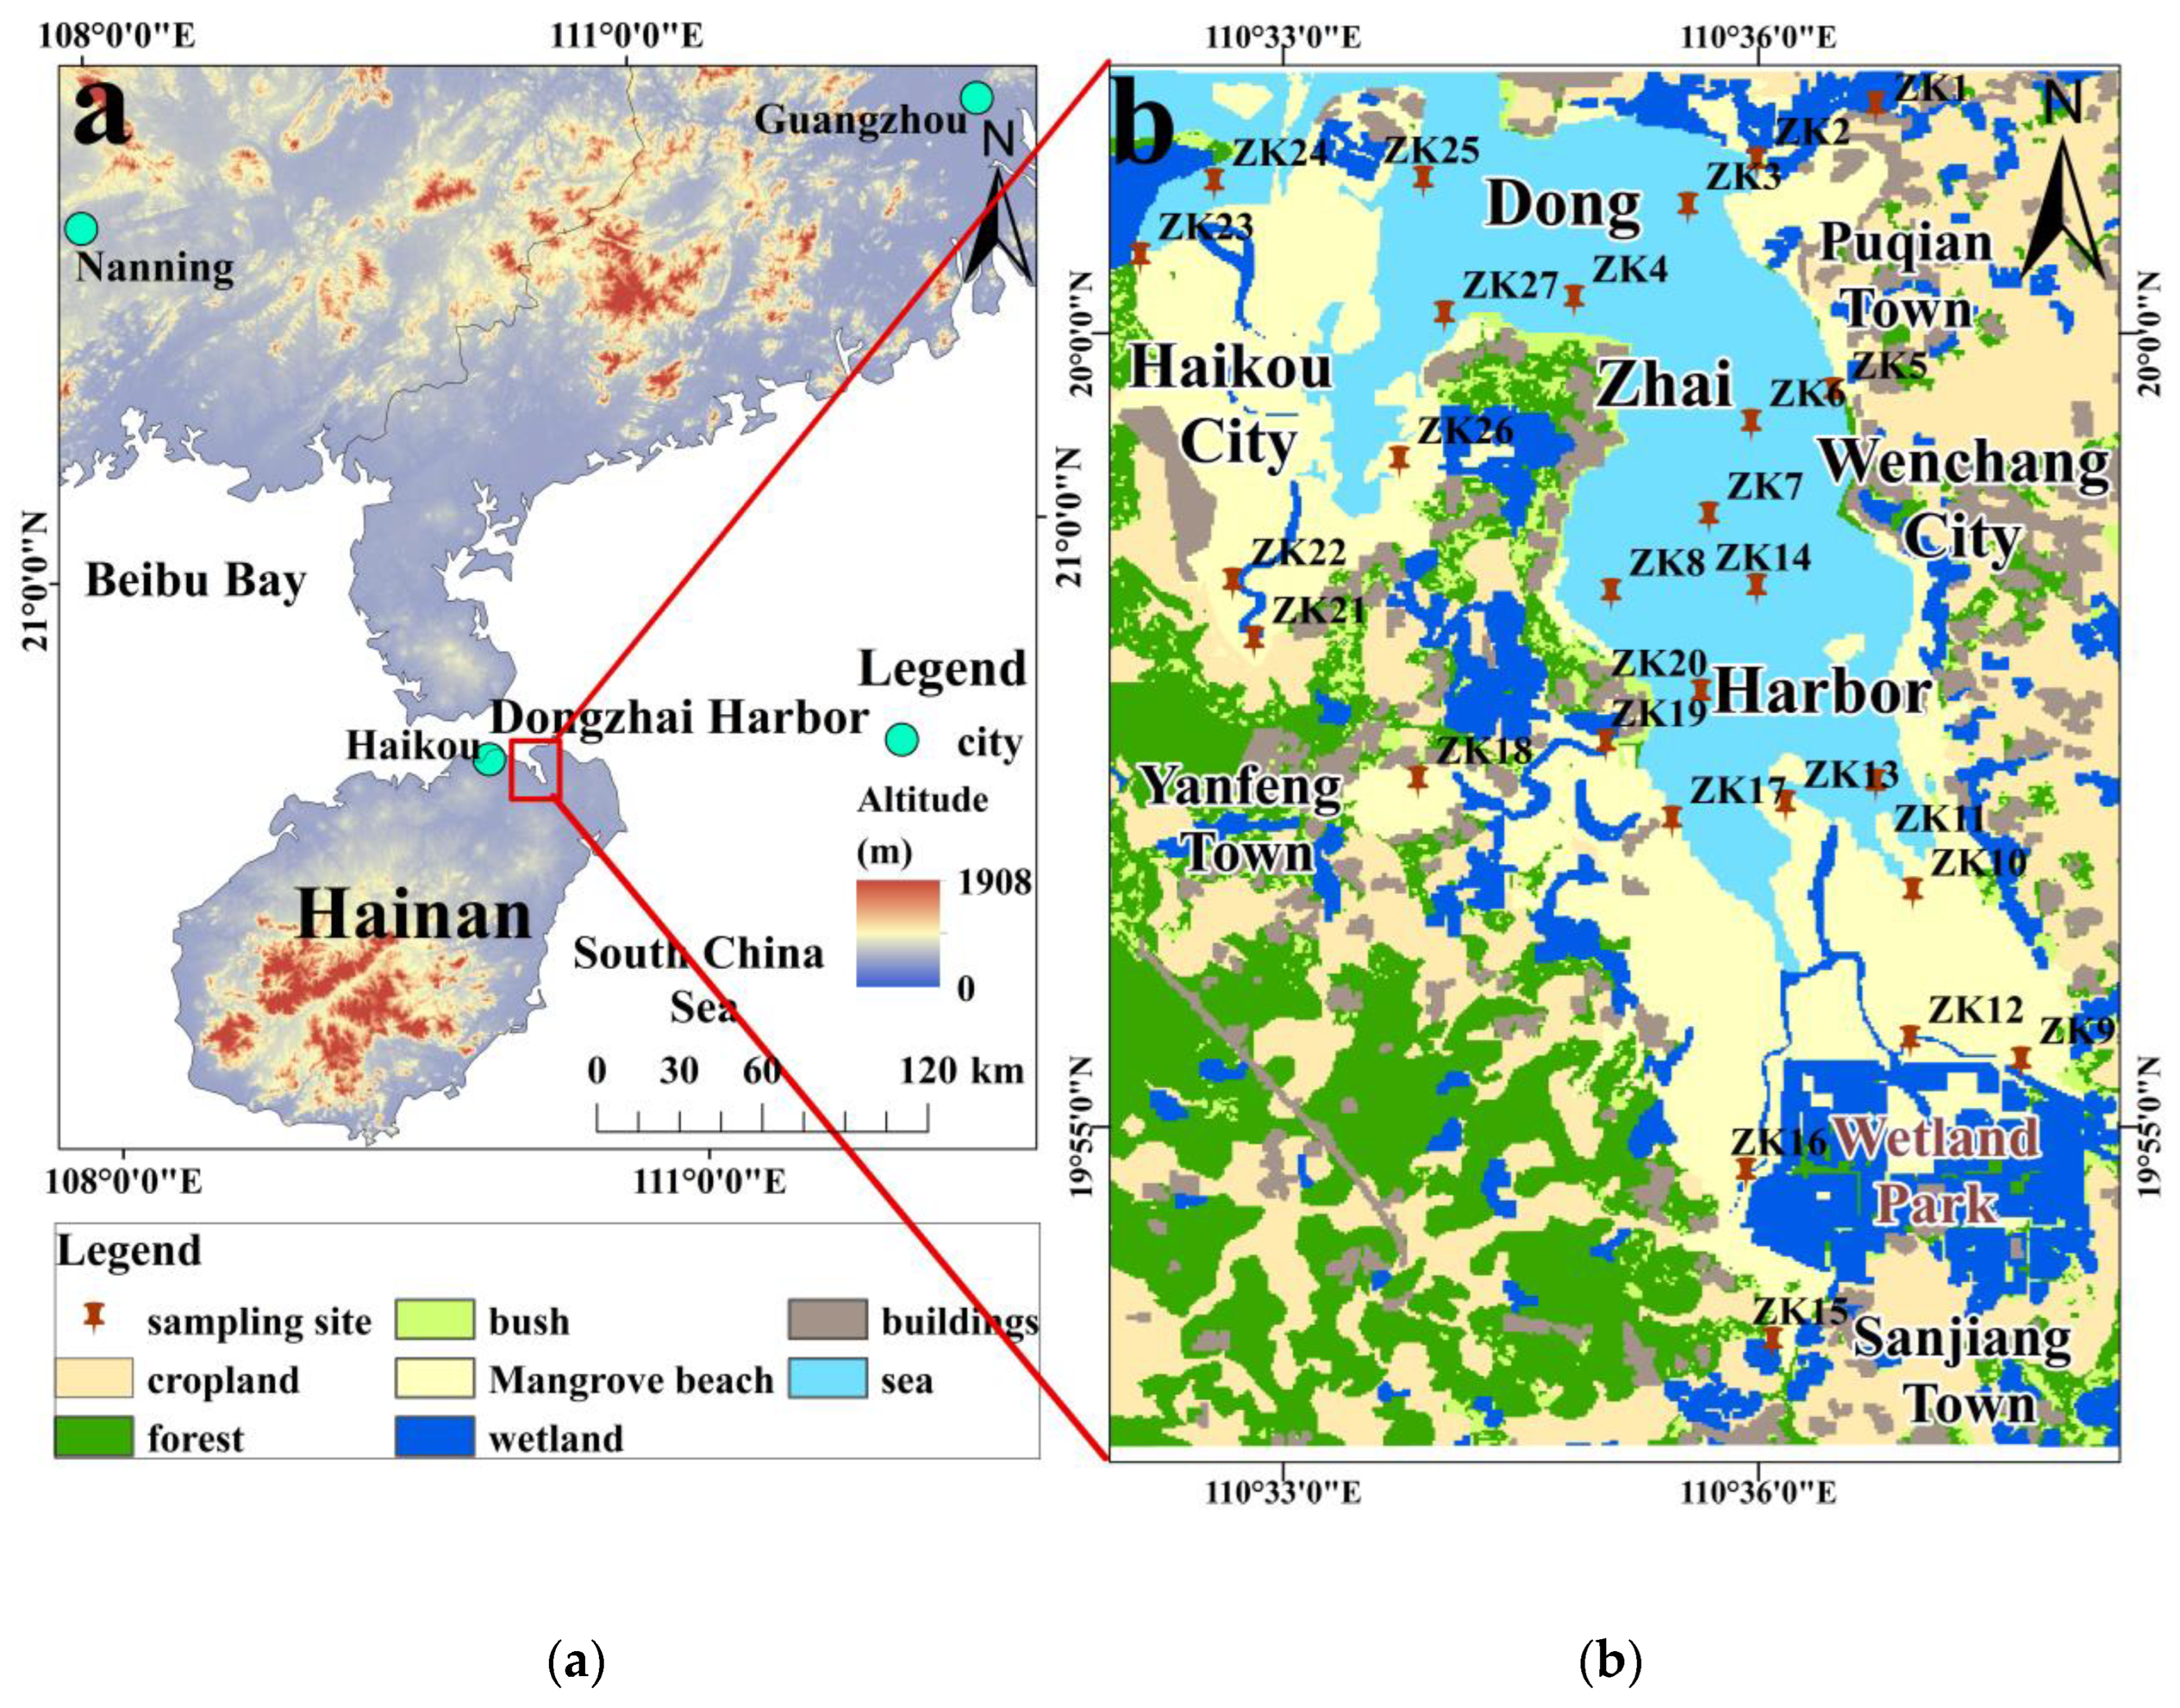
2.1. Study Area

Dongzhai Harbor mangrove wetland is located in the northeastern area of Hainan Province, the southernmost part of China (Figure 1). The area has a tropical maritime monsoon climate with an average annual temperature of 17.1 °C, an average annual temperature of the seawater surface layer of 24.5 °C, an average annual precipitation of 1676 mm, irregular all-day tides, and an average tidal difference of about 1 m. The wetland is low-lying, and the river brings sediments into the harbor from the east, west, and south directions. The mudflats formed by the sediments provide habitats for the ecosystem and also provide conditions for the enrichment of heavy metals [25]. The topography along the coast of the harbor is flat, and the lithology is mainly granitic [19,26]. The area is mainly distributed with loose quaternary sediments, which are the main source of sediments in the harbor [26]. The total area within the wetland is about 360 km2, and the main land use types are: cropland field, dry land, orchard, forest land, construction land, mudflat river. The land use in the wetland has the largest proportion of agricultural lands and forest areas, the second largest area of rivers and mudflats, and the smallest proportion of construction lands.

2.2. Sample Collection and Analysis

Field surveys were conducted, and 27 sampling sites (ZK1-ZK27) were set up in 2020. Sampling positions covered marine areas and wetland areas (Figure 1). A stainless steel static gravity corer with polyvinyl chloride (PVC) pipe (8 cm I. D.) was employed to collect samples at 10 cm intervals within a depth of 100 cm at each sampling site. A total of 270 sediment samples were collected. Samples were sealed in bags and transported cold to the laboratory for analysis.
The analytical tests included the grain size of sediment, Corg (organic carbon), pH, and presence of As, Cd, Cr, Cu, Pb, Hg, Ni, Zn, Co, Al2O3, N, P. The air-dried sediment samples were passed through a 2 mm screen to remove larger particles. Organic carbon and pH were determined for each soil and sediment sample. The concentration of organic carbon in the sediment sample was measured on an elemental analyzer (VarioMacro-CHNS, Hanau, Germany) with a precision of 0.5%. The pH was determined with a Delta 320 pH meter (Mettler Toledo Delta 320, Mettler-Toledo Inc., Greifensee, Switzerland). For elements determined by an inductively coupled plasma mass spectrometer (ICP-MS), the sample was decomposed using a mixture of HF, HNO3, HClO4 and aqua regia. The heavy metal content was determined using Thermo Fisher iCAP RQ ICP-MS. X-ray fluorescence spectrometry (XRF) was used for the determination of Al2O3, N, and P. The analyzed data was assessed for accuracy and precision using quality assurance and quality control (QA/QC) measures, which included reagent blanks, duplicate samples and certified reference materials. The detailed analytical procedures are introduced by Li et al. [27].

2.3. Statistical Analysis

To test the data suitability for principal components, the Kaiser-Meyer-Olkin (KMO) test was performed. The KMO test calculates sampling adequacy, which is the proportion of variance among the variables under investigation that may be a normal variance. The pattern of toxic metals in sediments was assessed by cluster analysis from the Euclidean distance matrix, and this pattern was dispatched by a heat map. Arcgis 10.7 was used to determine the spatial concentration distribution of heavy metals. The distribution patterns of heavy metals in sediments were evaluated by Origin Pro 2021.

2.4. Risk Assessment Methods

The individual potential ecological risk index (Eir), the potential ecological risk index (RI), and the multiple probable effect concentrations quality (mPECQs) were used to evaluate the ecological risk. The methods are detailed in Table 1.

3. Results

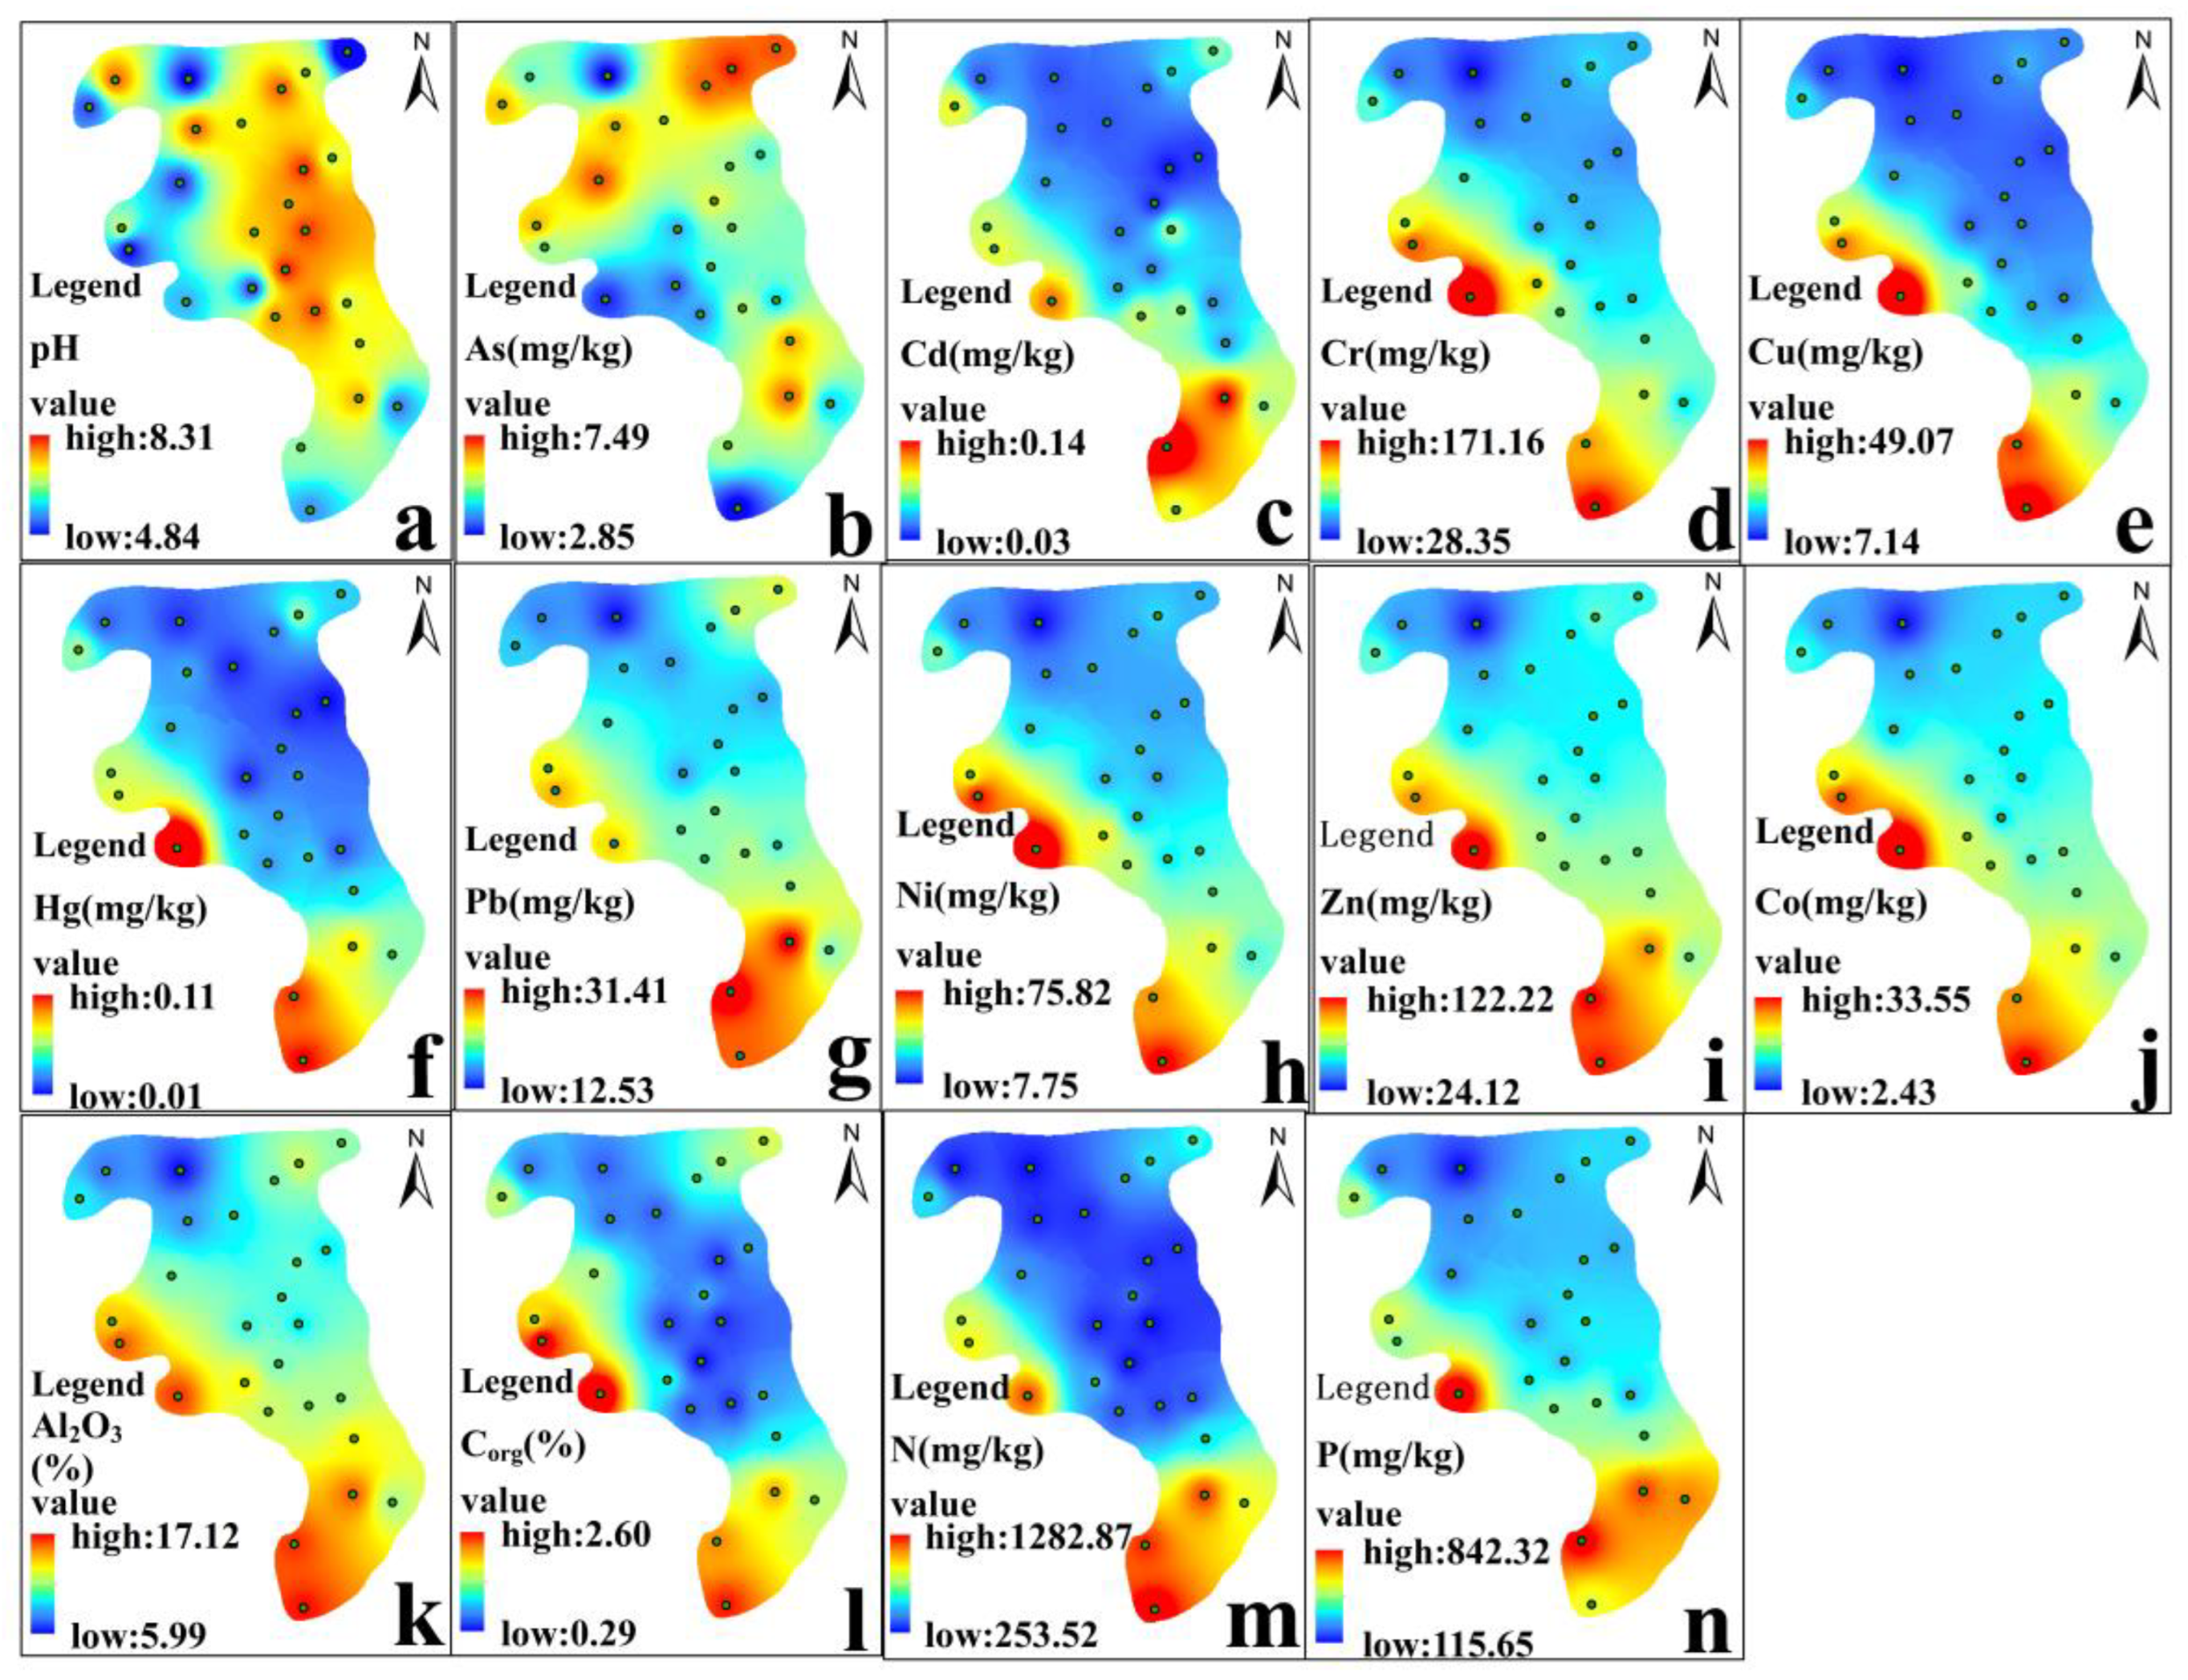
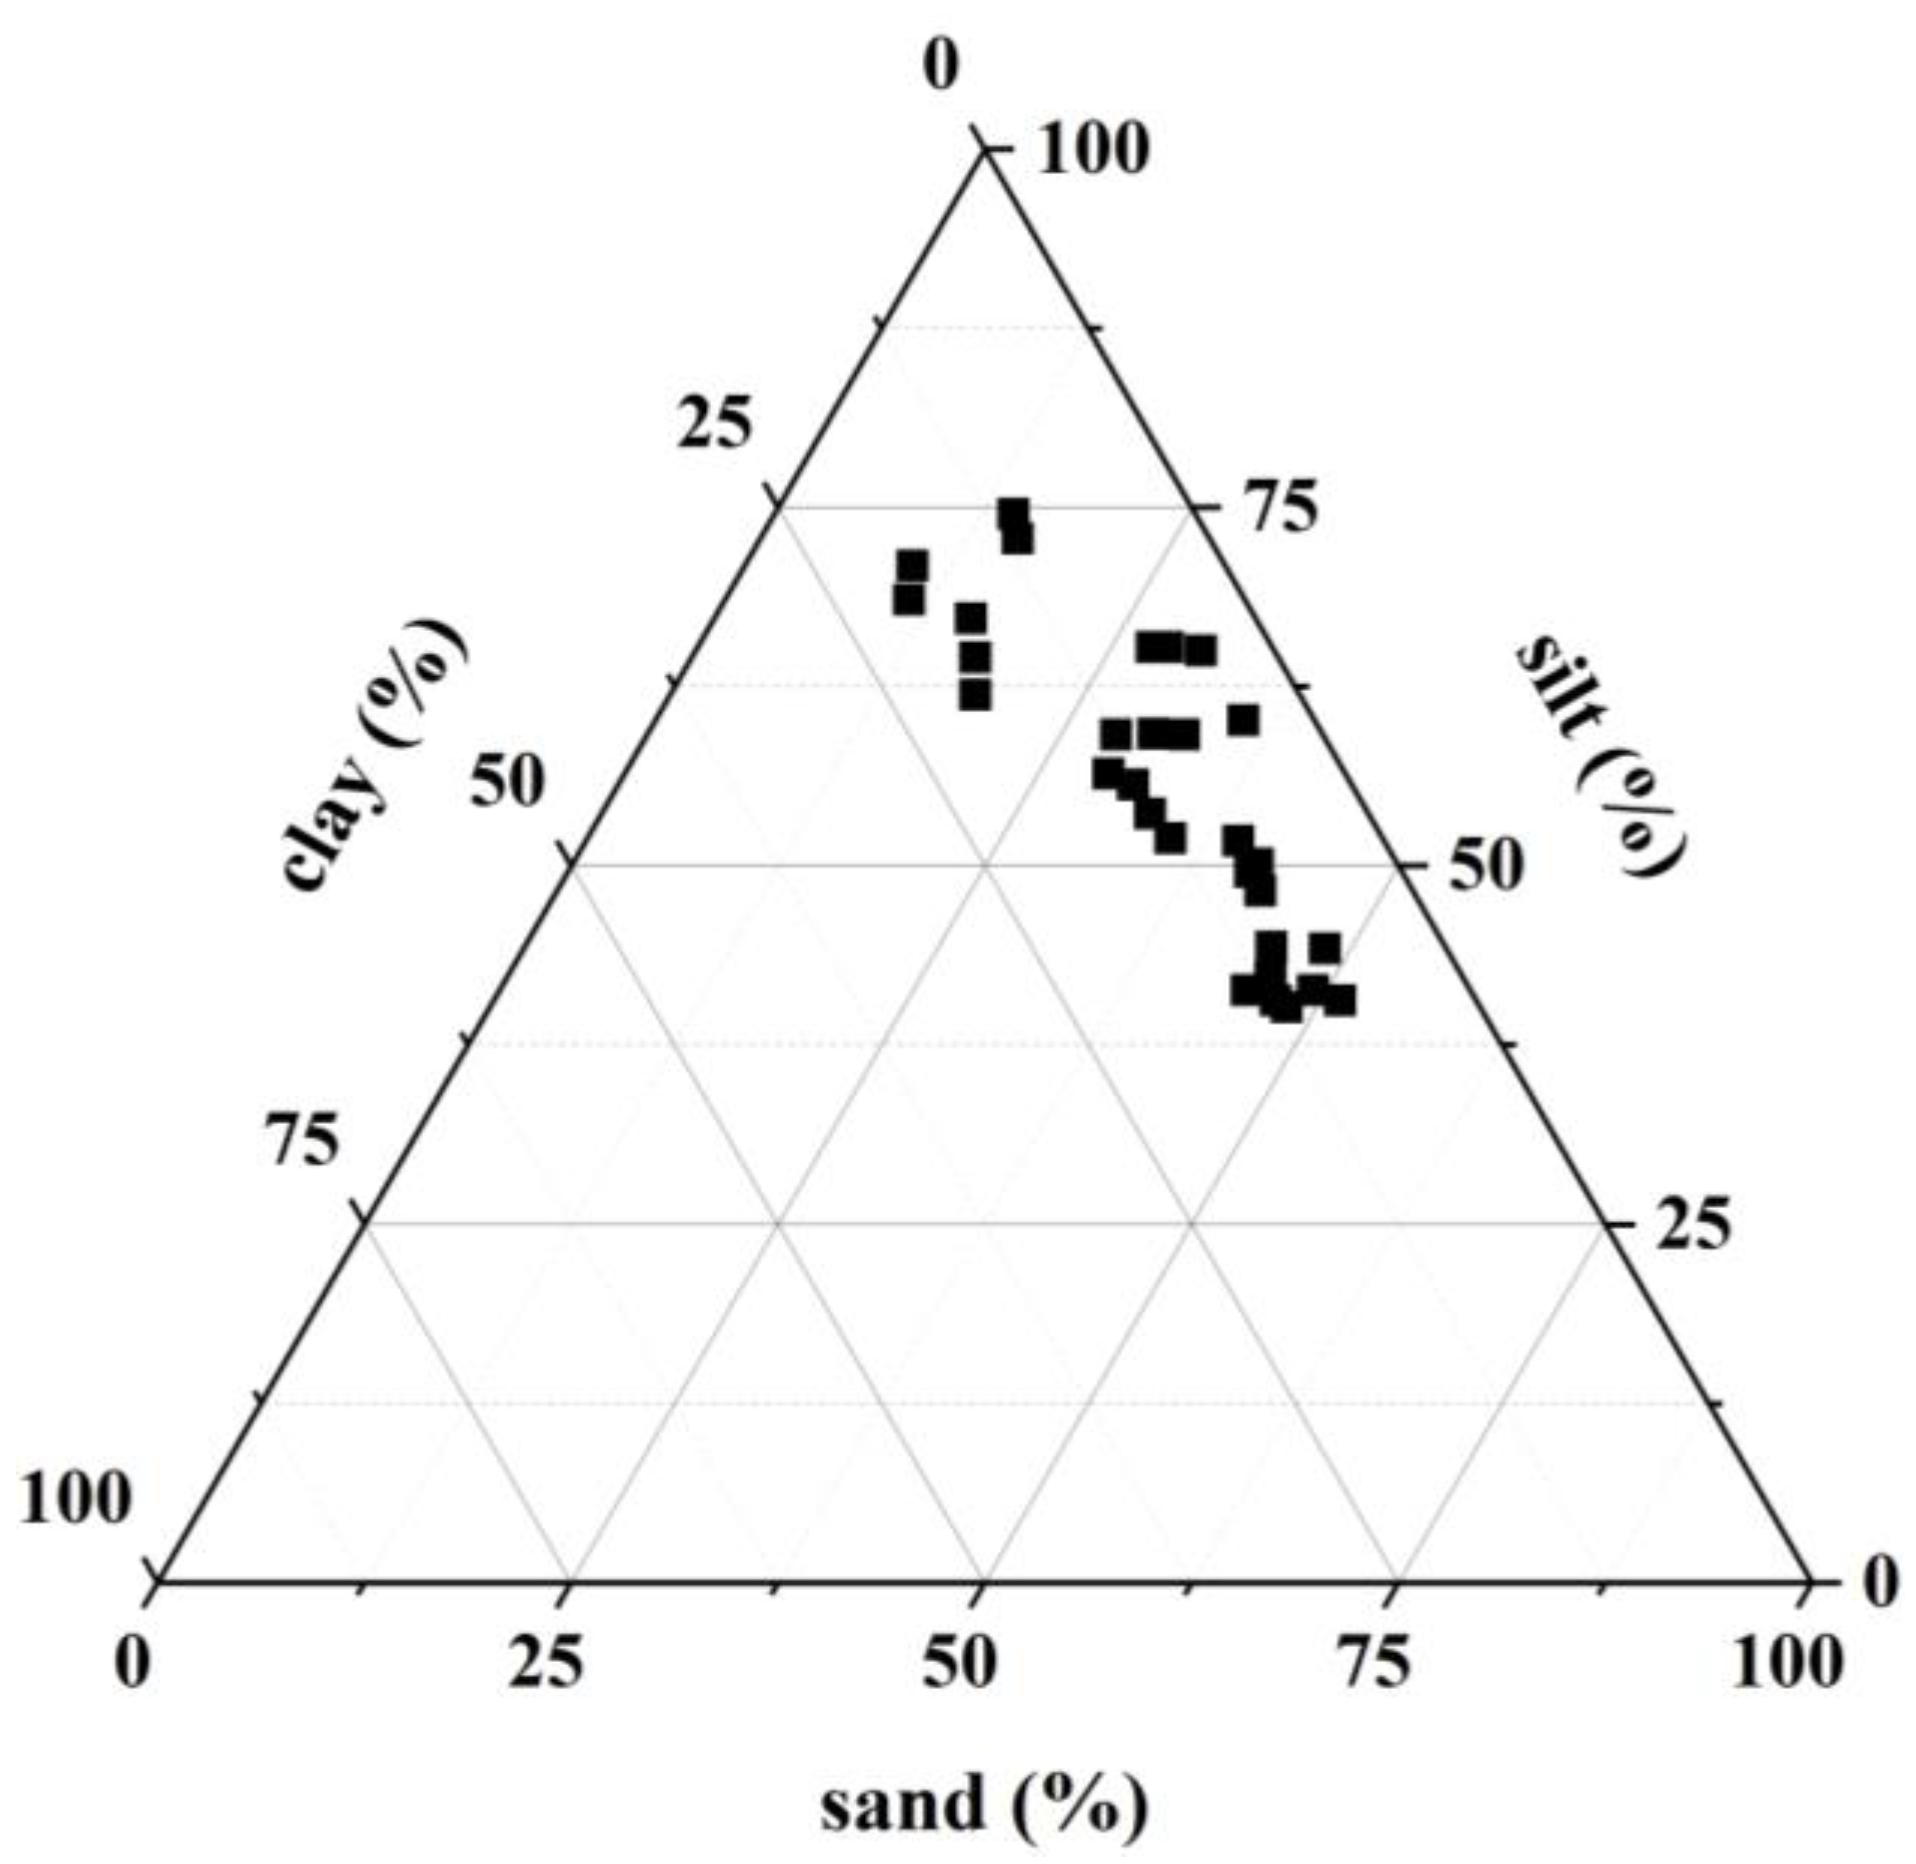
3.1. Spatial Distribution of Physico-Chemical Properties

The pH in sediments ranged from 4.84 to 8.32, with a mean value of 6.95 and was weakly alkaline overall. The coefficient of variation for pH was 15.86%, with little spatial differentiation terrestrially (Table 2). The pH was higher in sea areas and lower in terrestrial areas (Figure 2).
The overall distribution of organic carbon (Corg), N, and P content (concentration range, mean) in the sediments was 0.29% to 2.6%, 1.06%; 253.5 to 1282.90 mg/kg, 548.22 mg/kg; 115.61 to 842.35 mg/kg, 377 mg/kg, respectively. The coefficient of variation of the nutrients was 63.63%, 61.02%, 47.92%, respectively, with all three types of nutrients in strong variations, indicating that they were greatly influenced by the environment [31] (Table 2). It was shown by the spatial distribution that nutrients were enriched mainly in the vicinity of forests and the wetland park (Figure 2).
The clay mineral Al2O3 is not only an important component of fine-grained clay in sediments, with percentage content representing the relative content of clay grain classes, but also a product of physical weathering of continental rocks, which can be used as a source indicator [32]. The overall distribution of Al2O3 content in the sediments ranged from 5.99 to 17.12%, with a mean value of 11.72%. The coefficient of variation of Al2O3 was 25.35% (Table 2). Spatially, the content of Al2O3 was higher in the forests and the wetland park than in agricultural lands and waters, and the maximum difference could be nearly 11% (Figure 2).
The content of sand, silt, and clay ranged from 10.21% to 90.20%, 7.21% to 74.50%, and 2.60% to 20.30%, respectively; the mean ranking was silt (55.96%) > sand (32.56%) > clay (11.48%). The wetland sediments were mainly composed of silt and sand (Table 2, Figure 3).

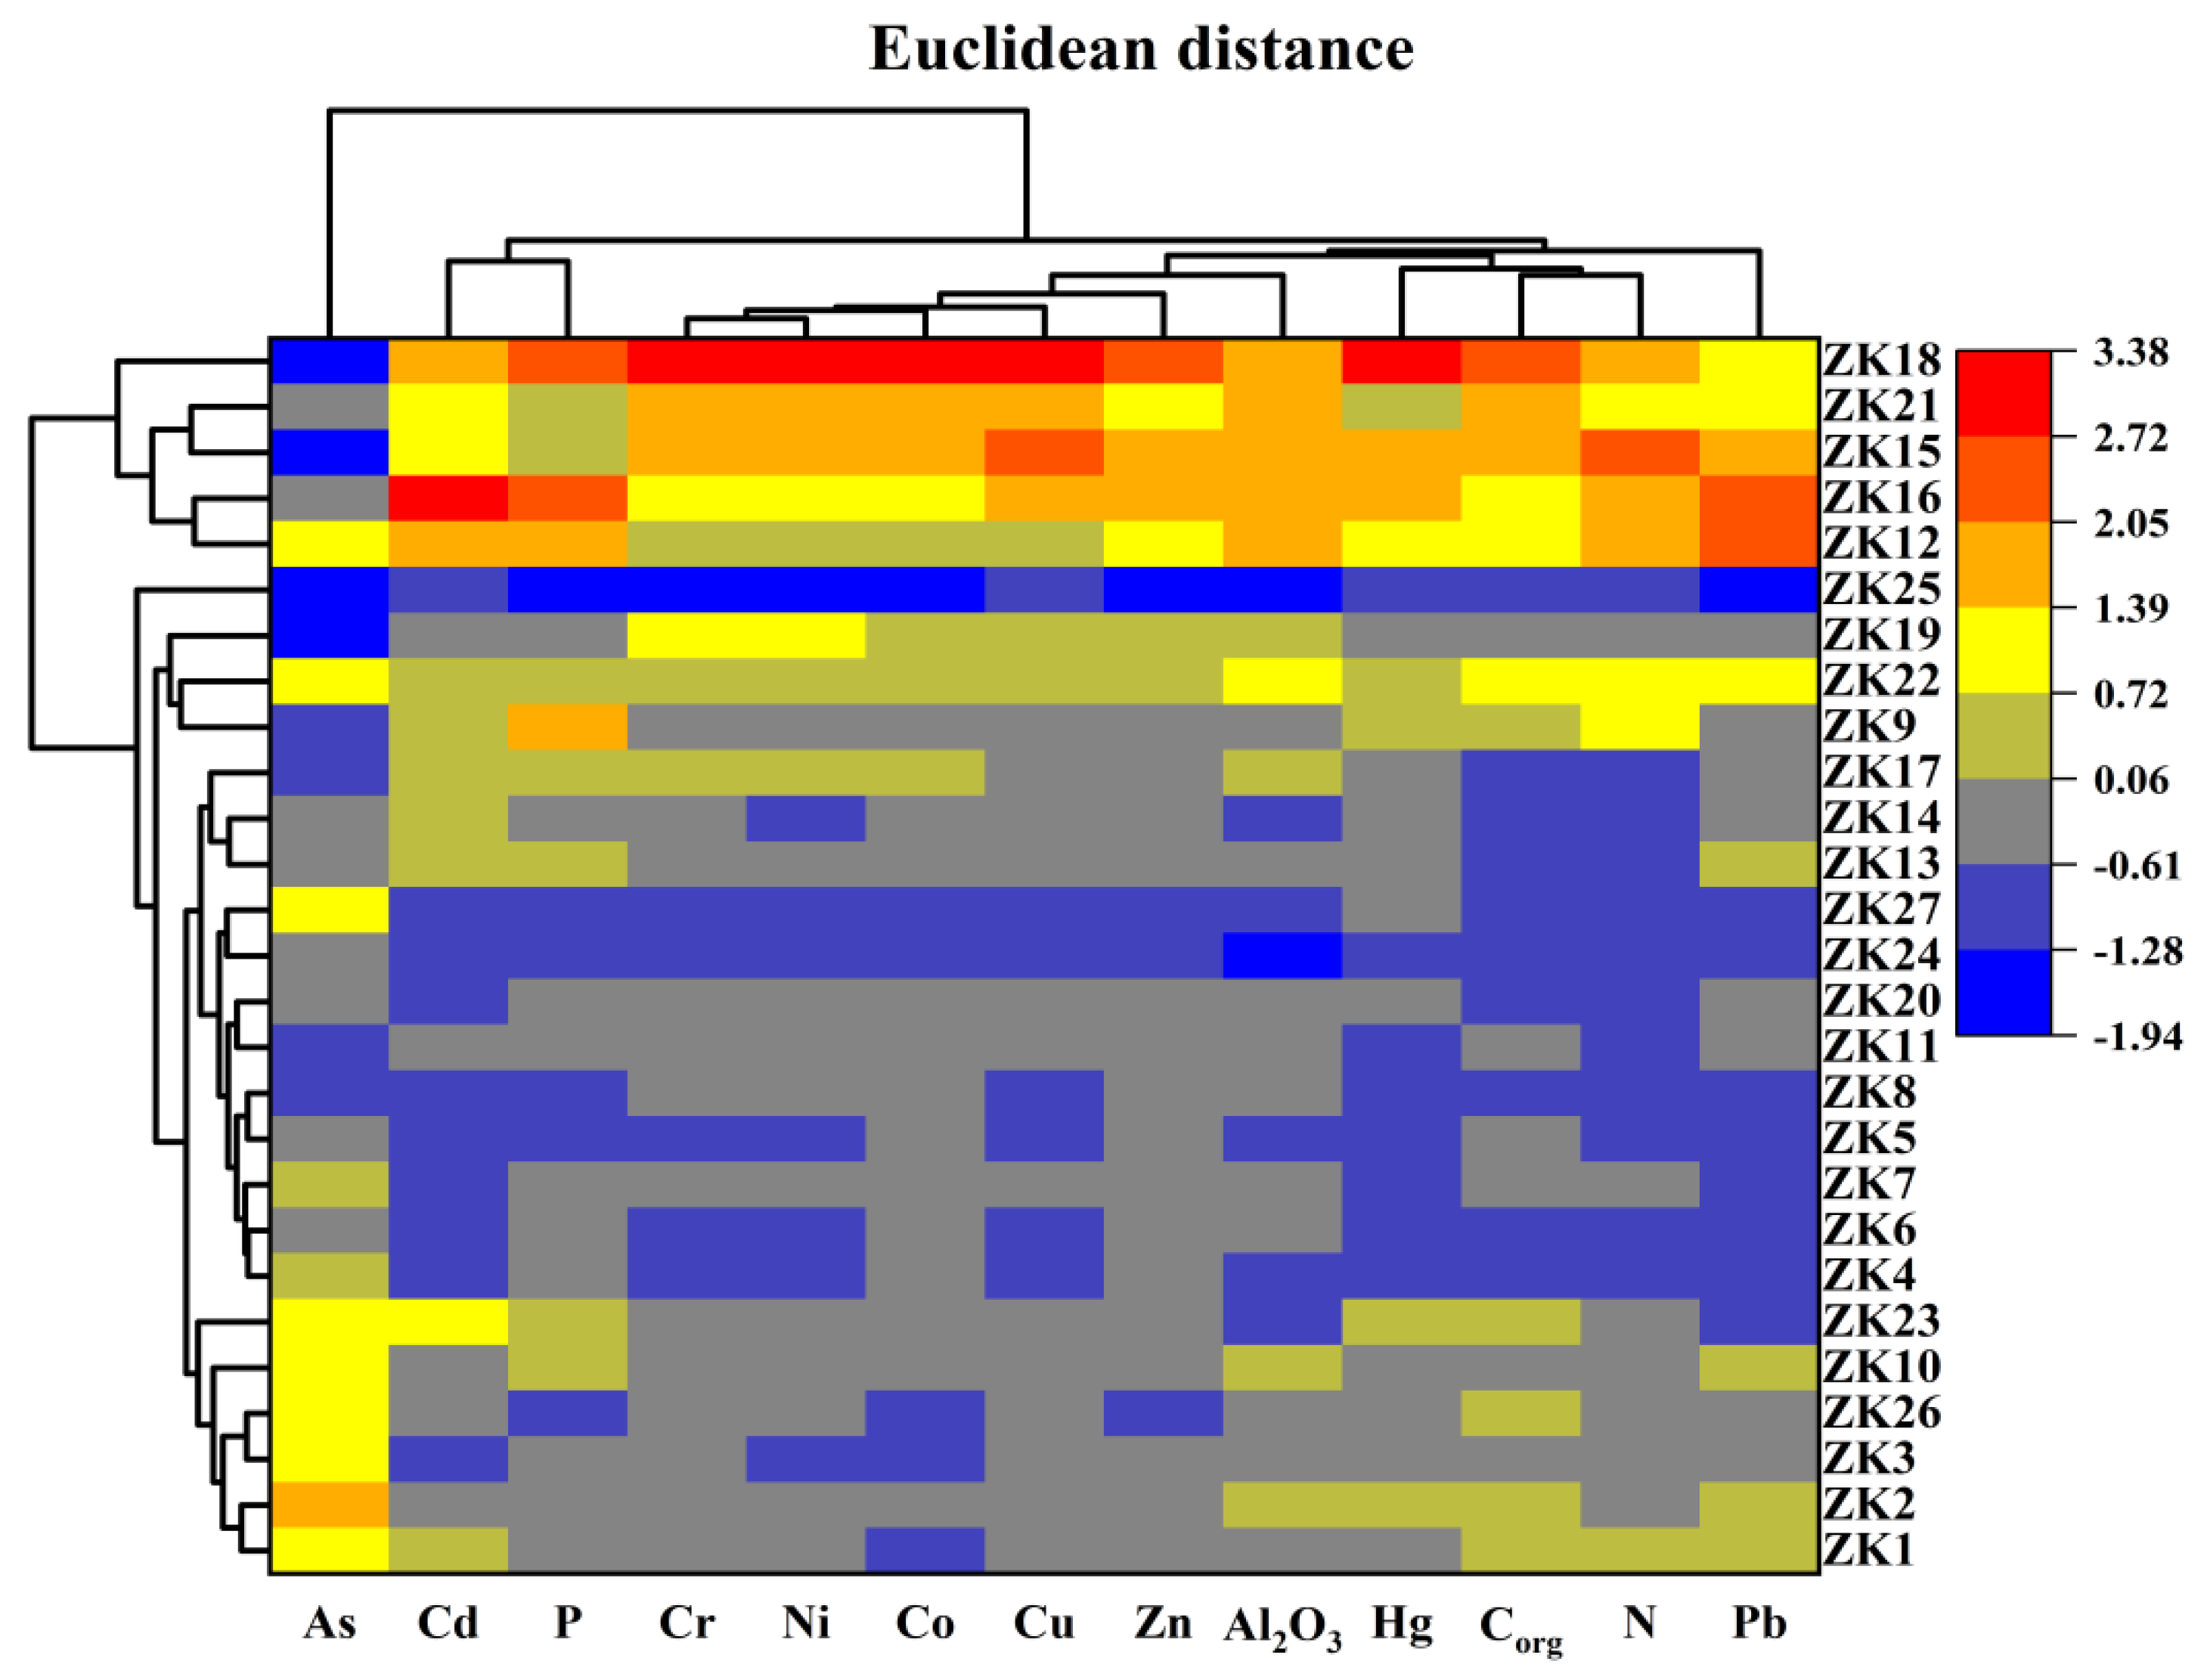
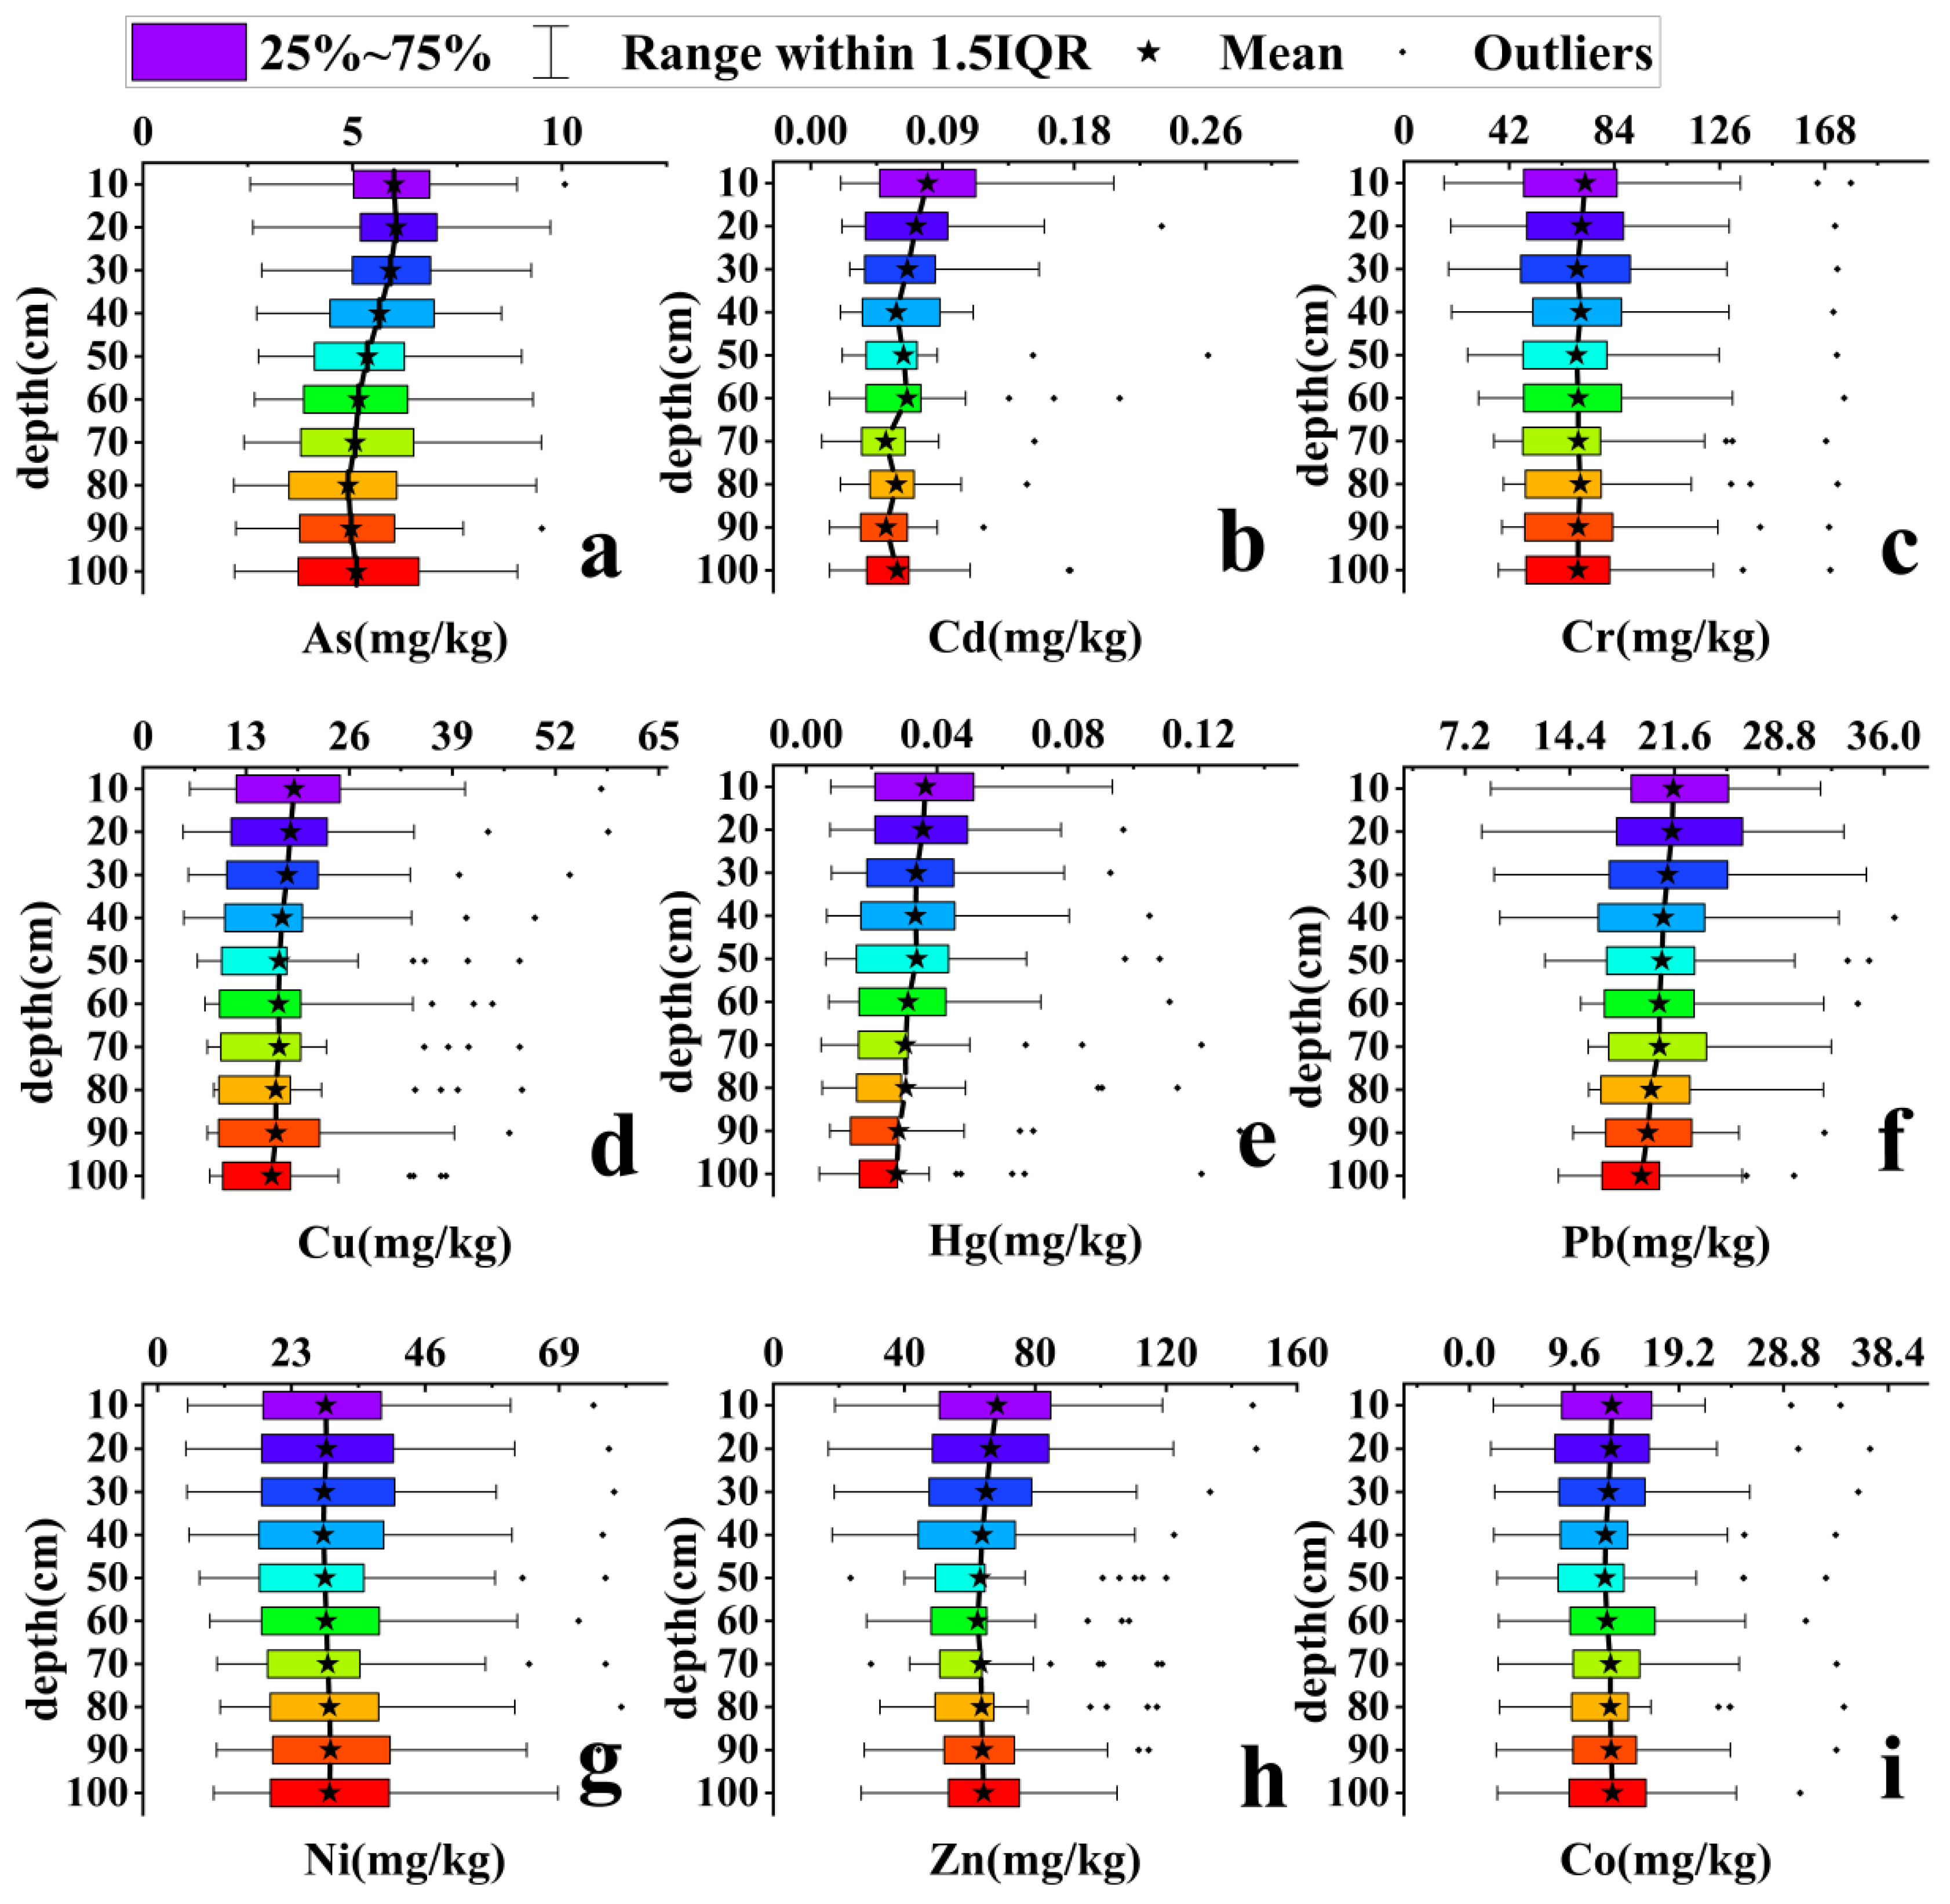
3.2. Spatial Distributions of Heavy Metals

In the horizontal dimension (Table 2, Figure 2), the concentrations (mg/kg) of As, Cd, Cr, Cu, Hg, Pb, Ni, Zn, and Co in the sediments (concentration range, mean) were 2.85–7.49, 5.29; 0.03–0.14, 0.06; 28.34–171.16, 70.03; 7.14–49.07, 17.45; 0.01–0.11, 0.03; 12.53–31.41, 20.58; 7.47–75.82, 29.08; 24.11–122.23, 64.42; 2.43–33.55, 12.82, respectively, with the ranking from largest to smallest being Cr > Zn > Ni > Pb > Cu > Co > As > Cd > Hg. The coefficient of variation (CV) of the nine heavy metals (%) was 26.54, 46.35, 46.52, 60.60, 71.55, 22.58, 55.23, 36.00 and 51.90, respectively, indicating that all the heavy metals were subject to different degrees of external environmental influences (Table 2) [31]. The spatial distribution of heavy metals showed higher concentrations of Cd, Cr, Cu, Hg, Pb, Ni, Zn, and Co in terrestrial areas than in the water. They were mainly distributed in forests and near the wetland park, with a similar spatial distribution of Corg, N, P and Al2O3. The spatial distribution of As content differed from the other eight heavy metals and was mainly distributed near the sea and coast (Figure 2).
In the vertical profile (Table 3, Figure 4), the concentrations (mg/kg) of As, Cd, Cr, Cu, Hg, Pb, Ni, Zn, and Co ranged from 4.73–5.98, 0.05–0.08, 68.87–72.27, 16.22–19.04, 0.03–0.04, 19.33–21.52, 28.49–29.71, 62.36–68.30 and 12.42–13.11, respectively. The distributions of heavy metals were relatively flat, but the concentrations of heavy metals were high within 0–20 cm. The coefficients of variation (CV) (%) for the heavy metals were 9.36, 14.11, 1.45, 5.08, 9.32, 3.46, 1.42, 2.72 and 1.88, respectively, and each element was less influenced by the environment.

4. Discussion

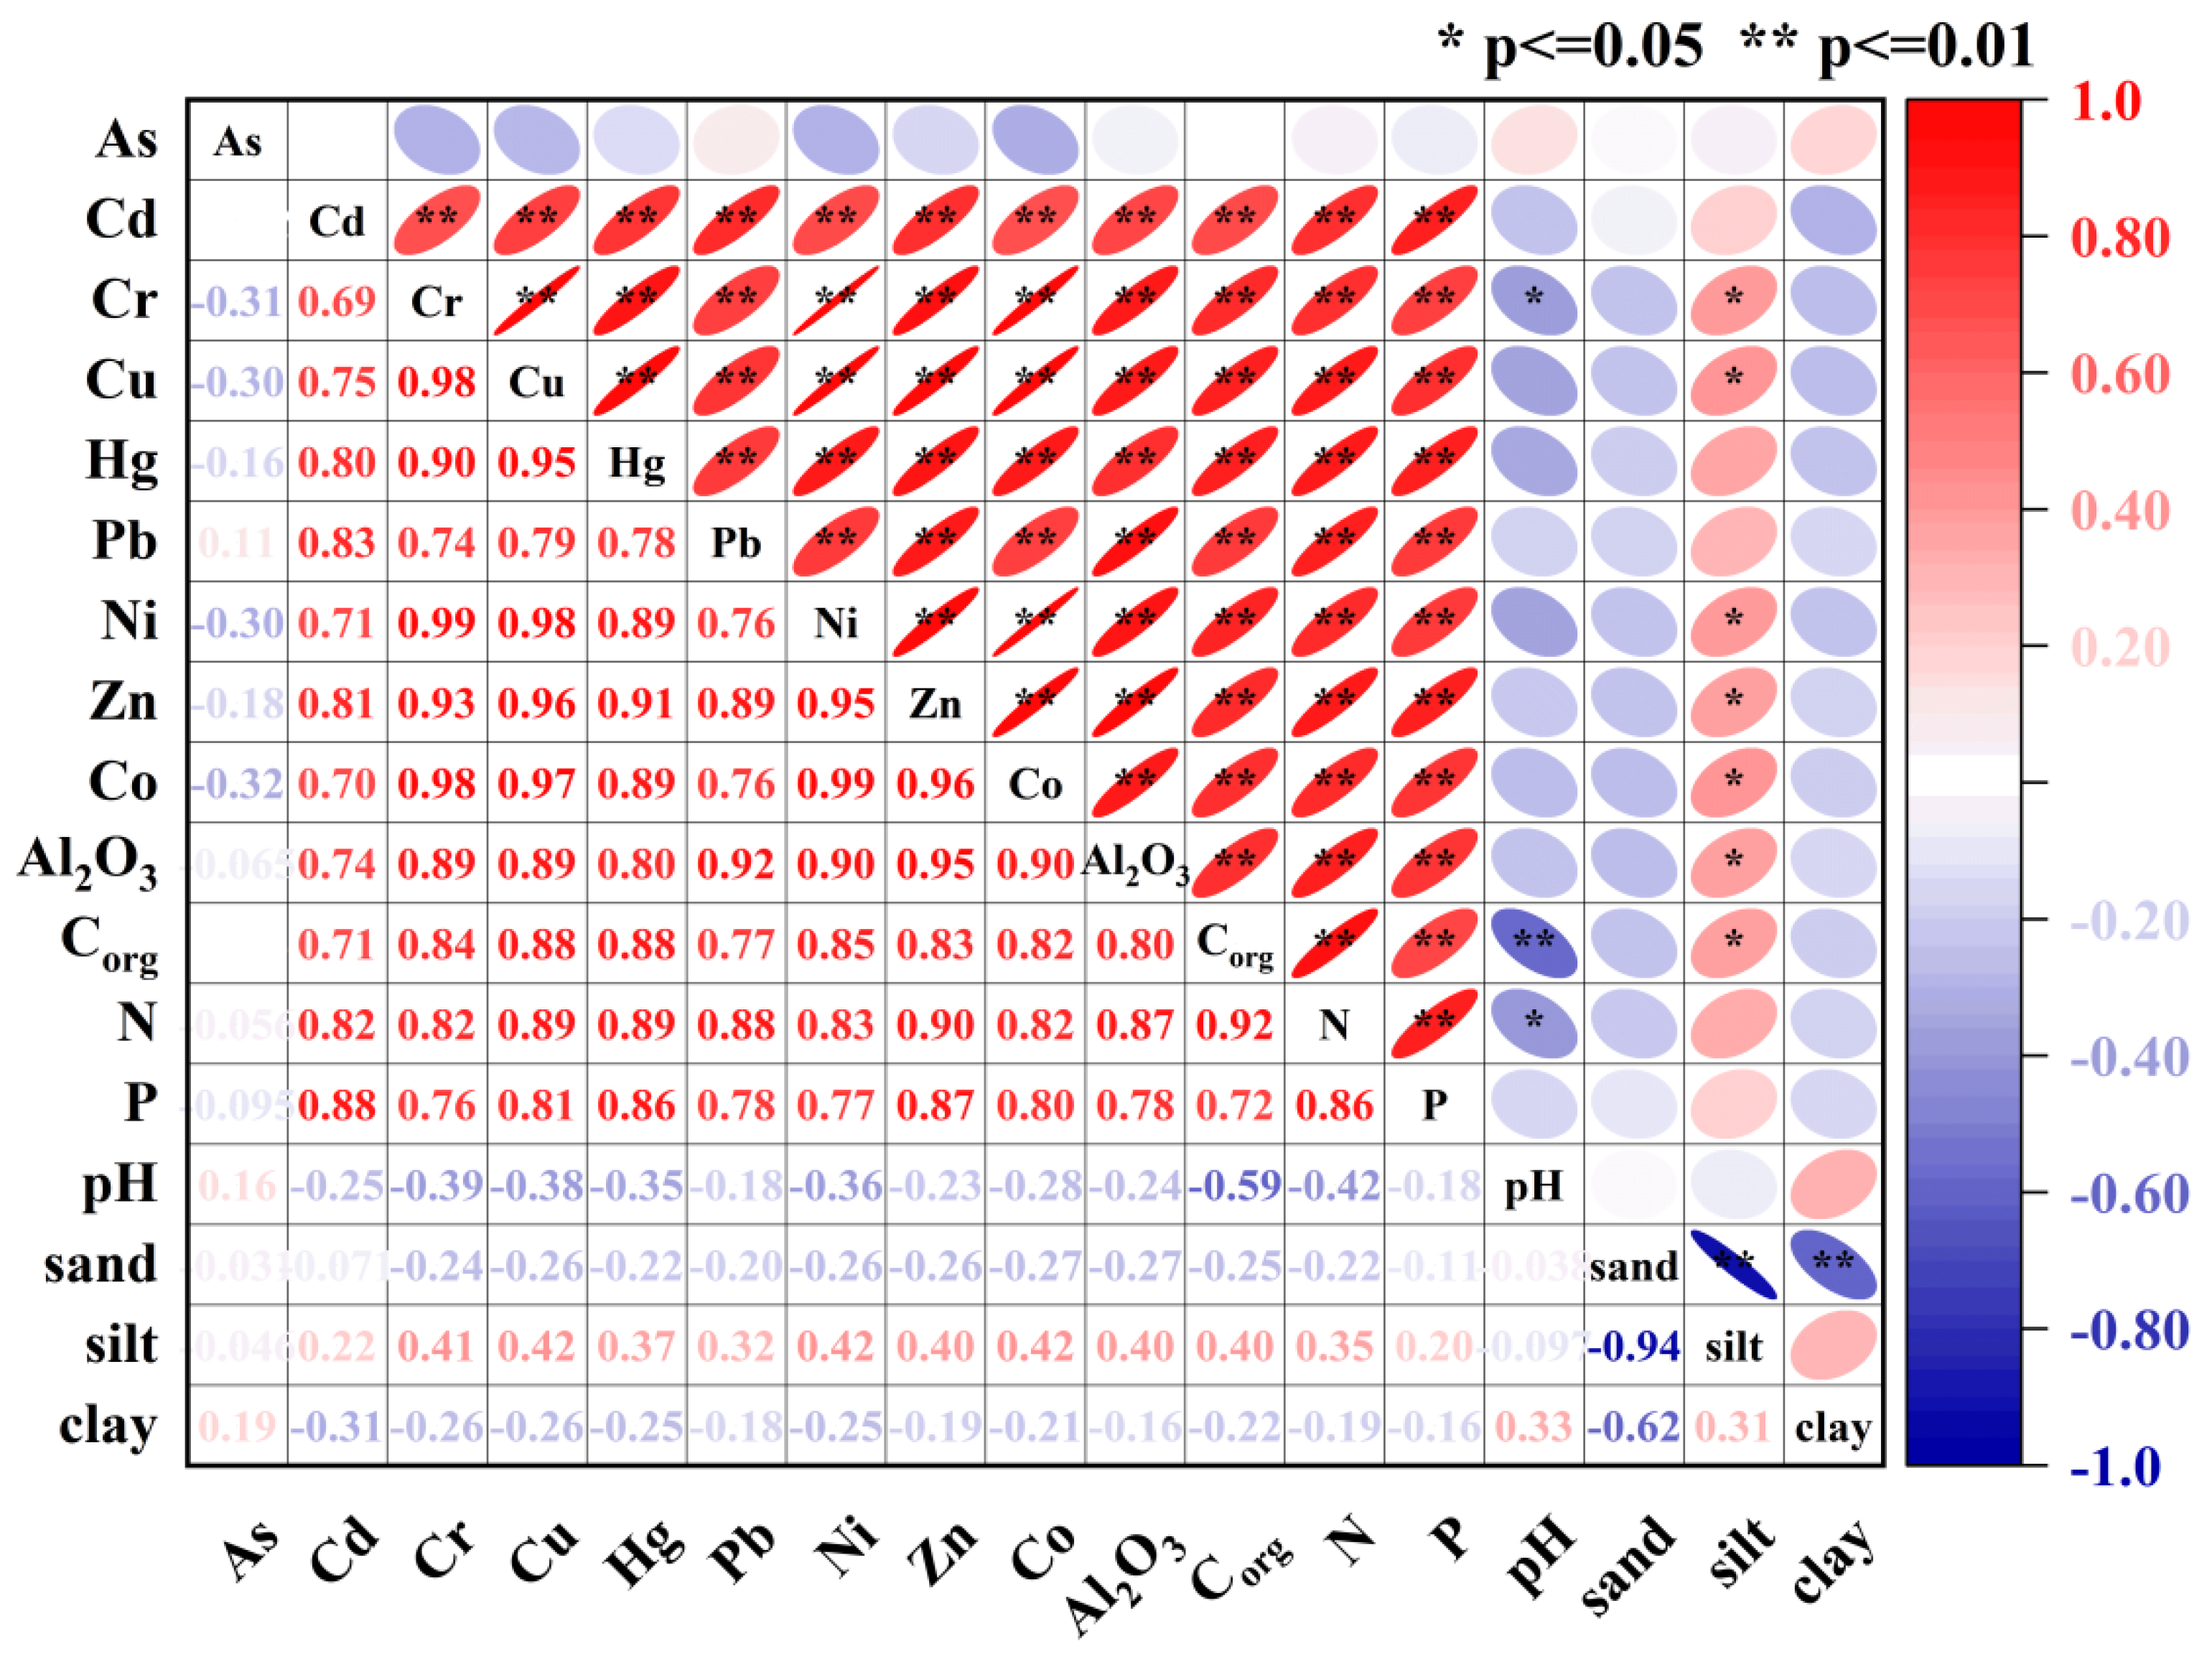
4.1. Source Apportionment of Metals in Sediment

Correlation analysis and cluster heat map analysis can delineate the sources more carefully and infer the main influential factors by characterizing the correlation between each element. According to Pearson correlation analysis (Figure 5), there was no significant correlation between As and the other macronutrients and heavy elements in the wetland, indicating that it had independent sources or deposition patterns. The correlation coefficients between Cd, Cr, Cu, Hg, Pb, Ni, Zn, and Co were above 0.7, indicating a similarity in sources or deposition patterns. Al2O3 is not only a major component of sediments but also an important indicator of physical origin [32]. Our results showed a significant relationship between Al2O3 and heavy metal elements (Cd, Cr, Cu, Hg, Pb, Ni, Zn and Co) in sediments, with correlation coefficients above 0.7, indicating that the sediment source was one of the main factors controlling the heavy metal contents in sediments [33]. The low correlation between Al2O3 and As suggested that the distribution of As is influenced by other factors. Previous studies have identified that mangroves are efficient carbon sinks in the tropics. The abundance of organic matter will help to retain and deposit heavy metals from various sources, thus reducing ecological threats to adjacent estuarine and marine systems [34]. The strong correlation between Cd, Cr, Cu, Hg, Pb, Ni, Zn, Co, and Corg in sediments indicated that Corg plays a significant role in controlling the distribution of heavy metals. Zeng et al. [35] and Liu et al. [36] concluded that nutrient salts have a great influence on the migration and transformation of heavy metals. In the wetland, there was also a strong correlation between N, P and heavy metals (Cd, Cr, Cu, Hg, Pb, Ni, Zn and Co), with correlation coefficients greater than 0.7, which pointed to the fact that nutrients and heavy metals should have a strong similarity in terms of sources and deposition. There was no significant correlation between the nine heavy metals and sand, silt and clay, with correlation coefficients less than 0.5. This result was similar to the results of Qiu et al. [8] and Pumijumnong et al. [37]. The reason for this result might be related to the percentage of sediment particle size content or might be caused by different sources of pollution at the sampling sites. The exact cause needs to be continued to be investigated in the future. Combined with the above characterization, it could be found that the enrichment of heavy metals in the study area should be related to factors such as nutrients and clay minerals. McBride et al. [38], Sparrow et al. [39], Aknaf et al. [40], and Chen et al. [41] also revealed in their studies that external factors, such as nutrients and clay minerals, had a great influence on the enrichment and transport capacity of heavy metals in sediments, which could reduce the ecological threat to adjacent estuarine and marine systems.
Cluster heat map analysis (Figure 6) enables us to simplify and visualize the complex relationships between elemental concentrations. The tree diagram in the cluster heat map subdivided the elements into four main groups (group I: As; group II: Cd, P; group III: Cr, Ni, Co, Cu, Zn, Al2O3, Hg, Corg, N, Pb). Group III can be subdivided into Cr, Ni, Co, Cu, Zn and Al2O3 as subgroup 1; Hg, Corg, N as subgroup 2; Pb as subgroup 3.
Ports, wharves, and ship repair yards distributed along the coast of Dongzhai Harbor were one of the sources of heavy metal pollution in marine surface sediments [42]. Based on the distribution of As content above, it could be assumed that heavy metal As might come from ships and aquaculture in the water within the harbor. According to the prior field surveys, the agricultural lands in the wetlands of Dongzhai Harbor account for the largest proportion of land use. A large number of heavy metals were delivered to the wetland during the application of chemical fertilizers and pesticides. For example, phosphate fertilizer is widely used in agricultural production. The main raw material contains naturally associated cadmium, which will cause soil cadmium pollution if there is improper application of phosphate fertilizer [43]. Therefore, it could be inferred from the classification of group II in the cluster analysis that Cd was mainly classified as agricultural source. Al2O3 is mainly a terrigenous detrital weathering product, which is stable and can be used as a terrigenous indicator component [44]. Based on the dendrogram, it could be concluded that the source of heavy metals Cr, Ni, Co, Cu and Zn should partially be parent rock weathering. This result was also similar to the conclusion by Cai et al. [32] and Vane et al. [45]. However, an investigation by Jiang et al. [20] found that heavy metal input fluxes from fertilizer application in northeastern Hainan were dominated by heavy metals such as Zn, Cu and Cr. It was consistent with the exceedance of heavy metal concentrations in the wetland described above. Therefore, Cr, Ni, Co, Cu and Zn may also be associated with fertilizer application. In Hainan Island, domestic and industrial wastewaters were identified as the main sources of irrigation water. Hg in irrigation water is mainly derived from domestic sewage without any sewage treatment [20]. In addition, nutrient enrichment in the wetland provides conditions for Hg deposition [46]. Based on the dendrogram indication, it could be speculated that the main source of Hg should be agricultural. Finally, the source of Pb as a separate subgroup could be speculated to be different from the sources of the heavy metals mentioned above. Jiang et al. [20] found that atmospheric deposition fluxes of Pb in northeastern Hainan were about three to five times higher than in other regions of the study area and more than twice the national average. In general, atmospheric Pb comes mainly from metal smelting and automobile exhausts. Thus, Pb as a separate subgroup could be considered to come mainly from soot deposition from metal smelters and automobile exhaust emissions. In contrast, the heat map treated Cr, Ni, Co, Cu, Zn, Al2O3, Hg, Corg, N and Pb as one large family, probably because of the similarity of their deposition patterns.
The tree diagram also subdivided the sites into four main groups (group I: ZK18; group II: ZK21, ZK15, ZK16, ZK12; group III: ZK25; group IV: ZK19, ZK17, ZK22, ZK9, ZK20, ZK14, ZK13, ZK27, ZK24, ZK11, ZK8, ZK5, ZK6, ZK7, ZK4, ZK3, ZK10, ZK2, ZK23, ZK26, ZK1). Combined with the spatial distribution of heavy metal concentrations and ecological risks at each site, it was observed that group I was close to human activities and surrounded by rich vegetation and water systems. Group II was mostly located in forest areas with developed water systems or areas with frequent human activities and developed water systems. Group III was surrounded by human activities and rivers but was near the sea. Group IV was mostly located far from land areas. The above charts showed that the concentrations of heavy metals and ecological risks were higher in group I compared to other sites, while the concentrations of heavy metals and ecological risks were much lower in group 4. Alongi et al. [47] demonstrated that environmental factors, such as well-developed root systems of mangrove plants and abundant nutrients, can make wetlands more susceptible to enriching heavy metals than the general tidal flats. It could be speculated that the deposition of heavy metals in sediments is not only related to the factors of physicochemical properties such as nutrients and clay minerals, but also controlled by the geographic environment such as surrounding forest lands and water systems. In the future, we should pay more attention to the distribution of heavy metals in mangrove forests in order to reduce the threat of pollution to ecological health.

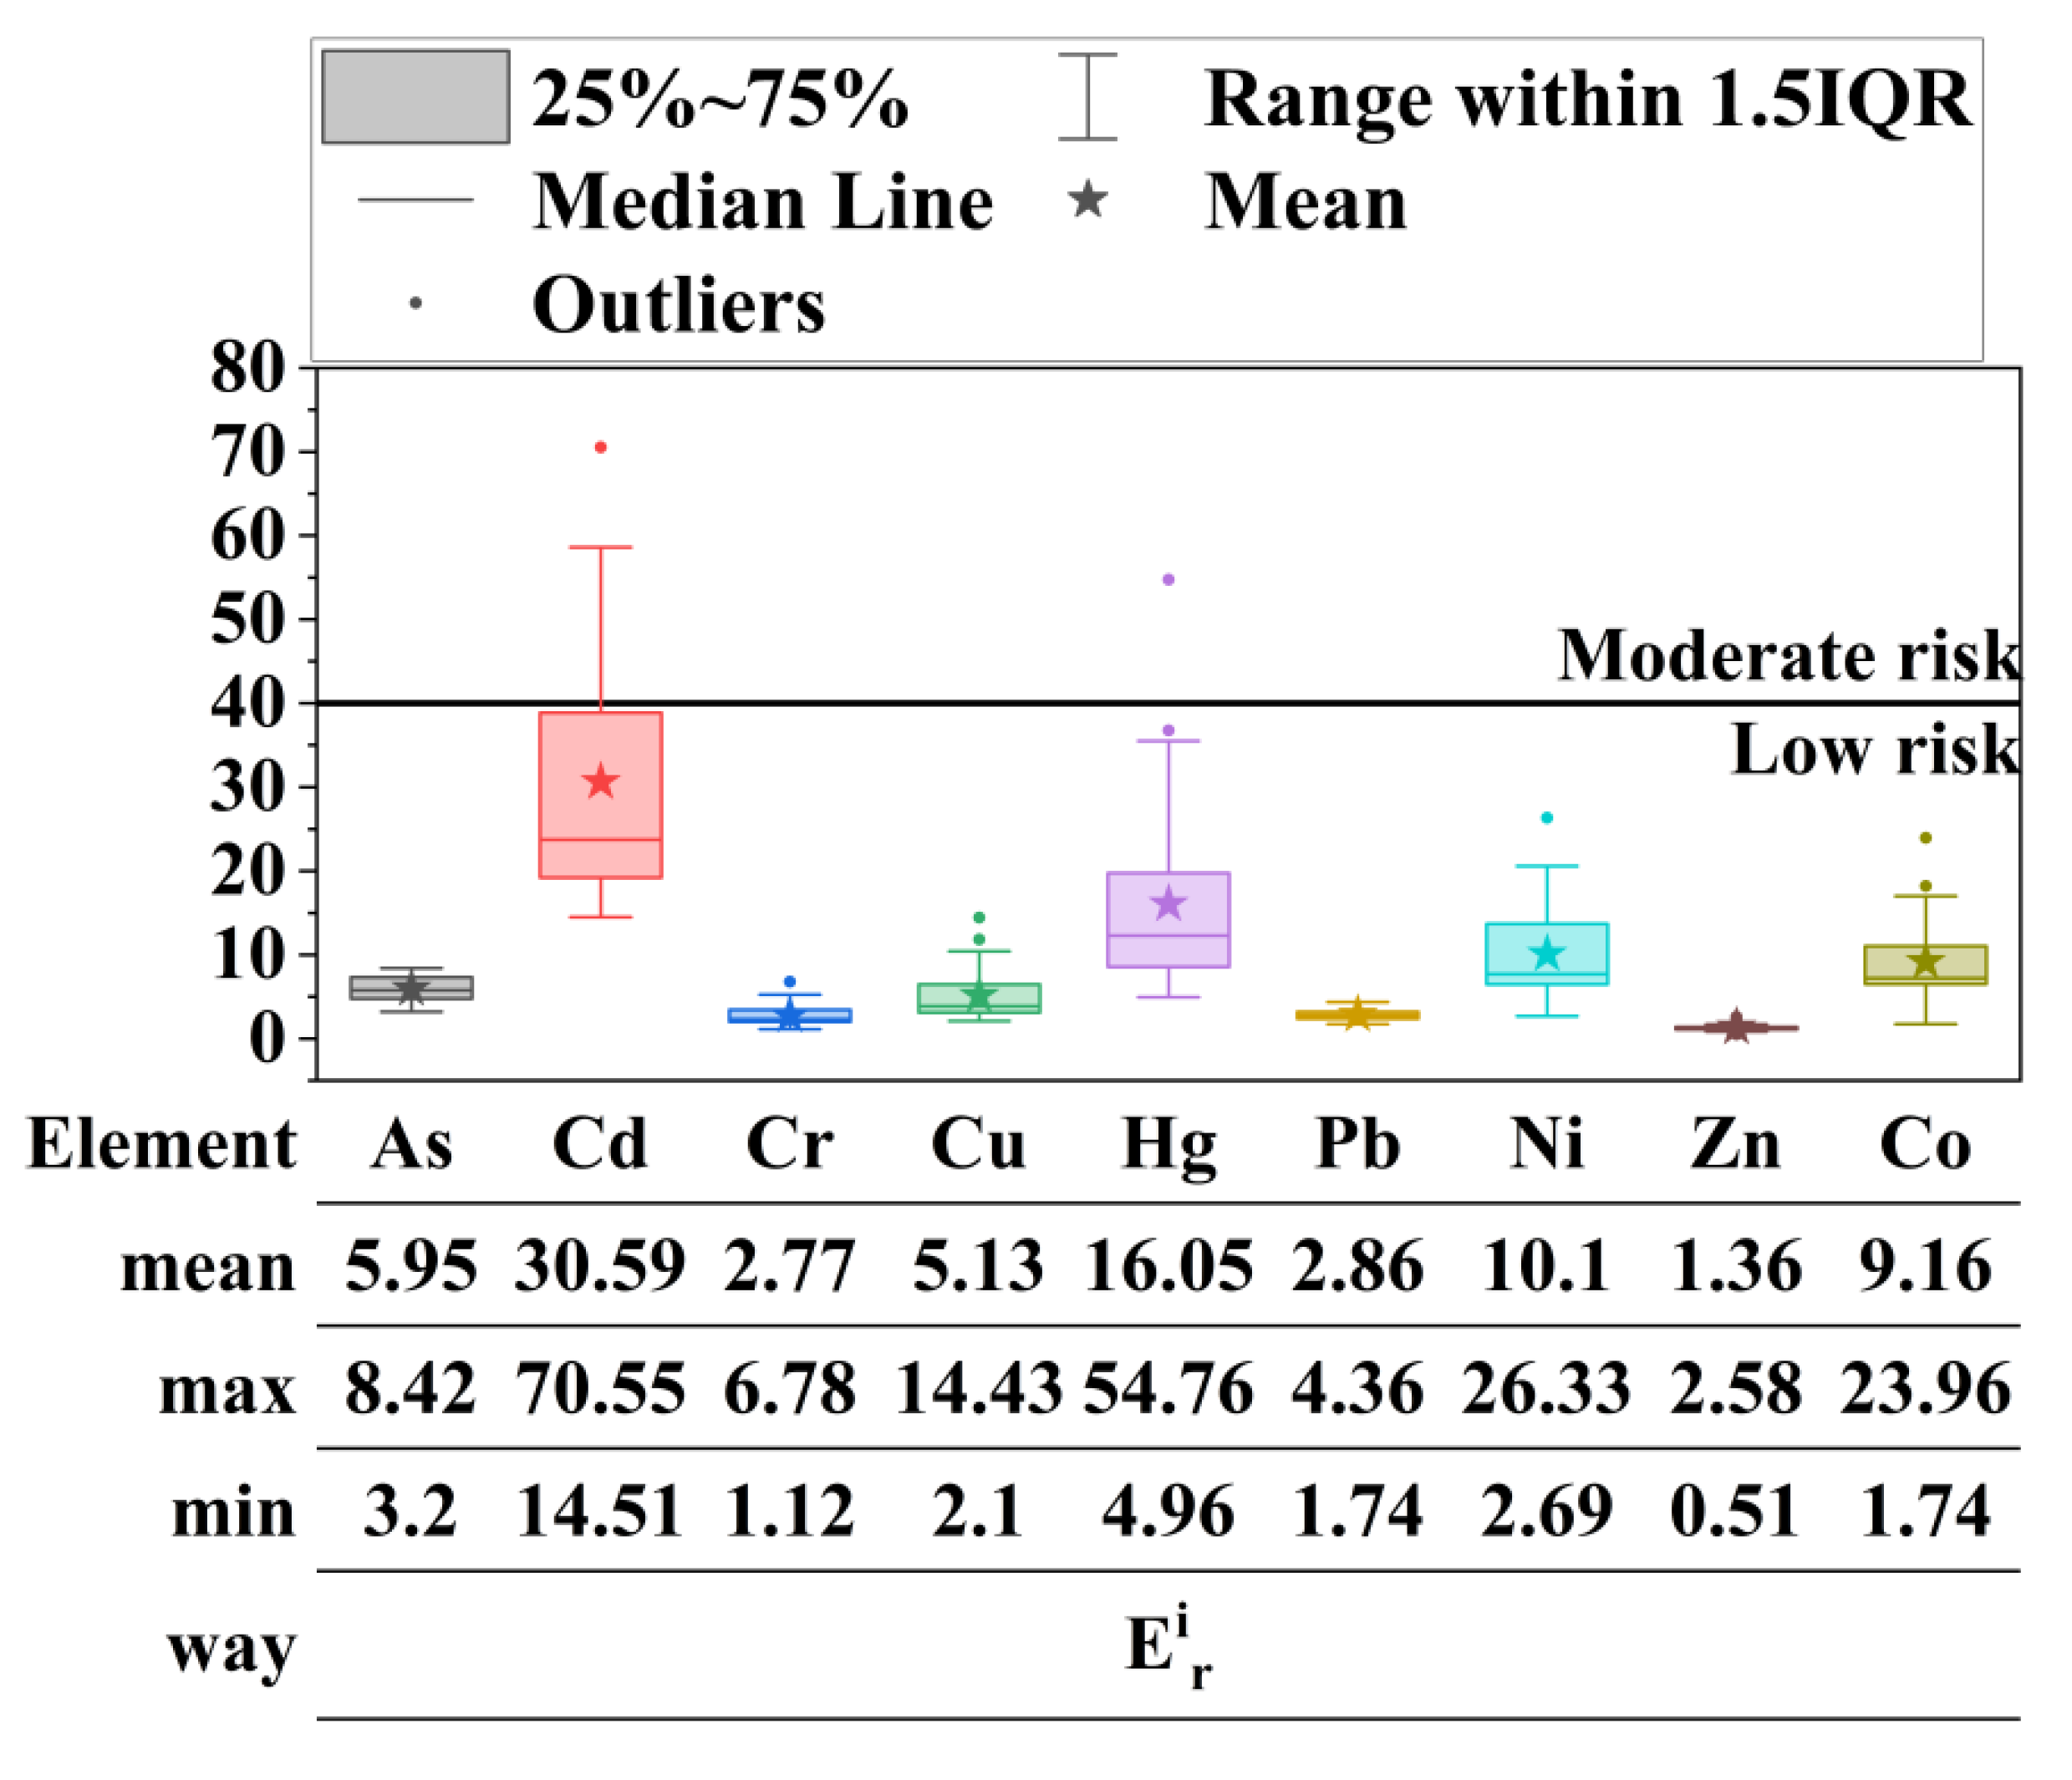
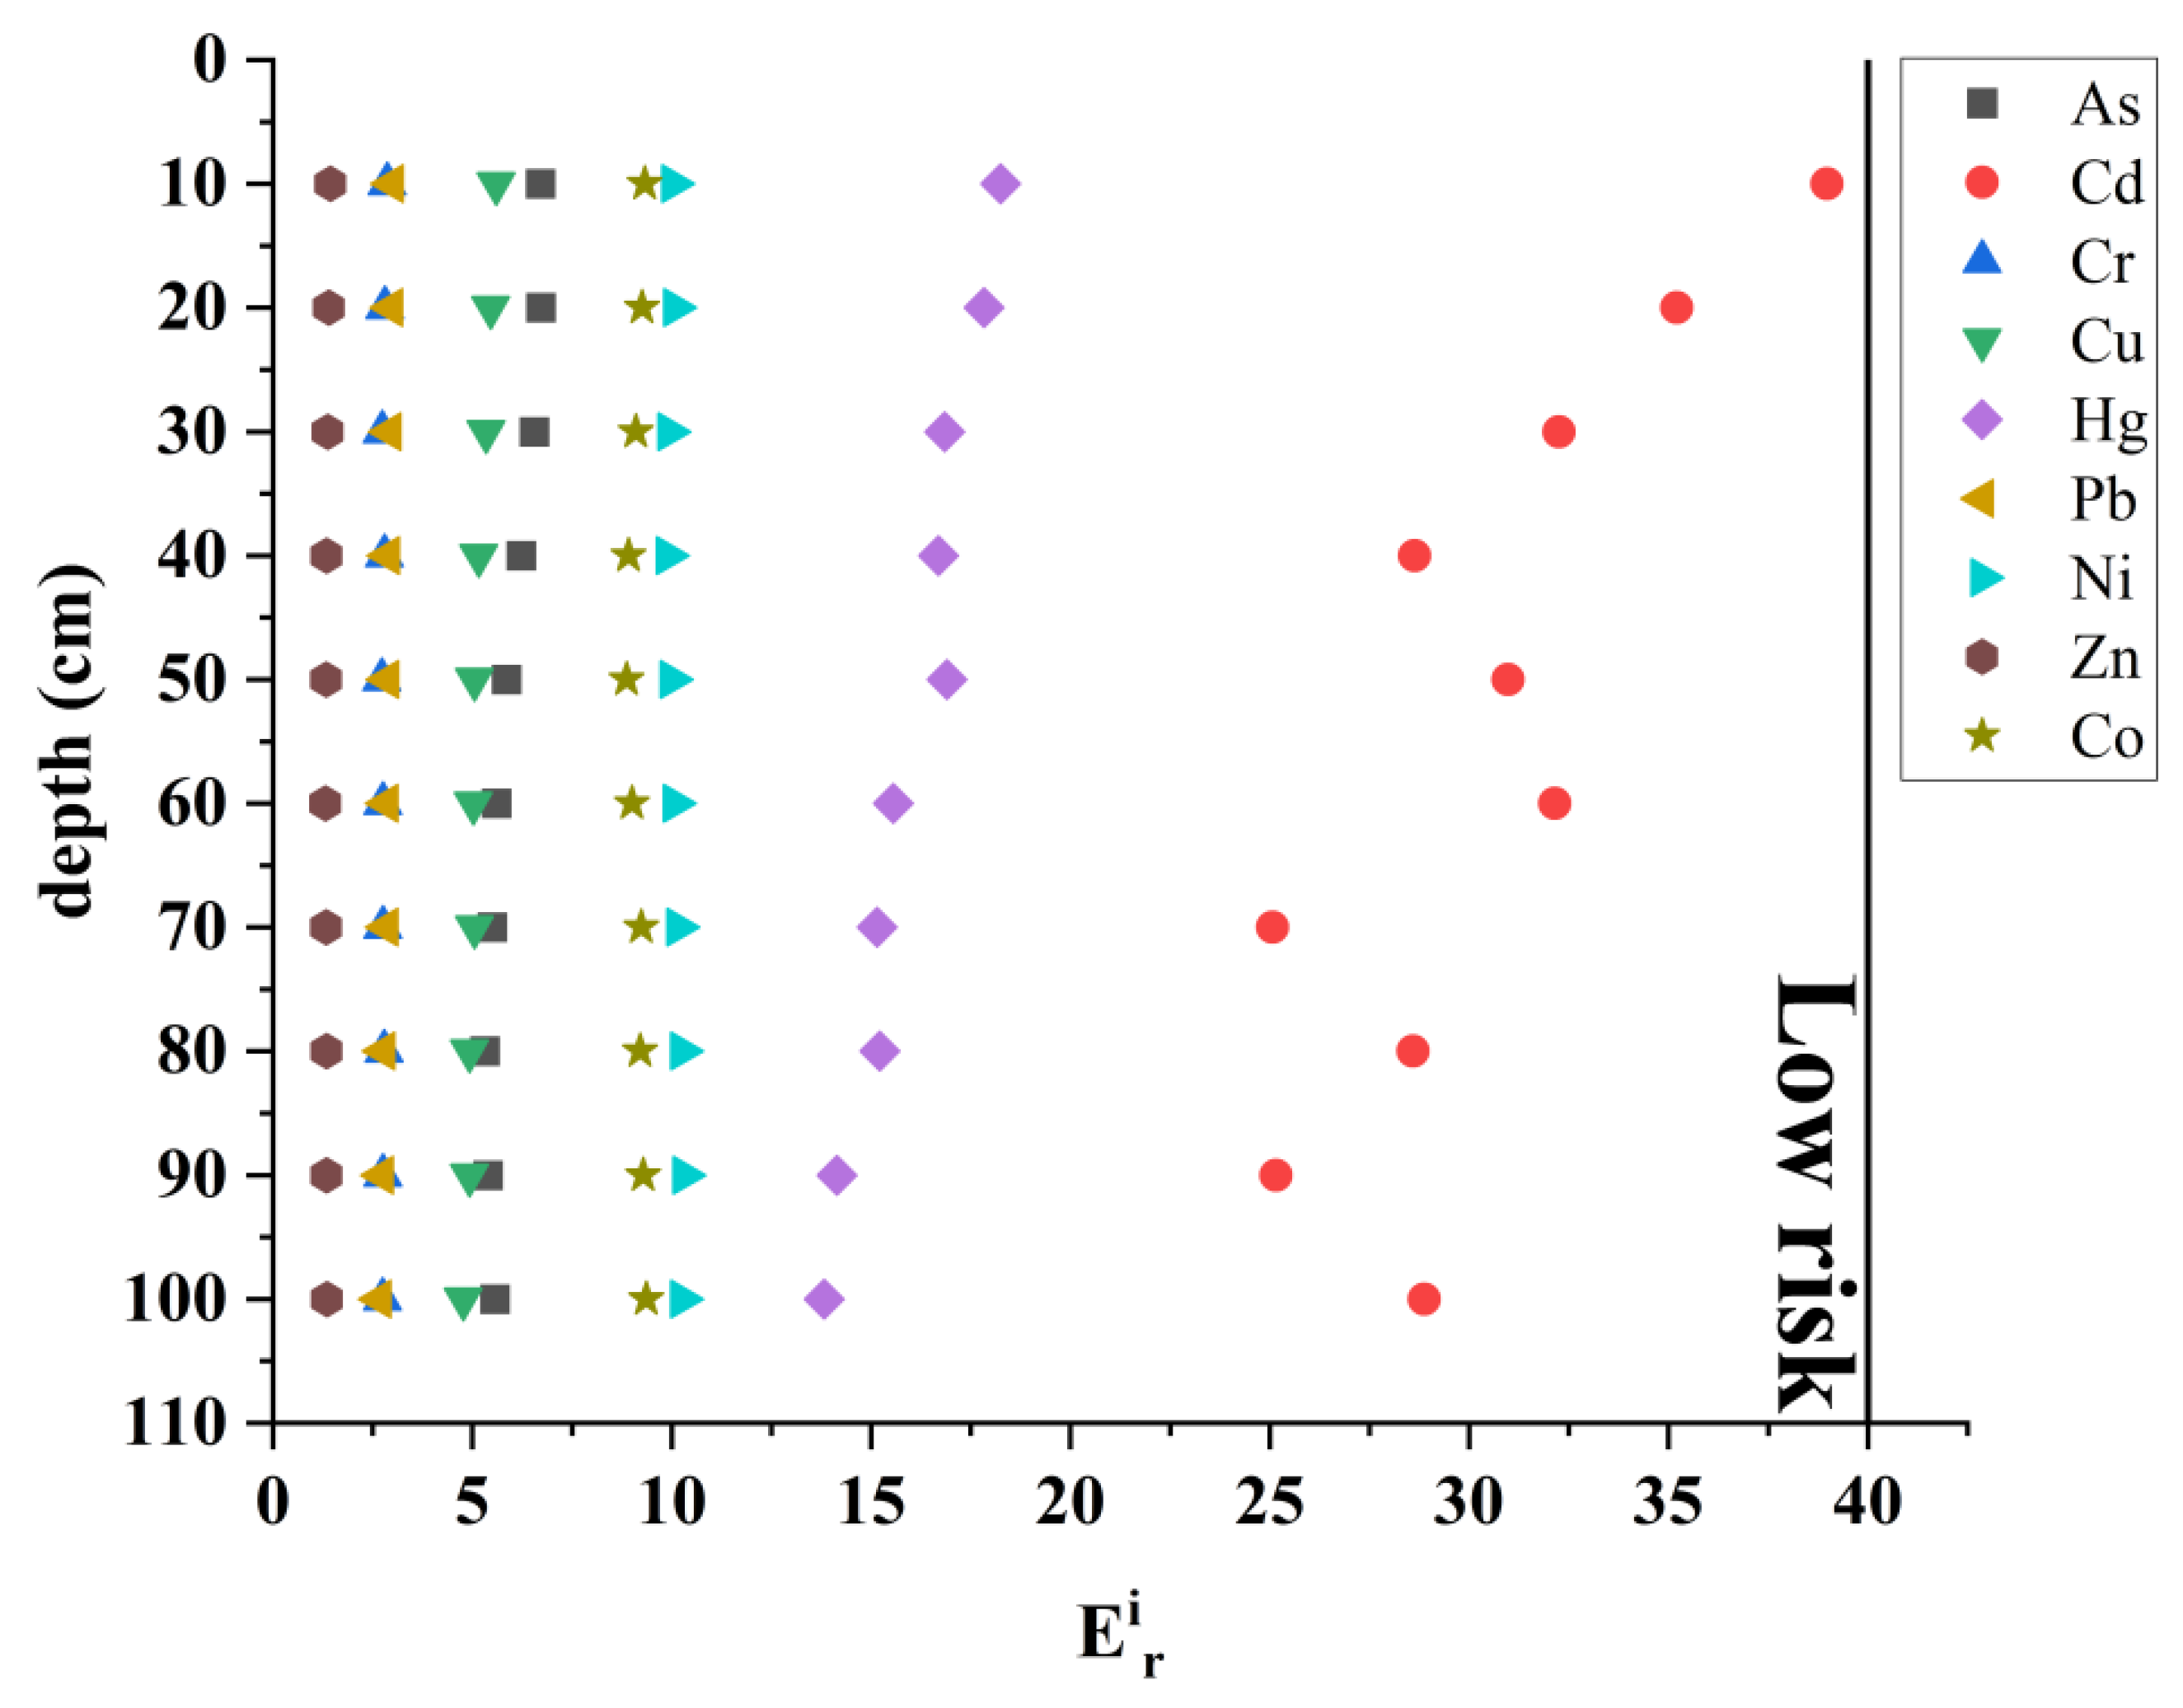
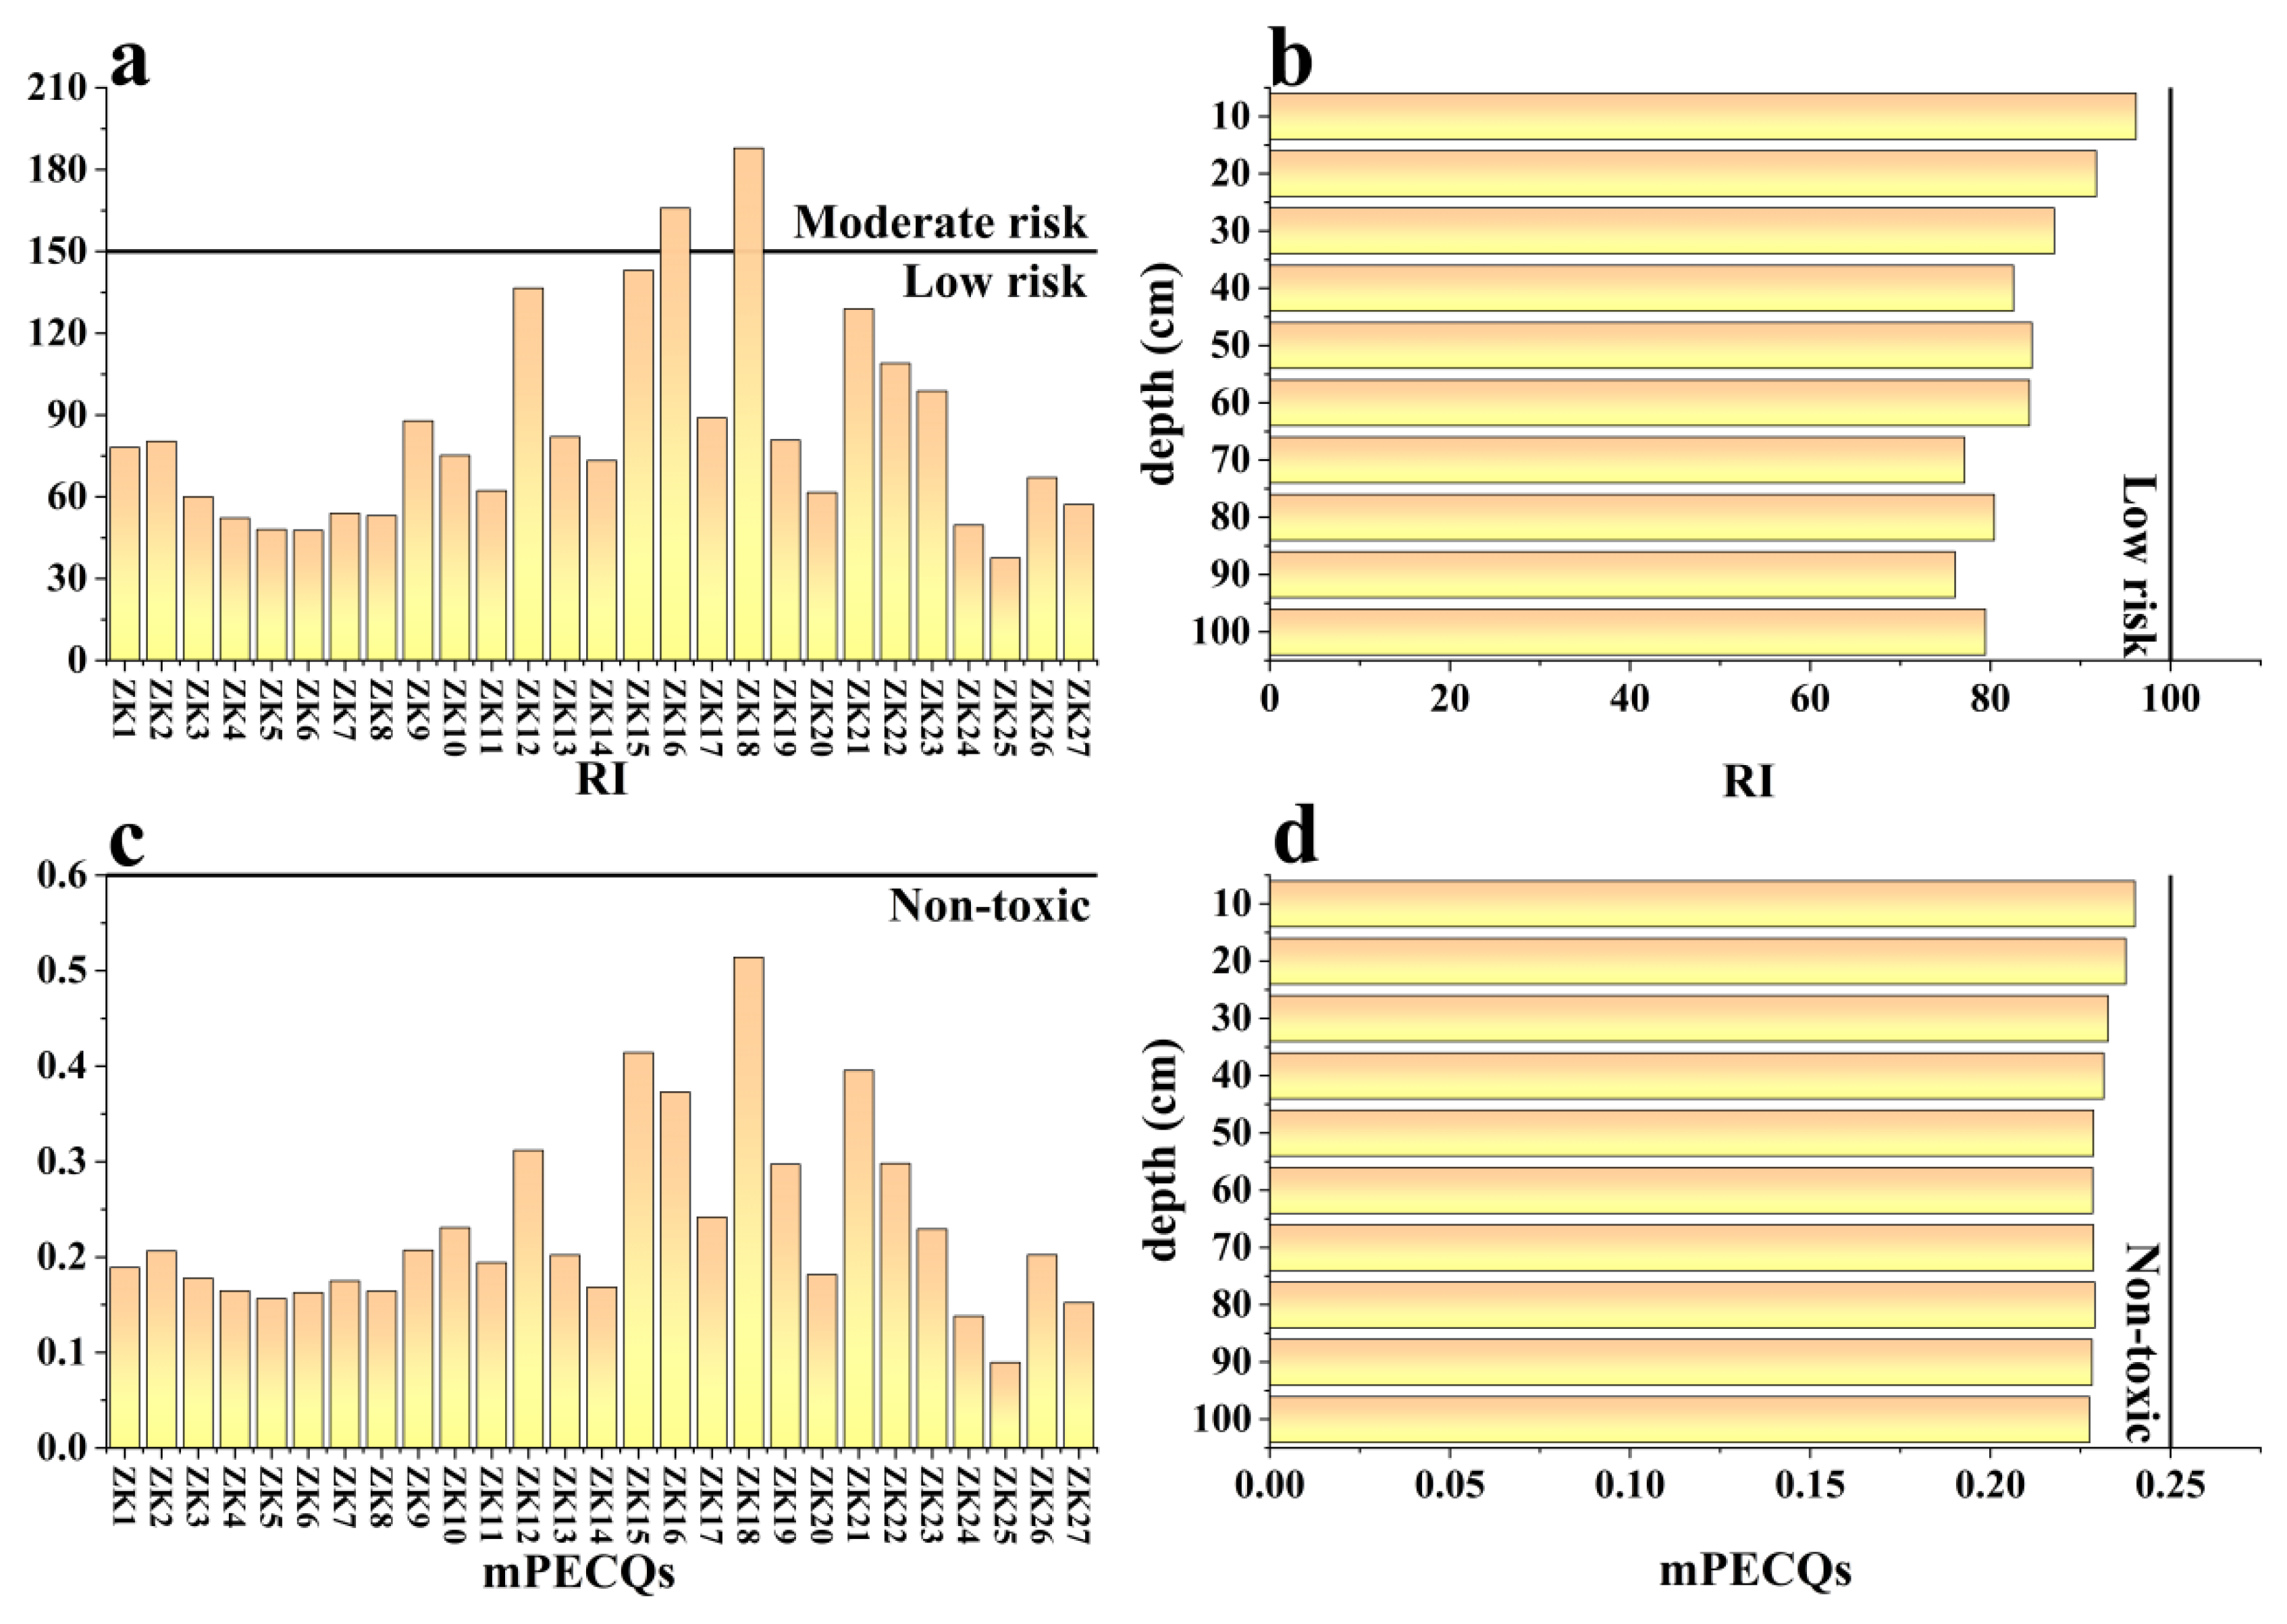
4.2. Contamination Status and Potential Ecological Risk

The concentrations of heavy metals in the sediments of Dongzhai Harbor wetland in this study were all much lower than those in the wetland sediments of Qi’ ao Island, Futian mangrove, Leizhou Peninsula, Jinjiang Estuary and Jiulong River Estuary in China (Table 4). In addition, the concentrations of heavy metals in Dongzhai Harbor wetland were similarly lower than wetlands such as those in the east and west coasts in India, Sydney estuary in Australia, Mango in New Zealand, and Ho Chi Minh City in Vietnam [3,4,6,13,48,49,50,51,52] (Table 4). In the horizontal direction, the background values of heavy metals in the soils of Hainan Island were used as a criterion to deduce that Cd, Cr, Cu, Ni, Zn and Co were exceeded in the sediments [53]. The sediment quality guideline (SQG) is commonly used to assess the toxicity of metals and the potential hazard of contaminated sediments to aquatic organisms [54]. Comparison with the LEL yielded that there were exceedances of Cr, Cu and Ni in the area. These indicated that heavy metals in the wetland sediments might have adverse impacts on the local ecological environment.
In the vertical direction, the mean values of heavy metals in each layer of the wetland sediments were compared with the background values of heavy metals in the soils of Hainan Island, and it was found that Cd, Cu, Cr, Ni, Zn and Co exceeded these values [53]. The sediment quality guideline (SQG) was used as a criterion to conclude whether Cr, Cu, and Ni were exceedances [54]. In summary, it could be concluded that the heavy metals Cd, Cr, Cu, Ni, Zn and Co might be at risk of contamination during their migration in sediments. Therefore, it was necessary to conduct ecological risk assessments to determine whether ecological threats exist in the study area.
The single potential ecological risk index (Eir) is an analytical method for ecological risk evaluation of individual heavy metal elements based on the toxicity coefficient Tir [28]. There was no significant ecological risk overall in the study area, except for the high-risk factors of Cd and Hg (Figure 7). In the sediment profiles (Figure 8), nine heavy metals were not significant ecological hazards in 0–100 cm, but the Cd content in 0–10 cm of sediments still needs to be noted.
The potential ecological risk index (RI) is an evaluation method that uses the Eir to calculate and comprehensively assess the regional ecological risk [12]. The background values of heavy metals in the soil at Hainan Island were used as a parameter to conclude that the wetland was at low-risk status. It is noteworthy that the high concentration areas, such as ZK16 and ZK18, which were in forest land and near the wetland park, have reached a medium-risk level (Figure 9a). In the sedimentation profiles, there was no significant contamination in the 0–100 cm, and the contamination index tended to decrease with increasing depth, but the risk index in the surface layer 0–20 cm was higher than the other layers (Figure 9b).
Multiple probable effect concentrations quality (mPECQs) is a pollution evaluation index based on the ratio of probable effect concentrations of individual heavy metals (PECi) to measured heavy metal concentration (Ci). It is a comprehensive analysis to assess the likelihood of ecological pollution occurrence [30]. Figure 9c showed that the mPECQs values from ZK1 to ZK27 were all less than 1, indicating a low incidence of toxicity (<25%). ZK16 and ZK18 had high values of mPECQs, and more attention needed to be paid to their concentration changes. In the sedimentation profiles (Figure 9d), there was no significant possibility of ecological pollution occurring in all the layers from 0–100 cm.
The individual potential ecological risk index (Eir), potential ecological risk index (RI) and multiple probable effect concentrations quality (mPECQs) were all methods to assess the ecological contamination levels of heavy metals in sediments by their toxicity effects. In the study area, stratigraphic lithology was highly variable [55]. Thus, compared with the geoaccumulation Index (Igeo), contamination factor (CF), pollution load index (PLI) and other evaluation methods, these three methods could more objectively evaluate the ecological risks of heavy metals in the study area by avoiding the problem of selecting regional background reference values [19]. Despite the different parameters applied, the above graphs all showed that the contaminating elements in the study area are mainly Cd and Hg. Heavy metal contamination mainly affects the surface sediment within 0–20 cm. Fortunately, there was no obvious ecological risk in the area, both in terms of single-element effects and the overall heavy metal effects. This result was similar to the conclusions of Jiang et al. [20]. This observation was inseparable from the following; the low development of the Dongzhai Harbor wetland and the environmental protection of the wetland [8]. However, the managers still need to pay more attention to the sources of Cd and Hg associated with the further economic development of Hainan provinces.

5. Conclusions

(1) The overall concentrations of heavy metals in the sediments of Hainan Dongzhai Harbor were ranked from high to low as Cr, Zn, Ni, Cu, Co, Pb, As, Cd and Hg. The heavy metal content was high in the 0–20 cm range of the sediment surface. A comparison with the background values of heavy metals in the soil of Hainan Island found that the content of Cd, Cr, Cu, Ni, Zn and Co in the region was exceeded. Dense vegetation, high clay minerals and nutrient contents were the major reasons for the accumulation of heavy metals in the mangrove areas.
(2) The individual potential ecological risk index (Eir) pointed out that the polluting elements were Cd and Hg. The potential ecological risk index (RI), multiple probable effect concentrations quality (mPECQs) indicated that the areas with high heavy metal concentration and the 0–20 cm range of sediment surface layer were more susceptible to heavy metal contamination.
(3) The possible sources of heavy metals were divided into the following categories: As accumulated from ships and aquaculture in harbor waters, Cd from agricultural fertilizers and Hg from irrigation water, Cr, Cu, Ni, Zn and Co from weathering of parent rocks and fertilizer application, and Pb from soot emissions by metal smelters and automobile exhausts.
Our results suggested that, despite the low ecological risk of the heavy metals pollution in Dongzhai Harbor mangrove wetlands, the local government and regional authorities still need to monitor the sediment quality and develop appropriate management strategies to prevent further contamination of coastal ecosystems and biological communities in the future.

Author Contributions

C.M.: conceptualization, methodology, writing—review & editing. S.D.: methodology, formal analysis, writing—original draft. G.Z.: supervision, investigation, methodology, review & editing, Y.W.: review & editing, W.R.: review & editing. All authors have read and agreed to the published version of the manuscript.

Funding

This research was funded by the Fundamental Research Funds for the Central Universities (B200206007), the Hainan Provincial Natural Science Foundation of China (421MS0813) and Open Research Fund of Hainan Key Laboratory of Marine Geological Resources and Environment (Grant No. HNHYDZZYHJKF009; HNHYDZZYHJKF018).

Institutional Review Board Statement

Not applicable.

Informed Consent Statement

Not applicable.

Data Availability Statement

Not applicable.

Acknowledgments

We appreciate the help of the engineers of the Hainan geological survey in the fieldwork.

Conflicts of Interest

The authors declare no conflict of interest.

References

  1. Lee, S.Y.; Primavera, J.H.; Dahdouh-Guebas, F.; Mckee, K.; Bosire, J.O.; Cannicci, S.; Diele, K.; Fromard, F.; Koedam, N.; Marchand, C. Ecological role and services of tropical mangrove ecosystems: A reassessment. Glob. Ecol. Biogeogr. 2014, 23, 726–743. [Google Scholar] [CrossRef]
  2. Bayen, S. Occurrence bioavailability and toxic effects of trace metals and organic contaminants in mangrove ecosystems: A review. Environ. Int. 2012, 48, 84–101. [Google Scholar] [CrossRef] [PubMed]
  3. Ram, S.S.; Aich, A.; Sengupta, P.; Chakraborty, A.; Sudarshan, M. Assessment of trace metal contamination of wetland sediments from eastern and western coastal region of India dominated with mangrove forest. Chemosphere 2018, 211, 1113–1122. [Google Scholar] [CrossRef] [PubMed]
  4. Nath, B.; Chaudhuri, P.; Birch, G. Assessment of biotic response to heavy metal contamination in Avicennia marina mangrove ecosystems in Sydney Estuary Australia. Ecotoxicol. Environ. Saf. 2014, 107, 284–290. [Google Scholar] [CrossRef]
  5. Sultana, S.; Huang, R.Q.; Zhu, Y.J.; Thura, K.; Htwe, H.Z.; Song, L.; Jin, R.J.; Gu, J.L.; Christakos, G.; Wu, J.P. Enrichment of trace elements by blue carbon habitats in Maoyan Island of Yueqing Bay China. Stoch. Environ. Res. Risk Assess. 2022, 36, 3753–3767. [Google Scholar] [CrossRef]
  6. Yan, Y.; Wan, R.A.; Yu, R.L.; Hu, G.R.; Lin, C.Q.; Huang, H.B. A comprehensive analysis on source-specific ecological risk of metal(loid)s in surface sediments of mangrove wetlands in Jiulong River Estuary China. Catena 2022, 209, 105817. [Google Scholar] [CrossRef]
  7. Wu, H.; Liu, J.; Bi, X.; Lin, G.; Feng, C.C.; Li, Z.; Xie, L. Trace metals in sediments and benthic animals from aquaculture ponds near a mangrove wetland in Southern China. Mar. Pollut. Bull. 2017, 117, 486–491. [Google Scholar] [CrossRef]
  8. Qiu, Y.W.; Yu, K.F.; Zhang, G.; Wang, W.X. Accumulation and partitioning of seven trace metals in mangroves and sediment cores from three estuarine wetlands of Hainan Island China. J. Hazard. Mater. 2011, 190, 631–638. [Google Scholar] [CrossRef]
  9. He, S.Y.; Yang, X.E.; He, Z.L.; Baligar, V.C. Morphological and physiological responses of plants to cadmium toxicity: A review. Pedosphere 2017, 27, 421–438. [Google Scholar] [CrossRef]
  10. Liu, Y.; Li, Z.Y.; Xu, R.K. Distribution of manganese (II) chemical forms on soybean roots and manganese (II) toxicity. Pedosphere 2019, 29, 656–664. [Google Scholar] [CrossRef]
  11. Chiappetta, J.M.M.; Machado, W.; Santos, J.M.; Lessa, J.A. Trace metal bioavailability in sediments from a reference site Ribeira Bay Brazil. Mar. Pollut. Bull. 2016, 106, 395–399. [Google Scholar] [CrossRef] [PubMed]
  12. Ustaoğlu, F.; Islam, M.S. Potential toxic elements in sediment of some rivers at Giresun Northeast Turkey: A preliminary assessment for ecotoxicological status and health risk. Ecol. Indic. 2020, 113, 106237. [Google Scholar] [CrossRef]
  13. Dung, T.T.T.; Linh, T.M.; Chau, T.B.; Hoang, T.M.; Swennen, R.; Cappuyns, V. Contamination status and potential release of trace metals in a mangrove forest sediment in Ho Chi Minh City, Vietnam. Environ. Sci. Pollut. Res. 2020, 26, 9536–9551. [Google Scholar] [CrossRef] [PubMed]
  14. Herbeck, L.S.; Krumme, U.; Andersen, T.J.; Jennerjahn, T.C. Decadal trends in mangrove and pond aquaculture cover on Hainan (China) since 1966: Mangrove loss fragmentation and associated biogeochemical changes. Estuarine Coast. Shelf Sci. 2020, 233, 106531. [Google Scholar] [CrossRef]
  15. Zhang, D.L.; Liu, N.; Yin, P.; Zhu, Z.G.; Lu, J.F.; Lin, X.H.; Jiang, X.J.; Meng, X.W. Characterization sources and ecological risk assessment of polycyclic aromatic hydrocarbons in surface sediments from the mangroves of China. Wetl. Ecol. Manag. 2017, 25, 105–117. [Google Scholar] [CrossRef]
  16. Herbeck, L.S. Ecological Impact of Land-Derived Anthropogenic Nutrients and Organic Matter on Tropical Estuarine and Coastal Systems of Hainan China; University of Bremen: Bremen, Germany, 2011; Available online: https://d-nb.info/1071992678/34 (accessed on 5 September 2022).
  17. Xin, K.; Huang, X.; Hu, J.; Li, C.; Yang, X.B.; Arndt, S.K. Land use change impacts on heavy metal sedimentation in mangrove wetlands—A case study in Dongzhai Harbor of Hainan China. Wetlands 2014, 34, 1–8. [Google Scholar] [CrossRef]
  18. Li, P.; Li, X.J.; Bai, J.K.; Meng, Y.C.; Diao, X.P.; Pan, K.; Zhu, X.S.; Lin, G.H. Effects of land use on the heavy metal pollution in mangrove sediments: Study on a whole island scale in Hainan China. Sci. Total Environ. 2022, 824, 153856. [Google Scholar] [CrossRef]
  19. Xu, F.J.; Hu, B.Q.; Li, J.; Cui, R.Y.; Liu, Z.Q.; Jiang, Z.Z.; Yin, X.B. Reassessment of heavy metal pollution in riverine sediments of Hainan Island China: Sources and risks. Environ. Sci. Pollut. Res. 2018, 25, 1766–1772. [Google Scholar] [CrossRef]
  20. Jiang, W.; Hou, Q.Y.; Yang, Z.F.; Yu, T.; Zhong, C.; Yang, Y.; Fu, Y.R. Annual input fluxes of heavy metals in agricultural soil of Hainan Island China. Environ. Sci. Pollut. Res. 2014, 21, 7876–7885. [Google Scholar] [CrossRef]
  21. Zhao, D.B.; Wan, S.M.; Yu, Z.J.; Huang, J. Distribution enrichment and sources of heavy metals in surface sediments of Hainan Island rivers China. Environ. Earth Sci. 2015, 74, 5097–5110. [Google Scholar] [CrossRef]
  22. Wang, J.G.; Wang, P.; Zhao, Z.Z.; Huo, Y.R. Uptake and concentration of heavy metals in dominant mangrove species from Hainan Island South China. Environ. Geochem. Health 2021, 43, 1703–1714. [Google Scholar] [CrossRef] [PubMed]
  23. Zhang, M.; Chen, G.; Luo, Z.; Sun, X.; Xu, J. Spatial distribution source identification and risk assessment of heavy metals in seawater and sediments from Meishan Bay Zhejiang coast China. Mar. Pollut. Bull. 2020, 156, 111217–111225. [Google Scholar] [CrossRef] [PubMed]
  24. Hosokawa, S.; Naito, R.; Nakamura, Y. Spatial patterns of concentrations of Cu Zn Cd and Pb in marine sediments from Japanese port areas. Reg. Stud. Mar. Sci. 2020, 35, 101135–101146. [Google Scholar] [CrossRef]
  25. Liu, Y.Y.; Ji, C.Y.; Fu, B.; He, L.S.; Fu, Q.Q.; Shen, M.C.; Zhao, Z.Z. Factors influencing the accumulation of Pd in mangrove wetland sediments in Dongzhai Harbor Hainan China. J. Coast. Conserv. 2019, 23, 1039–1045. [Google Scholar] [CrossRef]
  26. Hu, B.Q.; Li, J.; Cui, R.Y.; Wei, H.L.; Zhao, J.T.; Li, G.G.; Fang, X.S.; Ding, X.; Zou, L.A.; Bai, F.L. Clay mineralogy of the riverine sediments of Hainan Island South China Sea: Implications for weathering and provenance. J. Asian Earth Sci. 2014, 96, 84–92. [Google Scholar] [CrossRef]
  27. Li, M.; Xi, X.; Xiao, G.; Cheng, H.; Yang, Z.; Zhou, G.; Li, Z. National multi-purpose regional geochemical survey in China. J. Geochem. Explor. 2014, 139, 21–30. [Google Scholar] [CrossRef]
  28. Maanan, M.; Saddik, M.; Maanan, M.; Chaibi, M.; Assobhei, O.; Zourarah, B. Environmental and ecological risk assessment of heavy metals in sediments of Nador lagoon Morocco. Ecol. Indic. 2015, 48, 616–626. [Google Scholar] [CrossRef]
  29. Hakanson, L. An ecological risk index for aquatic pollution control. a sedimentological approach. Pergamon 1980, 14, 975–1001. [Google Scholar] [CrossRef]
  30. Li, H.; Chai, L.; Yang, Z.; Liao, Q.; Liu, Y.; Ouyang, B. Seasonal and spatial contamination statuses and ecological risk of sediment cores highly contaminated by heavy metals and metalloids in the Xiangjiang River. Environ. Geochem. Health 2019, 41, 1617–1633. [Google Scholar] [CrossRef]
  31. Li, Z.; Chen, Y.N.; Li, W.H.; Lv, X. Responses of Tamarix ramosissima ABA Accumulation to groundwater level and soil salt changes in the lower reaches of Tarim River. Acta Ecol. Sin. 2007, 27, 4247–4251. [Google Scholar] [CrossRef]
  32. Cai, P.J.; Cai, G.Q.; Chen, X.; Li, S.; Zhao, L. The concentration distribution and biohazard assessment of heavy metal elements in surface sediments from the continental shelf of Hainan Island. Mar. Pollut. Bull. 2021, 166, 112254. [Google Scholar] [CrossRef] [PubMed]
  33. Liang, J.; Liu, J.; Xu, G.; Chen, B. Distribution and transport of heavy metals in surface sediments of the Zhejiang nearshore area East China Sea: Sedimentary environmental effects. Mar. Pollut. Bull. 2019, 146, 542–551. [Google Scholar] [CrossRef] [PubMed]
  34. Komiyama, A.; Ong, J.E.; Poungparn, S. Allometry biomass and productivity of mangrove forests: A review. Aquat. Bot. 2008, 89, 128–137. [Google Scholar] [CrossRef]
  35. Zeng, Y.; Yang, Y.; Li, Y.Q.; Wang, Q.F.; Hou, S.; Zeng, J.Y. Dynamic characteristics of heavy metals in a eutrophic reservoir in subtropical China. J. Geochem. Explor. 2020, 208, 106391. [Google Scholar] [CrossRef]
  36. Liu, J.J.; Diao, Z.H.; Xu, X.R.; Xie, Q. Effects of dissolved oxygen salinity nitrogen and phosphorus on the release of heavy metals from coastal sediments. Sci. Total Environ. 2019, 666, 894–901. [Google Scholar] [CrossRef]
  37. Pumijumnong, N.; Uppadit, B. Accumulation of heavy metals in mangrove sediments of chumphon province Thailand. Appl. Environ. Res. 2012, 34, 21–38. Available online: https://ph01.tci-thaijo.org/index.php/aer/index (accessed on 12 November 2022).
  38. McBride, M.B. Cadmium uptake by crops estimated from soil total Cd and pH. Soil Sci. 2002, 167, 62–67. [Google Scholar] [CrossRef]
  39. Sparrow, L.A.; Salardini, A.A.; Johnstone, J. Field studies of cadmium in potatoes (Solanum tuberosum L.). III. Response of cv. Russet Burbank to sources of banded potassium. Aust. J. Agric. Res. 1994, 45, 243–249. [Google Scholar] [CrossRef]
  40. Aknaf, A.; Akodad, M.; Layachi, M.; Baghour, M.; Oudra, B.; Vasconcelos, V. The chemical characterization and its relationship with heavy metals contamination in surface sediment of Marchica Mediterranean Lagoon (North of Morocco). Environ. Sci. Pollut. Res. 2022, 29, 4159–4169. [Google Scholar] [CrossRef]
  41. Chen, H.P.; Tang, Z.; Wang, P.; Zhao, F.J. Geographical variations of cadmium and arsenic concentrations and arsenic speciation in Chinese rice. Environ. Pollut. 2018, 238, 482–490. [Google Scholar] [CrossRef]
  42. Muniz, P.; Danulat, E.; Yannicelli, B.; Alonso, J.G.; Medina, G.; Cego, M. Assessment of contamination by heavy metals and petroleum hydrocarbons in sediments of Montevideo Harbour (Uruguay). Environ. Int. 2004, 29, 1019–1028. [Google Scholar] [CrossRef]
  43. Atafar, Z.; Mesdaghinia, A.; Nouri, J.; Homaee, M.; Yunesian, M.; Ahmadimoghaddam, M.; Mahvi, A.H. Effect of fertilizer application on soil heavy metal concentration. Environ. Monit. Assess. 2010, 160, 83–89. [Google Scholar] [CrossRef]
  44. Hakim, A.S.; Adila, H.N.A.; Liyana, Z.F.; Mu’izzah, M.; Joon, C.C.; Fatehah, M.O. Assessment of Heavy Metal Contamination in Sediments in Sungai Pinang River Basin. IOP Conf. Ser. Earth Environ. Sci. 2020, 498, 012059. [Google Scholar] [CrossRef]
  45. Vane, C.H.; Harrison, I.; Kim, A.W.; Hayes, V.M. Organic and metal contamination in surface mangrove sediments of South China. Mar. Pollut. Bull. 2009, 58, 134–144. [Google Scholar] [CrossRef] [PubMed] [Green Version]
  46. Passos, T.; Penny, D.; Barcellos, R.; Nandan, S.B.; Babu, D.S.S.; Santos, I.R.; Sanders, C.J. Increasing carbon nutrient and trace metal accumulation driven by development in a mangrove estuary in south Asia. Sci. Total Environ. 2022, 832, 154900. [Google Scholar] [CrossRef] [PubMed]
  47. Alongi, D.M.; Pfitzner, J.; Trott, L.A.; Tirendi, F.; Dixon, P.; Klumpp, D.W. Rapid sediment accumulation and microbial mineralization in forests of the mangrove Kandelia candel in the Jiulongjiang Estuary, China. Estuarine Coast. Shelf Sci. 2005, 63, 605–618. [Google Scholar] [CrossRef]
  48. Gopalakrishnan, G.; Wang, S.; Mo, L.; Zou, J.; Zhou, Y. Distribution determination risk assessment and source identification of heavy metals in mangrove wetland sediments from Qi’ao Island South China. Reg. Stud. Mar. Sci. 2020, 33, 100961. [Google Scholar] [CrossRef]
  49. Li, R.; Li, R.; Chai, M.; Shen, X.; Xu, H.; Qiu, G. Heavy metal contamination and ecological risk in Futian mangrove forest sediment in Shenzhen Bay South China. Mar. Pollut. Bull. 2015, 101, 448–456. [Google Scholar] [CrossRef]
  50. Liu, J.; Ma, K.; Qu, L. Ecological risk assessments and context-dependence analysis of heavy metal contamination in the sediments of mangrove swamp in Leizhou Peninsula China. Mar. Pollut. Bull. 2015, 100, 224–230. [Google Scholar] [CrossRef]
  51. Deng, J.; Guo, P.; Zhang, X.; Shen, X.; Su, H.; Zhang, Y.; Wu, Y.M.; Xu, C. An evaluation on the bioavailability of heavy metals in the sediments from a restored mangrove forest in the Jinjiang Estuary, Fujian, China. Ecotoxicol. Environ. Saf. 2019, 180, 501–508. [Google Scholar] [CrossRef]
  52. Bastakoti, U.; Robertson, J.; Bourgeois, C.; Marchand, C.; Alfaro, A.C. Temporal variations of trace metals and a metalloid in temperate estuarine mangrove sediments. Environ. Monit. Assess. 2019, 191, 780.1–780.18. [Google Scholar] [CrossRef] [PubMed]
  53. Background Values of Soil Elements in China; China Environmental Science Press: Beijing, China, 1990; Available online: www.irgrid.ac.cn/handle/1471x/723390 (accessed on 6 September 2022).
  54. Persaud, D.; Jaagumagi, R.; Hayton, A. Guidelines for the Protection and Management of Aquatic Sediment Quality in Ontario; Environmental Science: Toronto, ON, Canada, 1993; Available online: http://hdl.handle.net/10214/15797 (accessed on 8 September 2022).
  55. Pe-Piper, G.; Piper, D.J.W.; Wang, Y.; Zhang, Y.Z.; Trottier, C.; Ge, C.D.; Yin, Y. Quaternary evolution of the rivers of northeast Hainan Island China: Tracking the history of avulsion from mineralogy and geochemistry of river and delta sands. Sediment. Geol. 2016, 333, 84–99. [Google Scholar] [CrossRef]
Figure 1. (a) Geographic location of the study area, and (b) The locations of the sampling sites.
Water 14 03785 g001
Figure 2. The overall spatial distribution of (a,kn) physico-chemical properties (pH, Al2O3, Corg, N, P) and (bj) heavy metals (As, Cd, Cr, Cu, Hg, Pb, Ni, Zn, Co) from 0–100 cm in the wetland sediment.
Water 14 03785 g002
Figure 3. Ternary diagram of the wetland sediment particle-size characteristics.
Water 14 03785 g003
Figure 4. (ai) Heavy metals (As, Cd, Cr, Cu, Hg, Pb, Ni, Ni, Zn, Co) at each layer from 0–100 cm in thewetland sediment.
Water 14 03785 g004
Figure 5. The overall Pearson’s correlation coefficients between heavy metals and physico−chemical properties.
Water 14 03785 g005
Figure 6. The overall heat map of the physico−chemical properties and heavy metals concentrations in the wetland sediment, showing their significant variations and interactions among the variables. Shade represents the mean concentration after normalization. The left tree diagram represents the clustering of points. The upper tree diagram represents the clustering of elements with correlation.
Water 14 03785 g006
Figure 7. The result of the overall individual potential ecological risk index (Eir) of each heavy metal element within 0–100 cm of wetland sediment.
Water 14 03785 g007
Figure 8. The result of the individual potential ecological risk index (Eir) of each heavy metal element at each layer within 0–100 cm in the wetland sediment.
Water 14 03785 g008
Figure 9. Potential ecological risk index (RI). (a) The result of overall comprehensive ecological risk assessment within 0–100 cm of wetland sediment. (b) The result of comprehensive ecological risk assessment at each layer within 0–100 cm in the wetland sediment. Multiple probable effect concentrations quality (mPECQs). (c) The result of overall comprehensive ecological risk assessment within 0–100 cm of wetland sediment. (d) The result of comprehensive ecological risk assessment at each layer within 0–100 cm in the wetland sediment.
Water 14 03785 g009
Table 1. Risk evaluation expression and physical significance.
NameExpressionCoefficient of InterpretationClassification and Contamination DegreeReference
Individual potential ecological risk index (Eir) E r i = T r i × C i C ref Tir: Toxicity coefficient, according to previous research results, the toxicity response coefficients of Hg, Cd, As, Cu, Pb, Ni, Cr, Co and Zn are 40, 30, 10, 5, 5, 5, 2, 2, 1, respectively.
Ci: The measured content of element i in sediments (mg/kg).
Cref: The geochemical background value of element n (mg/kg).
Eir < 40: Low risk
40 ≤ Eir < 80: Moderate risk
80 ≤ Eir < 160: Heavy risk
160 ≤ Eir < 320: Serious risk
Eir ≥ 320: Extremely serious risk
[28]
Potential ecological risk index(RI) R I = i = 1 n E r i Eir: Individual potential ecological risk index.RI < 150: Low risk
150 < RI ≤ 300: Moderate risk
300 < RI ≤ 600: Serious risk
RI > 600: Extremely serious risk
[29]
Multiple probable effect concentrations quality (mPECQs) mPECQs = i = 1 n C i P E C i n Ci: The measured content of element i in sediments (mg/kg).
PECi: The consensus-based probable effect concentration of individual metal. The PEC values of Cr, Ni, Cu, As, Cd, Pb, Zn, and Hg were 111, 48.6, 149, 33, 4.8, 129, 459 and 1.06 mg/kg,
n: The number of heavy metals.
mPECQs < 1: Non-toxic; the incidence of toxicity is relatively low (<25%)
1 ≤ mPECQs < 5: the incidence of toxicity is 25–75%
mPECQs ≥ 5: Toxic; the incidence of toxicity is more than 75%
[30]
Table 2. A statistical summary of physico-chemical properties and heavy metal concentration of sediments (mg/kg).
Horizontal dimensionpHAsCdCrCuHgPbNiZnCoPNAl2O3 (%)Corg (%)Sand (%)Silt (%)Clay (%)
Min4.842.850.0328.347.140.0112.537.7424.112.43115.61253.505.990.2910.240.14.3
Max8.327.490.14171.1649.070.1131.4175.82122.2333.55842.351282.9017.122.6051.274.520.3
Median7.185.140.0558.3813.180.0219.9522.1456.8810.09304.79429.0011.010.9032.855611.3
Mean6.955.290.0670.0317.450.0320.5829.0864.4212.82377548.2211.721.0633.0555.5011.46
Standard deviation1.10 1.40 0.03 32.57 10.57 0.02 4.65 16.06 23.19 6.65 180.66 334.52 2.97 0.68 15.7113.214.51
Coefficient of variation (%)15.8626.5446.3546.5260.671.5522.5855.2336.0051.9047.9261.0225.3563.6347.5323.8039.35
Table 3. Heavy metal concentration statistics of sediments (mg/kg).
Vertical DimensionAsCdCrCuHgPbNiZnCo
0–10 cm5.970.0872.2719.040.0421.5228.968.313.06
10–20 cm5.980.0770.9018.580.0421.4229.0266.3912.96
20–30 cm5.830.0669.1618.160.0321.1228.6265.0612.75
30–40 cm5.540.0670.5817.540.0320.8328.4963.7812.49
40–50 cm5.220.0668.8717.190.0320.7328.7763.1612.42
50–60 cm4.990.0669.5717.080.0320.5528.9962.3612.61
60–70 cm4.900.0569.5817.170.0320.5829.2663.3912.94
70–80 cm4.730.0670.3816.740.0319.9829.5463.6112.9
80–90 cm4.800.0569.5816.770.0319.7629.7163.8513.00
90–100 cm4.950.0669.4216.220.0319.3329.5464.2713.11
Standard deviation0.50 0.01 1.02 0.89 0.003 0.71 0.41 1.75 0.24
Coefficient of variation (%)9.3614.111.455.089.323.461.422.721.88
Table 4. Concentrations and quality standards of heavy metals in mangrove sediments worldwide.
Location and YearAverage Content of Heavy Metal Elements (mg/kg)Reference
AsCdCrCuHgPbNiZnCo
Dongzhai Harbor, Hainan, 20205.290.0670.0317.450.0320.5829.0864.4212.82This Study
Qi’ao Island, Guangdong, 2015-9.50389.281.50-70.6050.40241.7-[48]
Futian, Shenzhen, 2014-3.0055.4031.70-47.80-296.3-[49]
Leizhou Peninsula, Hong Kong, 201240.630.2167.2918.41-33.3549.4885.62-[50]
Jinjiang Estuary, Fujian,2017-0.14-11.07-41.9314.6372.41-[51]
Jiulong River Estuary, Xiamen, 201812.99-63.9834.250.1573.5428.62146.6-[6]
East and west coast of India, 2016--160.563.35-30.4556.25116.3-[3]
Sydney Estuary, Australia, 20128.100.5931.0042.00-95.009.501564.30[4]
Mangefil, New Zealand, 201436.940.24-10.15-1.11-14.64-[52]
Ho Chi Minh City, Vietnam, 201717.00-124.026.00-26.0060.00113.0-[13]
Background values of soil heavy metals in Hainan Island, 20188.900.0650.5017.000.0836.0014.4047.307[53]
Ontario Guidelines for The Protection and Management of Aquatic Sediments (LEL), 199360.626160.23116120-[54]
Publisher’s Note: MDPI stays neutral with regard to jurisdictional claims in published maps and institutional affiliations.

