1. Introduction
Habitat quality is the basis of ecosystem services, which refers to the ability of ecosystems to provide benefits to the survival, reproduction, and development for organisms. It can reflect, to a certain extent, the state of biodiversity in the region, which is the objective existence of essential properties in the ecological environment [
1,
2]. The habitat has social and ecological benefits for human and species survival [
3]. However, with the development of the economy and societies, changes in land use mode, intensity, and patterns caused by large-scale human activities significantly impact the quality of biological habitats. These changes cause fragmentation, degradation, and even loss of local habitats, reducing habitat biodiversity and ecological service value, which will affect human well-being [
4,
5]. Therefore, exploring the relationship between land use and habitat quality, and simulating future changes in land use and habitat quality under different scenarios is significant for protecting regional biodiversity and sustainable land use.
Numerous studies have shown that habitat degradation due to land use change is a significant driver of biodiversity [
6], and that land use change directly results from human–nature interactions [
7]. In recent decades, land use change due to rapid global urbanization has had profound impacts on habitat quality [
8], as it affects the cycling processes of material and energy flows between habitat patches and alters the patterns and functions of regional habitat distribution [
7]. The impact of land use on habitat quality will continue to deepen in the future due to increasing urbanization. Therefore, predicting the impact of land use change on habitat quality is an urgent task in coordinating sustainable land development and habitat conservation [
8]. Nowadays, land use prediction models mainly include the FLUS model, CLUE-S model, CA-Markov model, and other models based on cellular automata. However, the FLUS model has difficulty reflecting the spatial differences in land use changes in different regions [
9]. The CLUE-S model ignores the possibility of non-dominant land type transformations [
10]. The CA-Markov model has had good results with predicting future land use. Abijith et al. [
11] projected the land use of the Tamil Nadu for 2019–2030 to explore future urban growth scenarios under natural and anthropogenic pressures. Taking Beijing as an example, Yi et al. [
12] predicted and optimized the land use changes in the study area in 2030, based on land adaptation evaluations to provide scientific references for land use planning. Wang et al. [
13] simulated the LUCC of 29 towns in the Connecticut River Basin by OLR-CA-Markov (ordinary logistic regression-CA-Markov) and GWR-CA-Markov (geographically weighted regression-CA-Markov) methods to verify the advantages and disadvantages of the two methods.
Current research on habitat quality has focused on two aspects: habitat quality studies on species groups [
14,
15] and overall regional habitat quality studies [
16,
17]. During the study of individual species groups, the distribution data of species are mainly obtained through field monitoring, such as for giant pandas [
18], tanager cranes [
19], grassland Orthoptera communities [
20], fish communities [
21], and habitat quality studies on plant diversity [
22], which is a difficult and expensive method of data collection and only suitable for small-scale regional studies. At the regional study scale level, the methods used mainly include nature reserves [
23], urban scale [
24], provincial scale [
25], and watershed scale [
26]. The methods studied mainly involve the InVEST model [
27,
28,
29], MaxEnt model [
19], FLUS model [
30], and the combination of grid evaluation and landscape patterns [
31]. The InVEST model applies to different regional scales, showing better ecological process integration and good spatial display effects [
32], and its habitat quality module can quickly assess the impact of different threats and land use types on biodiversity [
33]. Studies have shown that this model effectively assesses biodiversity and habitat quality [
34,
35,
36].
The work mentioned above has promoted the study of regional habitat quality and provided a deeper understanding of the spatial and temporal variation of habitat quality, influencing factors, and conservation measures. However, there is still room for further research and deepening understanding. First, most of the studies on the Yellow River Basin have focused on some parts, such as its nature reserves, provinces, cities, or sub-basins, but there are still only a few studies that have examined the Yellow River Basin as a whole. Therefore, this study will examine the habitat quality of the Yellow River Basin, as a whole, to reveal the characteristics of land use and habitat quality changes in the entire basin. Second, under the circumstance that future land use is not easy to predict, especially on the time scale for studying environmental quality, researchers generally study habitat quality using the current land use pattern or changing trends in habitat quality from a historical perspective. There have been few studies on land use and habitat quality changes using different possible scenarios.
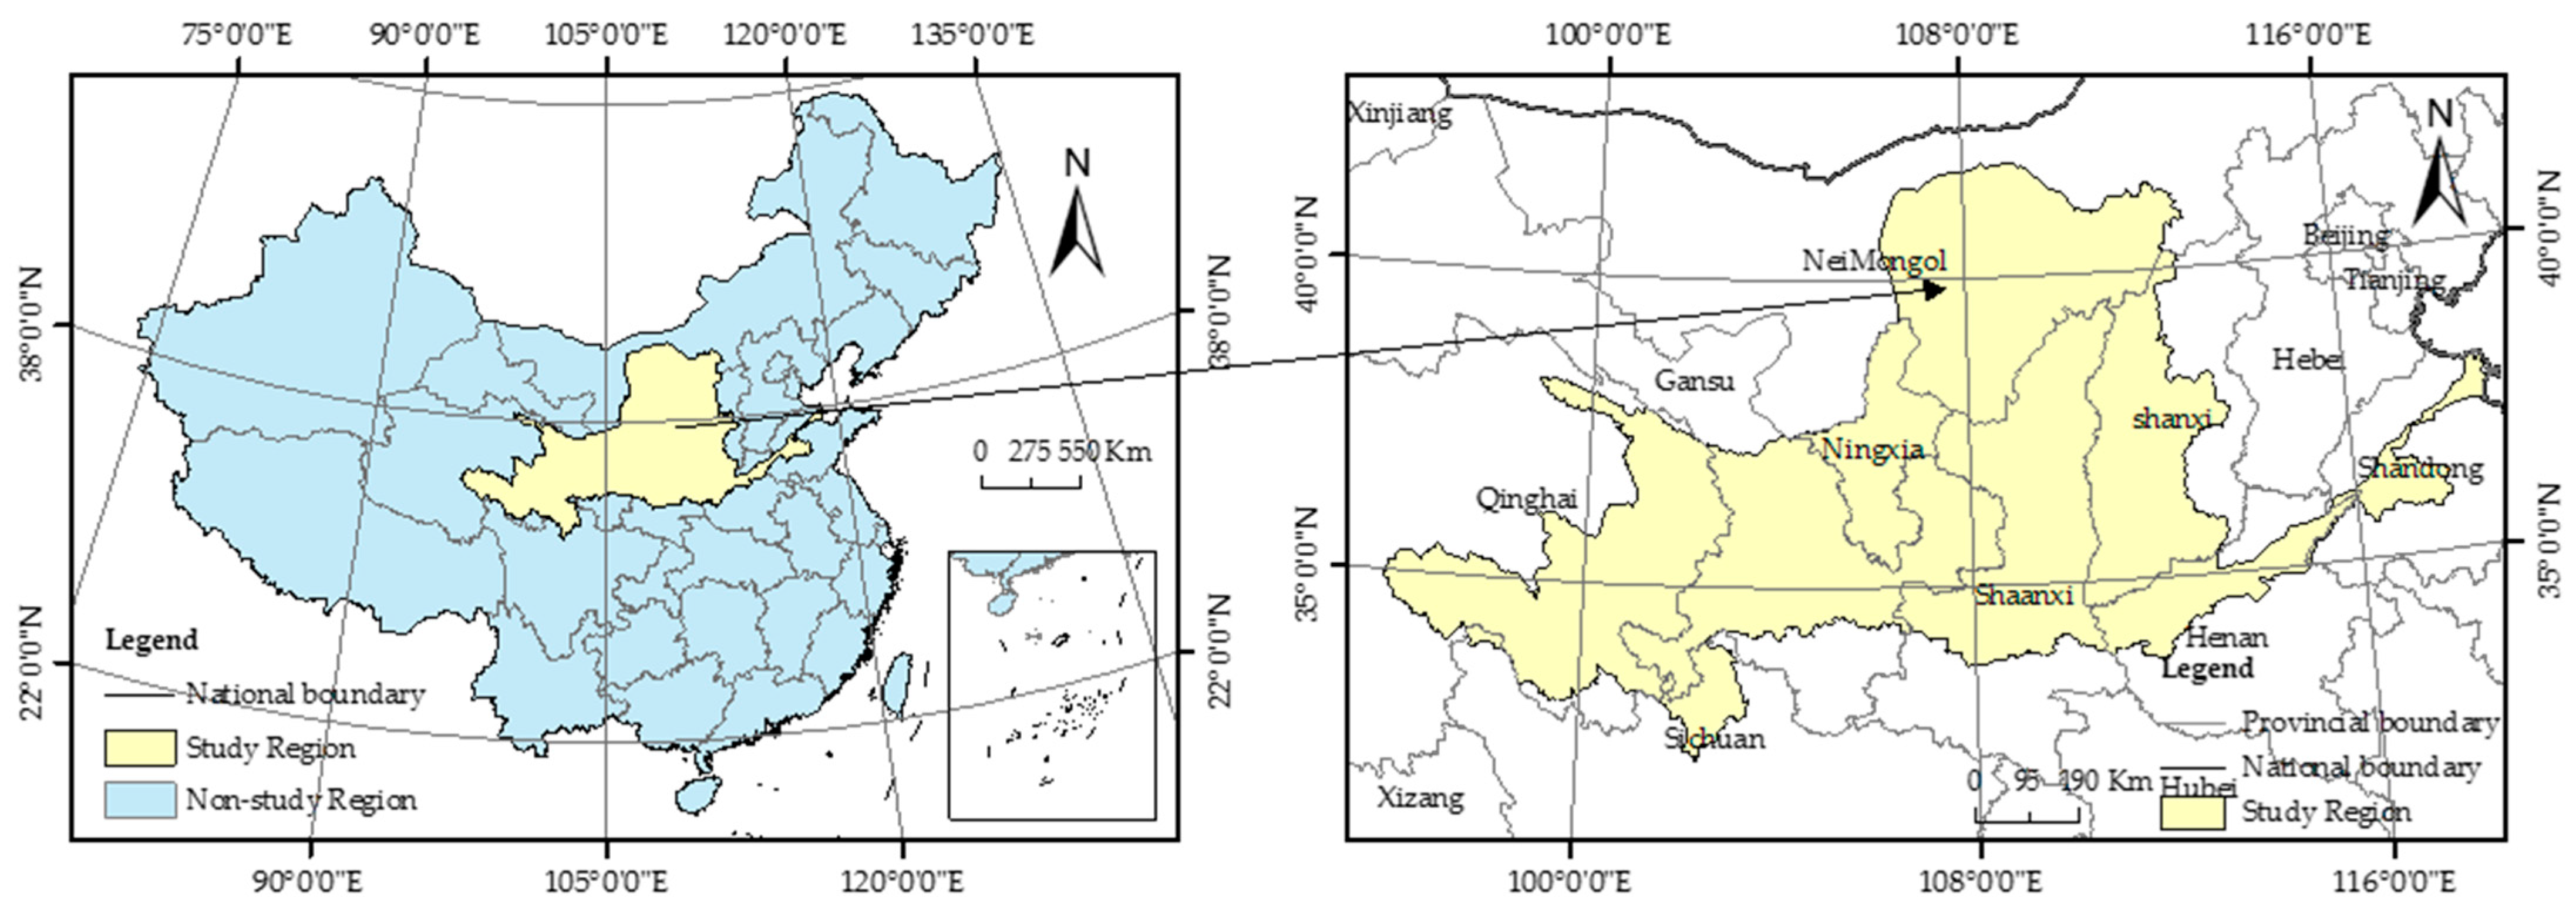
General Secretary Xi Jinping has repeatedly pointed out that the high-quality development of the Yellow River Basin “must adhere to the concept that lucid waters and lush mountains are invaluable assets, and adhere to ecological priority and green development” [
37]. The Yellow River Basin is one of the regions with the most concentrated habitats in population, resources, and environment in China [
38]; many animals and plants live and multiply here. However, its ecological environment is relatively fragile [
39], facing ecosystem degradation, soil erosion, and various pollution problems. Environmental protection is the bottom line for the high-quality development of the Yellow River Basin, and an excellent ecological environment is the basis for the sustainable development of the Yellow River Basin [
40]. Therefore, research on the Yellow River Basin’s habitat quality has become increasingly important. It is significant to study the impact of land use changes in this area on habitat quality. Based on previous research, this paper uses the improved Logistic-CA-Markov model to simulate future land use pattern of the Yellow River Basin under different scenarios. It selects the habitat quality module of the InVEST model to analyze the habitat quality of the Yellow River Basin from 2000 to 2040. Temporal and spatial evolution laws provide a scientific basis for protecting ecological diversity in the Yellow River Basin and the green development of regional ecology.
4. Discussion
4.1. Interpretation of Land Use Change
According to the study results, the land use pattern in the study area has changed significantly in the past 20 years, with dryland and grassland being the primary land use types in this area. The conversion of dryland to grassland and forestland is significant, mainly due to the policies of “returning farmland to grassland” and “returning farmland to the forest” in the Loess Plateau. Implementing these policies has dramatically increased the area of grassland and forest land by replanting cultivated land formed by reclaiming mountains and forests into grassland [
39]. However, scholars have different opinions on the main driving factors of the grassland area in the study area. Guo [
66] believes that human activities are the main factor causing this area’s change in vegetation coverage. Mao [
67] believes that the main factors in this area are social factors, and that the implementation of national policies played a significant role in driving and facilitating the process; in contrast, he claims that the impact of human activities is relatively small. However, Shahid Naeem [
68] claims that precipitation contributed the most to the restoration of vegetation cover in the region. In the future, this question deserves more in-depth research.
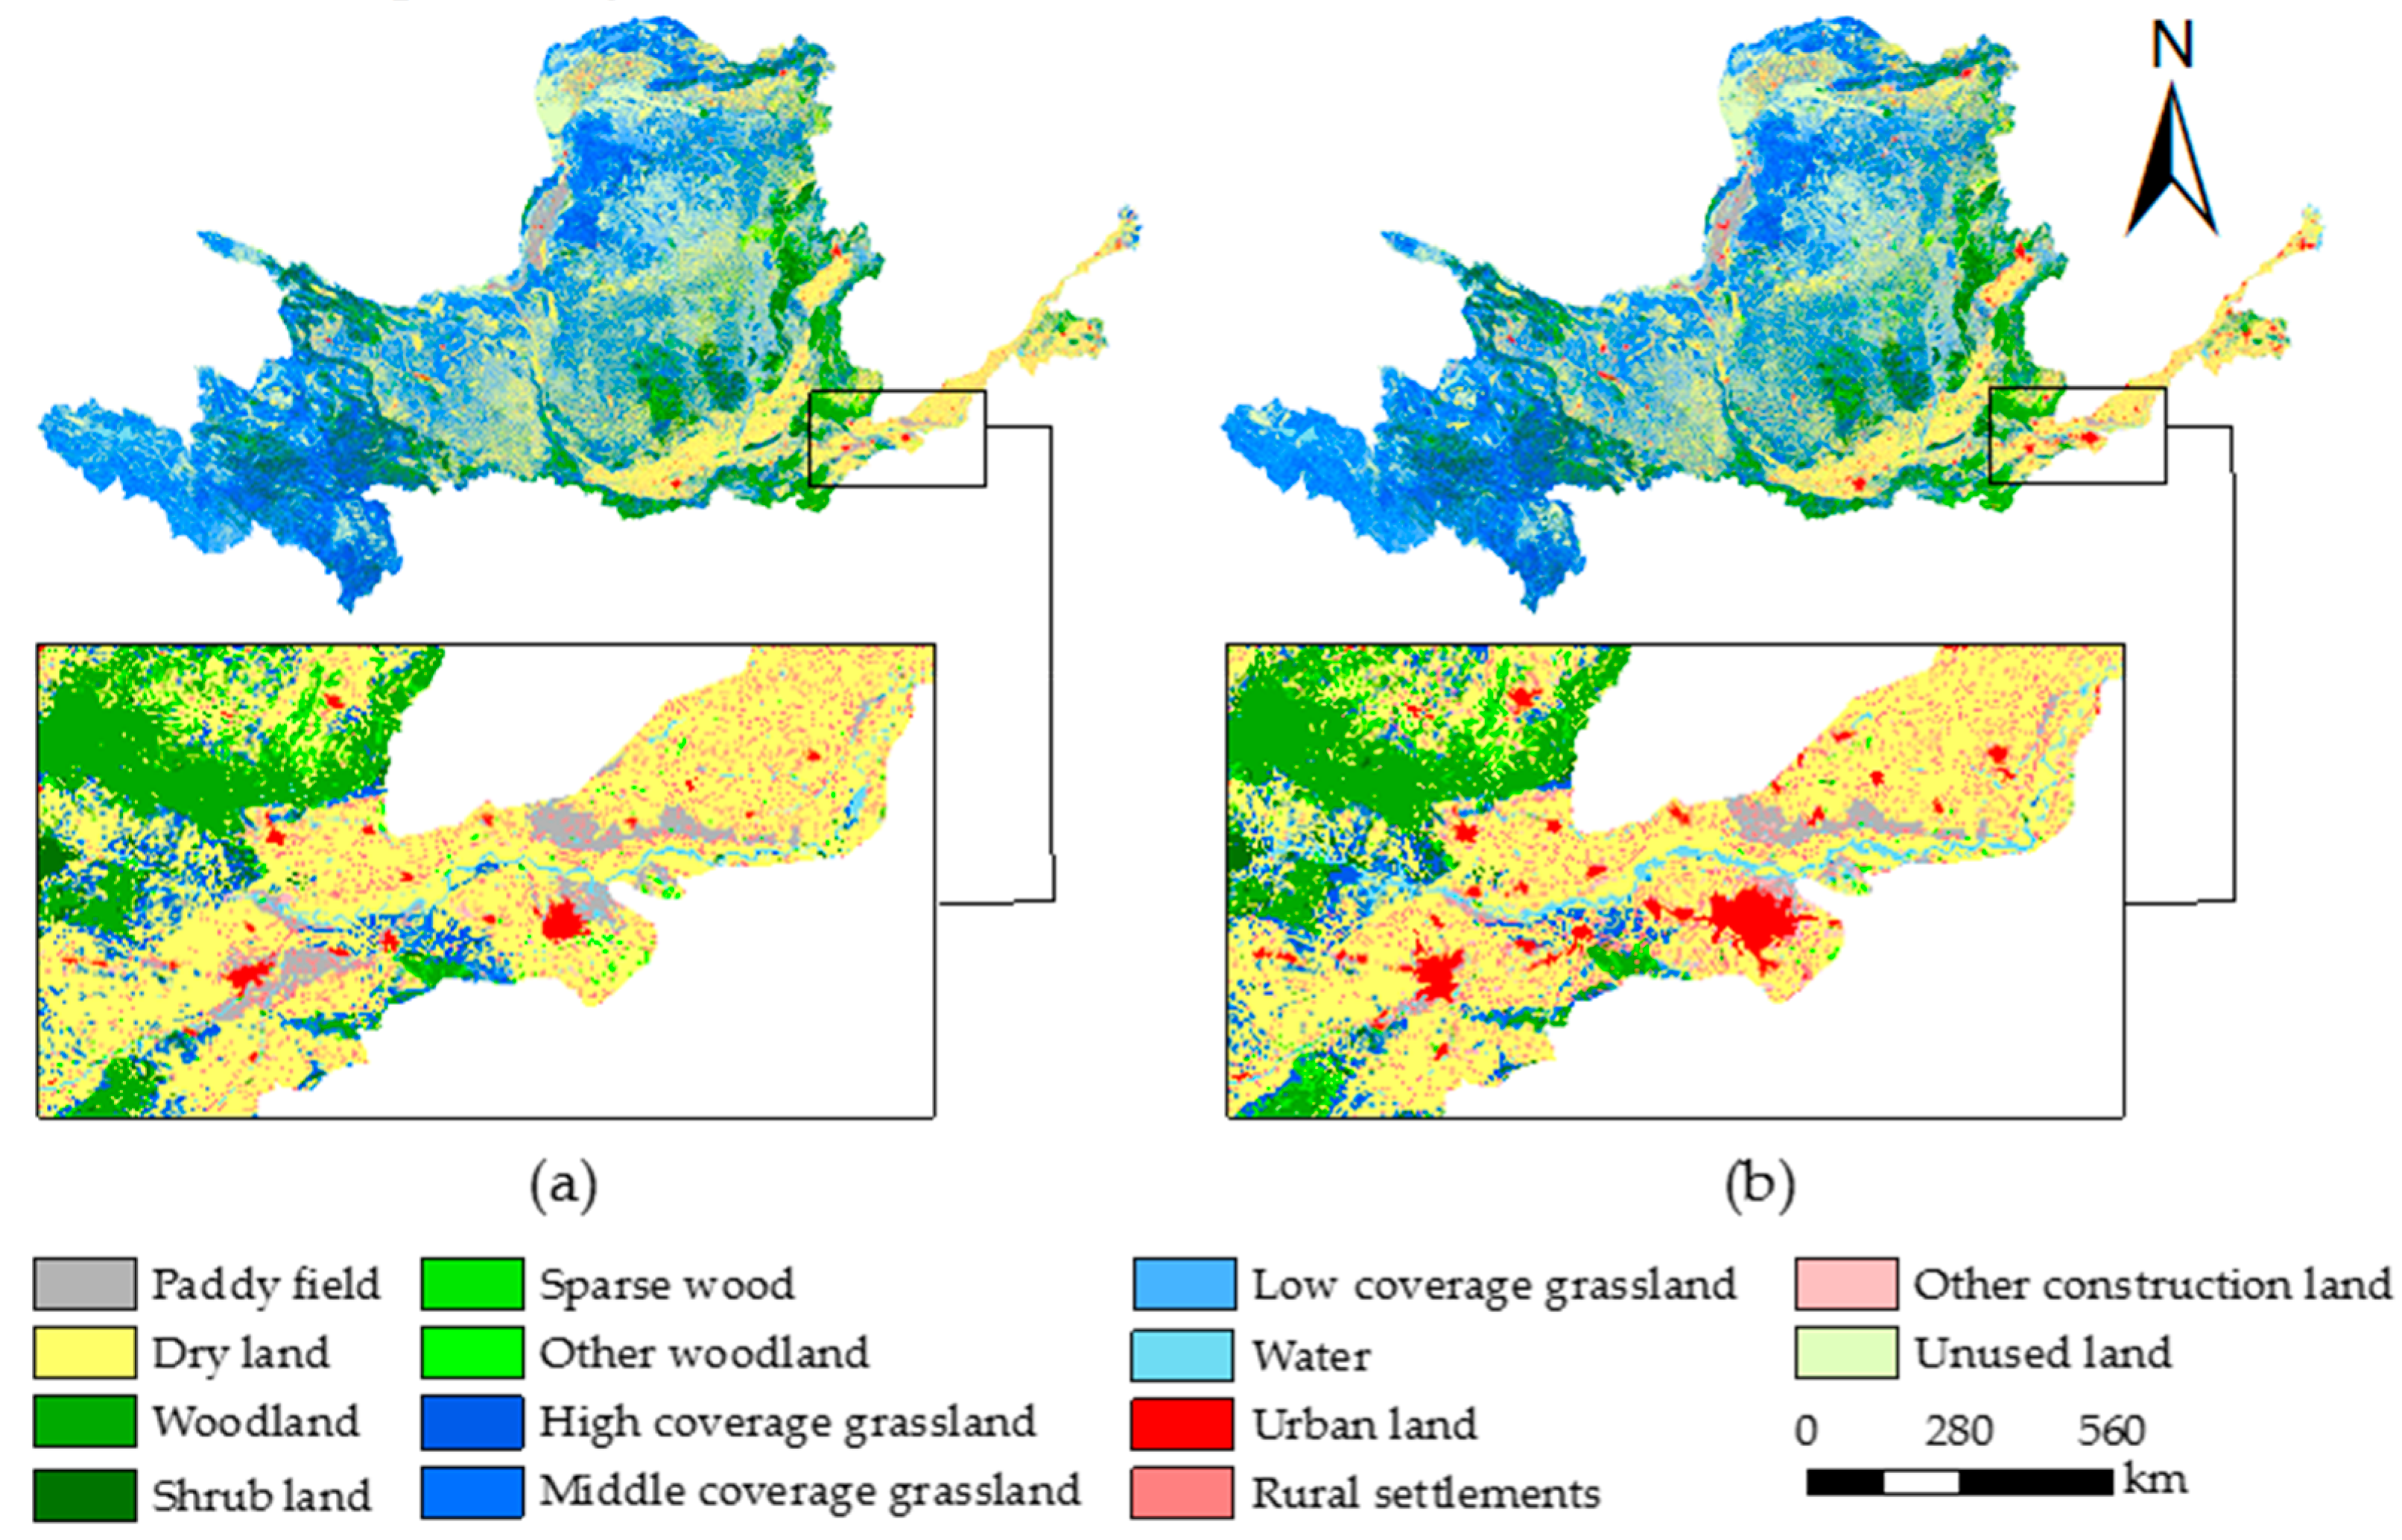
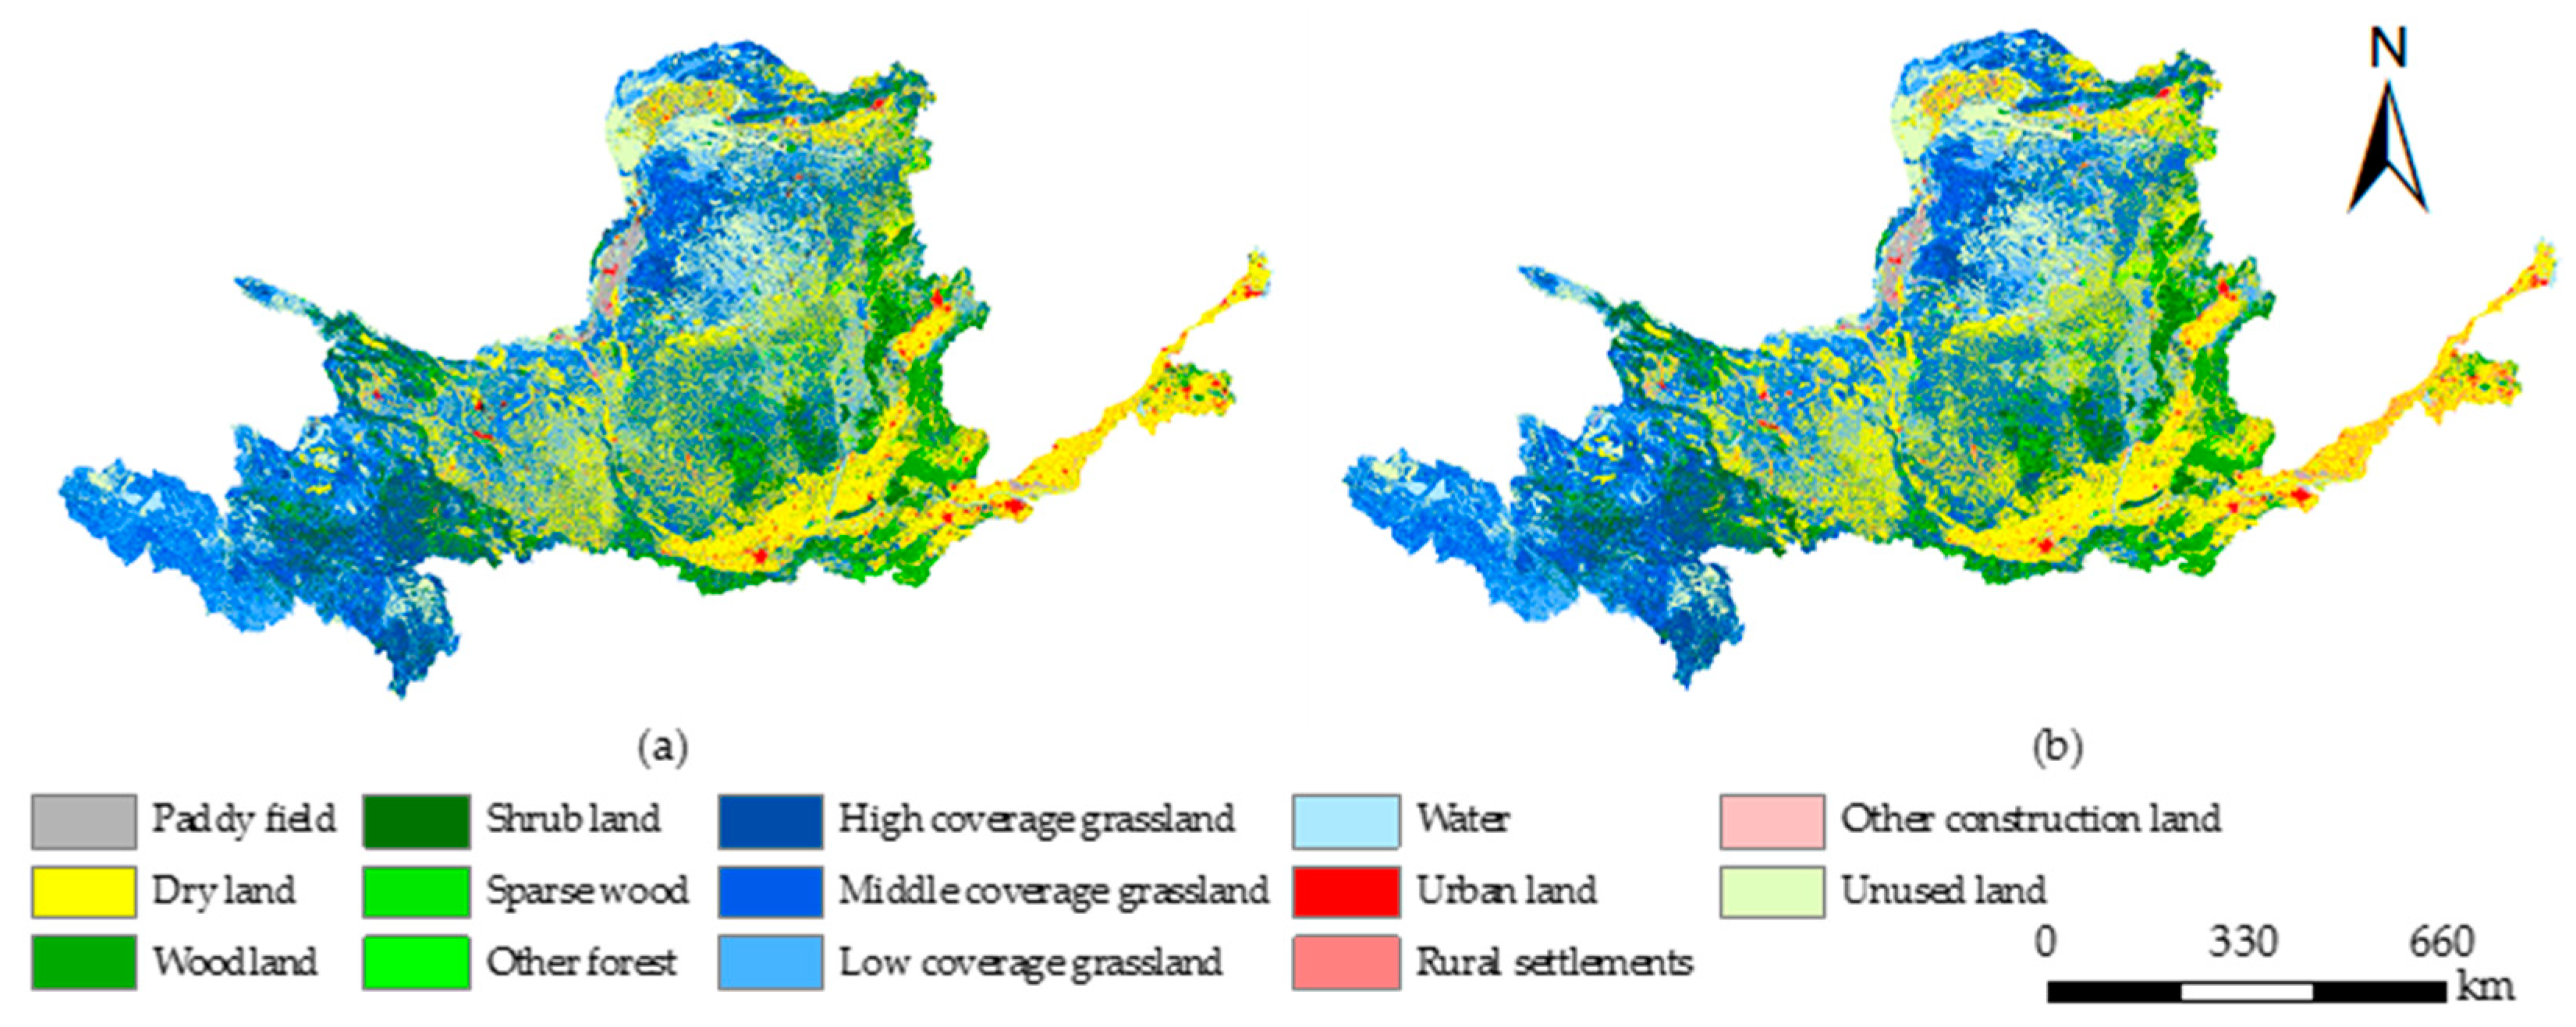
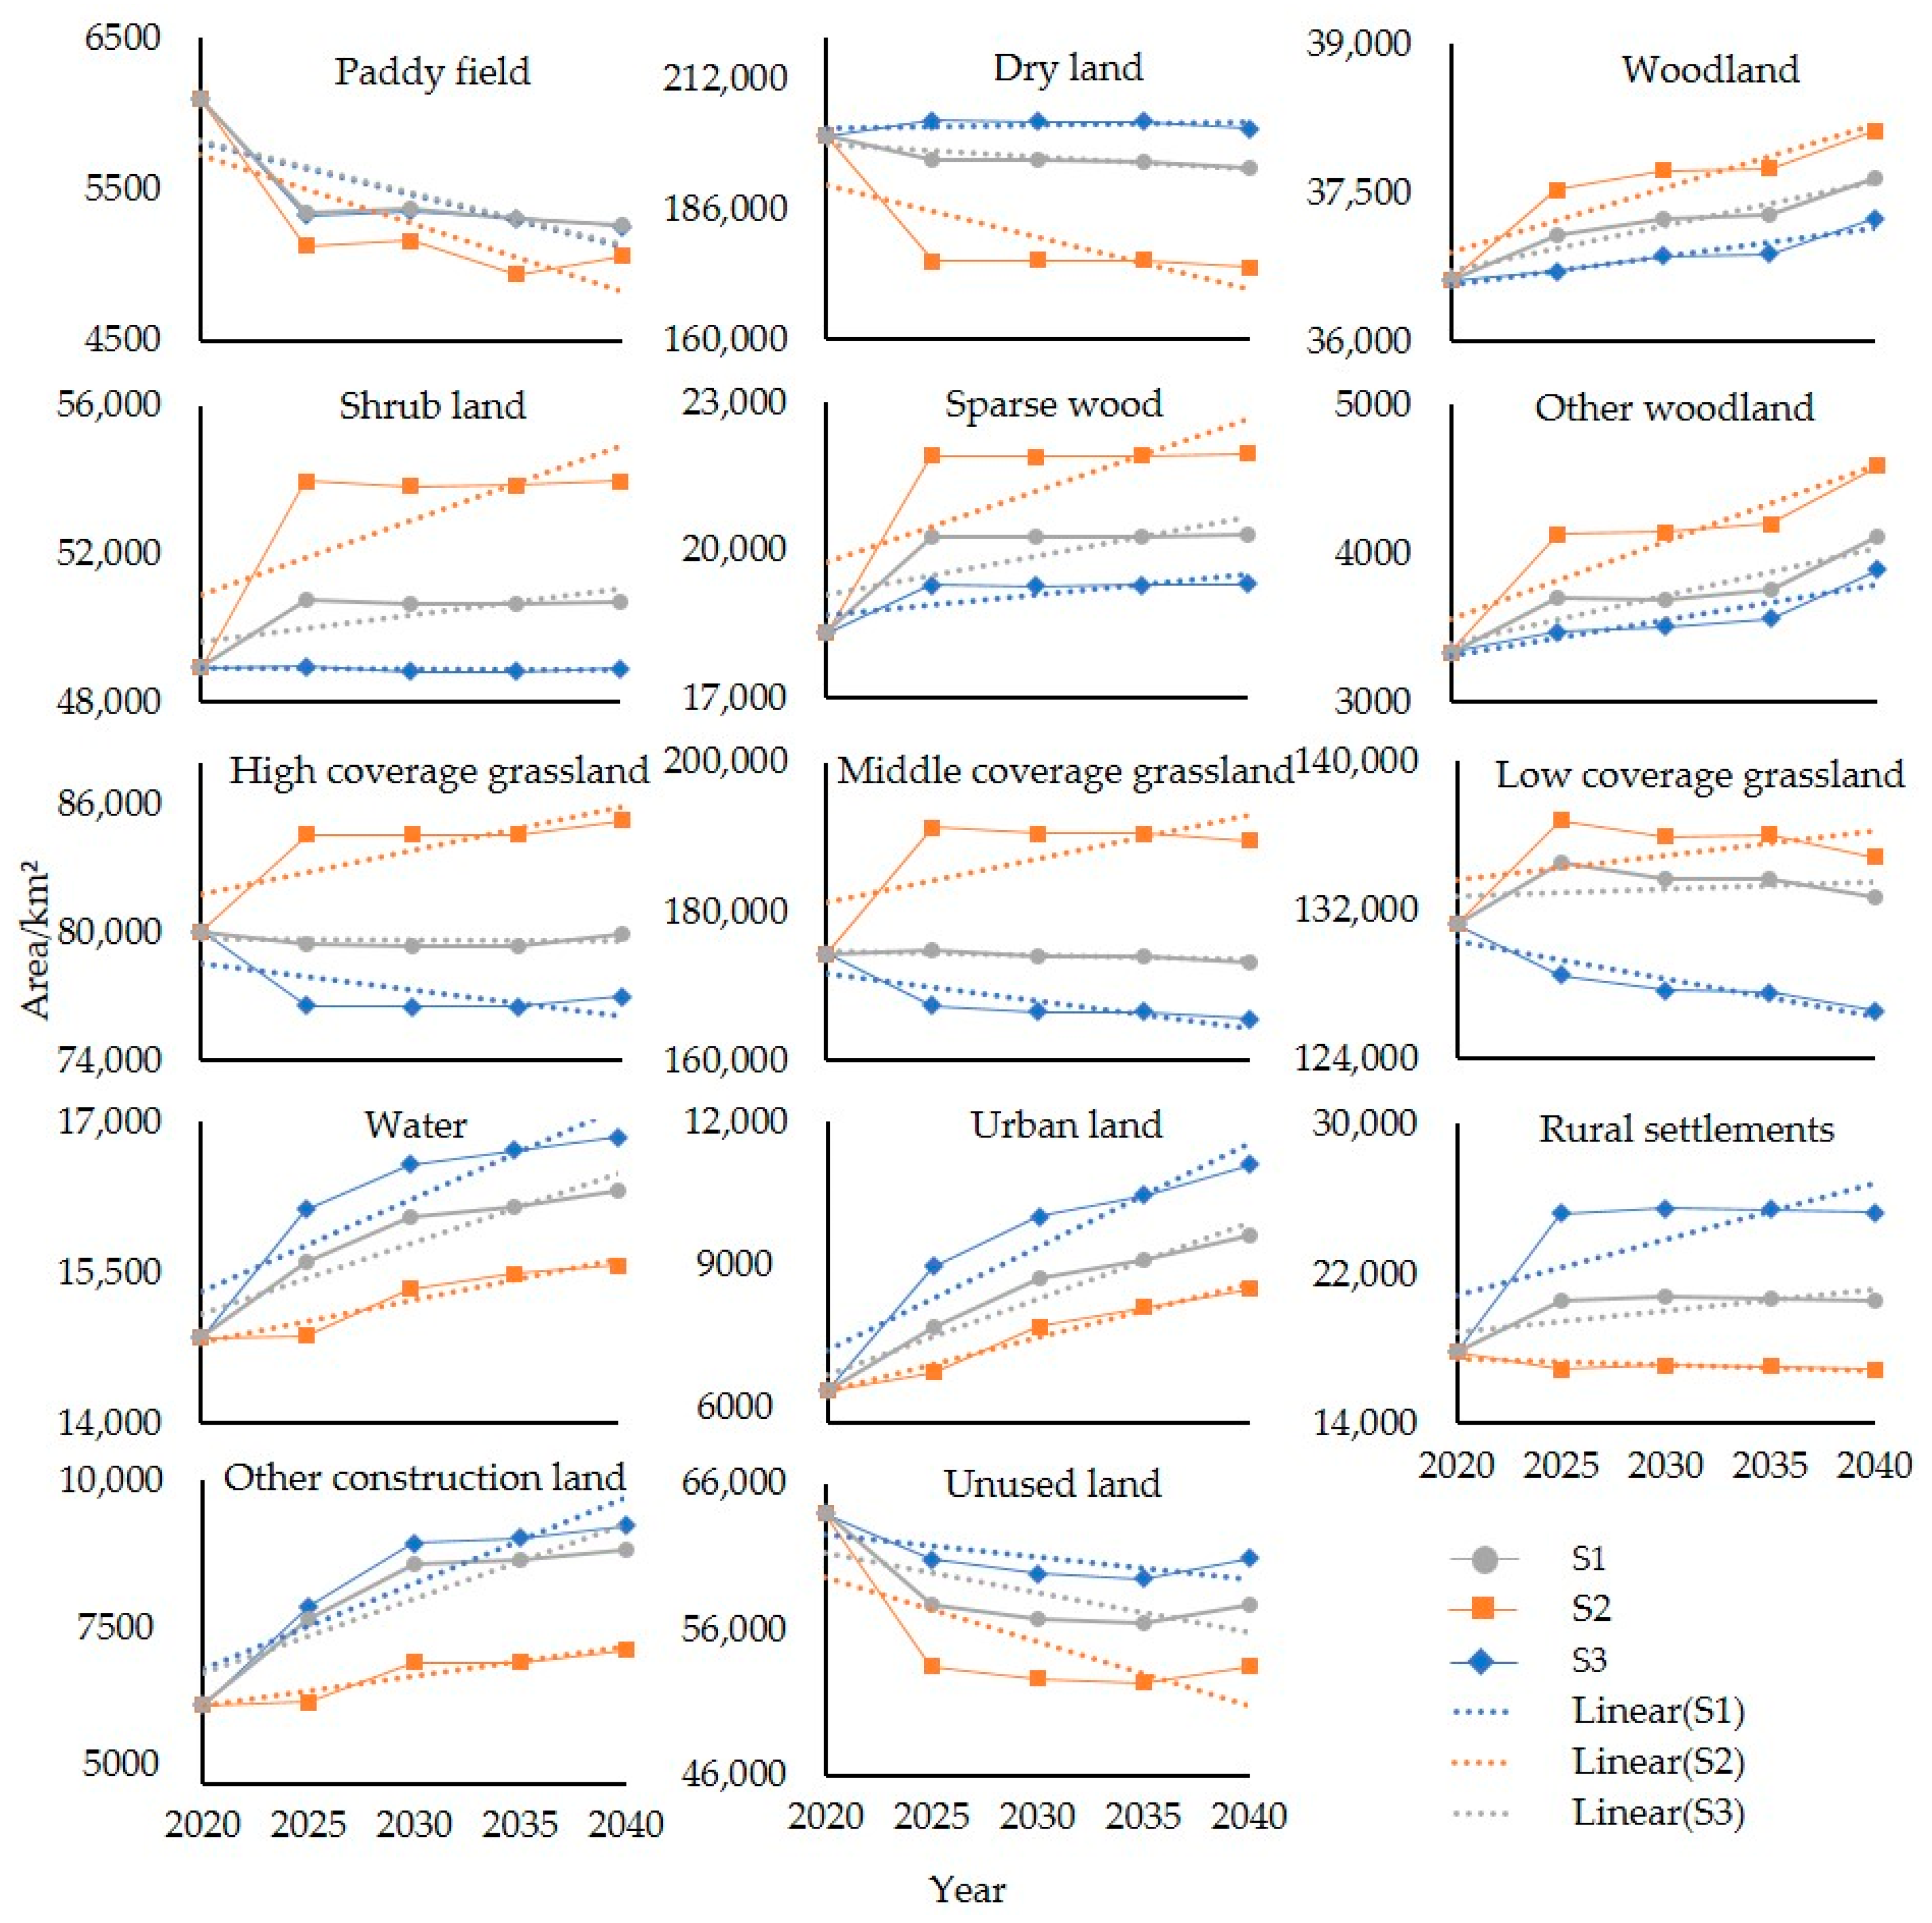
In the three scenarios, the spatial distribution of land use in the future study area was the same, but in some areas, the land use type changed significantly. Under S1, the changes in various land use categories were relatively stable, and the development situation was the same as in 2000, 2005, 2010, 2015, and 2020. Under S2, grassland and forest land rose faster, whereas urban land, rural settlements, and other construction land expanded significantly slower. Under S3, the expansion rate of construction land in various cities accelerated significantly, and the area of rural settlements and other construction land also increased substantially, especially in eastern cities and rural areas. The main reason is that, with the development of the economy and society, people’s demand for land is increasing, which occupies a large amount of cultivated land around towns and rural areas, and the eastern plain will inevitably be affected as a cultivated land area. Ecological protection can effectively curb the problem of encroaching on cultivated land, and can also improve the coverage of regional vegetation. However, implementing environmental conservation measures while improving the regional ecological environment may impact the economical production of the study area. At the same time, expanding towns and cities may negatively impact the local ecological environment. Therefore, S1 and S2 had some contradictions in some areas. In the future, weighing up the relationship between economic development and ecological protection will be an important research direction.
4.2. Response of Habitat Quality to Land Use Change
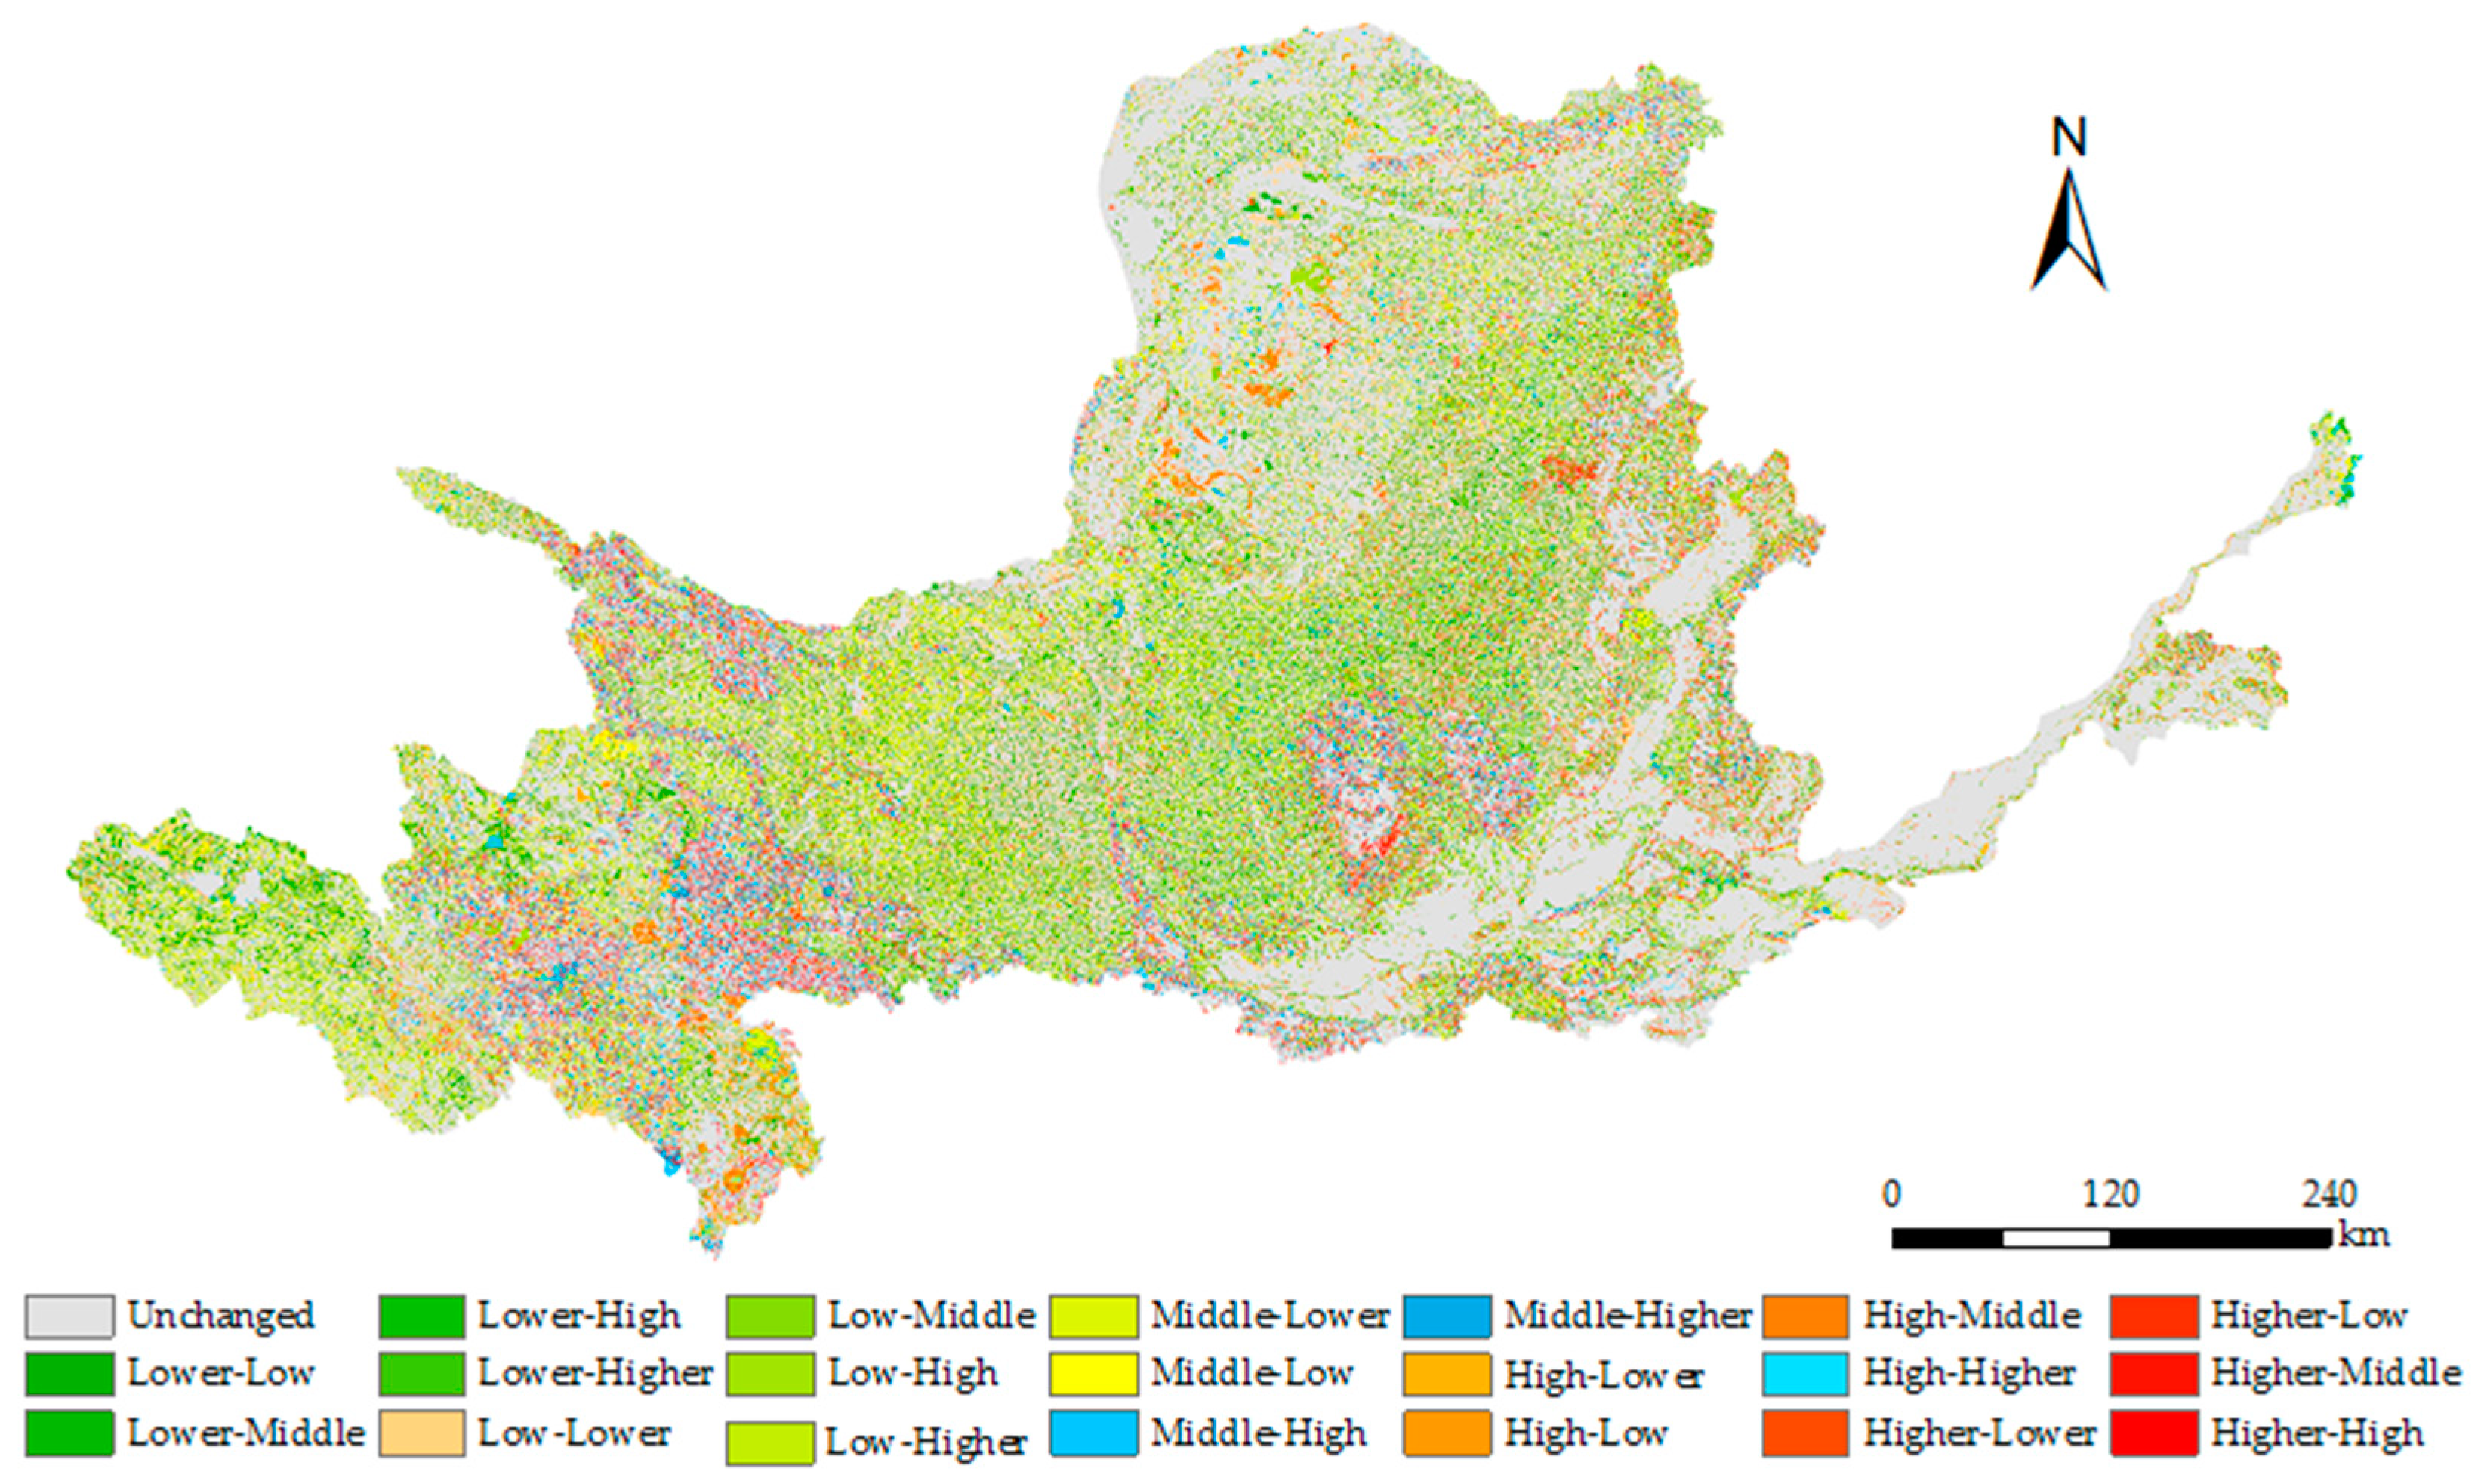
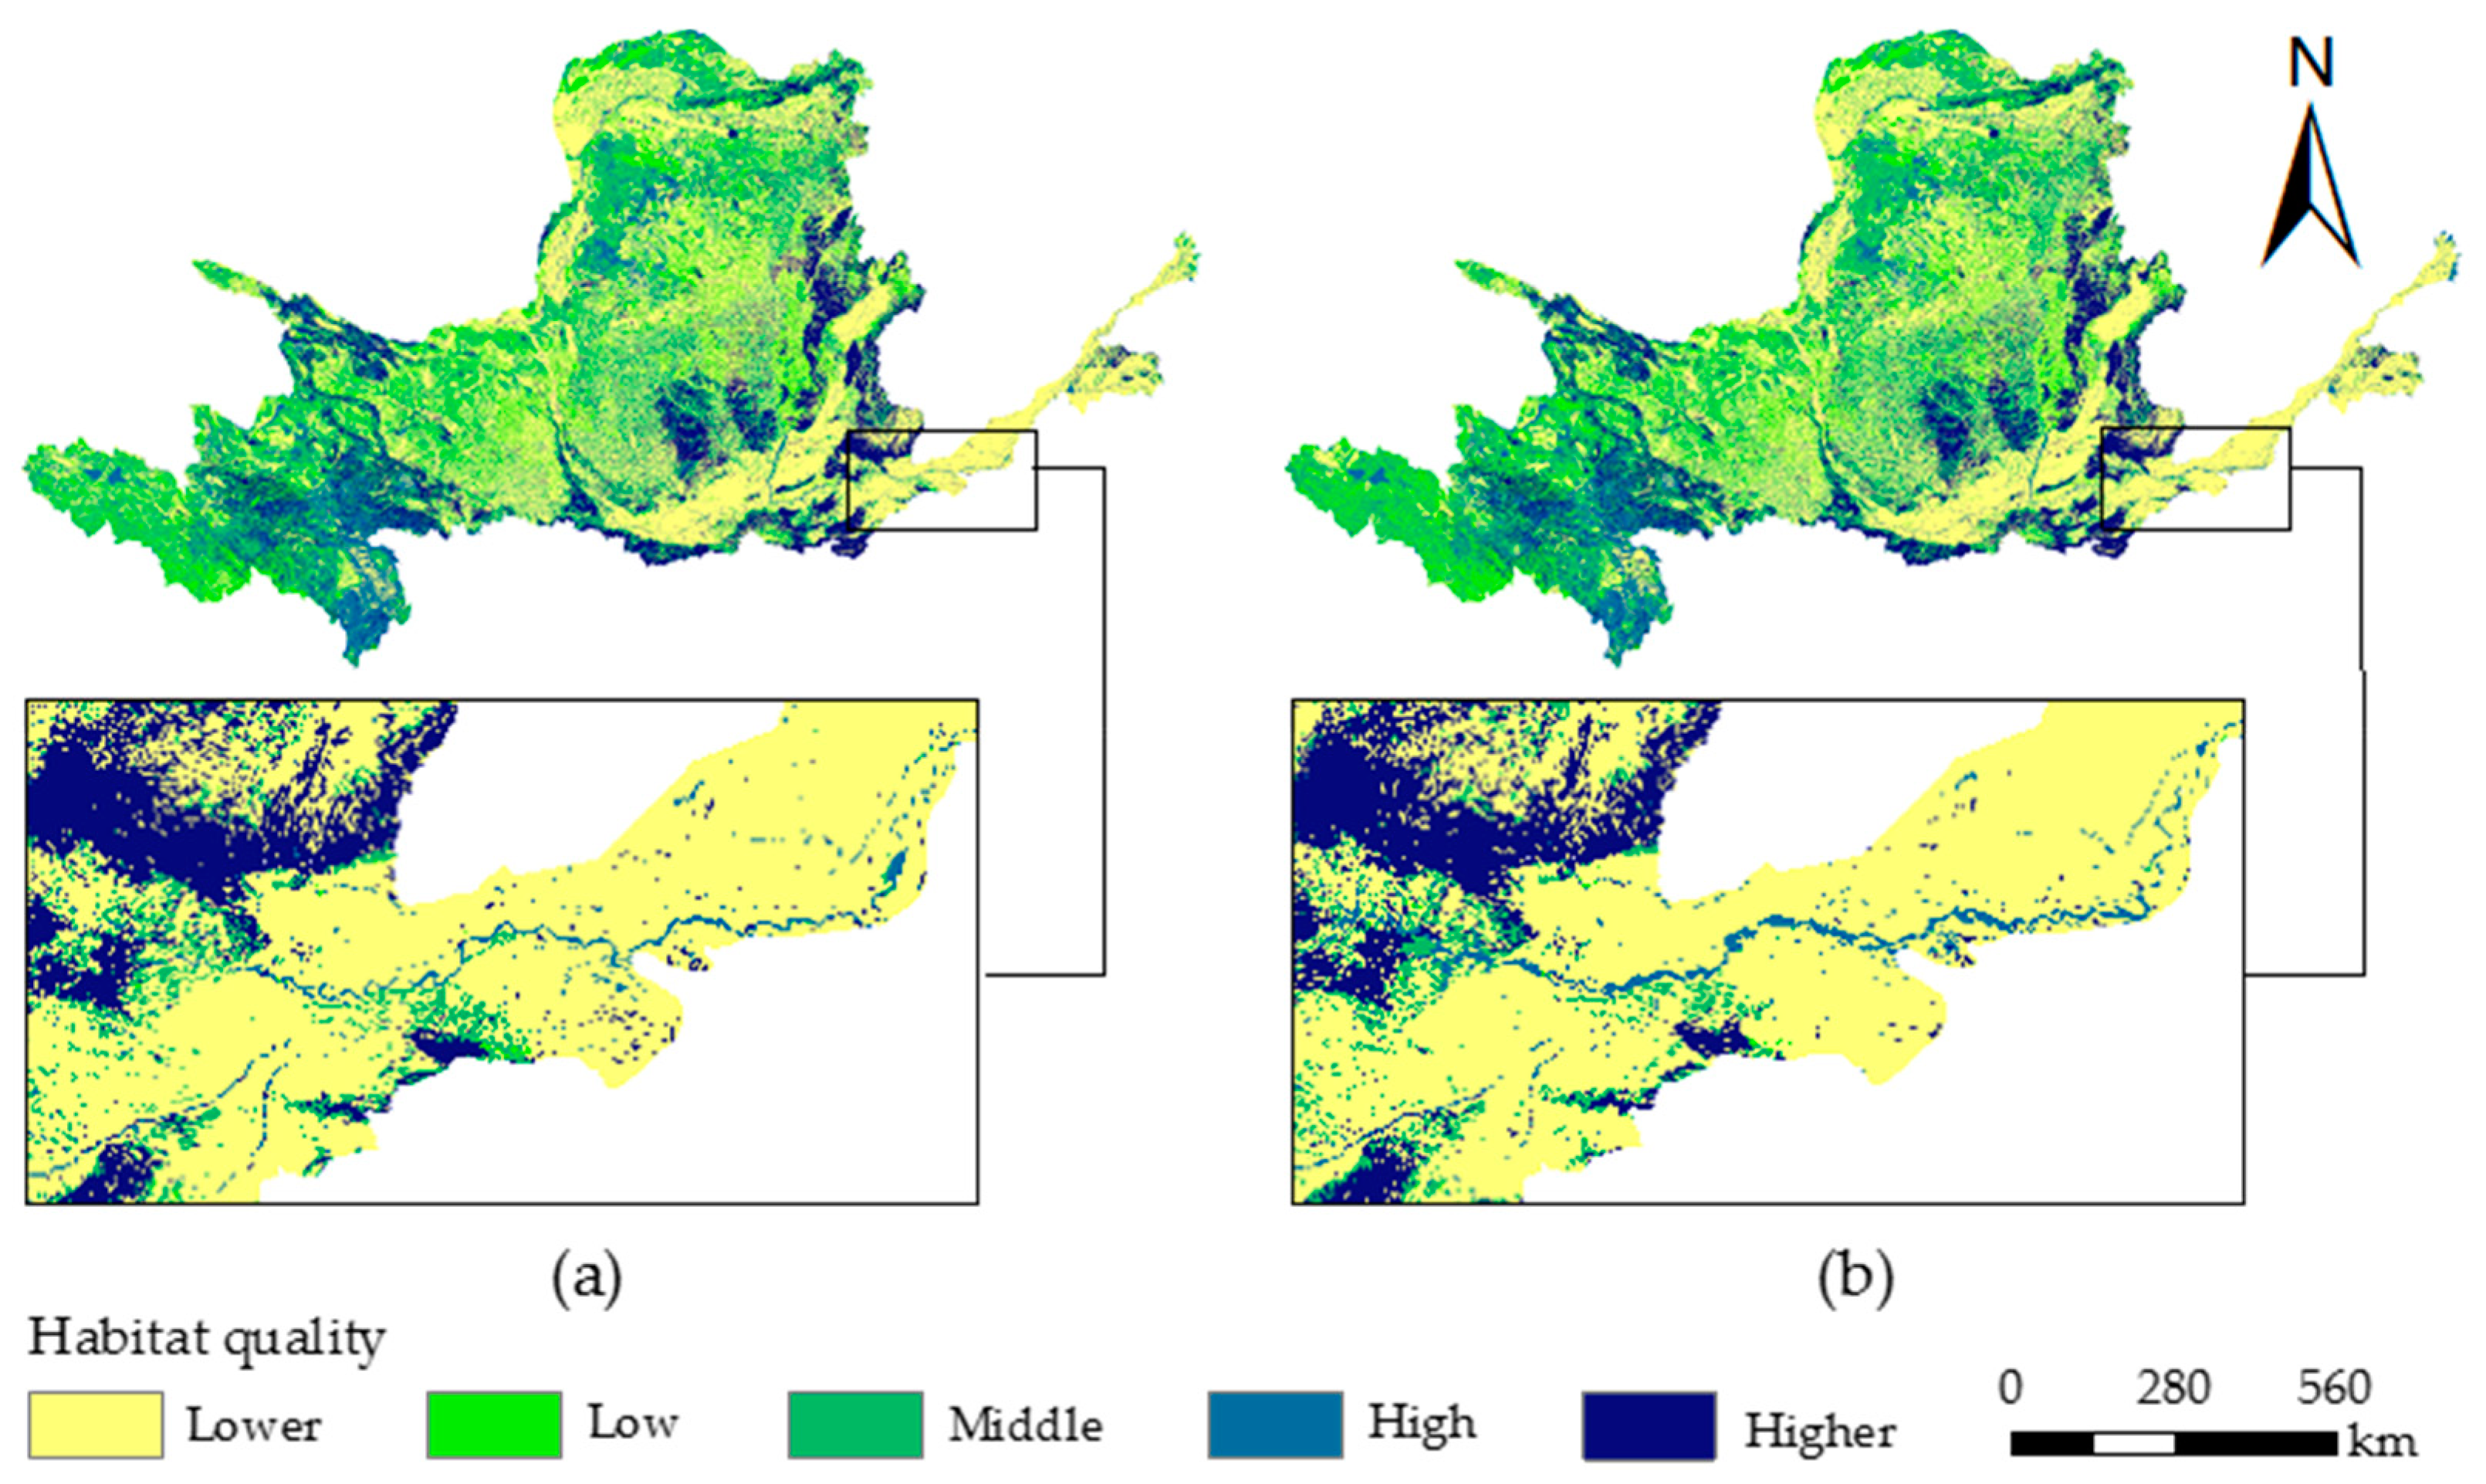
From 2000 to 2020, the overall habitat quality in the study area showed a fluctuating trend of rising first, then falling, and then rising again; spatially, it showed the distribution characteristics of “high in the west and low in the east”, which is consistent with Yang [
69], Song [
70], and Liu et al. [
71]’s research results. Local land use change mainly depends on implementing environmental protection policies and town expansion. Frequent human activities can change the regional land use pattern and thus affect the regional habitat quality. The distribution of habitat quality in the study area showed strong topographic distribution characteristics, and areas with better habitat quality were mainly concentrated in mountainous woodlands. The areas with average habitat quality were mainly concentrated in the highland grassland areas, which were more restricted for socio-economic development and had lower intensity of human activities, making their habitat quality more stable. The areas with low and lower habitat quality were mainly concentrated around the plains and waters with an excellent topographic environment because the natural conditions in the area were suitable for growing food crops and human life. This made a large amount of arable land, and construction land expansion led to a generally low level of habitat quality in the region and frequent transitions in habitat quality classes.
According to the predictions of the three future scenarios, it was found that under the ecological conservation scenario, the increase in the area of grassland and woodland and decrease in the growth rate of urban construction land would lead to an increase in the regional habitat quality. In contrast, under S3, the growth rate of grassland and woodland decreases, and construction land area expands rapidly, leading to a decrease in the overall growth rate of habitat quality and even a decrease in habitat quality. These results are consistent with the findings of Ding et al. [
8].
The study found that most of the decline in biodiversity and habitat quality was associated with urban expansion [
8]. In contrast, most local increases in habitat quality depended on implementing environmental protection policies. During 2000–2020, habitat quality continued to improve in the western and northern regions of the basin, whereas the southeastern region showed a deterioration. This was mainly due to the establishment of the Sanjiangyuan Nature Reserve at the source of the Yellow River and the implementation of the “grazing and grass restoration project”, which has significantly increased the growth rate and area of vegetation in the region [
72,
73]. This has improved the regional habitat quality, and is consistent with the results of Yang [
74]. Similarly, in the Maowusu sandy area in the north-central part of the Basin, implementing environmental protection policies, such as afforestation, has led to a yearly increase in greenery and improvements in habitat quality in the region. However, in the southeastern plain area, from 2000 to 2020, with the socioeconomic development, the study area had experienced an accelerated urbanization rate. Urban land has expanded by 137.0%, and construction land has expanded by 454.2% in 20 years, and the construction of various transportation facilities has continuously eroded the ecological environment, making the habitat in the area fragmented. There has been more degradation of the habitat around the city. The area of low-grade habitat quality in urban built-up areas is expanding. This increase in areas of urban land and rural settlements remains the main reason for the deterioration of local habitat quality.
4.3. The Merits and Limitations of This Study
In this study, the adaptation factors selected using the Logistic regression analysis model improved the objectivity of land use prediction. The improvement in the CA-Markov model makes it easier to set future scenarios, and the simulated land use was tested for accuracy with a kappa coefficient of 0.8336, which indicated high accuracy, suggesting that this model has strong applicability in the Yellow River Basin. The improved Logistic-CA-Markov and InVEST models were integrated to analyze the Yellow River Basin’s land use pattern and habitat quality for a long time series from 2000 to 2020. The study showed the importance of ecological conservation. The spatial and temporal changes in land use and habitat quality under the three scenarios of natural development, ecological conservation, and urban expansion from 2025 to 2040 were also simulated, which is essential for ecological conservation policies and urban planning studies in the study area. However, for future scenario setting, better policy quantification is needed as it can make the scenario matrix setting less objective; improving this process will lead to a more objective scenario weight matrix and improve the simulation effect. In addition, although our research results have specific reference value, the habitat quality in the study area was influenced by human and natural factors. The InVEST model has certain limitations, as it only considers the influence of nature and lacks consideration of human factors. Finally, in this study, the grid used was 1 × 1 km. Considering the availability of data and the large size of the study area, the choice of scale could be explored in more depth.
4.4. Policy Recommendations
The Yellow River Basin is not only an important ecological barrier in the north of China, but also a traditional agricultural area in China, with a massive plantation and agricultural livestock industry at this stage, and the scale of commercial agricultural production is daily expanding [
75]. The Yellow River Basin has effectively managed desert and sand in recent years, but the arable land area has significantly declined. In the future, it will be necessary to continuously optimize agricultural production methods and improve agricultural production efficiency based on maintaining the red line of arable land. For urban areas in the watershed, caution should be taken against unreasonable urban sprawl and prevent the destruction of the environment in exchange for the economy, leading to continued deterioration in habitat quality. At the same time, urban planning and transportation planning in the eastern part of the study area should be developed in conjunction with ecological protection to reduce the risk of regional habitat fragmentation due to the emergence of urban agglomerations.
5. Conclusions
Based on the land use data from 2000 to 2020, this study analyzed the Yellow River Basin’s land use and habitat quality using the improved Logistics-CA-Markov and InVEST models and predicted the Basin’s land use and habitat quality from 2025 to 2040 under multiple scenarios. The conclusions are as follows:
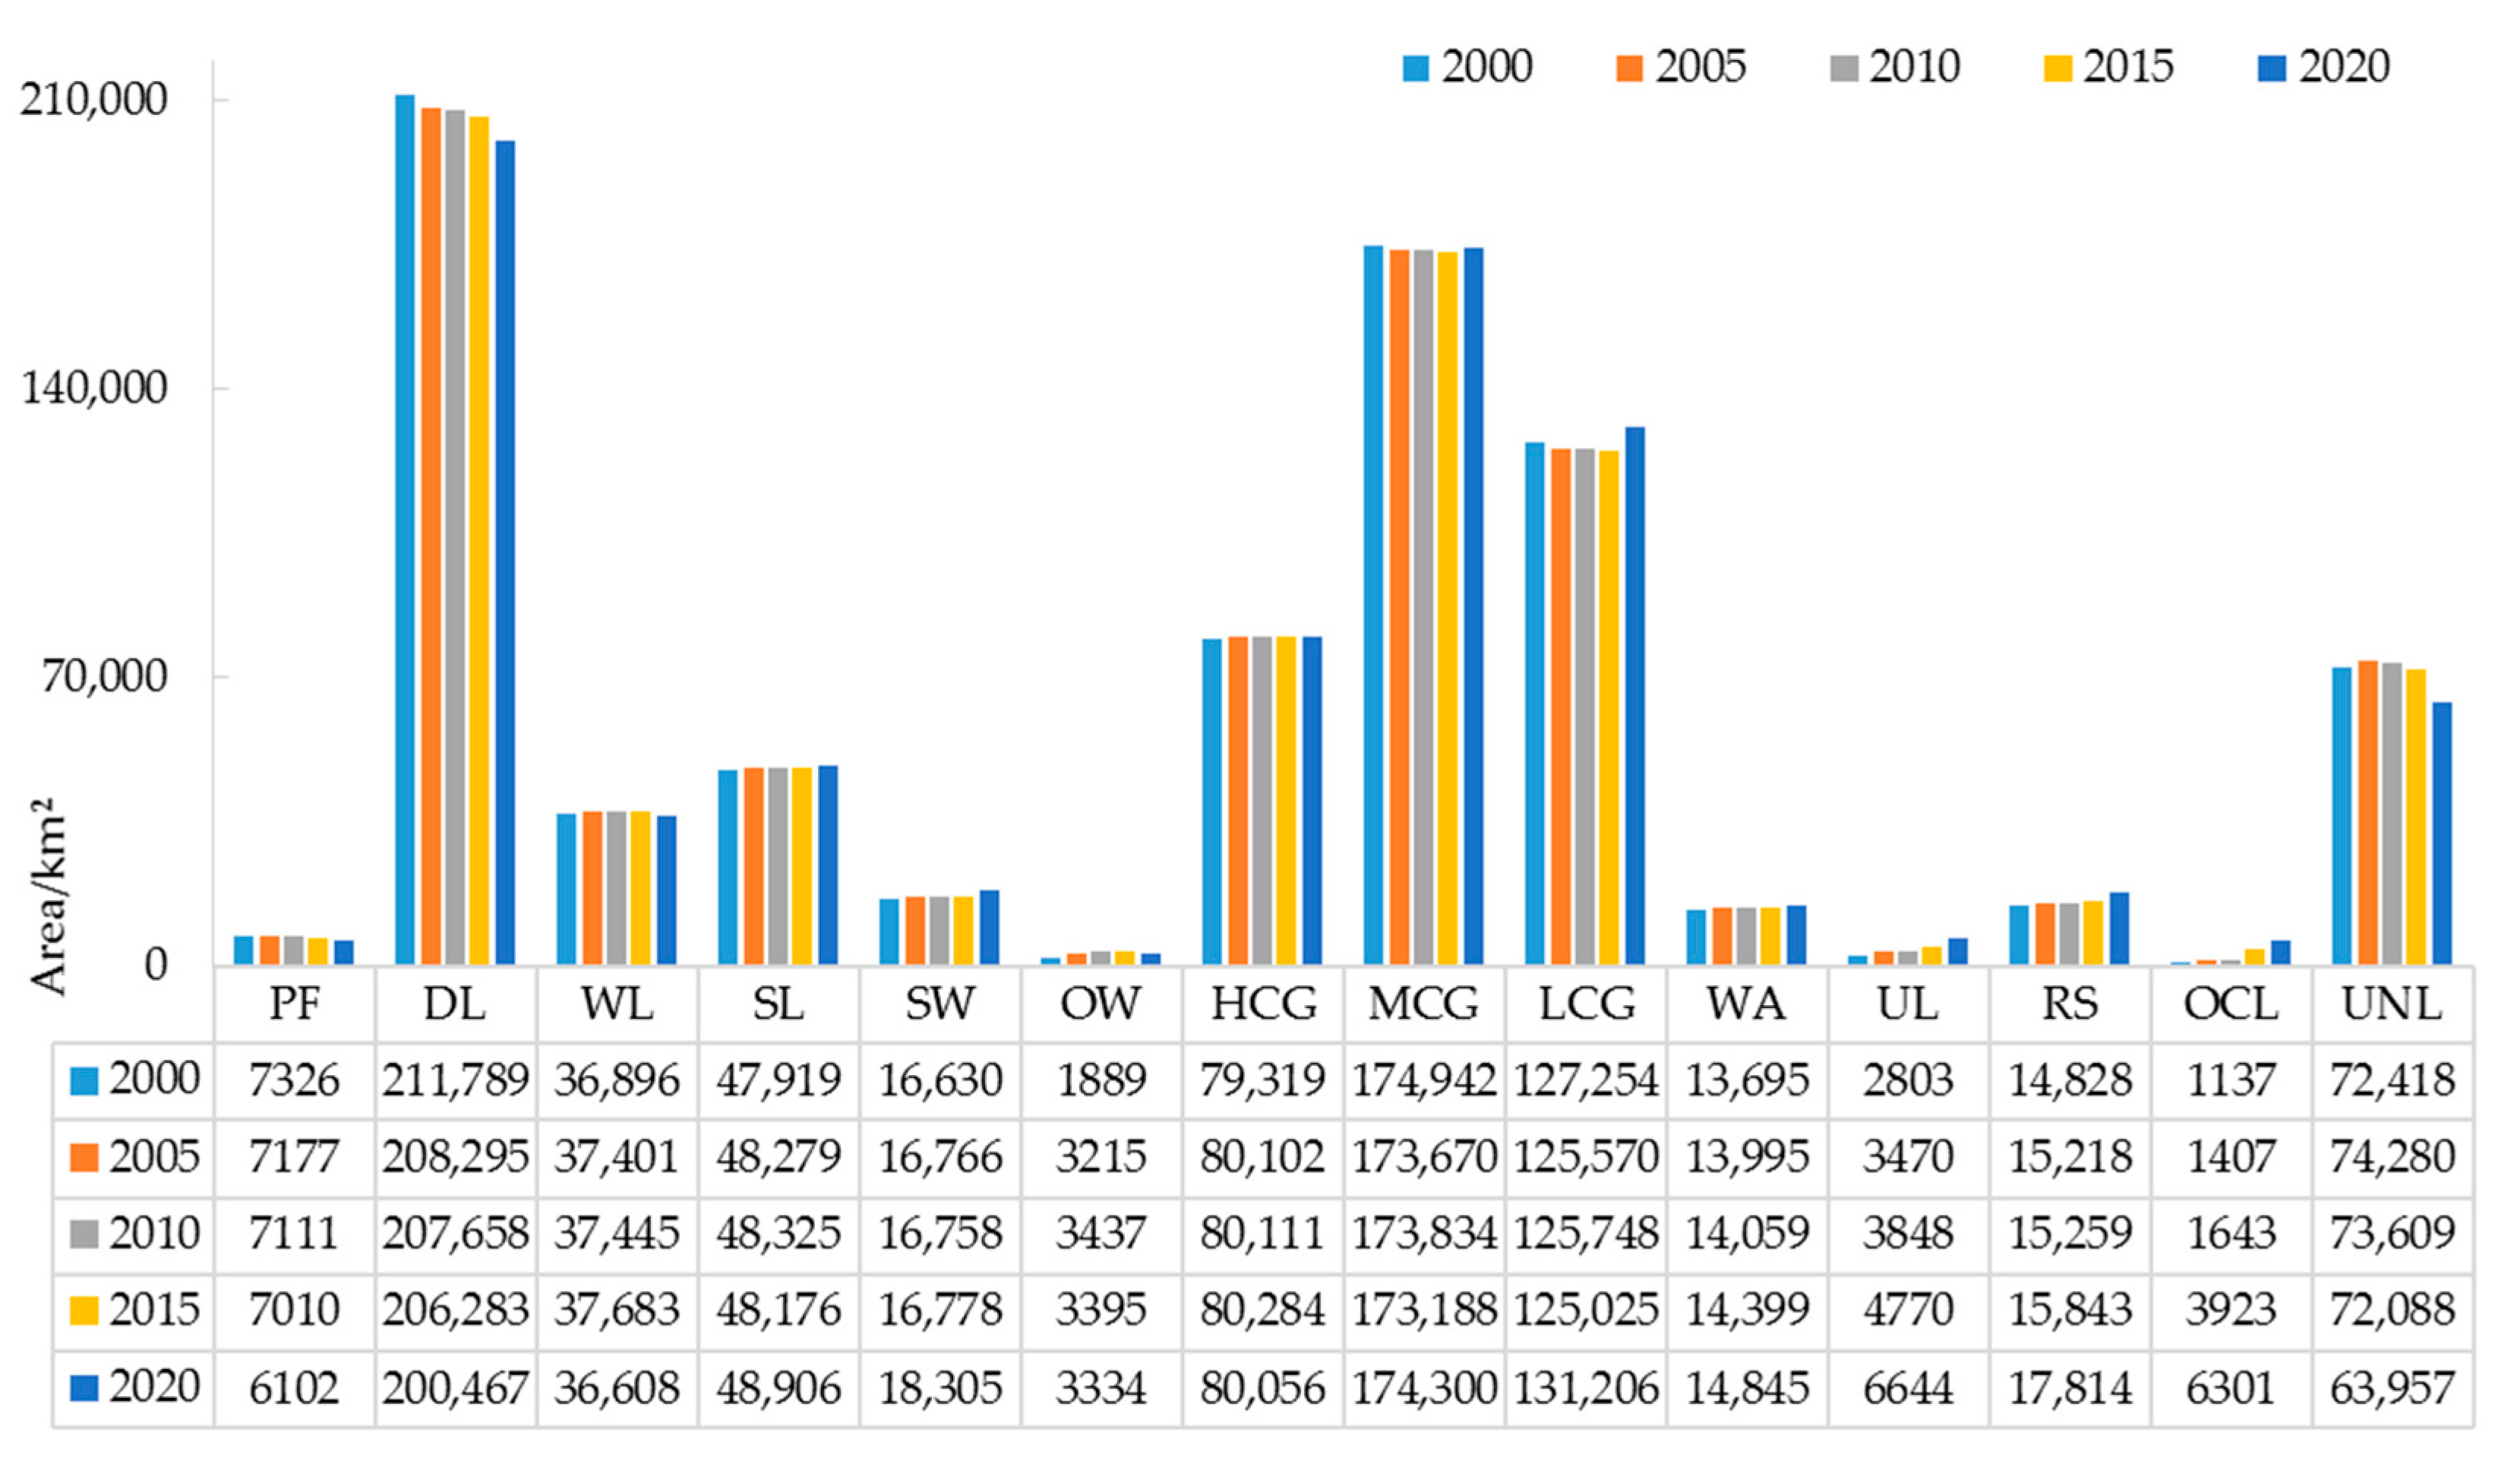
(1) From 2000 to 2020, dryland and grassland were the primary land use types in the study area, accounting for more than 72%. Paddy land, dryland, forested land, middle-coverage grassland, and unused land all showed decreasing trends, whereas the other land categories show increasing trends. The overall pattern of land-use projections under the different scenarios was relatively consistent, but local differences were more pronounced. The ecological protection scenario substantially inhibited the expansion of urban land in the south and east of the Basin. In contrast, the urban expansion scenario accelerated land expansion for construction;
(2) From 2000 to 2020, habitat quality in the basin showed an upward trend, but at a low level, with areas with average or below grades making up 80% of the total area. There were differences in the spatial distribution of habitat quality, with the northern and central regions of the Basin showing varying degrees of improvement in habitat quality. In contrast, the southern and western cities of the Basin showed continuous deterioration. With the construction of transport facilities, there was a tendency for urban agglomerations to form in the eastern part of the Basin, which has led to constant fragmentation of the ecological environment between cities and varying degrees of habitat quality, with urban expansion brought about by human activity remaining the biggest factor affecting habitat quality;
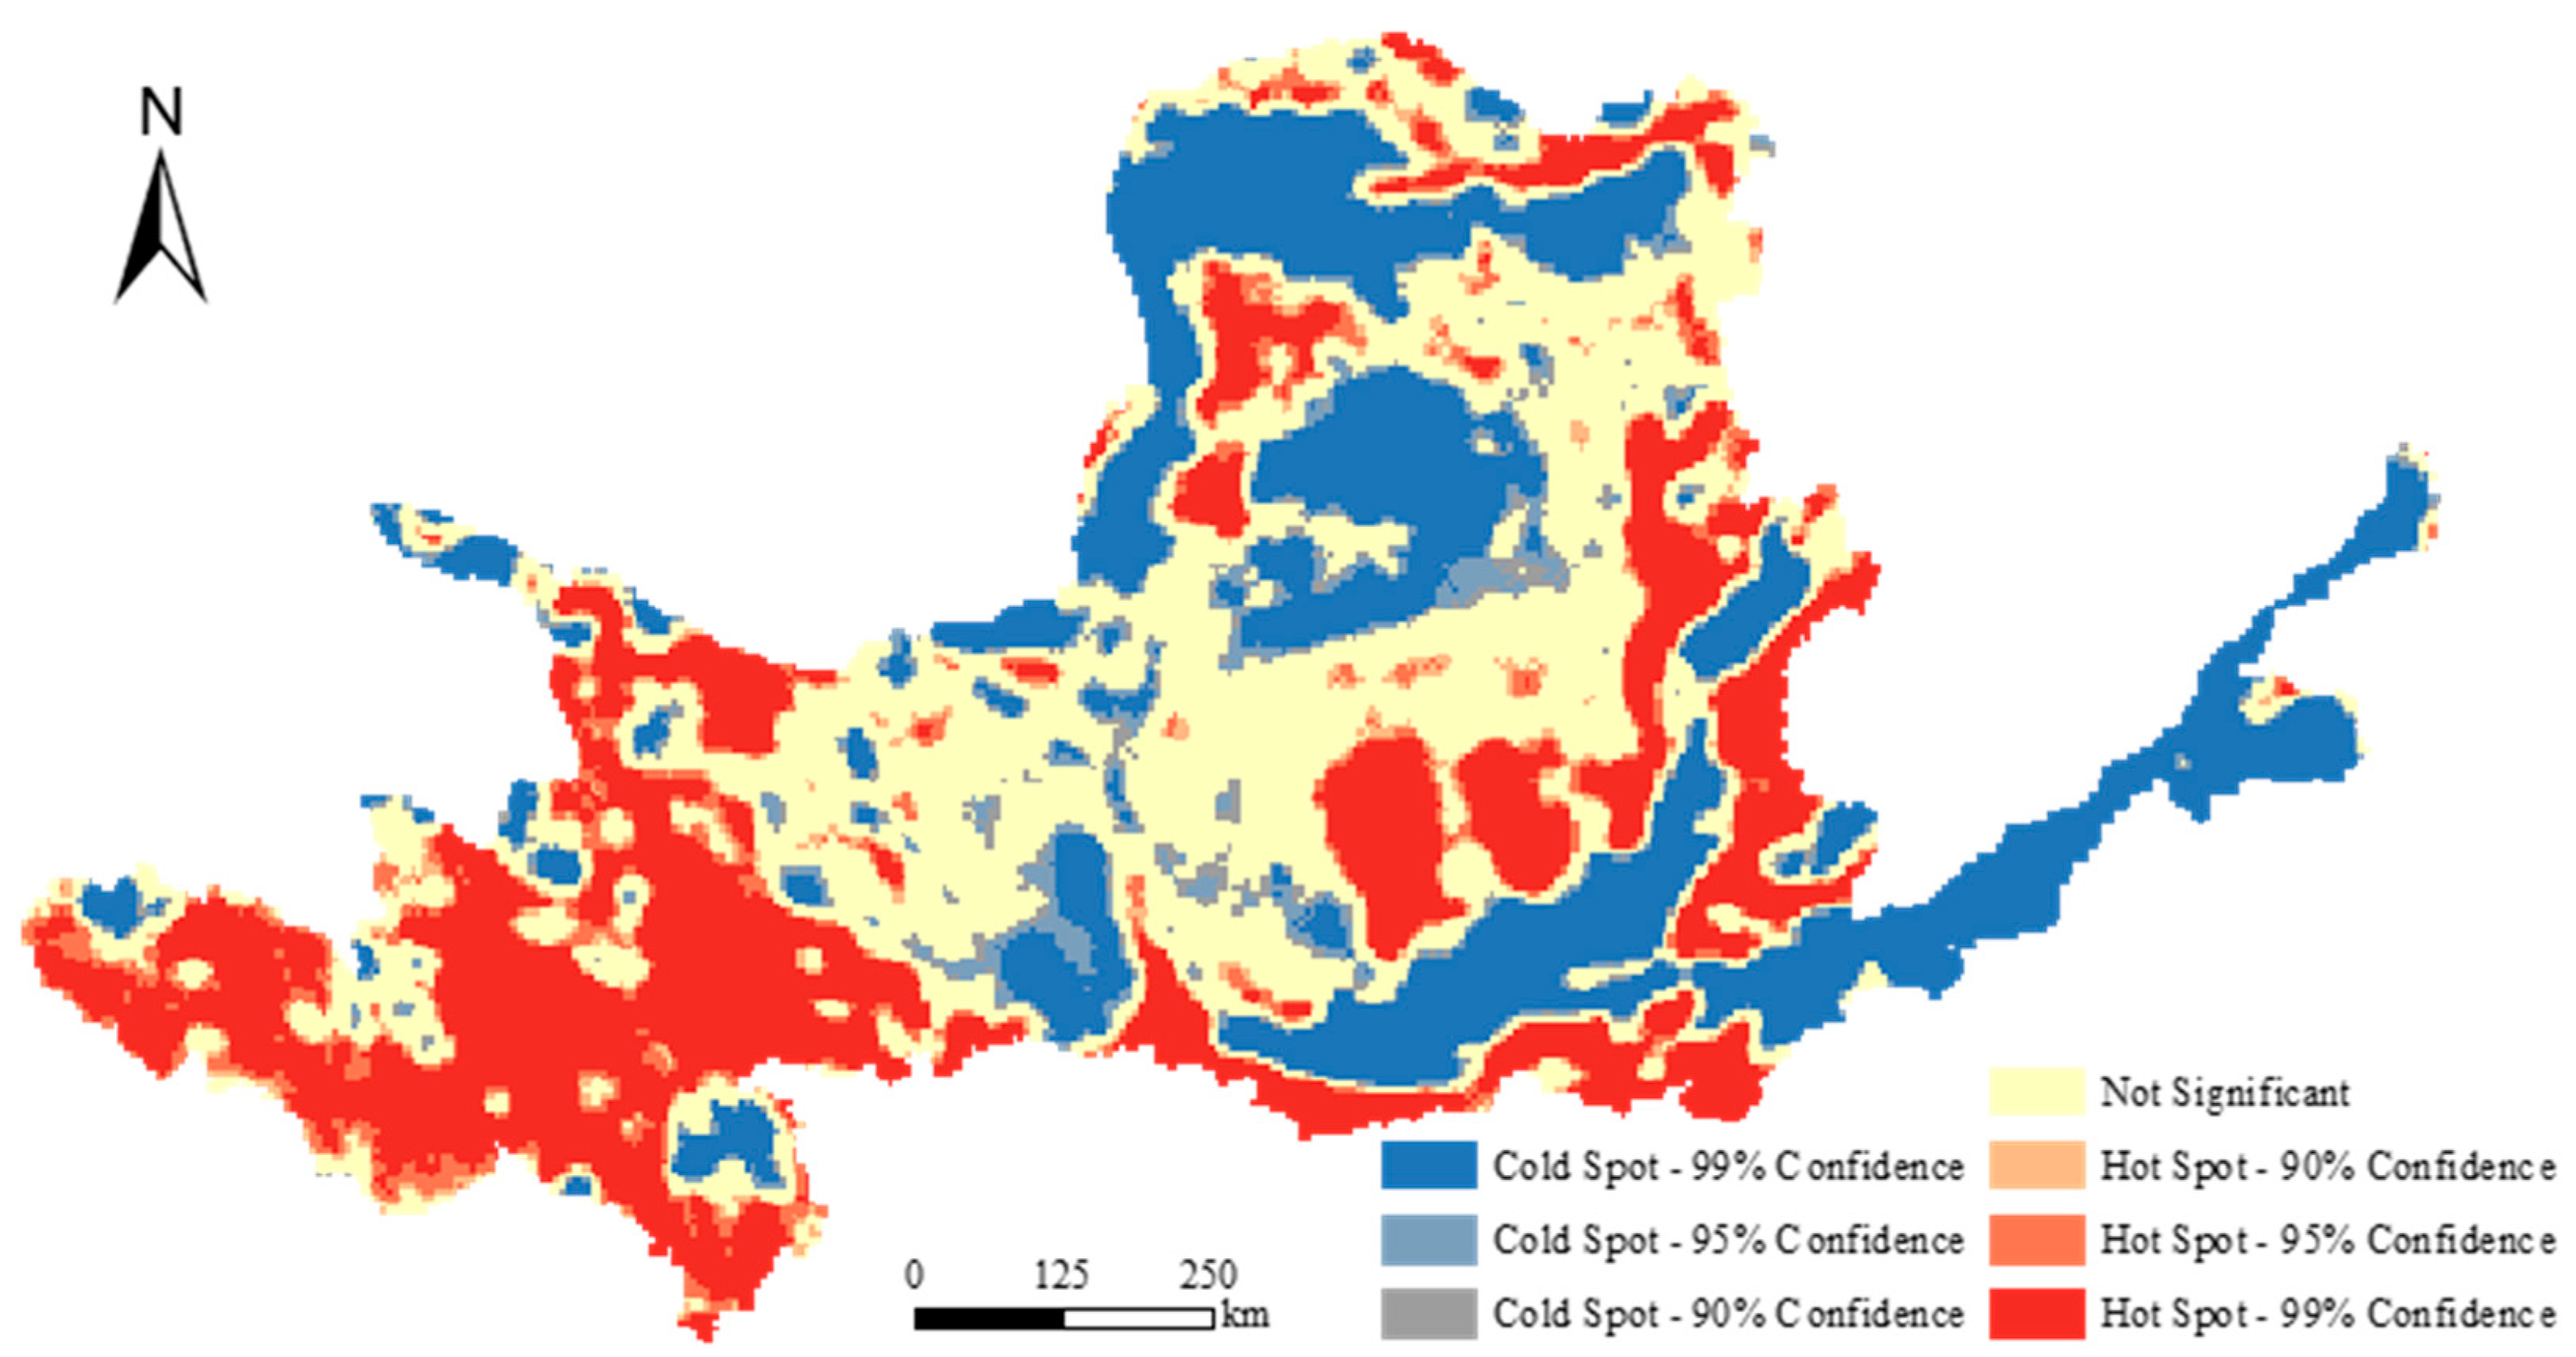
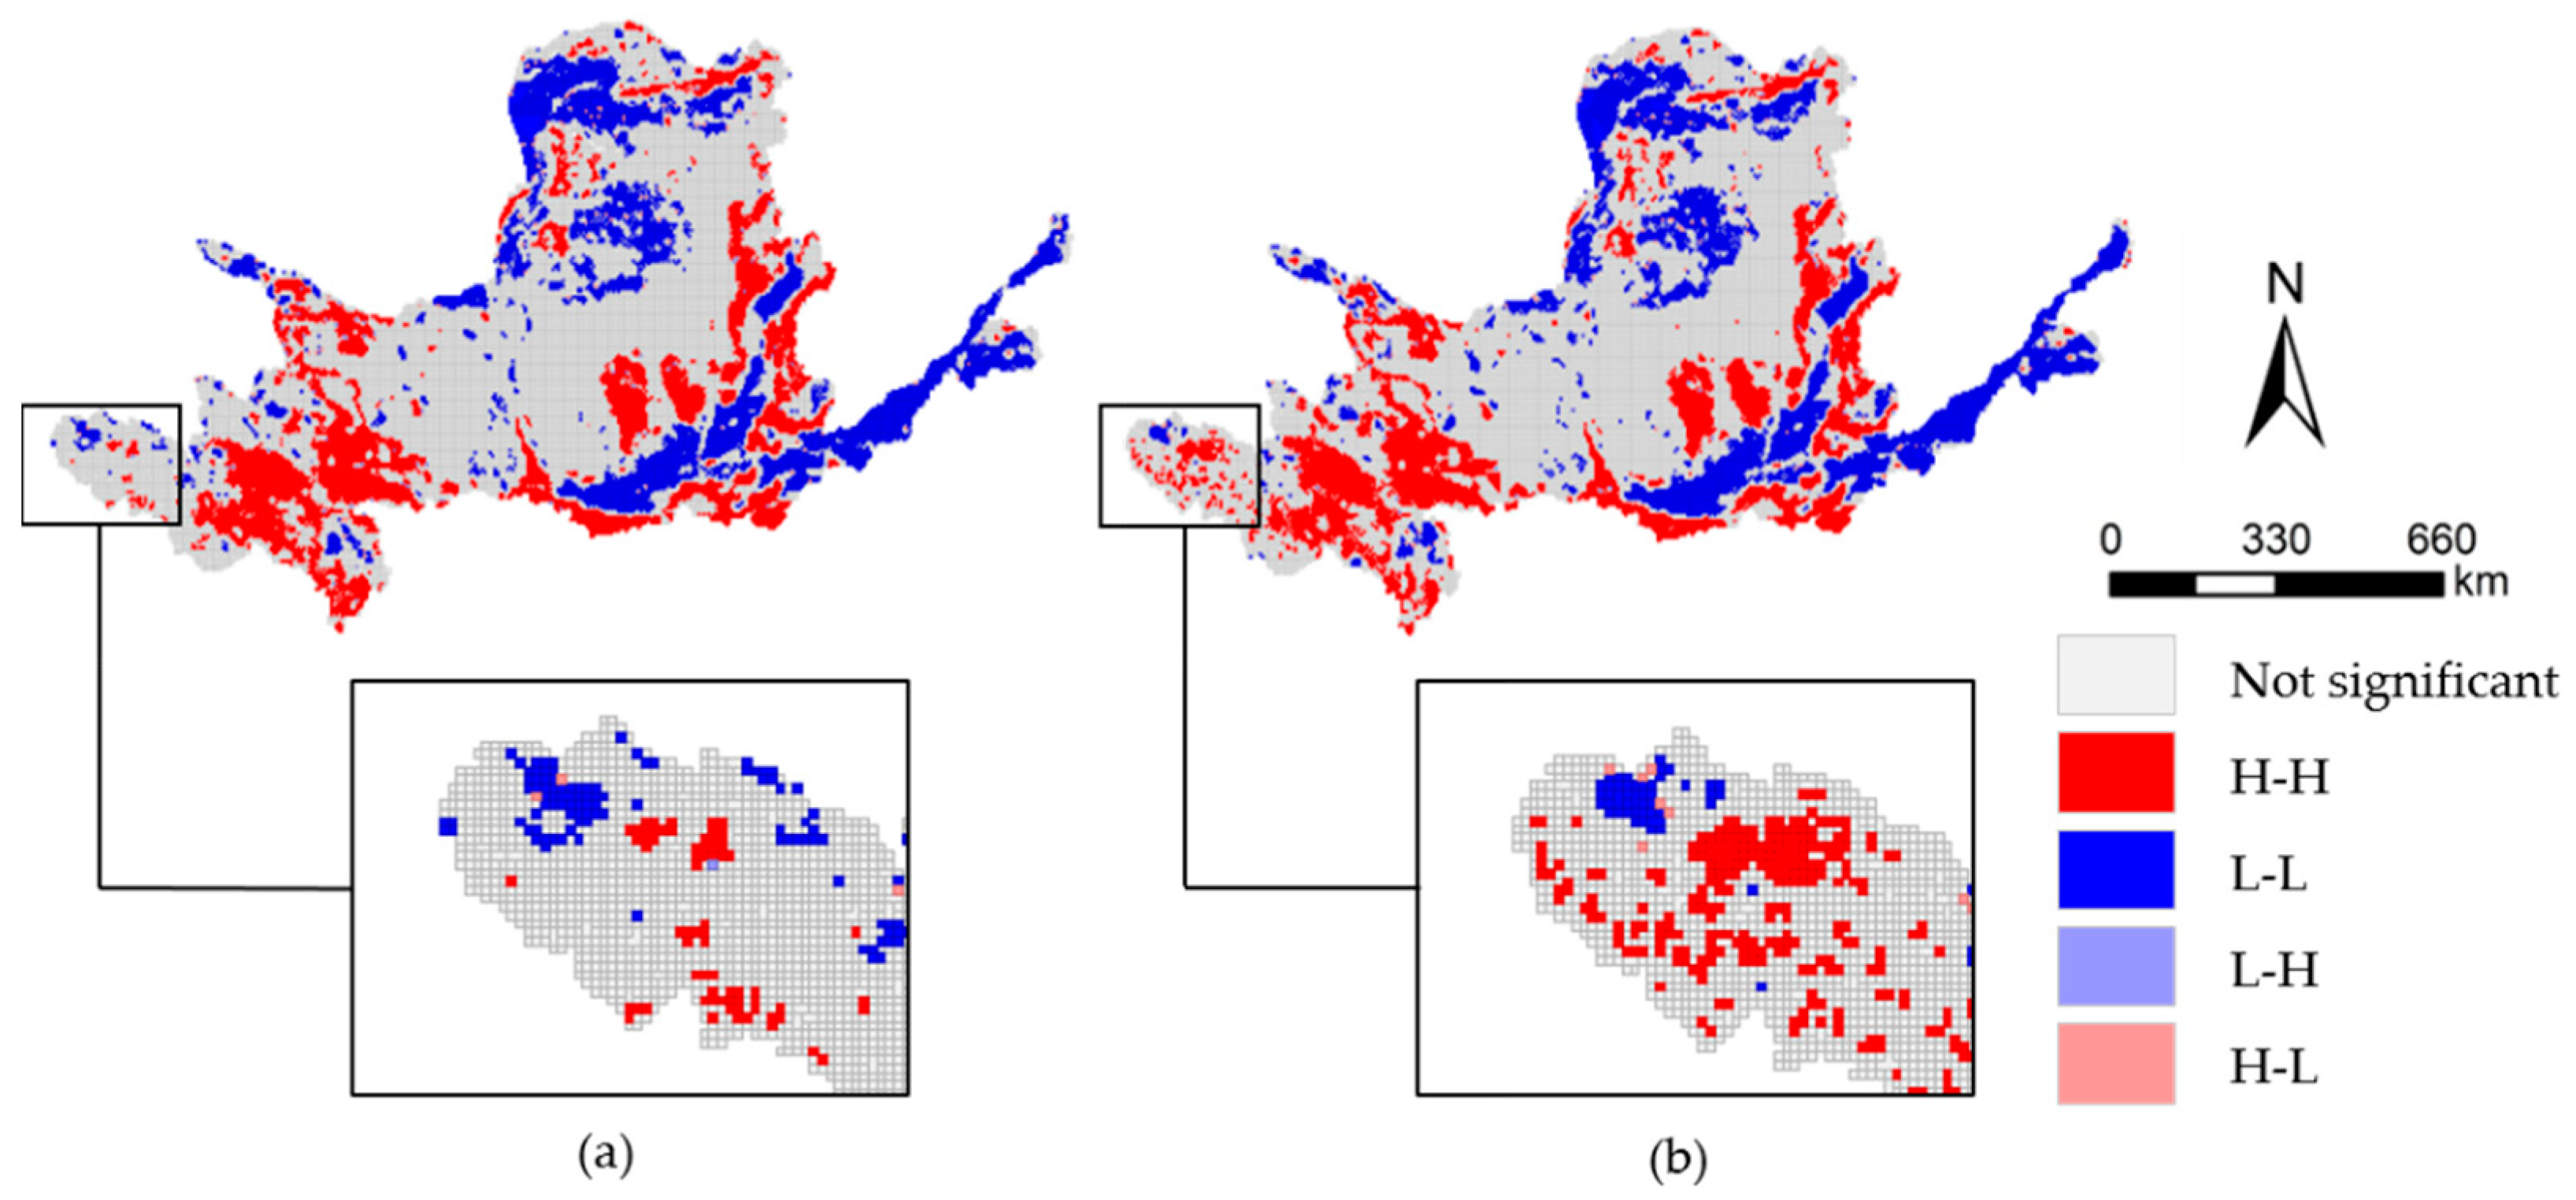
(3) Habitat quality in the study area had strong spatial autocorrelation and aggregation. Cold-spots of habitat quality were mainly in the northern and southern parts of the watershed, concentrated in drylands, unused land, and built-up land; hotspots were mainly in the western plateau and the eastern grassland and woodland areas of the watershed;
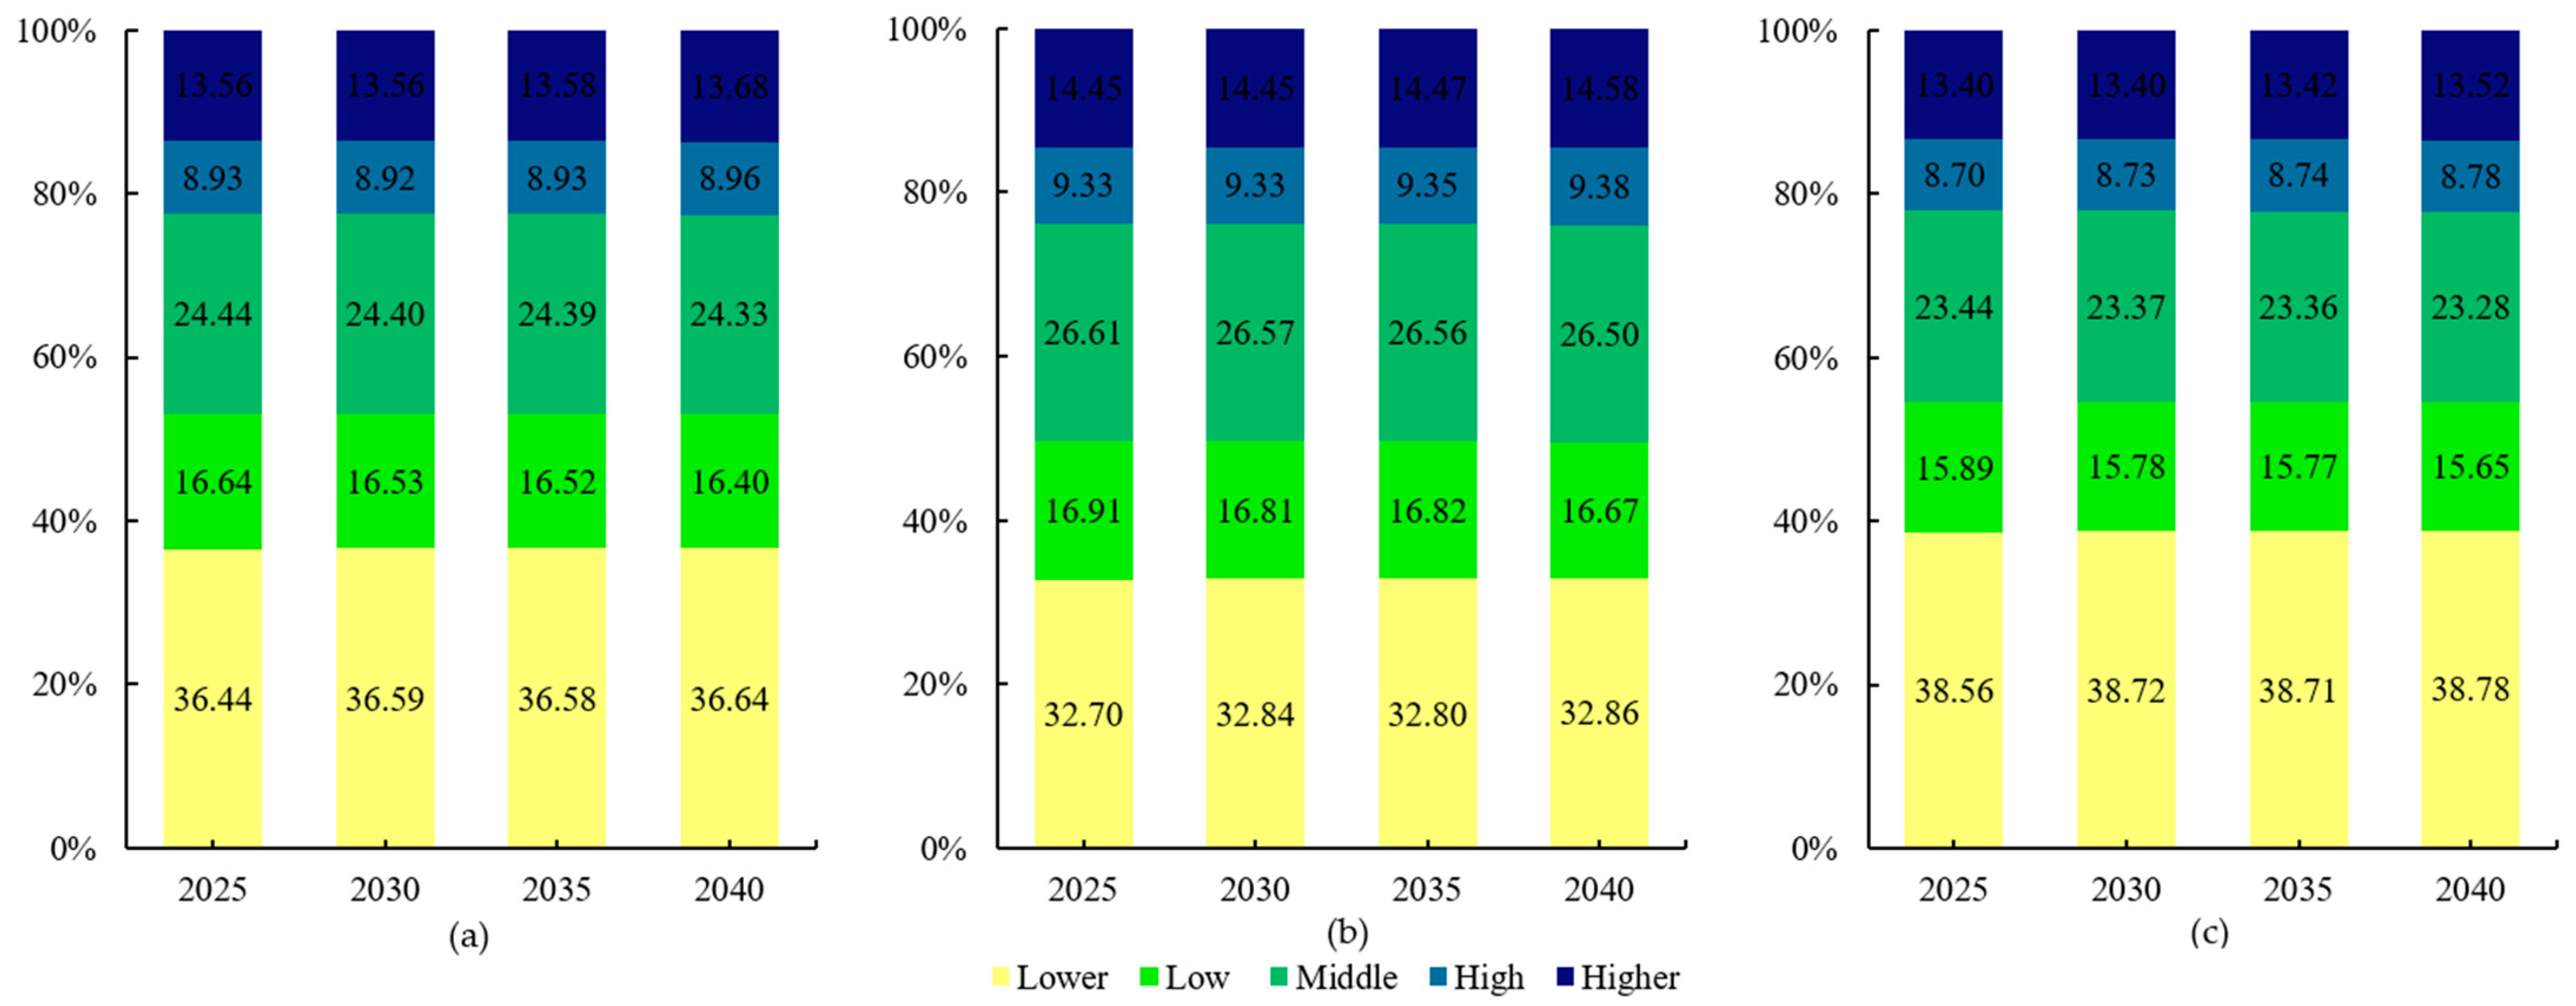
(4) Ecological conservation had a significant positive effect on the habitat quality of the watershed, whereas urban expansion reduced the habitat quality of the watershed. According to our prediction, in 2040, S2 would reduce the area of poor and poor habitat quality by 3.78% compared with S1. Under S2, the area of lower habitat quality was 2.14% more than in S1, and the high and higher-grade area was 0.34% less.


