Article

Kinetic, Thermodynamic and Adsorption Isotherm Studies of Detoxification of Eriochrome Black T Dye from Wastewater by Native and Washed Garlic Peel

1
Department of Chemistry, University of Kotli, Kotli 11100, Azad Jammu & Kashmir, Pakistan
2
Institute of Chemical Sciences, University of Swat, Swat 19201, Khyber Pakhtunkhwa, Pakistan
3
Department of Chemistry, Islamia College University, Peshawar 25000, Khyber Pakhtunkhwa, Pakistan
4
Department of Chemistry, University of Alabama in Huntsville, Huntsville, AL 35899, USA
5
Department of Chemistry, College of Science, King Saud University, P.O. Box 2455, Riyadh 11451, Saudi Arabia
6
School of Chemical Sciences, Universiti Sains Malaysia, Penang 11800, Malaysia
*
Authors to whom correspondence should be addressed.
Water 2022, 14(22), 3713; https://doi.org/10.3390/w14223713
Submission received: 27 October 2022 / Revised: 14 November 2022 / Accepted: 15 November 2022 / Published: 16 November 2022
(This article belongs to the Special Issue Nanomaterials Application in the Treatment of Wastewater)

Abstract

:
Eriochrome Black T (EBT) is mutagenic and carcinogenic, and thus its presence in water may result in severe illnesses. This study was aimed at adsorbing EBT from simulated water samples by using a batch adsorption process, onto native (GP) and washed garlic peel (WGP). Surface and structural characterization of native and washed GP was performed using FTIR, SEM, BET, and BJH analysis. The effects of several parameters, affecting the process of adsorption, like pH, temperature, contact time, adsorbent dose, and initial dye concentration, were also examined. Freundlich and Langmuir isotherms were applied to the equilibrium data. Pseudo-first and pseudo-second order models were used to study the adsorption kinetics. The Langmuir isotherm and pseudo-second order model perfectly explained the equilibrium data. ΔG°, ΔH°, ΔS° studies indicated that adsorption of EBT onto GP and WGP was a favorable, spontaneous, and physical process. Maximum dye removal by GP (96%) and WGP (82%) was observed at pH 2. Similarly Maximum adsorption capacities were found to be 99.5 mg/g and 89.4 mg/g for GP and WGP, respectively. It is concluded from these results that garlic peel can be used as a cheaper and more efficient material for the adsorptive removal of EBT from contaminated water samples.

1. Introduction

Dyes are usually synthetically colored substances. They are usually resistant to biodegradation due to their synthetic and complex aromatic structures. [1]. Each year, around 7 × 10⁵ tons of about ten thousand different types of commercial dyes are produced around the world [2]. Approximately 15% of each dye is typically lost as effluent during the dyeing process [3]. These colored dyes harm aquatic systems by coloring the water, blocking sunlight, slowing photosynthesis, increasing toxicity and chemical oxygen demand (COD), and limiting the growth of aquatic plants [4,5]. The production of a number of synthetic dyes is one of the key contributors to the high effluent pollution that is a byproduct of industrial pollution. Industrial effluents are regarded as one of the most damaging pollutants to the environment because of their large discharge volume and variety in composition [6]. In addition, the process of dyeing textiles results in the loss of a significant amount of toxic dye in high quantities. Over 8000 dyes, both soluble and insoluble, have been manufactured by a variety of sectors, including paper, dyeing, pulp, textiles, and paint production, as well as industrial effluent [7]. In addition, the contamination will make the groundwater and surface water unsafe for use and may also cause mutagenic and carcinogenic effects [3]. The majority of the synthetic dyes, used in the dyeing industries worldwide, are azo dyes [8]. Azo dyes possess one or more –N=N– (azo groups) in their molecular structure [8]. Azo dyes are strongly resistant to heat, chemicals, microbial attack, and light, and which is why azo dyes are very difficult to degrade even in very dilute concentrations [9].
Hence, azo dyes need to be removed from industrial effluents. Techniques and methods like solvent extraction [10], biodegradation [11], coagulation, photocatalytic degradation [12], precipitation, the photo-Fenton reaction [13], advanced oxidation processes [14] and membrane filtrations have already been used to remove azo dyes from wastewater. Although some good results were obtained with some of these techniques and methods, they were not free from certain shortcomings. On the other hand, adsorptive techniques are easy to handle and are applicable on a large scale [14]. Recently, low cost agricultural or natural wastes like shale oil ash [10], palm ash oil, chitosan [8], bottom ash [12], pomelo peel [11], guava leaf powder [15], wheat husk [14], sunflower seed shells [13], and multiwalled carbon nanotubes [14] have been used as adsorbents for toxic dyes from polluted water.
During complexometric titrations, Eriochrome Black T (EBT) is used as an indicator. EBT is used for the dyeing of wool, nylon, and silk. Long term contact with EBT causes irritation of the skin, eye, mucosal tissues, and respiratory organs [15]. It has been estimated that almost 50% of the dyes manufactured worldwide are of EBT type. The degradation of EBT produces phenolic compounds, which are carcinogenic in nature [16]. Azo dyes EBT have aromatic rings and sulphonate in their structures, making biological treatment of EBT-containing wastewater time-consuming and inconvenient. Even low concentration of EBT remain persistently stable against microbial and chemical degradation [17]. Plants based adsorbents are cheaper and safer to be applied for treating wastewater. Plants and agricultural type adsorbents like eucalyptus bark [3], maize stem tissue [18] and leaves of Scolymus hispanics L. [3] have already been used for the removal of EBT from wastewater.
Garlic peel (GP), an agricultural waste, is produced in large quantities due to high consumption of garlic. According to the available data world garlic cultivation was 1,205,711 hectares of land in the year 2007 The total worldwide production of garlic is about 15.7 million tons. Garlic consumption, around the world, is estimated to be 2.3 pounds per person. More than 3.7 million tons of garlic-based by-products are produced by the garlic processing industries around the world [19]. Garlic peel has fibers that are composed of pectin substances. GP contain different kinds of functionalities, and these functional groups are mainly responsible for purifying the water from pollutants. The functional groups present in GP include amino groups, hydroxyl and carboxylic groups [20]. Garlic peel is widely available due to the high demand for garlic. GP has previously been used in batch adsorption processes to decontaminate methylene blue [21] and Pb(II) [20]. Previously, GP with size of 105 µ (ASTM No: 140) have not been used for the adsorption of any azo dye including EBT. Therefore, to utilize the agriculture waste of GP for the purpose detoxification, we used native and washed GP for the removal of EBT from simulated wastewater samples.

2. Materials and Methods

2.1. Chemicals

Eriochrome Black T (99.98% Sigma Aldrich, Darmstadt, Germany), sodium hydroxide (99.8%, analytical grade, Merck Germany), de-ionized water and sieve (ASTM No: 140) were purchased from Sigma-Aldrich Germany.

2.2. Equipment and Instruments Used

Digital analytical balance (ATX224R, Shimadzu, Kyoto, Japan), pH meter (Dynamica, Mablethorpe, UK), UV/Vis spectrophotometer (Cecil 2021, 2000-series, UK), Electric Oven (Memmert UN30, GmbH, Buchenbach, Germany), Fourier transformed infrared (FTIR) (Nicolet-380, Thermo Fischer Scientific, Waltham, MA, USA), BJH and BET surface area analyzer (USA), Scanning Electron Microscope (Jeol-JSM-5910, Tokyo, Japan), X-ray diffractometer (Jeol JDX-3532, Tokyo, Japan).

2.3. Preparation of Native and Washed Garlic Peel (Adsorbents)

Fresh garlic (5 kg) was purchased from the local market in Kotli, Azad Jammu & Kashmir. Garlic was first thoroughly washed to remove any dust and dirt, followed by washing with de-ionized water. Garlic was dried at room temperature. After this, the peel was removed from the garlic. The peel was then boiled in de-ionized water for 1 h. The dried peel was then ground to powder. The powdered peel was then sieved with mesh (ASTM No: 140) to get uniform particles of 105 µ. The sieved garlic powder was stored in air tight plastic containers for use in experimental work. After EBT adsorption on native GP, the peel was recovered and washed thoroughly with warm distilled water till the water coming out of the washed GP was almost colorless. After washing, the GP was placed in an oven at 110 °C for 3 h to make it completely dry. This GP sample was termed as “washed GP”.

2.4. Dye Stock Solution and Working Solutions

De-ionized water was used to prepare a stock solution (1000 ppm) of EBT (C20H12N3NaO7S, FW: 461.38) The maximum wavelength (λmax) of the dye solution was found to be 530 nm. All the adsorption studies were carried out by using this value (λmax = 530 nm). The working solutions of 25, 50, 75, 100, 125, 150, 175 and 200 ppm were prepared using the dilution formula shown below.
Dilution Formula:   C1V1 = C2V2

2.5. Characterization of Garlic Peel

The surface morphology of GP and WGP was investigated using SEM. XRD and FTIR studies were used to know about the crystalline or non-crystalline nature and different functional groups present in the adsorbents, respectively. BET and BJH studies were used to find out about the surface area, pore volume, and pore size of the adsorbents.

2.6. Adsorption Studies

The adsorption of EBT on GP and WGP was carried out in batch mode operation. The effects of experimental parameters such as contact time, adsorbent dose, pH, temperature, and dye concentration were investigated one at a time. The details for the experimental parameters were: pH 2–12, temperature 20 °C to 50 °C, contact time of 0–150 min, adsorbent dose of 0.25–2.0 g/L, and dye concentration of 50–200 mg/L. GP and WGP were added to EBT solutions (V = 100 mL) in Erlenmeyer flasks (250 mL) at predefined experimental conditions. To achieve equilibrium between EBT and GP suspensions, dye solutions were subjected to isothermal shaking. The stirring speed was kept at 150 rpm for all the experiments. After each experiment, the leftover concentration of EBT was determined at λmax = 530 nm. Sorption efficiency (S%) and adsorption capacity (qe) were calculated following Equations (1) [22] and (2) [22]:
S   ( % ) = C 0 C e C 0 × 100
q e = C 0 C e m × V
where Ce = concentration of dye at equilibrium (mg/L), C0 = initial dye concentration (mg/L), m = mass of adsorbent (in grams) and V = volume of dye solution (in litres). Adsorption kinetics for EBT dye was carried out at these conditions: dye concentration = 50–200 mg/L, adsorbent dose = 0.25–2.0 g/L, contact time = 0–150 min, T = 25–50 °C, agitation speed = 150 rpm, pH = 2–12. The equilibrium studies were carried out by using initial dye concentrations from 50–200 mg/L adsorbed on GP and WGP under the following conditions: T = 35 °C, adsorbent dose = 0.15 g/L, contact time = 150 min, pH = 2.00, agitation speed = 150 rpm.

2.7. Kinetic Modelling

In batch adsorption process, the rate at which equilibrium is achieved, can only be determined from its kinetic study. Kinetic study helps in the interpretation and determination of the rate at which a chemical reaction occurs. In this study pseudo-first-order model and pseudo-second-order model were used to study the adsorption of EBT onto GP. The pseudo-first-order and pseudo-second-order equations are shown in Equations (3) [23] and (4) [23], respectively.
ln q e k 1 t = ln ( q e q t )
t / q t = 1 / ( k 2 ) ( q e ) 2 + t / q e
where q t and q e are the adsorption capacity (mg/g) at time t and equilibrium, respectively k 2 (g/mg min) and k 1 (min−1) pseudo-second order and pseudo-first order rate constants, respectively.

2.8. Adsorption Isotherm Studies

Adsorption isotherms were studied by changing the adsorbent dose from 0.25 to 2.0 g/L while keeping the EBT dye concentration constant at 50 mg/L. Adsorption isotherms were studied after optimizing the operational parameters such as pH, contact time, adsorbent dose, and temperature. Adsorption isotherms are helpful in understanding and explaining the mechanism that an adsorption process follows. Langmuir and Freundlich adsorption isotherms were studied during this experiment. Langmuir adsorption isotherms describe the monolayer adsorption of EBT on GP, while Freundlich isotherms describe the heterogenous adsorption of EBT [24].

2.9. Adsorption and Desorption Studies

To check the re-usability and re-cyclability of the adsorbent, the saturated GP was separated from the EBT solution through filtration and washed thoroughly with distilled water. The washed adsorbent was then placed in an oven at 110 °C for 180 min to dry completely. The dried adsorbent was then reused for further adsorption studies. This recycled adsorbent (GP) was termed as “washed GP”.

3. Results and Discussion

3.1. Structural and Surface Characterization of GP

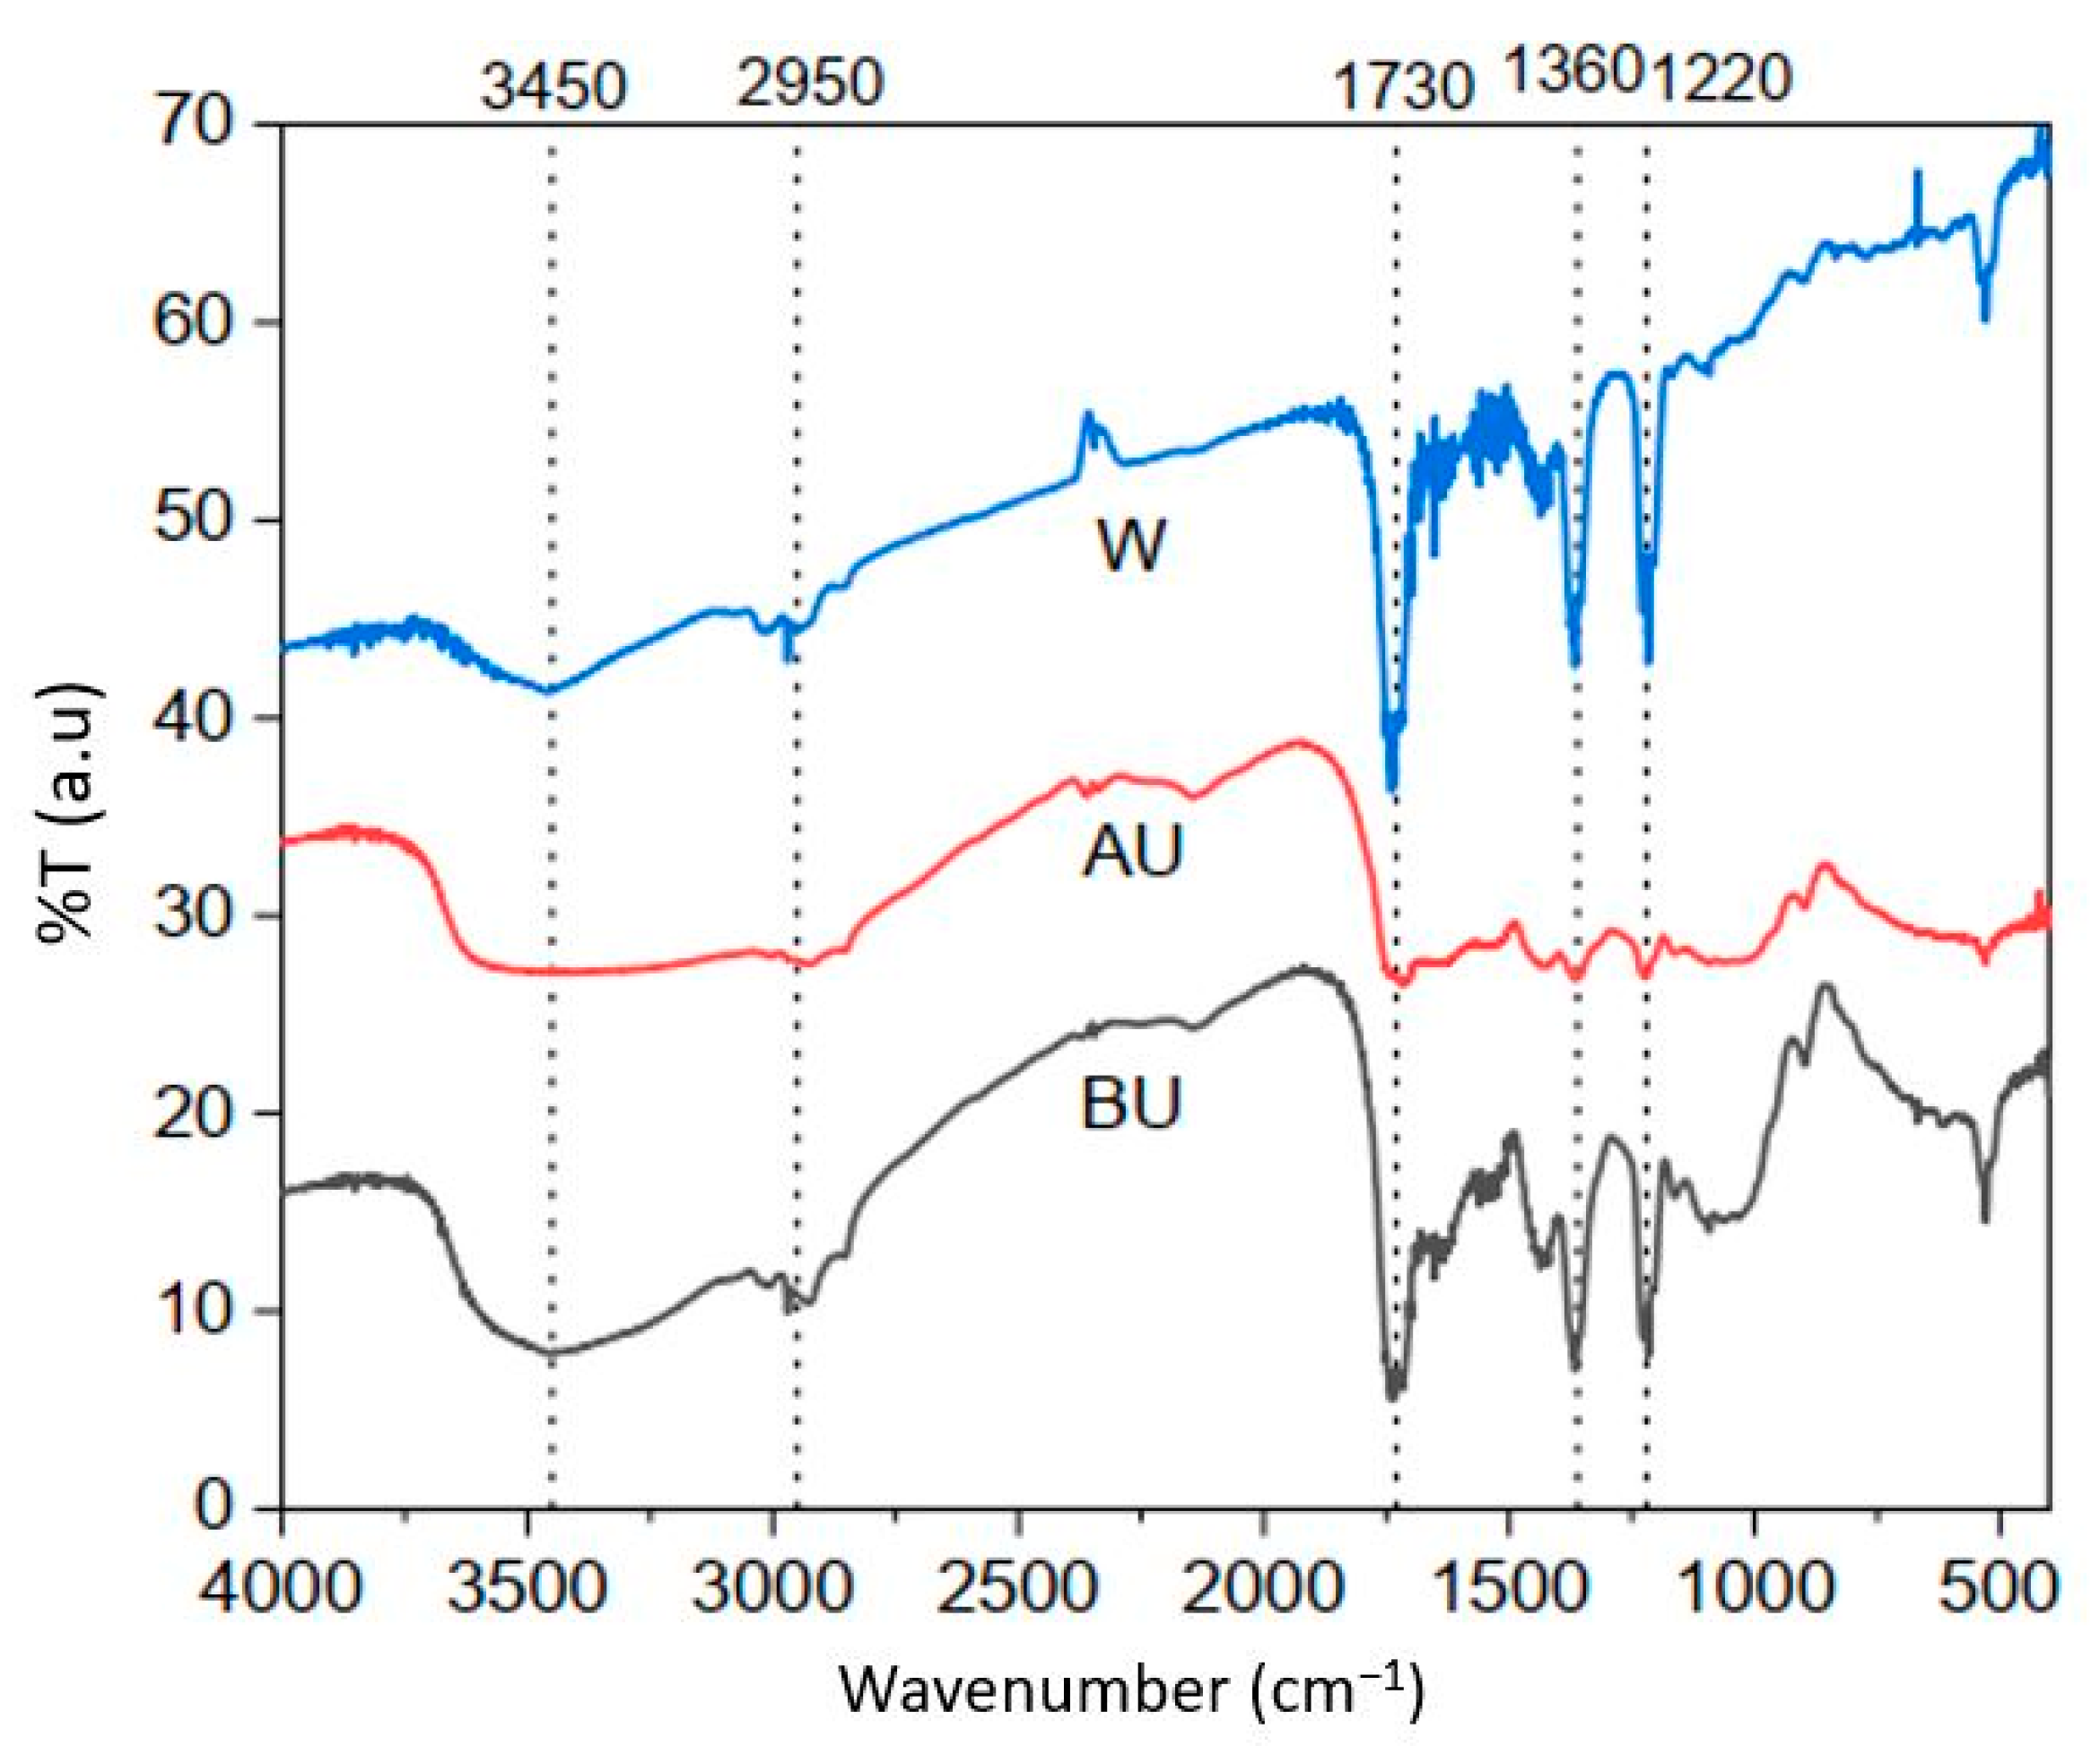
3.1.1. FT-IR Studies

FT-IR studies were performed to know about the functional groups responsible for the adsorption of EBT on GP. The FTIR spectra of pure garlic peel (BU), after use garlic peel (AU), and after washing garlic peel (W) have been shown in Figure 1. The spectra displayed the presence of a strong absorption band at 3450 cm−1 in all three samples. This absorption band indicates the presence of –OH/–NH stretching frequencies. Elemental analysis of pure GP shows that it possesses about 48% oxygen, 4% H and 1% N [20]. So, it can be assumed that the peak at 3450 cm−1 is most probably due to –OH stretching vibrations. Furthermore, it is also evident that this peak is not the same shape and size in all three samples. In case of sample BU, it is a bit shallow and less wide while in case of sample AU it is wider and more flattened and in case of sample W, it is the smallest in terms of depth and width. The distortion of this peak in sample AU indicates that –OH functional groups may be interacting with EBT though intermolecular or intramolecular H-bonding and is thus playing an important role in the removal of EBT from water samples. The band at 2950 cm−1 denoted the presence –C–H stretching vibrations. The shape and texture are almost the same in all three samples which may indicate the lesser role of –C–H vibrations in the removal of EBT. The peak at 1730 cm−1 indicates the stretching vibrations of carbonyl group (–C=O). It can be observed from Figure 1 that this absorption band undergoes a significant decrease in the absorption intensity, as compared to the other two samples, which is an indication of the thorough involvement of –C=O functional groups with the dye EBT. Similarly, the peaks at 1360 and 1220 cm−1 indicates –C=O stretching vibrations [25]. In AU sample, these two peaks are of weak intensities thus denoting their involvement in the removal process. Another peak around 1035 cm−1 may be representing C–C bond bending vibrations. This peak is more prominent in the BU sample, less prominent in the sample AU and entirely absent in case of sample W.

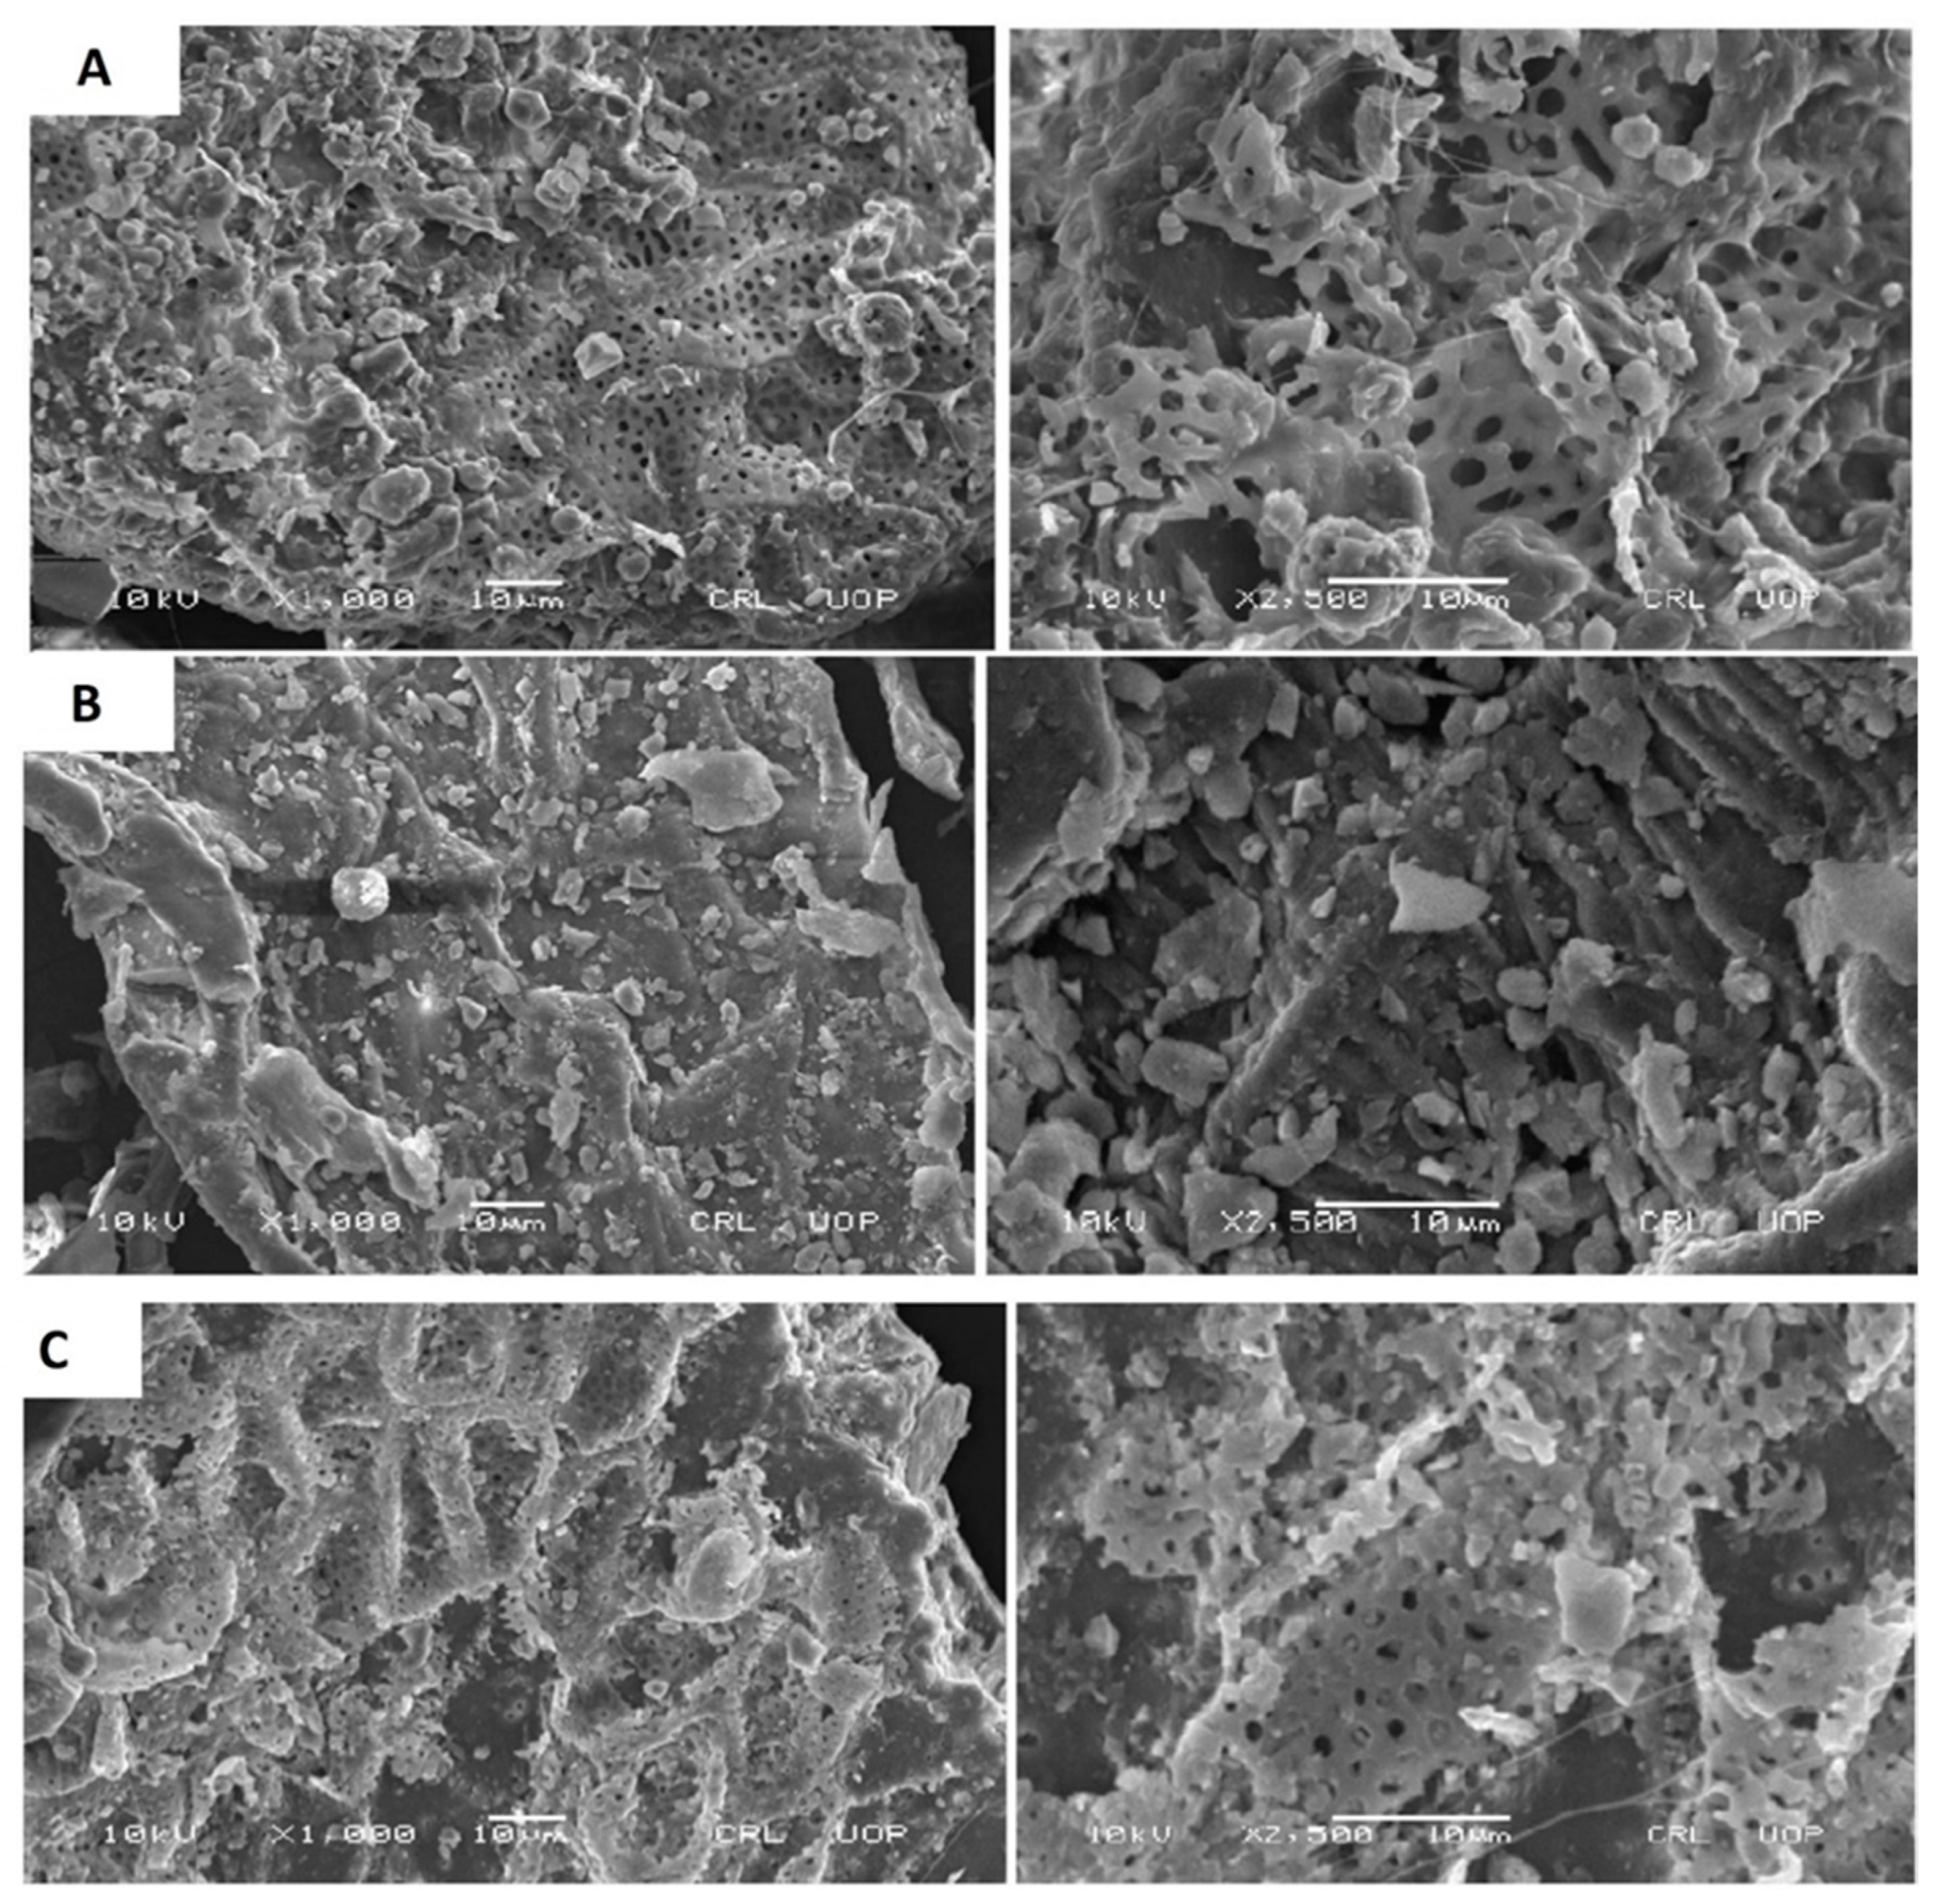
3.1.2. Scanning Electron Microscopy (SEM)
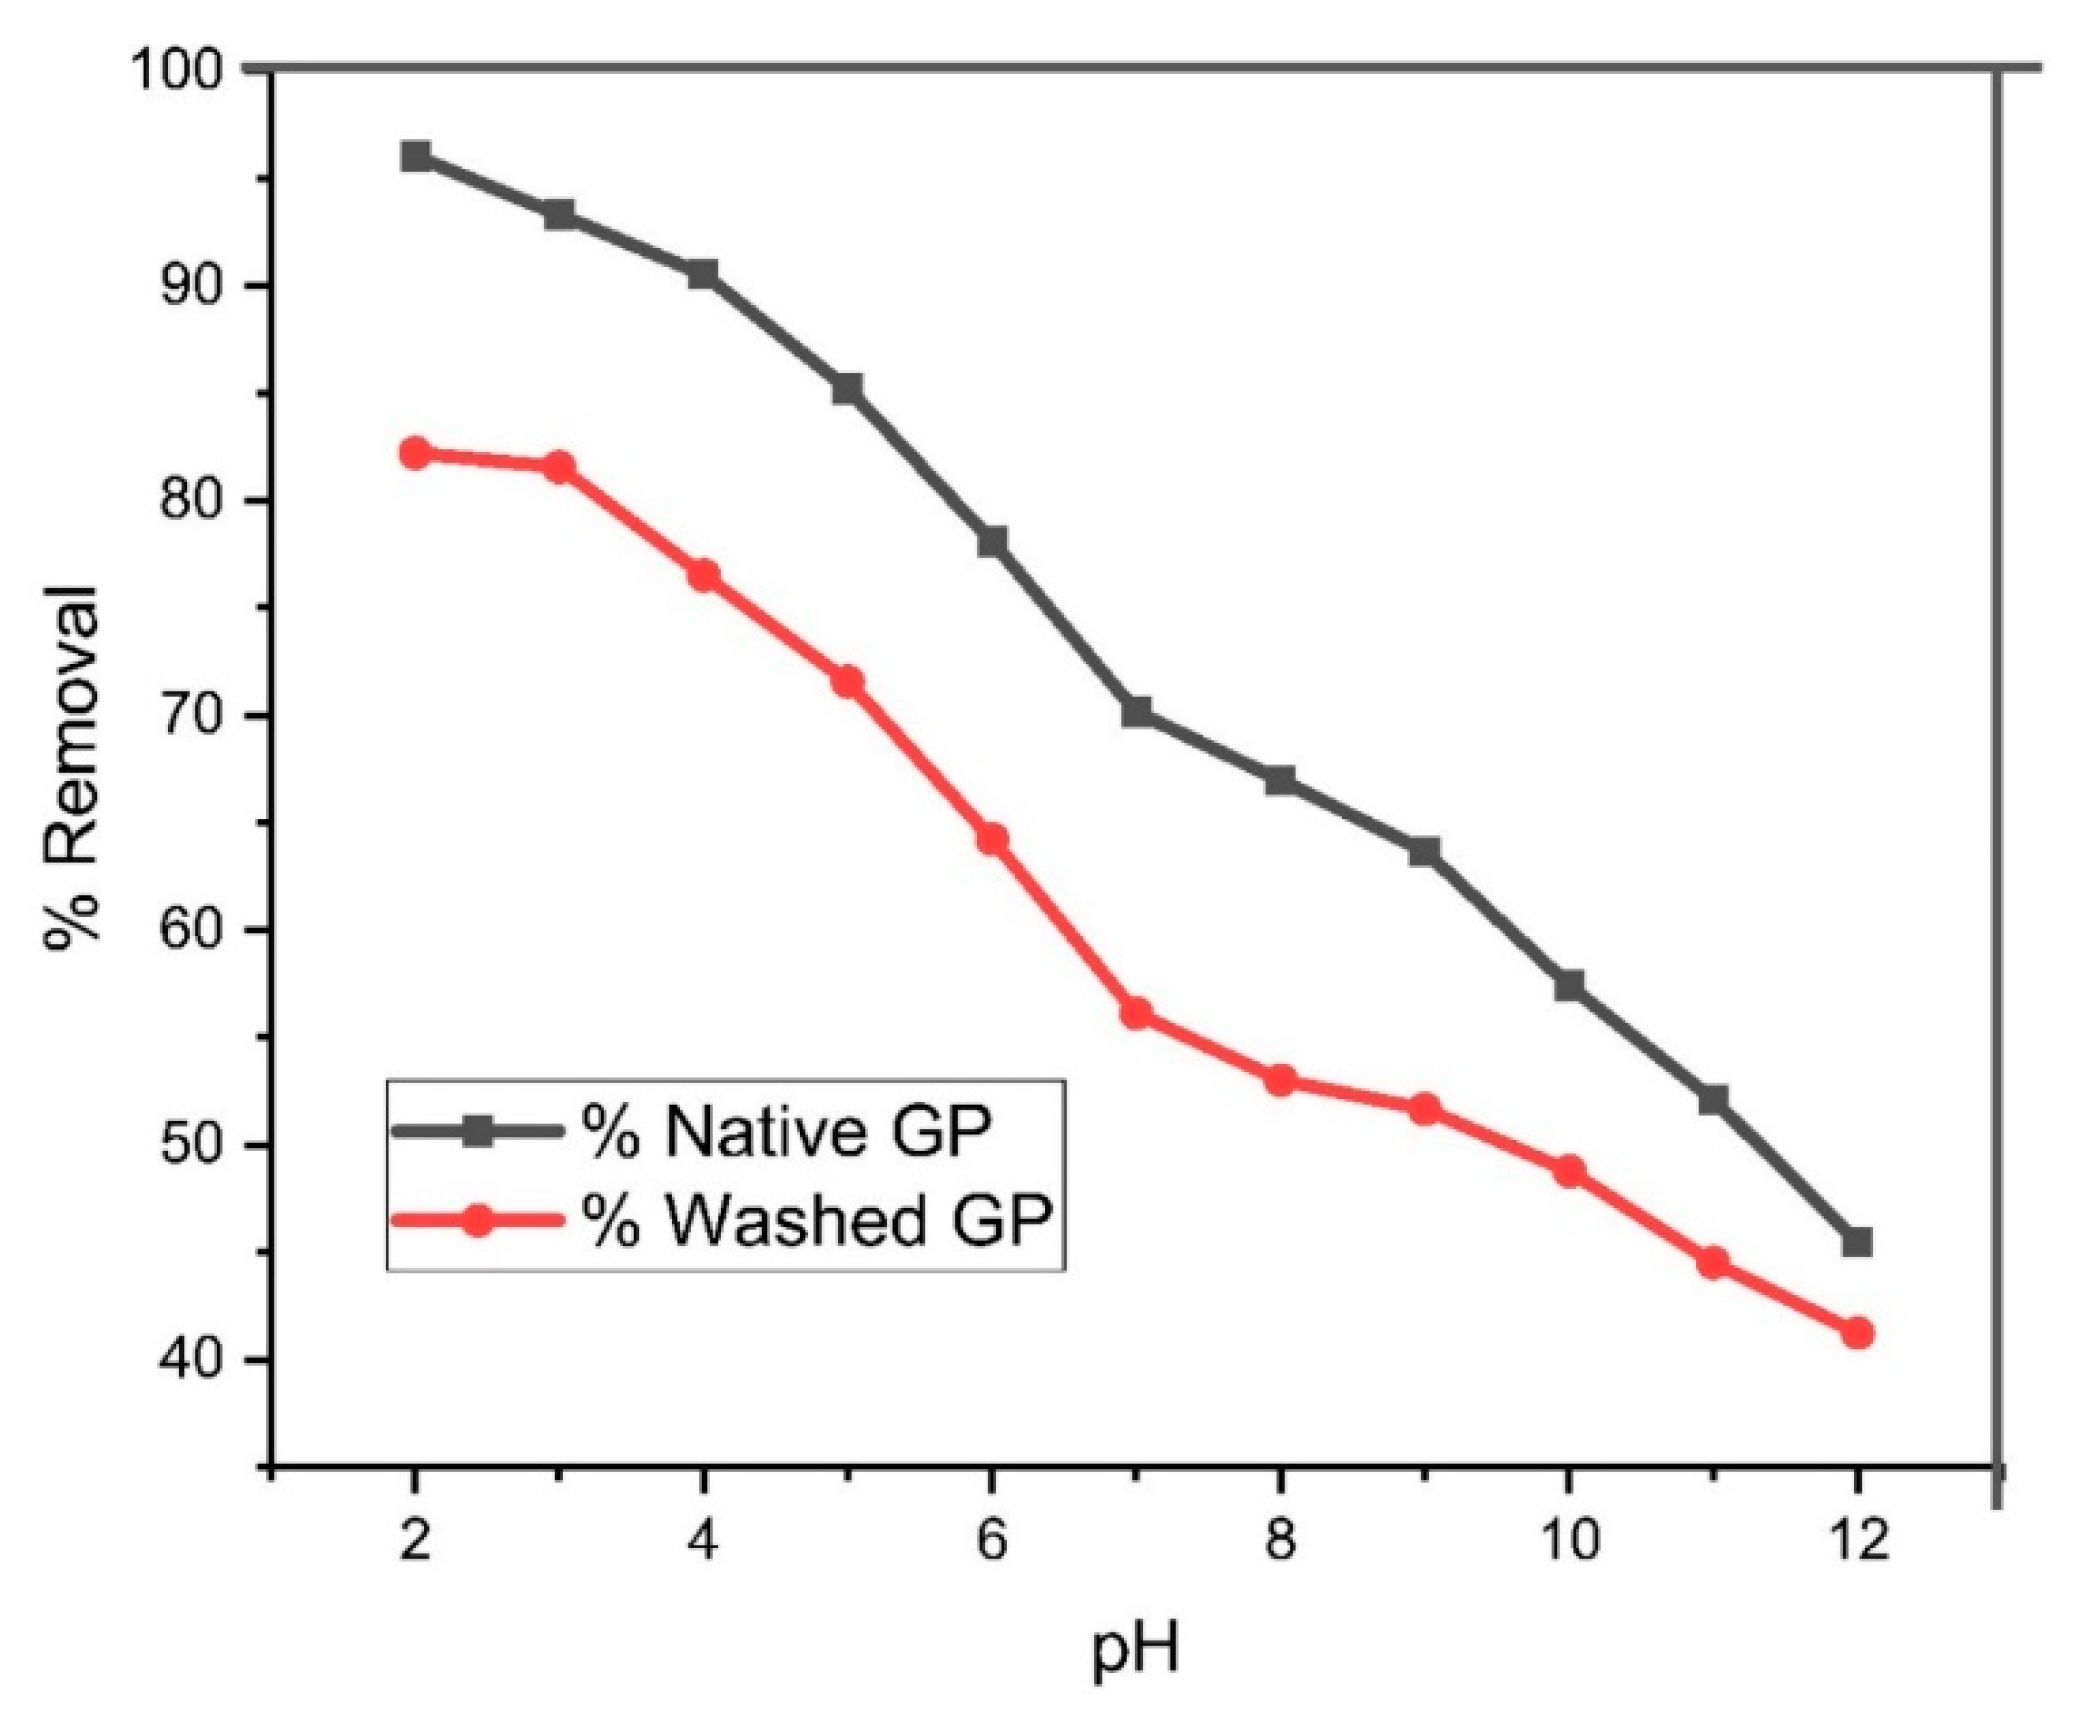
The SEM investigation was performed after using GP and after washing GP in order to gain an understanding of the surface characteristics and morphology of native GP (Figure 2). It can be seen very clearly that native GP was porous, rough, and irregular in shape. The surface possesses pores of different sizes, and the dye EBT might have been getting trapped in these pores during the process of adsorption. In the after-use samples, the pores have almost entirely disappeared, while the texture of the surface remains rough and irregular. It could be an indication that EBT molecules got trapped in the pores and the pores disappeared. Following EBT adsorption on GP, the GP was thoroughly washed with water to remove EBT adsorbed on the surface of the GP. However, it was not completely free of EBT, which was evident from its less intense colored appearance. The SEM images of the washed samples show the presence of pores, but not as intensely distributed as was the case in the before use GP sample. It is reasonable to assume that after washing the samples with water, the pores were partially opened. The size of the pores was found to be smaller as compared to that of the native GP (Table 1). Lu et al. (2016) also observed changes in the surface area, pore volume, and pore size during the adsorption of Cr (VI) and Pb (II) onto modified clay containing sewage sludge ash [26].

3.2. Effect of pH

pH effects the ionization of dye molecules and can also cause a shift charge to be present at the surface of the adsorbent. This results in the exchange of ions between the adsorbent surface and dye molecules. Hence, pH directly affects the adsorption capacity [23]. The effect of pH was evaluated in the pH range of 2 to 12. The effect of pH on the adsorption capacity of EBT at equilibrium (qe) on native and washed GP has been shown in Figure 3.
Maximum uptake of EBT was observed at pH 2, and the adsorption capacity decreased with the increase in pH until pH 12. de-Luna et al., [25] also observed the same decreasing trend for the adsorption capacity of EBT over rice hull-based activated carbon. They found that percent percent removal of EBT decreased as the pH was increased from 2 to 7. This could be because EBT is an anionic dye and has sulphonate groups (–SO3–) that are negatively charged. GP mainly possesses –OH, –NH2 and –C=O groups, which get protonated at acidic pH [27]. At pH 2, the surface of GP becomes positively charged, and the adsorption of EBT increases due to electrostatic forces of interaction. Khalid et al., [28] also observed maximum EBT removal at pH 2 when they adsorbed EBT onto graphene and acid modified graphene.

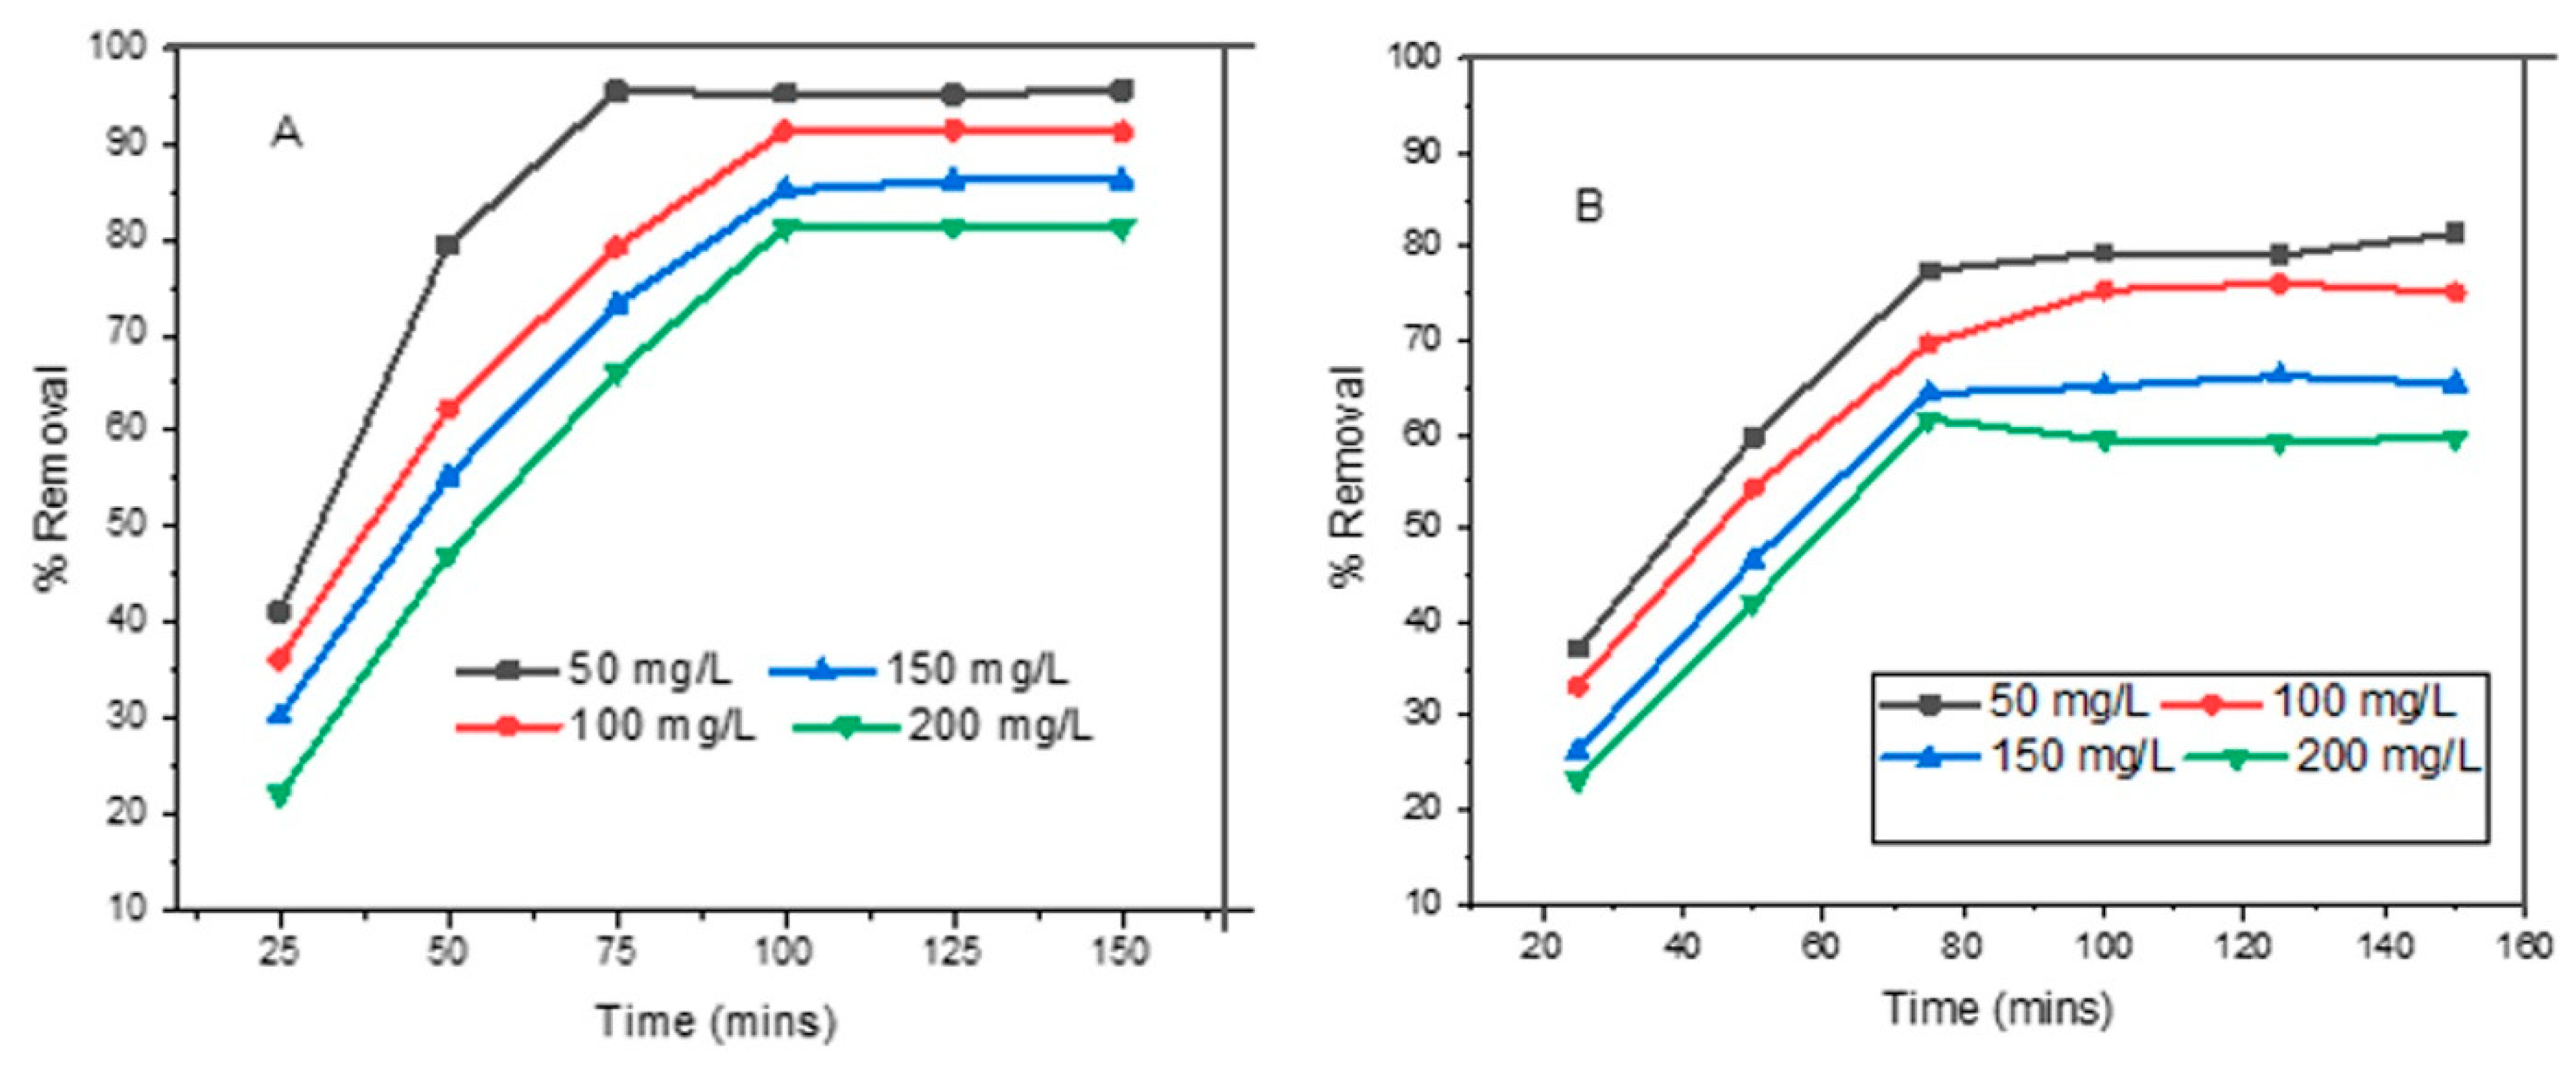
3.3. Effect of Intial Dye Concentration and Contact Time

Contact time and initial dye concentration are very important parameters during the process of adsorption. These parameters can be used to design efficient and effective wastewater treatment systems [29]. The effects of initial dye concentration (50–200 mg/L) and contact time (0–150 min) on the adsorption capacity of native and washed GP are presented in Figure 4A,B, respectively.
In the case of native GP, the percentage removal of EBT decreased from 95.5 to 81.2% as the initial dye concentration was increased from 50 to 200 mg/L, while in case of washed GP the percentage removal of EBT decreased from 81.4 to 59.6% as the initial concentration of the dye was increased from 50 to 200 mg/L. It could be attributed to the fact that at higher concentrations of dye, excess of EBT molecules will quickly saturate the available adsorption sites at the surface of GP and this could have resulted in a decrease in the adsorption capacity. Sabarish et al., [30] for their adsorption studies of EBT onto polyvinyl/starch/zeolite membranes, found the same decreasing trend in adsorption capacity as the initial concentration of EBT was increased from 10 to 50 mg/L.
The adsorption of EBT onto GP took place in two stages. During the first stage, the adsorption capacity of GP increased quickly within the first 30–35 min, while in the second stage, slow adsorption took place, during which adsorption capacity gradually increased over a time period ranging from 30–90 min. After this, almost no further improvement was noticed in the adsorption capacity [31].

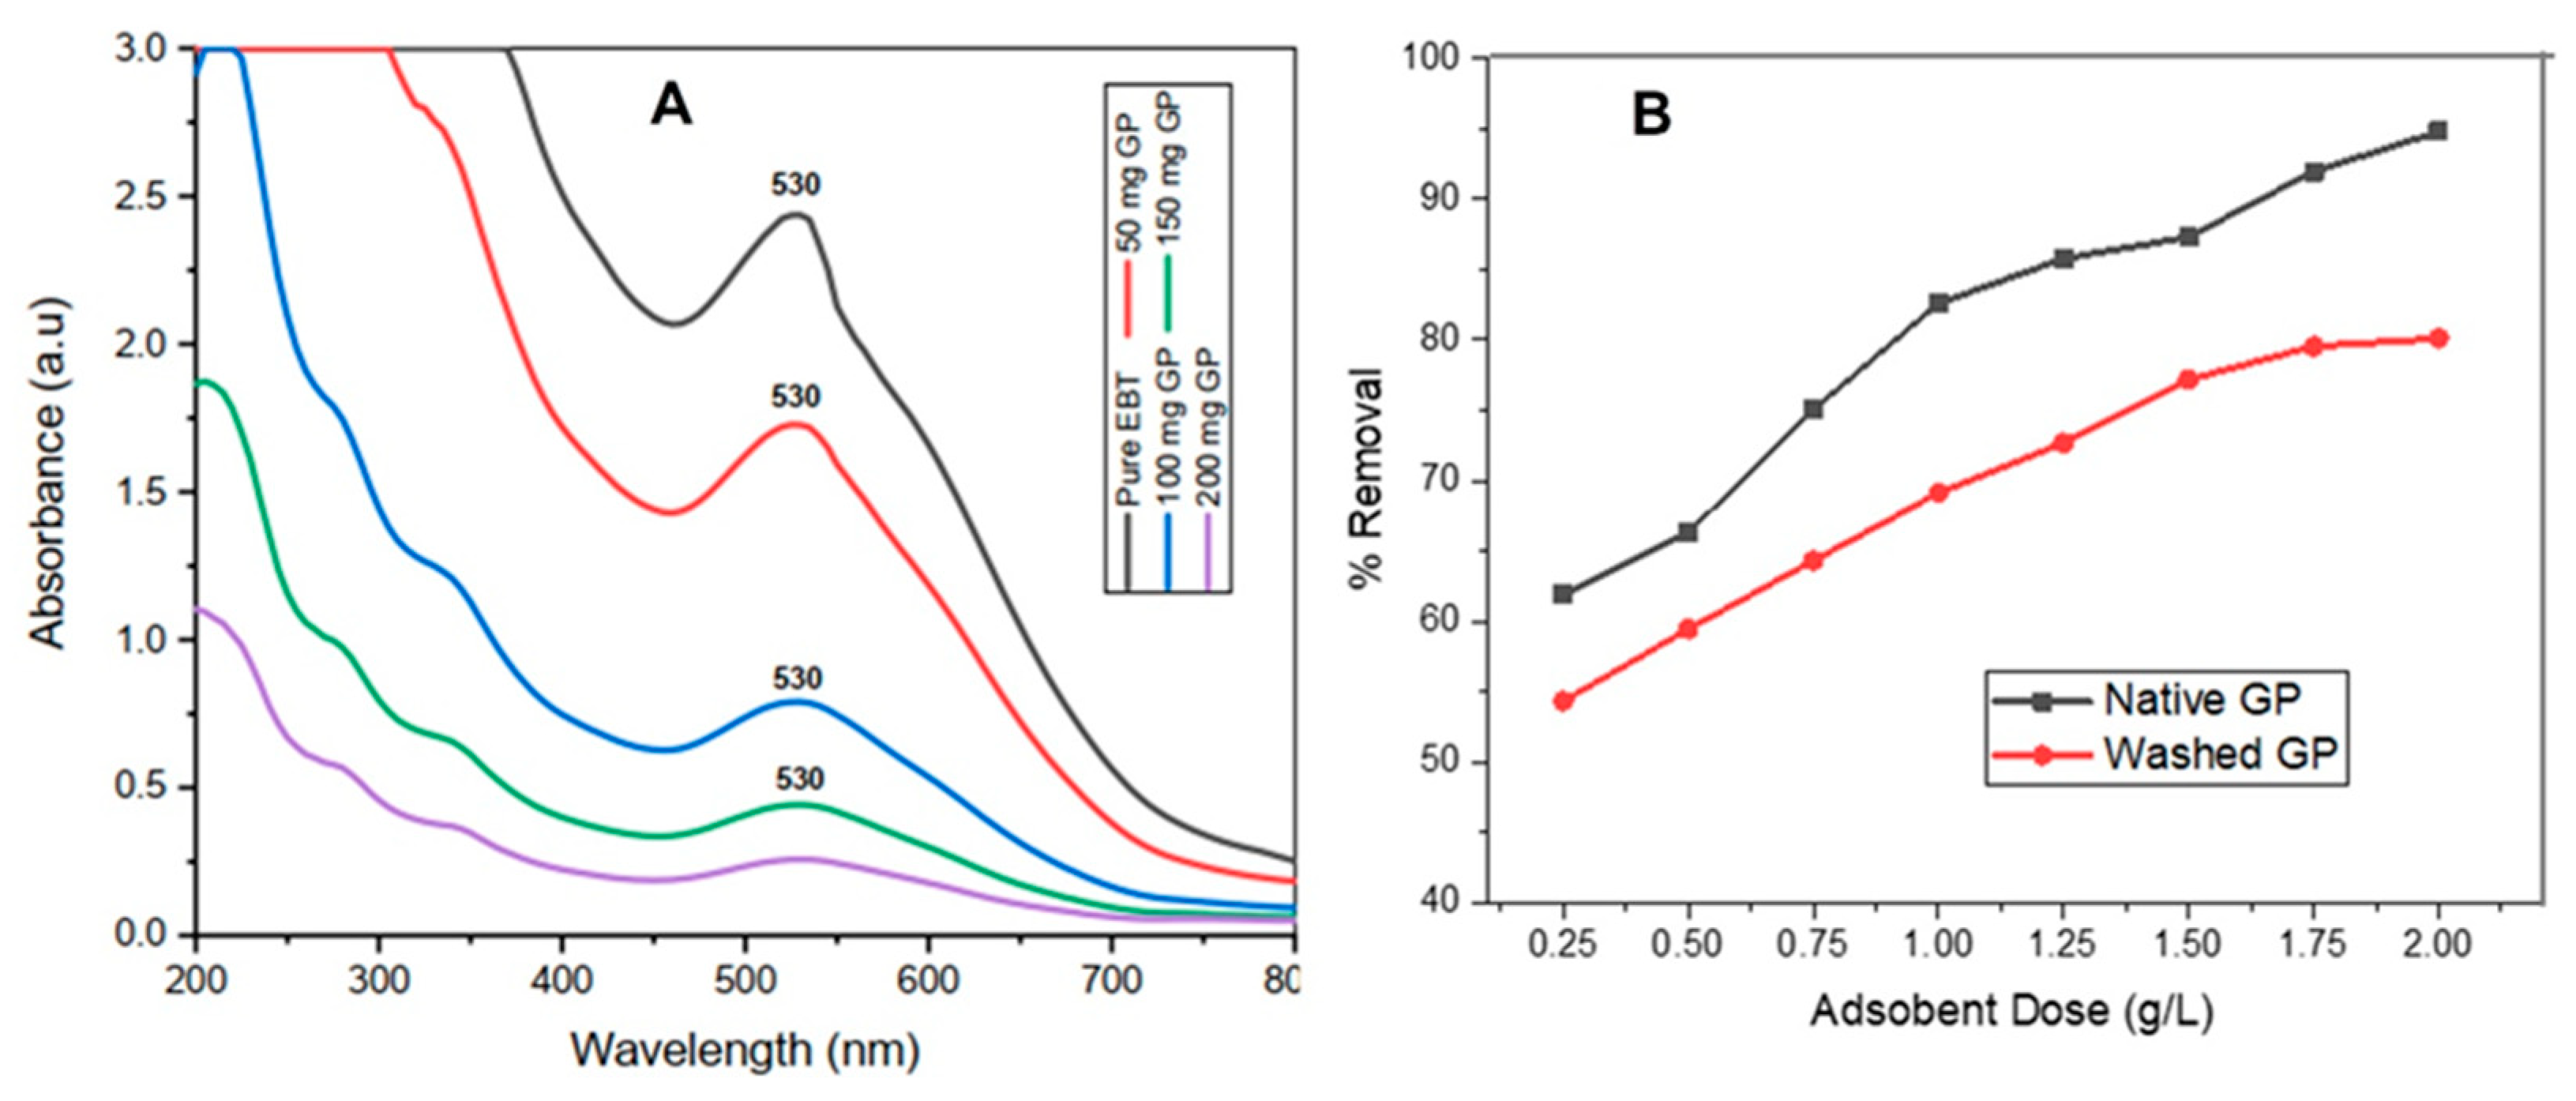
3.4. Effect of Adsorbent Dose

The correlation between adsorbent dosage and percent removal of EBT was studied by using adsorbent dosage ranging from 0.25 to 2.0 g/L of both native and washed GP in separate experiments, in addition to 50 mg/L of EBT dye solution at pH 2 (Figure 5A,B). It can be seen that both native and washed GP possess good potential to remove EBT. The removal efficiency of EBT increased with the increasing adsorbent dose; this can be attributed to the fact that with increasing amounts of adsorbent dose, a greater number of binding sites are available to the dye molecules. The most optimal adsorbent dose was 2.0 g/L, and at this stage the removal efficiency was found to be 94.8% (Native GP) and 80.1% (washed GP). At this stage, due to high surface area of the adsorbent and availability of the maximum number of adsorption sites for binding with dye molecules, the adsorption capacity displayed maximum removal efficiency [32]. Similar results were obtained during a study conducted by Javanbakht and Shafiei et al. [33]. They used sodium alginate and basil seed mucilage based bio-composite for the decontamination of EBT from aqueous samples and observed an increasing trend in the removal efficiency of EBT with an increase in the adsorbent dose [33].

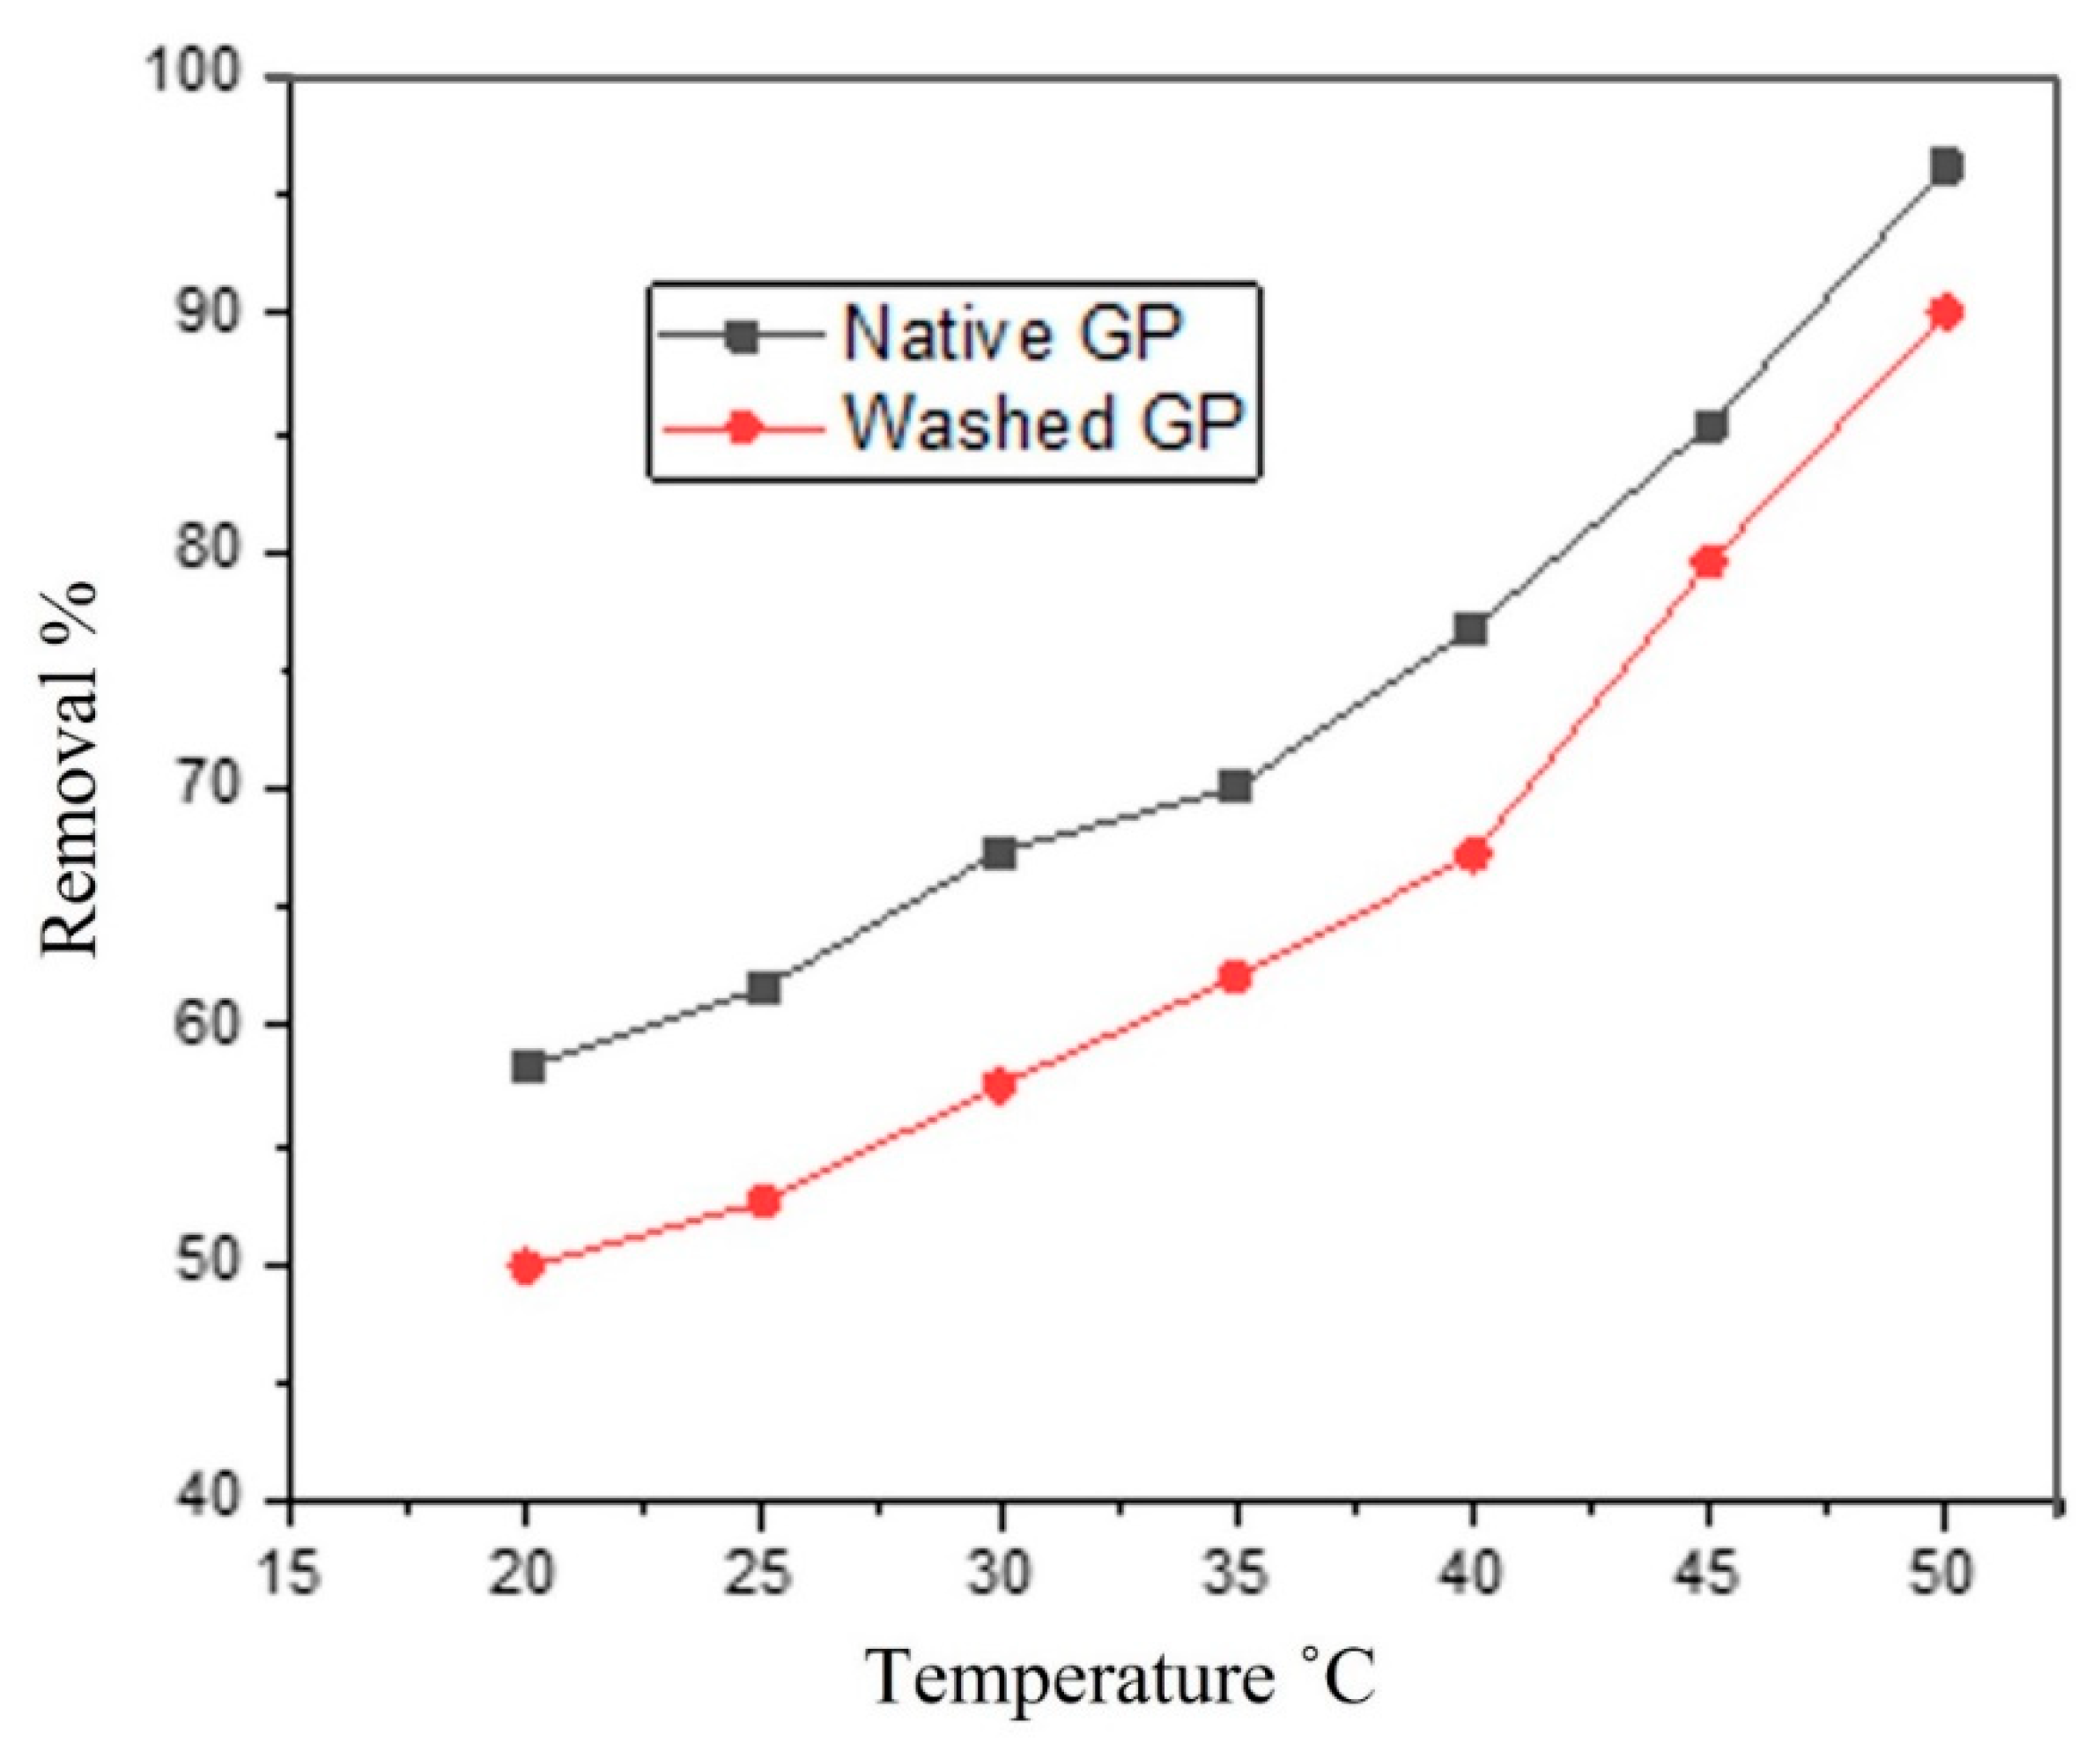
3.5. Effect of Temperature

The effect of temperature on the removal efficiency of EBT by native and washed GP was studied from 20 to 50 °C (Figure 6). EBT uptake and adsorption capacity was found to be 58.2% (native GP) and 49.8 (washed GP) at 20 °C and it contined to increase with the increase in temperature. At 50 °C the maximum percent removal was found to be 93.2 and 79.4% for the native and washed GP, respectively. These results indicated that adsorption of EBT on native and washed GP is an entirely endothermic process and that is adsorption increased with increase in temperature. Sabarish et al. [30] also oberved the same increasing trend in the removal efficiency of EBT when they adsorbed it in PVA/Starch and zeolited based composite membranes. Increase in temperature till the optimum temperature range of adsorbent increases its surface activity and hence results in more removal percentage with the increase in temperature [34]. Singh et al. [35] performed the thermogravematric analysis (TGA) of GP at four heating rates, namely 5, 10, 15 and 20 °C/min. They found that majority of the volatile components of GP thermally degraded in the temperature range of 210–370 °C. It was also reported in that study that the decomposition of GP occur in three stages, first stage represented drying zone, second represented devolatilization while the third stage represented char formation. The first stage ranged from 30 to 165 °C, second stage ranged from 165 to 435 °C and third stage ranged from 435 to 900 °C. They reported that the weight loss after 435 °C was insignificant.

3.6. Adsorption Kinetics

Adsorption kinetics were used to know about the mechanism of adsorption of EBT onto native and washed GP. The results of the experimental data were fitted into a pseudo-first-order and pseudo-second-order model for the adsorption of EBT onto native and washed GP. The results of different parameters are given in Table 2. It can be seen that the pesudo-second-order model fits better than the pseudo-first-order model, with a correlation coefficient value of R2 = 0.999 for both native and washed GP. Similarly, the calculated qe value for pseudo-second-order model fits very well with the experimental data. Thus, it shows that the adsorption of EBT onto native and washed GP follows pseudo-second-order model (Table 2).
The removal efficiency of EBT increases as temperature increased, indicating that the reaction is exothermic [36]. Khalid et al. [28] also reported that a pseudo-second-order kinetic model fits well into the experimental data of EBT adsorption onto graphene and acid modified graphene.

3.7. Thermodynamic Parameters

Van’t Hoff equation was used to know about the thermodynamic parameters [24,31].
ΔG° = −RT ln K
ΔG° = ΔH° − TΔS°
where ΔG° is Gibbs free energy change, ΔS° is change in entropy, ΔH° is change in enthalpy, and K is the equilibrium constant for adsorption process. The thermodynamic parameters affecting the adsorption of EBT onto native and washed GP are shown in Table 3.
The value of ΔG° was calculated using Equation (5) whereas the values of ΔS° and ΔH°were determined from the intercept and slope of lnK vs. 1/T. It is evident from Table 3 that all the values of ΔG° are negative at all temperatures (20 to 50 °C) for both native and washed GP, which confirms that the adsorption process is spontanous and favourable. The value of ΔG° continuously decreased with rise in temperature which denotes endothermic behaviour of adsorption [38]. Furthermore, the value of ΔG° fall in the region of −20 to 0 KJ mol−1 which indicates that the adsorption of EBT is a physically controlled process [39]. Mattson described physical adsorption based on the ΔH° values: 2–29 KJ mol−1 (dipole bonding force), 4–10 KJ mol−1 (van der Waal forces), 2–40 KJ mol−1 (hydrogen bonding forces), 5 KJ mol−1 (hydrophobic bonding forces) and 40 KJ mol−1 (coordination exchange) [40]. Hence, based upon the Mattson crieteria we can safely assume that adosrption of EBT onto native and washed GP is a physical process and may it may involve physical forces such dipole and/or hydrogen bonding forces. The posirive value of ΔH° (2.433 KJ mol−1 (naitive GP) and 2.272 KJ mol−1 (washed GP) indicates that the adsorption process is endothermic in both cases. The positive ΔS° (15.49 KJ mol−1 (native GP) and 13.67 (washed GP)) indicates that an increase in temperature favors dye adsorption by displacing water molecules from GP surface [40]. Khalid et al. [28] found that the adsorption of EBT onto graphene and acid modified graphene was endothermic and spontaneous. Similarly, Rashidi et al. [41] reported that the same thermodynamic findings for the adsorption of EBT onto Montmorillonite.

3.8. Adsorption Isotherms

Adsorption properties and equilibrium parameters are commonly known as adsorption isotherms. Adsorption isotherms comprehensively describes how the adsorbate molecules are interacting with the adsorbate. Adsorption isotherms can be utilized to determine the optimum use of adsorbents and to design an adsorption system for the effective removal of a dye from its solution. Thus, it is absolutely essential to establish an appropriate correlation for the equilibrium curve [42]. Langmuir and Freundlich isotherm models were applied to the adsorption data. Langmuir and Freundlich adsorption isotherms are given in Equations (7) [43] and (8) [43], respectively.
1 q e = 1 q m + 1 K L q m · 1 / C e
ln q e = ln K f + 1 / n   ln C e
where Ce is equilibrium concentration, qm is maximum monolayer adsorption capacity, Kf is Freundlich contant (mg/g), KL is Langmuir adsorption equilibrium constant (L/mg), and n is adsorption intensity constant (Table 4).
The equilibrium data fit well into the Langmuir isotherm as compared to the Freundlich adsorption isotherm. The adsorption isotherm parameters are given in Table 4. The best model for adsorption was selected on the basis of the value of R2. The value of R2 (0.998), in the case of the Langmuir isotherm, indicates that the Langmuir isotherm is perfectly describing the adsorption of EBT onto native and washed GP. The separation factor (RL) helps to predict whether the adsorption process is favorable or unfavorable. The value of RL was calculated by using Equation (9) [23].
R L = 1 / 1 + K L C i
where Ci is intial concentration (mg/L), KL is Langmuir constant (L/mg).
0 < RL > 1 is favourable, RL > 1 is unfavourable, RL = 1 is linear and RL = 0 is irreversible [44]. During this study, the value of RL was found to be 0.008 (native GP) and 0.132 (washed GP) which indicates that adsorption of EBT on both native and washed GP is favourable. Moreover, the value of 1/n, in case of Freundlich isotherm, is found to be 0.131 (native GP) and 0.240 (washed GP) which implies that higher ability of adsorption of EBT dye by native and washed GP [23]. Comparative studies of different dyes adsorbed on various bioadsorbents and EBT adsorbed on different adsorbents are given in Table 5 and Table 6.

3.9. Desorption Studies

During desorption studies, different alkaline solutions (pH 9, 10, 11, and 12) were used to desorb EBT adsorbed onto GP. The alkaline solutions were selected for desorption because adsorption was minimal at higher pH. When the pH was increased from 9 to 12, the desorption of EBT increased from 13.95 to 36.07%. This could be due in the increase in the number of negatively charged sites at elevated pH levels. This resulted increased repulsion between the adsorption sites and EB molecules, resulted in an increase in desorption. The desorption capacity of EBT loaded GP was found to be lower than that of Reactive Red 120 loaded elephant dung [45], pine cone [46], and C. contraria [47] for anionic azo dyes like EBT. The moderate desorption efficiency of GP indicates that the interactions between EBT molecules and the GP surface consist of both weak and strong binding forces. This result was fully supported by the kinetic and thermodynamic parameters of this study.

4. Conclusions

This study revealed native and washed garlic peel displayed 96 and 82% removal of EBT, respectively. The surface area of native GP was found to be 14.001 m2/g while that of WGP was determined to be 13.020 m2/g. The pore volume and pore size for GP were 0.015 cm3/g and 15.076 A°, respectively while those for WGP were 0.013 cm3/g and 15.011 A°, respectively. ΔG° ranged from −2.112 to −2.576 KJ mol−1 and −1.726 to −2.068 KJ mol−1 for GP and WGP, respectively at the temperature range of 293–323 K. ΔH° was found to be 2.433 and 2.272 KJ mol−1 for GP and WGP, respectively. Similarly, ΔS° for GP and WGP were determined to be 15.480 and 13.665 JK−1 mol−1, respectively. Equilibrium data was better explained by the Langmuir isotherm. Adsorption capacities of 99.5 and 89.4 mg/g were noted for native and washed GP, respectively. The experimental data fit well into pseudo-second order kinetics for both the native and washed GP samples. The absorption process was found to be spontaneous, favorable, and endothermic. GP were also found to possess good potential for reusability. From these results, it can be concluded that GP can be effectively used for the removal of EBT from water.

Author Contributions

M.A.: Conceptualization, Project administration, Supervision, resources, review; M.T.: Data curation, investigation, Methodology, manuscript write-up; S.A.: Manuscript write-up, proof reading, Methodology, supervision; I.: Validation, Resources, Methodology; B.K.: Project administration, validation, Review and editing; W.N.S.: Supervision, Methodology, softwares, analysis; N.A.-Z.: Manuscript proof reading, funding arrangement, expert opinion; M.N.M.I.: Manuscript proof reading, validation, Data Analysis. All authors have read and agreed to the published version of the manuscript.

Funding

This research was funded by Researchers Supporting Project (grant number: RSP-2021/396), King Saud University, Riyadh, Saudi Arabia.

Institutional Review Board Statement

Not applicable.

Data Availability Statement

The authors confirm that all data underlying the findings are fully available without restriction. Data can be obtained after submitting a request to the corresponding/first author.

Acknowledgments

The authors extend their appreciation to the Researchers Supporting Project number (RSP-2021/396), King Saud University, Riyadh, Saudi Arabia.

Conflicts of Interest

The authors declare that there are no conflict interests related to this work.

References

  1. Alprol, A.E.; Heneash, A.M.; Ashour, M.; Abualnaja, K.M.; Alhashmialameer, D.; Mansour, A.T.; Sharawy, Z.Z.; Abu-Saied, M.A.; Abomohra, A.E. Potential Applications of Arthrospira platensis Lipid-Free Biomass in Bioremediation of Organic Dye from Industrial Textile Effluents and Its Influence on Marine Rotifer (Brachionus plicatilis). Materials 2021, 14, 4446. [Google Scholar] [CrossRef] [PubMed]
  2. Gong, R.; Li, M.; Yang, C.; Sun, Y.; Chen, J. Removal of cationic dyes from aqueous solution by adsorption on peanut hull. J. Hazard. Mater. 2005, 121, 247–250. [Google Scholar] [CrossRef] [PubMed]
  3. Barka, N.; Abdennouri, M.; El Makhfouk, M. Removal of Methylene Blue and Eriochrome Black T from aqueous solutions by biosorption on Scolymus hispanicus L.: Kinetics, equilibrium and thermodynamics. J. Taiwan Inst. Chem. Eng. 2011, 42, 320–326. [Google Scholar] [CrossRef]
  4. Islam, A.; Ahmad, A.; Laskar, M.A. Characterization of a Chelating Resin Functionalized via Azo Spacer and Its Analytical Applicability for the Determination of Trace Metal Ions in Real Matrices. J. Appl. Polymer Sci. 2011, 123, 3448–3458. [Google Scholar] [CrossRef]
  5. Ejhieh, A.N.; Khorsandi, M. Photodecolorization of Eriochrome Black T using NiS-P zeolite as a heterogeneous catalyst. J. Hazard. Mater. 2010, 176, 629–637. [Google Scholar] [CrossRef]
  6. Yaqoob, A.A.; Noor, N.H.M.; Serrà, A.; Mohamad Ibrahim, M.N. Advances and challenges in developing efficient graphene oxide-based ZnO photocatalysts for dye photo-oxidation. Nanomaterials 2020, 10, 932. [Google Scholar] [CrossRef]
  7. Badawi, A.K.; Ismail, B.; Baaloudj, O.; Abdalla, K.Z. Advanced wastewater treatment process using algal photo-bioreactor associated with dissolved-air flotation system: A pilot-scale demonstration. J. Water Process. Eng. 2022, 46, 102565. [Google Scholar] [CrossRef]
  8. Ahmad, A.A.; Hameed, B. Fixed-bed Adsorption of Reactive Azo Dye onto Granular Activated Carbon Prepared from Waste. J. Hazard. Mater. 2009, 175, 298–303. [Google Scholar] [CrossRef]
  9. Idris, M.O.; Kim, H.C. Exploring the effectiveness of microbial fuel cell for the degradation of organic pollutants coupled with bio-energy generation. Sustain. Energy Technol. Assess. 2022, 52, 102183. [Google Scholar] [CrossRef]
  10. Crini, G. Non-conventional low-cost adsorbents for dye removal: A review. Bioresour. Technol. 2006, 97, 1061–1085. [Google Scholar] [CrossRef]
  11. Yaqoob, A.A.; Parveen, T.; Umar, K.; Mohamad Ibrahim, M.N. Role of Nanomaterials in the Treatment of Wastewater: A Review. Water 2020, 12, 495. [Google Scholar] [CrossRef] [Green Version]
  12. Yaqoob, A.A.; Noor, N.H.M.; Umar, K.; Adnan, R.; Rashid, M. Graphene oxide–ZnO nanocomposite: An efficient visible light photocatalyst for degradation of rhodamine B. Appl. Nanosci. 2021, 11, 1291–1302. [Google Scholar] [CrossRef]
  13. García-Montaño, J.; Ruiz, N.; Muñoz, I.; Domènech, X.; García-Hortal, J.A.; Torrades, F.; Peral, J. Environmental assessment of different photo-Fenton approaches for commercial reactive dye removal. J. Hazard. Mater. 2006, 138, 218–225. [Google Scholar] [CrossRef] [PubMed]
  14. Abualnaja, K.M.; Alprol, A.E.; Abu-Saied, M.A.; Ashour, M.; Mansour, A.T. Removing of anionic dye from aqueous solutions by adsorption using of multiwalled carbon nanotubes and poly (Acrylonitrile-styrene) impregnated with activated carbon. Sustainability 2021, 13, 7077. [Google Scholar] [CrossRef]
  15. Kansal, S.; Sood, S.; Umar, A.; Mehta, S. Photocatalytic degradation of Eriochrome Black T dye using well-crystalline anatase TiO2 nanoparticles. J. Alloys Compd. 2013, 581, 392–397. [Google Scholar] [CrossRef]
  16. Moeinpour, F.; Alimoradi, A.; Kazemi, M. Efficient removal of Eriochrome black-T from aqueous solution using NiFe2O4 magnetic nanoparticles. J. Environ. Health Sci. Eng. 2014, 12, 112. [Google Scholar] [CrossRef] [Green Version]
  17. Cheng, Z.; Zhang, L.; Guo, X.; Jiang, X.; Li, T. Adsorption behavior of direct red 80 and congo red onto activated carbon/surfactant: Process optimization, kinetics and equilibrium. Spectrochim. Acta Part A Mol. Biomol. Spectrosc. 2015, 137, 1126–1143. [Google Scholar] [CrossRef] [PubMed]
  18. Dave, P.; Kaur, S.; Khosla, E. Removal of Eriochrome black-T by adsorption on to eucalyptus bark using green technology. Indian J. Chem. Technol. 2011, 18, 53–60. [Google Scholar]
  19. Kallel, F.; Chaabouni Ellouz, S. Perspective of garlic processing wastes as low-cost substrates for production of high-added value products: A review. Environ. Prog. Sustain. Energy 2017, 36, 1765–1777. [Google Scholar] [CrossRef]
  20. Liu, W.; Liu, Y.; Tao, Y.; Yu, Y.; Jiang, H.; Lian, H. Comparative study of adsorption of Pb(II) on native garlic peel and mercerized garlic peel. Environ. Sci. Pollut. Res. Int. 2014, 21, 2054–2063. [Google Scholar] [CrossRef]
  21. Hameed, B.H.; Ahmad, A.A. Batch adsorption of methylene blue from aqueous solution by garlic peel, an agricultural waste biomass. J. Hazard. Mater. 2009, 164, 870–875. [Google Scholar] [CrossRef] [PubMed]
  22. Saif Ur Rehman, M.; Kim, I.; Rashid, N.; Adeel Umer, M.; Sajid, M.; Han, J.-I. Adsorption of Brilliant Green Dye on Biochar Prepared From Lignocellulosic Bioethanol Plant Waste. CLEAN Soil Air Water 2016, 44, 55–62. [Google Scholar] [CrossRef]
  23. Laskar, N.; Kumar, U. Removal of Brilliant Green dye from water by modified Bambusa Tulda: Adsorption isotherm, kinetics and thermodynamics study. Int. J. Environ. Sci. Technol. 2018, 16, 1649–1662. [Google Scholar] [CrossRef]
  24. Fayoud, N.; Tahiri, S.; Alami Younssi, S.; Albizane, A.; Gallart-Mateu, D.; Cervera, M.L.; de la Guardia, M. Kinetic, isotherm and thermodynamic studies of the adsorption of methylene blue dye onto agro-based cellulosic materials. Desalination Water Treat. 2016, 57, 16611–16625. [Google Scholar] [CrossRef]
  25. De Luna, M.D.G.; Flores, E.D.; Genuino, D.A.D.; Futalan, C.M.; Wan, M.-W. Adsorption of Eriochrome Black T (EBT) dye using activated carbon prepared from waste rice hulls—Optimization, isotherm and kinetic studies. J. Taiwan Inst. Chem. Eng. 2013, 44, 646–653. [Google Scholar] [CrossRef]
  26. Lu, H.; Zhang, Q.; Dong, Y.; Li, J.; Zhang, X. The Adsorption Capacity, Pore Structure, and Thermal Behavior of the Modified Clay Containing SSA. Adv. Mater. Sci. Eng. 2016, 2016, 9894657. [Google Scholar] [CrossRef] [Green Version]
  27. Al-Degs, Y.S.; El-Barghouthi, M.I.; El-Sheikh, A.H.; Walker, G.M. Effect of solution pH, ionic strength, and temperature on adsorption behavior of reactive dyes on activated carbon. Dye. Pigment. 2008, 77, 16–23. [Google Scholar] [CrossRef]
  28. Khalid, A.; Zubair, M.; Ihsanullah. A Comparative Study on the Adsorption of Eriochrome Black T Dye from Aqueous Solution on Graphene and Acid-Modified Graphene. Arab. J. Sci. Eng. 2018, 43, 2167–2179. [Google Scholar] [CrossRef]
  29. Ahmad, A.; Setapar, S.H.M.; Yaqoob, A.A.; Ibrahim, M.N.M. Synthesis and characterization of GO-Ag nanocomposite for removal of malachite dye from aqueous solution. Mater. Today Proc. 2021, 47, 1359–1365. [Google Scholar] [CrossRef]
  30. Radoor, S.; Karayil, J.; Parameswaranpillai, J.; Siengchin, S. Adsorption Study of Anionic Dye, Eriochrome Black T from Aqueous Medium Using Polyvinyl Alcohol/Starch/ZSM-5 Zeolite Membrane. J. Polym. Environ. 2020, 28, 2631–2643. [Google Scholar] [CrossRef]
  31. Sukla Baidya, K.; Kumar, U. Adsorption of brilliant green dye from aqueous solution onto chemically modified areca nut husk. S. Afr. J. Chem. Eng. 2021, 35, 33–43. [Google Scholar] [CrossRef]
  32. Pathania, D.; Sharma, S.; Singh, P. Removal of methylene blue by adsorption onto activated carbon developed from Ficus carica bast. Arab. J. Chem. 2017, 10, S1445–S1451. [Google Scholar] [CrossRef] [Green Version]
  33. Javanbakht, V.; Shafiei, R. Preparation and performance of alginate/basil seed mucilage biocomposite for removal of eriochrome black T dye from aqueous solution. Int. J. Biol. Macromol. 2020, 152, 990–1001. [Google Scholar] [CrossRef] [PubMed]
  34. Abdulrahman Oyekanmi, A.; Abd Latiff, A.A.; Daud, Z.; Saphira Radin Mohamed, R.M.; Ismail, N.; Ab Aziz, A.; Rafatullah, M.; Hossain, K.; Ahmad, A.; Kamoldeen Abiodun, A. Adsorption of cadmium and lead from palm oil mill effluent using bone-composite: Optimisation and isotherm studies. Int. J. Environ. Anal. Chem. 2019, 99, 707–725. [Google Scholar] [CrossRef]
  35. Singh, R.K.; Patil, T.; Sawarkar, A.N. Pyrolysis of garlic husk biomass: Physico-chemical characterization, thermodynamic and kinetic analyses. Bioresour. Technol. Rep. 2020, 12, 100558. [Google Scholar] [CrossRef]
  36. Yang, Y.; Lin, X.; Wei, B.; Zhao, Y.; Wang, J. Evaluation of adsorption potential of bamboo biochar for metal-complex dye: Equilibrium, kinetics and artificial neural network modeling. Int. J. Environ. Sci. Technol. 2014, 11, 1093–1100. [Google Scholar] [CrossRef]
  37. Salman, S.M.; Ali, A.; Khan, B.; Iqbal, M.; Alamzeb, M. Thermodynamic and kinetic insights into plant-mediated detoxification of lead, cadmium, and chromium from aqueous solutions by chemically modified Salvia moorcroftiana leaves. Environ. Sci. Pollut. Res. Int. 2019, 26, 14339–14349. [Google Scholar] [CrossRef]
  38. Mane, V.S.; Babu, P.V.V. Studies on the adsorption of Brilliant Green dye from aqueous solution onto low-cost NaOH treated saw dust. Desalination 2011, 273, 321–329. [Google Scholar] [CrossRef]
  39. Auta, M.; Hameed, B.H. Modified mesoporous clay adsorbent for adsorption isotherm and kinetics of methylene blue. Chem. Eng. J. 2012, 198–199, 219–227. [Google Scholar] [CrossRef]
  40. Mattson, J.S.M.H.B. Activated Carbon: Surface Chemistry and Adsorption from Solution; M. Dekker: New York, NY, USA, 1971. [Google Scholar]
  41. Rashidi, R.; Omidi Khaniabadi, Y.; Ghaderpoori, M. Adsorption of Eriochrome black-T from aqueous environment by raw Montmorillonite. Int. J. Environ. Anal. Chem. 2021, 1–15. [Google Scholar] [CrossRef]
  42. Nandi, B.; Goswami, A.; Purkait, M. Adsorption Characteristics of Brilliant Green Dye on Kaolin. J. Hazard. Mater. 2008, 161, 387–395. [Google Scholar] [CrossRef] [PubMed]
  43. Salman, S.; Wahab, M.; Zahoor, M.; Shahwar, D.; Sultana, S.; Alamzeb, M.; Ahmed, S. Green mediated biosorption of Pb (II) from aqueous solution using chemically modified low cost Grewia optiva leaves. Desalination Water Treat. 2020, 195, 413–420. [Google Scholar] [CrossRef]
  44. Jahagirdar, S.S.; Shrihari, S.; Manu, B. Reuse of incinerated textile mill sludge as adsorbent for dye removal. KSCE J. Civ. Eng. 2015, 19, 1982–1986. [Google Scholar] [CrossRef]
  45. Çelekli, A.; Bozkurt, H. Sorption and desorption studies of a reactive azo dye on effective disposal of redundant material. Environ. Sci. Pollut. Res. 2013, 20, 4647–4658. [Google Scholar] [CrossRef]
  46. Mahmoodi, N.M.; Hayati, B.; Arami, M.; Lan, C. Adsorption of textile dyes on Pine Cone from colored wastewater: Kinetic, equilibrium and thermodynamic studies. Desalination 2011, 268, 117–125. [Google Scholar] [CrossRef]
  47. Çelekli, A.; Tanrıverdi, B.; Bozkurt, H. Predictive modeling of removal of Lanaset Red G on Chara contraria; kinetic, equilibrium, and thermodynamic studies. Chem. Eng. J. 2011, 169, 166–172. [Google Scholar] [CrossRef]
Figure 1. FT-IR spectra of pure garlic peel (BU), after adsorption of EBT garlic peel (AU) and washed after use garlic peel (W).
Water 14 03713 g001
Figure 2. SEM images of before use (BU, A), after use (AU, B) and washed garlic peel (W, C).
Water 14 03713 g002
Figure 3. Effect of pH on the removal of EBT.
Water 14 03713 g003
Figure 4. Effect of initial dye concentration and contact time (A) Native GP (B) Washed GP.
Water 14 03713 g004
Figure 5. (A) Effect of adsorbent dose on the λmax of EBT (B) Effect of adsorbent dose on the removal of EBT.
Water 14 03713 g005
Figure 6. Effect of temperature on the removal of EBT.
Water 14 03713 g006
Table 1. Surface area analysis of native and washed GP.
ParameterAdsorbent
Native GPAfter Use GPWashed GP
Surface Area (m2/g)14.00113.02513.020
Pore Volume (cm3/g)0.0150.0140.013
Pore size (Based on BJH) (A°)15.07616.03715.011
Table 2. Adsorption kinetics parameters of EBT dye of native and washed GP.
AdsorbentPseudo First OrderPseudo-Second Order
C0Qe expqe calK1R2qe calK2R2
(mg/L) [23](mg/g) [23](mg/g) [23]
Native GP35079.842.29−0.00030.81279.570.03920.999
Washed GP5065.723.40−0.00040.71965.100.02310.999
Table 3. Thermodynamic parameters for EBT adsorption on native and washed GP.
AdsorbentTemp (K) [37]KLΔG°
(KJ mol−1) [37]
ΔH°
(KJ mol−1) [37]
ΔS°
(JK−1 mol−1) [37]
R2
Native GP2932.380−2.1122.43315.4800.989
2982.412−2.180
3032.445−2.247
3082.483−2.326
3132.536−2.415
3182.565−2.485
3232.617−2.576
Washed GP2932.031−1.7262.27213.6650.944
2982.052−1.780
3032.130−1.904
3082.130−1.936
3132.155−1.998
3182.187−2.068
3232.218−2.139
Table 4. Adsorption Isotherm studies for the adsorption of EBT onto native and washed GP.
Isotherm TypeParametersAdsorbent
Native GPWashed GP
Langmuirqmax (mg/g) [37]99.52289.401
KL (L/mg) [37]2.3820.1309
RL0.00830.1326
R20.9980.970
FreundlichKf5.8504.439
R20.7580.731
1/n0.1310.241
Table 5. Comparison of different bio-adsorbents utilized for the decontamination of different dyes from aqueous environment [22,23].
Sr. No.Bio-AdsorbentName of DyeQmax (mg/g)
1Na2CO3-Treated BambusaBG41.67
2HCL-Treated BambusaBG32.15
3DBT-Treated BambusaBG33.32
4Coir pithCR3.0
5Banana PeelBB 920.8
6Orange peelAV20.0
7StrawBB 920.0
8Sugarcane bagasseAO 106.10
9Date pitBB 917.0
10Coir pithDirect red 287.0
11WatermelonCV12
12CharfinesDirect brown 16.1
13Rice huskBB 920.0
15Hazelnut shellBB 99.0
16Carbonized acorn seed wasteBG2.11
17Rice husk ashBG25.13
18Oxidized cactus fruit peelBG142.85
19Ashoka leaf powderBG125
20Rice straw biocharBG111.11
21Bagasse fly ashBG116.28
22Native Garlic Peel (This Study)Eriochrome Black T99.52
23Washed Garlic Peel (This Study)Eriochrome Black T89.40
Note(s): BG = Brilliant Green, CR = Congo Red, BB = Basic Blue, AV = Acid Violet, AO = Acid Orange, CV = Crystal Violet.
Table 6. Comparative study of Eriochrome Black T adsorbed on different adsorbents [16,28,41].
S. No.Adsorbent DetailQmax (mg/g)
1Maize stem167
2Graphene102.04
3Acid-modified Graphene70.42
4Native almond shells6.0
5Almond shells (cold plasma treated)18.18
6Almond shells (Microwave treated)29.41
7Rice hulls based activated carbon161.0
8Magnetite/silica/pectin nanoparticles65.35
9Bottom ash94.96
10H3PO4-modified berry leaves133.33
11NiFe2O4 nanoparticles81.52
12NiFe2O4 magnetic nanoparticles47.0
13Polyzwitterionic acid (Hydrophobic cross-linked)15.9
14β-Cyclodextrins20.0
15NiFe-hydroxides133.0
16Mosambi peel Activated carbon46.50
17Bentonite carbon composite2.89
18Polymer/Kaolinite0.32
19Talc1.09
20HCl modified Clay16.20
21H2SO4 modified Clay16.50
22Montmorillonite99.0
23Eucalyptus bark52.37
24Native Garlic Peel (This study)99.52
25Washed Garlic Peel (This study)89.40
Publisher’s Note: MDPI stays neutral with regard to jurisdictional claims in published maps and institutional affiliations.

