Article

Numerical Simulation of Debris Flow and Driftwood with Entrainment of Sediment

1
Research Organization of Science and Technology, Ritsumeikan University, Nojihigashi, Kusatsu-shi 525-8577, Japan
2
Department of Civil Engineering, Korea National University of Transportation, 50 Daehak-ro, Chungju-si 27469, Republic of Korea
3
Faculty of Sustainable Design, University of Toyama, 3190 Gofuku, Toyama-shi 930-8555, Japan
4
Department of Civil Engineering, Kyungsung University, Busan 48434, Republic of Korea
*
Author to whom correspondence should be addressed.
Water 2022, 14(22), 3673; https://doi.org/10.3390/w14223673
Submission received: 18 October 2022 / Revised: 10 November 2022 / Accepted: 11 November 2022 / Published: 14 November 2022
(This article belongs to the Section Hydraulics and Hydrodynamics)

Abstract

:
Unlike general landslides, debris flow has a high water content, due to large floods and rainfall. On steep slopes, it behaves like a large specific-weight sediment–water mixture, rather than general fluid. Thus, its momentum rapidly increases, damaging human lives and properties. This study developed a numerical model of debris flow considering driftwood and entrainment erosion, and performed numerical simulations based on the 2011 observation data of Mt. Umyeon. To develop the debris-flow model, the Nays2DFlood model, which is a flooding model based on the shallow-water equation, was coupled with the advection and diffusion of the sediment–water mixture, debris-flow bottom shear-stress, and entrainment-erosion modules. The simulation better reproduced the depth, flow velocity, and debris-flow volume of Mt. Umyeon. In particular, the driftwood generation and motions, by debris flow, were well demonstrated in the numerical simulation. Moreover, the driftwood partially reduced the drag force, and the shielding effect of the forest caused a delay in the runoff duration-time. The results of this study are expected to help establish measures to reduce debris disasters that can respond to the current situation, wherein debris damage is increasing, owing to the increased rainfall because of climate change. This subsequently increases the possibility of debris flows and the consequent damage. In particular, the predictive methodology of the refined model expands the understanding of numerical treatment for debris flow and driftwood, by reflecting the detailed physical regime.

1. Introduction

Unlike general landslides, debris flow has a high water content, including large particles such as rocks and small viscous particles, due to large floods and rainfall. In particular, debris flow is a fluid mixture rather than a rigid body. Moreover, when debris flow occurs on steep slopes, it behaves like a large specific-weight sediment–water mixture, rather than general fluid (water only). Thus, its momentum rapidly increases, causing significant damage to human lives and properties when impacting artificial structures.
Debris flow occurs frequently in mountainous areas with a small population; it is generally less common than floods or typhoon damage in densely populated urban areas [1]. However, owing to climate change, the local rainfall intensity has increased in summer. In particular, the localized heavy rain in 2022 caused rainfall of up to 141.5 mm/h in Seoul, South Korea [2]. Because of the increase in rainfall, the frequency of landslides has also been increasing. Notably, landslides can cause economic losses such as damage to artificial structures, roads, and burial of living things and structures, as well as human casualties. For example, in 2011, when debris flow occurred on Mt. Umyeon, (Seoul in South Korea), the number of deaths accounted for more than 75% of the total number of deaths (2011), due to steep-slope disasters [3].
Owing to entrainment erosion with respect to slope steepness and flow distance, the volume and momentum of debris flow may increase, and the damage area and size can rapidly expand. Therefore, for disaster prevention, debris-flow behavior should rapidly be predicted. Debris flow, including sediment–water mixture, is generally made of viscous-mixed fluids that behave as non-Newtonian fluids. Therefore, many studies have analyzed debris flow using a hydrodynamic model that includes viscosity [4,5,6]. In particular, among the behavioral analysis of non-Newtonian fluids, several simulation studies on debris flow using the Bingham model [7] have been reported.
Many numerical models of debris flow have also been developed [8,9,10,11]. Such models can be either one-dimensional, in which the flow movement in one spatial dimension is a cross-section of a single predefined width [12,13,14], or two-dimensional, in which the flow movement is in two spatial dimensions, and irregular topography is considered [15,16,17,18,19]. In addition, some of these models considered the erosion and deposition processes of sediments in the riverbeds [20,21,22,23]. Erosion and deposition are directly related to both the variation of debris-flow density and the temporal evolution of the channel bed [24]. Notably, flow is considered as a one-phase constant-density fluid [9,25,26,27,28] or a two-phase variable-density fluid, composed of granular material immersed in an interstitial fluid [8,20,21,22,24,29].
The one-phase-fluid approach is usually used to simulate muddy debris flow, whereas the two-phase-mixture approach simulates granular or Claypool debris flow [30,31]. The afore-discussed models considered debris flow as a mixture of sediment and water only.
Meanwhile, an understanding of driftwood behaviors is relevant because driftwood is routinely generated in large quantities in landslides and flows. As driftwood flows like a large piece of wood, unlike debris flow that has fluidity in volume, it can cause significant damage to artificial structures and residences when impacted. Specifically, it was observed in past studies that high-frequency impulsive loads were generated when large water-borne objects impacted simplified vertical structures and piers [32,33,34] and transportation infrastructure [35]. In addition, long-duration damming or jamming loads that are smaller in magnitude could nonetheless alter the flow around the structure and change the forces [36,37], as well as generate additional yaw and roll moments. This results in a concentration of the forces on particular structural components, consequently increasing the likelihood of damage [37].
Notably, it has been reported that, in the Mt. Umyeon debris that occurred in 2011, a large amount of driftwood and driven debris-flow caused significant damage to vehicles and residents (Figure 1). Moreover, in recent years, a considerable amount of driftwood has combined with debris flow, owing to heavy downpours over mountainous rivers, causing damage to properties and loss of lives in the lower reaches of these rivers [31].
As a method for examining driftwood motion, numerical analysis is an efficient approach, along with laboratory experiments. Various numerical analysis models have been developed to reproduce scenarios such as driftwood behavior in river channels and driftwood deposition in local facilities. In particular, two-dimensional (2D) hydrodynamic-flow models based on Eulerian and Lagrangian modeling have been proposed, to model 2D driftwood transport. Ruiz-Villanueva et al. [38] developed an Iber-Wood model that considers the balance of forces between water flow and large wood. This model was verified through laboratory experiments on driftwood by considering steady [38] and unsteady flows [39]. Kang et al. [40] performed numerical experiments to evaluate the model reproducibility of driftwood motions, using the model of a two-dimensional connected sphere, which simulates bed deformation by driftwood. Moreover, Kang et al. [41] conducted a flume experiment and numerical simulation to study driftwood collision on a moveable bed. Persi et al. [42] also performed a flume experiment and calibrated ORSA2D_WT, which calculates the multiple local forces from the four segments of a cylindrical wooden body, to simulate the wood motion. Such studies have analyzed driftwood based on a straight flume-channel and 2D wood motion, and have actively advanced the numerical modules for driftwood interactions, such as the movement of riverbeds with driftwood deposition, collisions between driftwood, and water-flow patterns created by the driftwood. Additionally, other promising methods have recently been proven efficient for simulating large-debris phenomena, such as the finite element method [37] and particle-based methods, including the discrete element [43] and smoothed particle hydrodynamics [32,33,35] methods. These methods can employ hydrodynamics to reproduce the debris flow.
Thus far, a few studies have considered the behavior of debris flow with driftwood in their numerical models. Numerical studies have computed the behavior of driftwood in the Lagrangian form, with clear water flow [38,39,40,41,42,43,44,45,46,47,48]. The characteristics of driftwood transported by clear water flow have also been investigated in fields and experiments [49,50,51,52,53]). However, the studies have not focused on computing the behavior of driftwood with debris flow or sediment–water-mixture flow.
To predict debris flows including sediment–water mixture and driftwood, field observation is an important prerequisite, and numerical simulations are required, dependent on various parameter combinations. Therefore, many research methodologies based on experiments and analytical and numerical models have been developed [8,54]). In particular, the entrainment process, as aforementioned, is an important factor in determining the magnitude and intensity of debris flows [17]. For example, entrained materials may accumulate 10–50 times their initial soil-water volume [30]. Several entrainment models for debris-flow simulations have been proposed in the past, most of which are process-based entrainment-rate approaches [9,55,56,57,58,59]. Furthermore, an increase in the uncertainty of rainfall prediction, (e.g., localized torrential rainfall) due to climate change, increases the possibility of the occurrence of debris flow. More in-depth studies that reflect the transport and diffusion of viscous fluids and the entrainment erosion of debris flow are needed. Therefore, a numerical model that can perform predictive simulations for driftwood and debris flow should be developed.
This study presents a 2D numerical model developed for computing the characteristics of debris flow, together with driftwood dynamics. It simulates the initiation, transportation, and deposition stages of debris flow by the coupling of the Eulerian and Lagrangian expressions for the debris flow and driftwood, respectively. The expressions are based on the Nays2D Flood Solver [60] of the iRIC platform [61] and the driftwood-dynamics model [40,41]. The developed model neglects the motion owing to driftwood–driftwood and driftwood–tree collisions; however, driftwood-structure collisions are included. Herein, the simulation of the present study shows the restricted interactions between driftwood–tree and driftwood–driftwood because of drag force. The numerical model is based on methods employed in previous studies [40,41]. The numerical reproducibility of simulating the debris-flow characteristics, entrainment erosion, and driftwood behaviors is verified, and the risk of debris flow is estimated by calculating the impulse stress.
In particular, this study presents a more numerically refined treatment for modeling driftwood generation (which includes the generation of driftwood from the forest by considering the flow dynamics and mechanical behavior of wood), than previous studies on debris flow. Consequently, this numerical treatment can extend the understanding of the predictive methodology of debris disasters in more depth.

2. Materials and Methods

2.1. Study Area

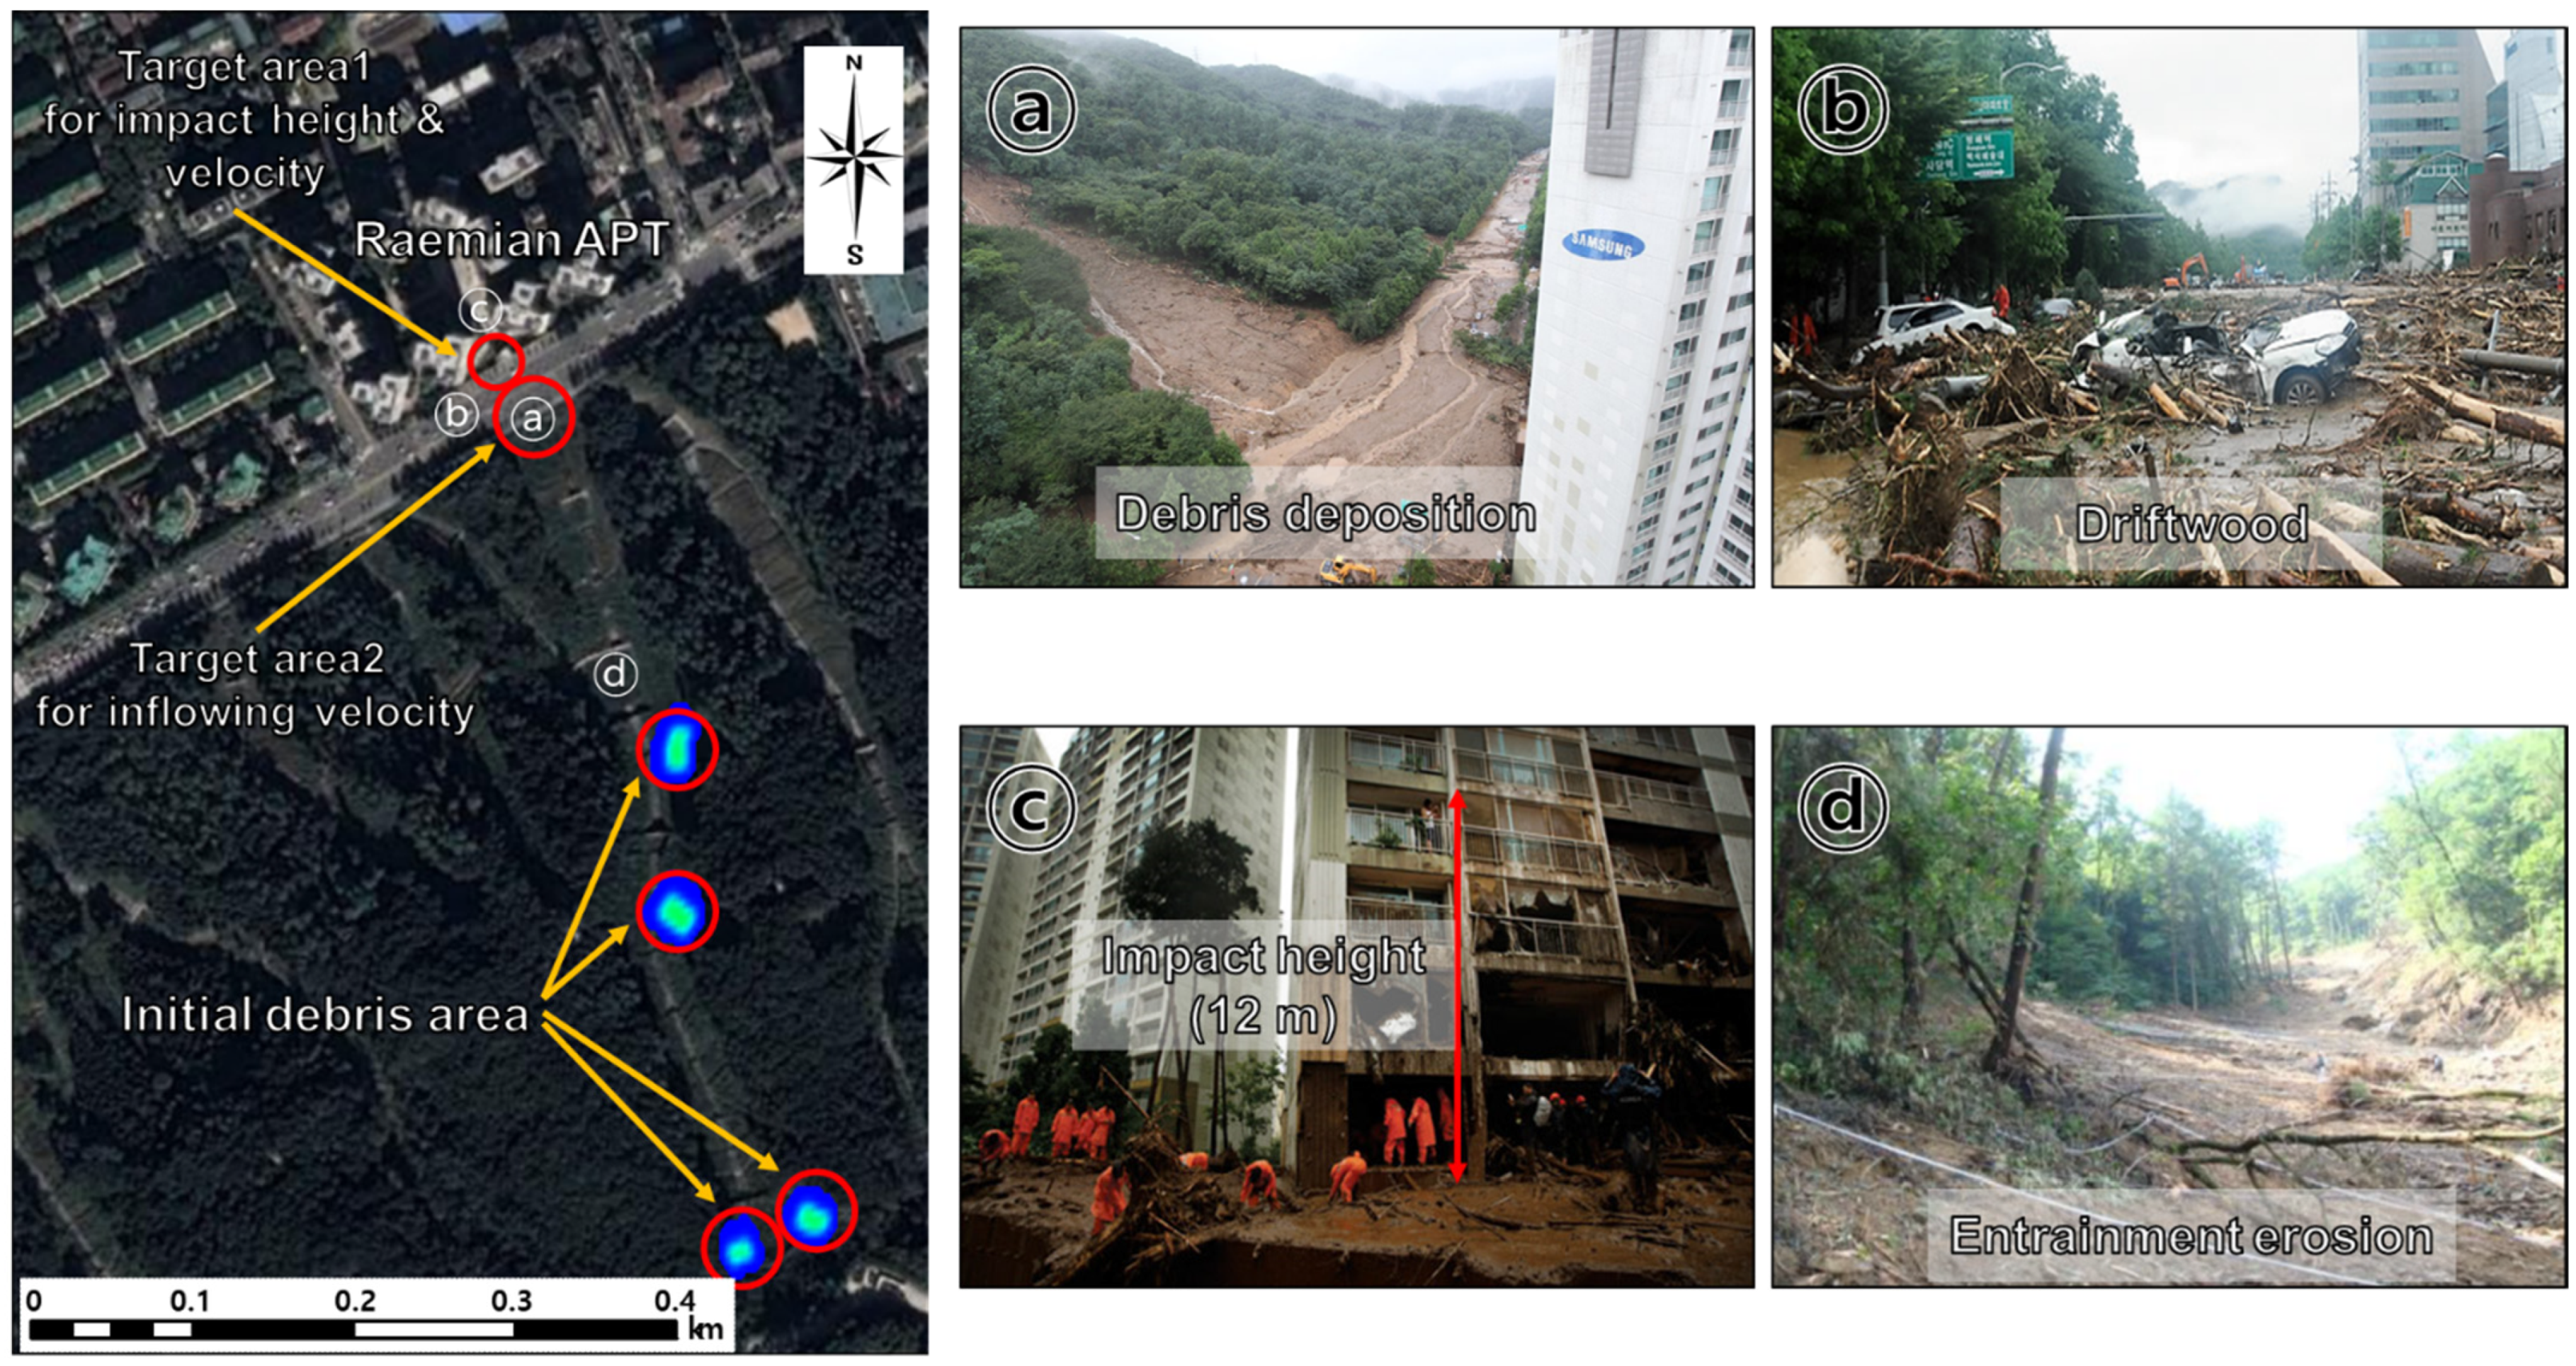
The study area in this work is shown in Figure 1 for the simulation of the Raemian apartment (APT) basin, located on the north side of Mt. Umyeon, Seoul, in South Korea. The initial volume of the debris flow in the Raemian APT upper basin has been estimated to be 3000 to 8000 m3 [15,19,62]; however, the exact data of the initial debris flow at the trigger time are still unknown. Therefore, in this study, we assumed that the initial volume of the debris flow was 4250 m3, in line with the literature [15,22,62], which indicated that 10 times the volume (42,500 m3) of the final debris-flow was generated from the initial debris-flow. We also set four initial points on the upper basin of the Raemian APT, as shown in Figure 1. However, if the characteristics of the initial debris-area were changed in the simulation, the final debris-volume by entrainment erosion would consequently be changed. Nevertheless, we believe that the study of such estimations should be addressed in future work because, in the present study, we focused on numerical methods and reproducibility. Thus, a technique for the detailed estimation of initial debris-characteristics was neglected in the present study.
Figure 1. Study area and disaster situation of debris flow. (a) Debris-flow deposition [63], (b) driftwood deposition [63], (c) impact height [64], and (d) entrainment erosion [62].
Water 14 03673 g001
Meanwhile, the field surveys, (e.g., [62]), reported that the Raemian APT suffered direct damage from landslides up to the fourth floor (approximately 12 m) (Figure 1). In addition, the maximum velocity of the debris flow analyzed from the black box of a nearby car and the closed-circuit television data at the time of the occurrence is estimated to be approximately 28 m/s. This is because the flow velocity is relatively higher than that of debris flows generated in other regions in the past, owing to the lower concentration of sediment–water mixture [15,19]. Moreover, local intense rainfall (>80 mm/h) caused by climate change accelerated the velocity of debris flow.

2.2. Computational Model

In this section, the characteristics and primary governing equations of the Nays2DFlood model are described, based on the debris-flow model presented by Takahashi [29] and Shrestha et al. [31].
The governing equations are continuity and momentum equations, which are generally used. For more information on the governing equations of the flow, the iRIC website (http://i-ric.org/en, accessed on 17 October 2022), a numerical analysis platform, can be considered. In addition, the description of the driftwood-dynamics model combined with the flow model can be obtained from studies of Kang and Kimura [65] and Kang et al. [40,41].

2.2.1. Debris-Flow Model

This model can reproduce the characteristics of debris flow in a shear stress calculation by considering the viscous fluid of the debris flow. In addition, bed erosion and sediment entrainment are calculated accordingly.
This model is based on the 2D shallow-water equation, which is a depth-averaged integration model. Accordingly, the water level is calculated considering the depth-averaged flow velocity. Herein, the bed friction is calculated using the implicit method based on Manning’s formula and the shear stress of the debris flow, in terms of time integration.
This model considers a system in which Cartesian coordinates are converted into generalized curvilinear coordinates, depending on the streamlined or longitudinal direction of the calculation domain. If topographic data are considered as orthogonal coordinate systems, a calculation error may occur in the flow velocity vector because of an orthogonal mismatch with the real boundary in the boundary region of the orthogonal coordinate system when calculating the flow vector. Conversely, to construct a generalized curvilinear coordinate system, a more complex formula is required for coordinate transformation than a Cartesian coordinate system, thereby increasing the amount of calculation [66]. Meanwhile, the conversion of the Cartesian coordinate is notably simple, and has the advantage of excellent scalability, such as advancing to a sub-grid, which is an adaptive grid.
In this study, considering that the formulaic expression of the generalized curvilinear coordinate system is significantly complicated, for readability the continuity and momentum equations considering the Cartesian coordinate system are described as follows:
Continuity equation:
h t + h u x + h v y = i b
h t + C h u   x + C h v y = i b C *
z b t = i b
Momentum equation:
u h t + β h u 2 x + β h u v y = h g H x τ b x ρ t + D x
v h t + β h u v x + β h v 2 y = h g H y τ b y ρ t + D y
where i b is the entrainment velocity of the bed, x and y are components of the Cartesian coordinate, t is the time, u and v are the components of the depth-averaged flow velocities in the x and y directions of the Cartesian coordinate, respectively, g is gravitational acceleration (9.81 m/s2), H is water-surface elevation, h is water depth, D x and D y are turbulence terms in the Cartesian coordinate, and ρ t is the mixed density. In this study, ρ t = σ C + 1 C , β is the momentum ratio of the debris flow (1.25) [20], σ is the density of the sediment, ρ is the density of water, C is the concentration of the mixed sediment of the debris flow, and C * is the maximum concentration of the mixed sediment of the debris flow.
Herein, D x   and   D y in Equations (4) and (5) are expressed as follows:
D x = x v t u h x + y v t u h y
D y = x v t v h x + y v t v h y
where v t is the eddy viscosity.

2.2.2. Bottom Shear-Stress of Debris Flow

This model calculates three types of shear stresses, according to the concentration of the sediment–water mixture. Based on the change in the sediment–water mixture concentration of the debris flow, this model can reproduce stony, tractive, and turbulence flows. The bottom shear-stress of the debris flow was applied according to the methods proposed by Takahashi [29] and Shrestha et al. [31]. The bottom shear-stress terms τ b x and τ b y of the debris flow in Equations (4) and (5) can be obtained. For example, if C > 0.4 C * , a stony-type debris flow is reproduced, the shear stresses are calculated as follows:
τ b x = u u 2 + v 2 τ y x + ρ 1 8 σ ρ C * C 1 3 1 2 d m h 2 u u 2 + v 2
τ b y = v u 2 + v 2 τ y y + ρ 1 8 σ ρ C * C 1 3 1 2 d m h 2 v u 2 + v 2
where d m is the mean diameter of the sediment–water mixture of the debris flow. τ y x and τ y y are the yield stresses in the x and y directions, which are expressed using constitutive equations (refer to [31]) as follows:
τ y x = f C σ ρ C g h cos θ x tan
τ y y = f C σ ρ C g h cos θ y tan
where θ x and θ y are the local slopes of the bed in the x and y directions, respectively, and ϕ is the angle of repose on collapse. f C is expressed as follows:
f C = C C 3 C * C 3 ,           C > C 3     0 ,                     C C 3
where C 3 is the limitative concentration of the sediment–water mixture. When 0.02 C 0.4 C * , the bottom shear-stress that is the same as the shallow water flow is as follows:
τ b x = ρ g n 2 u u 2 + v 2 h 1 3
τ b y = ρ g n 2 v u 2 + v 2 h 1 3
where n is the Manning roughness coefficient. When C   < 0.02, the bottom shear-stress is expressed as follows:
τ b x = ρ t 0.49 d m h 2 u u 2 + v 2
τ b y = ρ t 0.49 d m h 2 v u 2 + v 2

2.2.3. Entrainment Erosion

Several studies have described erosion using the entrainment phenomena of debris flow, which is significantly important for understanding the physical mechanism of debris flow [18,19]. The numerical process of including erosion by using an entrainment simulation is characterized by two methods. The first method considers that erosion by entrainment is accompanied by a constant rate. The second method considers that erosion by entrainment is dependent on the momentum of the debris flow [19]. In this study, we employed the second method. The erosion- and deposition-velocity equations for the 2D debris-flow model proposed by Takahashi et al. [20] can be expressed. For example, if C > C , deposition occurs and is expressed as follows:
i b = δ d C C C * u 2 + v 2 h d m
for C C , bottom shear-stress occurs and is expressed as follows:
i b = δ e C C C * C u 2 + v 2 h d m
where δ d (0.01) and δ e (0.001) represent the empirical coefficients of deposition and erosion, respectively. C is the equilibrium concentration of the local sediment–water mixture, which better determines the erosion and deposition than the current concentration of the sediment–water mixture. When the water-surface slope ( θ w ) exceeds 0.138, it is expressed as a stony debris-flow as follows:
C = tan θ w σ ρ 1 tan tan θ w
When θ w ranges from 0.03 to 0.138, it becomes a tractive debris-flow, and is expressed as follows:
C = 6.7 tan θ w σ ρ 1 tan tan θ w 2
When it is less than 0.03, it becomes a turbulent debris-flow, and is expressed as follows:
C = ( 1 + 5 tan θ w ) tan θ w σ ρ 1 1 α 2 τ c τ * 1 α 2 τ c τ *
α 2 = 2 0.425 σ ρ tan θ w / σ ρ 1 1 σ ρ tan θ w / σ ρ 1
τ * c = 0.04 × 10 1.72 tan θ w
τ * = h tan θ w σ ρ 1 d m
where τ c is the dimensionless critical-shear-stress of the viscous fluid in the debris flow, and τ * is the dimensionless shear-stress of the viscous fluid in the debris flow.

2.3. Driftwood Generation Model

For 3D-structured transient-flow of clear water around buildings, the distribution of the horizontal pressures either increases linearly (close to hydrostatic) or has a more complex trapezoidal distribution [67]. Furthermore, water-borne (clear water) large objects (such as driftwood) introduce additional high magnitude short-duration impulsive forces [32,33,34], which can be up to 6–10 times larger than the drag forces [33]. Moreover, damming around the trees also affects the forces and moments on the structure or tree [37]. Extensive studies on debris-damming flows and river engineering have been conducted, but few studies have focused on driftwood generation. In this work, we developed a driftwood-generation model to trigger the generation of driftwood from initially planted trees, and investigate the effect on the forest. The proposed driftwood-generation model considers the drag force in 2D depth-averaged flow, for simplicity.
Overall, the types of driftwood generations are classified into deformation (bending or overturning), breaking (rupturing), and uprooting (by bed change), as illustrated in Figure 2. Herein, we consider two types of numerical wood treatments in terms of driftwood generation: an overturned tree (by deformation) and completely ruptured wood (by breaking). As the overturned tree is spatially fixed wood, it affects the water flow through a larger projection area, inducing a larger drag force than those of normal cantilever trees. If the drag force acts on a tree, the normal cantilever tree is completely ruptured, and changed into driftwood. Herein, the uprooting process is also an important mechanism of driftwood generation. However, it is neglected, because the mechanism is related to bed change and root size, which are different from overturning and rupturing.
Herein, we assumed that the driftwood was generated by the strong drag force of the flow, which acted on the woody stems with a larger force than the critical bending stress ( σ a l l o w , critical bending stress).
Moreover, the values of the critical bending stresses of deformation and breaking in the forest were assumed as 8 and 45 MPa, respectively [68]. The wood was assumed to be a cantilever beam, when under bending stress (Figure 2). Moreover, the end of the cantilever beam was attached to the ground surface, and a uniform load under a drag force due to the flow direction generated a moment on the cantilever beam (stem of wood), in line with the following equation:
M w = F d r a g min h d ,   h w / 2
where M w denotes the moment acting on the stem of the wood body, F d r a g represents the uniformly distributed drag force acting on the stem of the wood body, based on the static pressure assumption, h d represents the length of the wood stem, and h w denotes the water depth acting on the wood body. Moreover, a uniformly distributed drag force acted on the flow direction, and the acting point of the moment-arm length was at half the water depth from the boundary between the ground and stem.
The drag force acting on the wood of the cantilever beam can be expressed as
F d r a g = ρ C d w V 2 A d w 2  
where C d w denotes the drag force coefficient and A d w represents the projected submerged area impacted by the drag force of the water flow. Herein, note that the present model is a 2-dimensional plane model, so we considered uniform load by drag force due to the 2-dimensional depth-averaged flow velocity.
In material mechanics, the bending of wood stems is determined by the section modulus ( S w ) as
S w = M w σ a l l o w = F d r a g min h d ,   h w 2 σ a l l o w
Based on material mechanics, the cylindrical shape of the critical section modulus ( S m a x ) can be expressed as follows:
S m a x = π d 3 32
Thus, driftwood generation can be determined using wood and water-flow parameters such as the diameter of the wood stem, allowable bending stress of the wood stem, and drag force acting on the wood stem. As such, S m a x less than S w signifies the bending of the stem of the planted-tree body. Thus, we presumed that such planted trees were transformed into driftwood at this instant. However, if the moment of the drag force acting on a tree is 8 MPa < M w < 45 MPa (between deformation and rupturing), the tree changes into a visibly overturned tree, with the stem length, not the diameter, in the simulation results.

2.4. Calculation Procedure

As the bottom shear-stress is determined passively, according to the flow velocity vector, it can accurately be calculated via simulation, using a sufficiently small-time interval or a calculation using an implicit method. In this model, for the stable and accurate calculation of debris flow, the accuracies of advection and diffusion are secured by using a method which elucidates spatial changes in the transport diffusion equation, and an implicit method (the CG method: conjugate gradient method in this model) for the integration of the time changes in the water level and flow velocity, which is accordingly termed a semi-implicit method.
Thus, in this model, numerical simulation can be performed stably, even at a large time-step (generally 0.6 < CFL < 2), through a semitone method, and the accuracy of the simulation results is secured. In addition, the numerical simulation is performed by considering the calculation time and stability simultaneously, by applying a module in which the time interval is changed during the numerical analysis, following the Courant–Friedrichs–Lewy (CFL) condition, in this model.
Figure 3 shows the developed debris-flow-calculation algorithm. This model calculates the water level and flow velocity by implicitly calculating the bottom shear-stress for the debris flow. Then, it calculates the advection and diffusion, and subsequently the entrainment erosion when the water-level-update amount for repeated calculation is smaller than the error tolerance for updating the time.

2.5. Computational Conditions

Table 1 shows the computational conditions of the simulation. In the case of the Mt. Umyeon topographic data, a 1 × 1 m2 digital elevation map (DEM) is used for the computational domain by preprocessing with a digital topographic map of Mt. Umyeon (1:5000, NGII [69]).
Considering the area where the debris flow occurred, the computational domain size was 0.6 (width) × 0.8 (length) km2. Herein, obstacles were processed on the computational grid, based on the numerical topographical map for urban buildings.
The uniform grid size was set to 3 × 3 m2. We selected the 3 m2 grid size by trial and error of various grid sizes. From the observation data that were captured by CCTV, the inundated depth near the structure was 12 m, and the flow velocity was 28 m/s. In particular, the inundated depth of 12 m is significantly clear among the observations (as shown in Figure 1). Based on these data, we ran the simulation with various grid sizes (ranging from 1.5 to 6 m2). Although the obstacle shapes of building structures were reproduced well for all grid sizes, the inundated depth was considerably lower (less than 7 m) when the grid size was smaller than 3 m2. This is because the grid size induced different flow paths from the observation data [62]. When the grid size was larger than 3 m2, the inundation depth was less than 8 m. In particular, owing to the low resolution of the grid, the obstacle shape was indicated differently from the building structure in the study area, causing different flow vector patterns. Thus, we employed the 3 m2 grid size, and accordingly, the shape of buildings in urban areas was able to be sufficiently reflected in the computational domain. Furthermore, the maximum flooding-height near the Raemian APT could be reproduced in the simulation. As the maximum erosion-depth of the debris flow was observed to be 3 m, this was also applied to the numerical simulation [55].
The Manning roughness coefficient was uniform at 0.04 (s/m1/3) in the computational domain, as proposed by Kim et al. [15]. This value is validated in official reports verified by several research institutes, such as the ministry offices and national institutes of Korea [62], which conducted studies on Mt. Umyeon.
The density of the water was set to 1000 kg/m3, and the density of the sediment in the debris flow was 2000 kg/m3 [15,62]. The size of the driftwood was the length, diameter, and density of trees in the forest, as shown in Table 1, in line with the report on the additional supplementary investigation of the causes of the Umyeon Mt. landslide [62].
The static, kinematic, and rolling friction coefficients between wood and bed were assumed to be 0.7, 0.4, and 0.2, respectively, through previous numerical simulation-studies [40,41] using trial and error.
The area of the distribution of the planted trees is as shown in Figure 1, taking into account the pathway of the debris-flow area. Here, the spatial tree-density constituting the initially placed forest is 0.06 m−2 as measured in the report [62].
The generation of driftwood occurs from the vertical cantilever-beam fixed to the ground, and is assumed to occur when the wood is subjected to a force exceeding the critical bending stress (8 (deformation) and 45 (breaking) MPa [67]) by the debris flow.
The average particle diameter of the sediment for the debris flow was selected using sensitivity analysis, to reflect the various sediment diameters of the debris-flow mixture. Therefore, in this study, sensitivity analysis was conducted to determine the mean sediment diameter of the debris flow (Runs1–3). Then, verification and prediction were conducted, based on the selected Run2 (Table 2), through reproducibility analysis. Herein, we simulated the driftwood case (Run4) with an increase in forest density (Run5) and wood diameter (Run6), to predict the effect of a change in forest characteristics on the debris flow. In addition, to compare the changes in the debris flow with/without entrainment erosion, we additionally simulated no-entrainment erosion without driftwood (Run7). Notably, as the cases with a decrease in forest density and wood diameter were the same as those without driftwood (Run2), they were omitted.

3. Results

3.1. Model Reproducibility

Table 3 presents the final simulation result on the inflowing velocity, height, and final debris volume. As mentioned before, the observed velocity, flooded depth, and final debris volume were 28 m/s, 12 m, and 42,500 m3, respectively. The debris flow damaged the Raemian APT up to the fourth floor (12 m). Therefore, we employed this value to verify the maximum flooded height. In addition, the debris volume of Table 3 includes the driftwood volume for driftwood in forest and urban areas.
Table 4 shows the simulation reproducibility according to the final simulation result of Table 3. Herein, the reproducibility is evaluated, and compared with the accuracy of the simulations as follows:
R = 1 S O O
where R is the absolute accuracy, S is the simulation value, and O is the observation value. Notably, we first simulated Runs1–3 and subsequently compared their reproducibility, as shown in Table 4. Herein, Run2 shows the largest reproducibility (0.84), and consequently, the additional simulations (Run4–6) were implemented based on Run2.
From a viewpoint of the final simulation results (Table 3), the results of all the simulations except for Runs1 and 7 show similar values for the observation data. In the case of the inflowing velocity, Runs1–6 indicate the range between 16.5 (Run1) and 22.1 m/s (Run3). The inflowing height shows a range between 5.3 (Run1) and 12.9 m (Run2). The largest debris volume is 43,892 m3 in Run1.
In the case of Run7, the inflowing velocity and height are 14.3 m/s and 0.8 m, respectively. In addition, the final debris volume is 4775 m3, which is similar to the initial debris volume (4250 m3). In all the simulation cases, the inflowing velocity is less than the observed velocity. Moreover, both velocities differ partially at 12 m of height. The debris volume of all the simulations is also smaller than the observation data, except for Run1 (43,892 m3).
In terms of the driftwood effect, as shown in Table 3, the debris volumes of Runs4 and 5 are 32,843 and 38,775 m3, and the driftwood volumes are 802 and 3814 m3, respectively. Accordingly, the proportions of the driftwood volume to the debris flow in Runs4 and 5 are 2 and 10%, respectively, as the forest density of Run5 is 5 times larger than that of Run4. As the wood diameter of Run6 is 5 times larger than that of Run4, no driftwood is generated, owing to an increase in the critical modulus, due to the larger diameter. All the simulation cases with driftwood (Run4–6) exhibited smaller impact heights than that of Run2. Compared with Run2, Runs4–5 do not indicate significant tendencies in the inflowing velocity and the debris volume, except for the impact height.
As for the reproducibility of all the simulations (Table 4), the range of the velocity accuracy is 0.51 (Run7)–0.79 (Run3), and in the case of the flooded height, that range is 0.08 (Run7)–0.99 (Run4). The accuracy of the final debris volume ranges from 0.11(Run7) to 0.97(Run1). Therefore, Run2 shows the largest mean value (0.84) and Run4 the second-largest value (0.83) However, the difference is negligible (0.01).
Run7 indicates the smallest value (0.23), as the simulation neglects the entrainment erosion and driftwood effects. On the contrary, the mean values in Runs1–6 exceed 0.67. This implies that the developed model with appropriate conditioning reasonably reproduces the debris flow, together with the driftwood. Accordingly, the predicted cases of Runs4–6 can be reasonably analyzed for the effects of entrainment erosion, together with the driftwood.

3.2. Time Changes in Simulation Results

The model reproducibility was in good agreement at Run2 (without driftwood) and Run4 (with driftwood). Herein, we analyzed the flow patterns of the simulations with/without driftwood, based on Runs2 and 4. In addition, we analyzed the flow patterns of Run7, to compare the entrainment erosion.
Figure 4 shows the time change in the depth of the debris flow behavior of Run2, which exhibits the highest accuracy. At 0 s, debris flow occurs in four places, at the beginning and in the course of the flow (Figure 4a). At 40 s, the debris flows into the Raemian APT (Figure 4b), and at 80 s, the Raemian APT is impacted by the debris flow, and flooding occurs (Figure 4c). At 120 s, the debris flow spreads into the urban area, and the flooded area is expanded (Figure 4d).
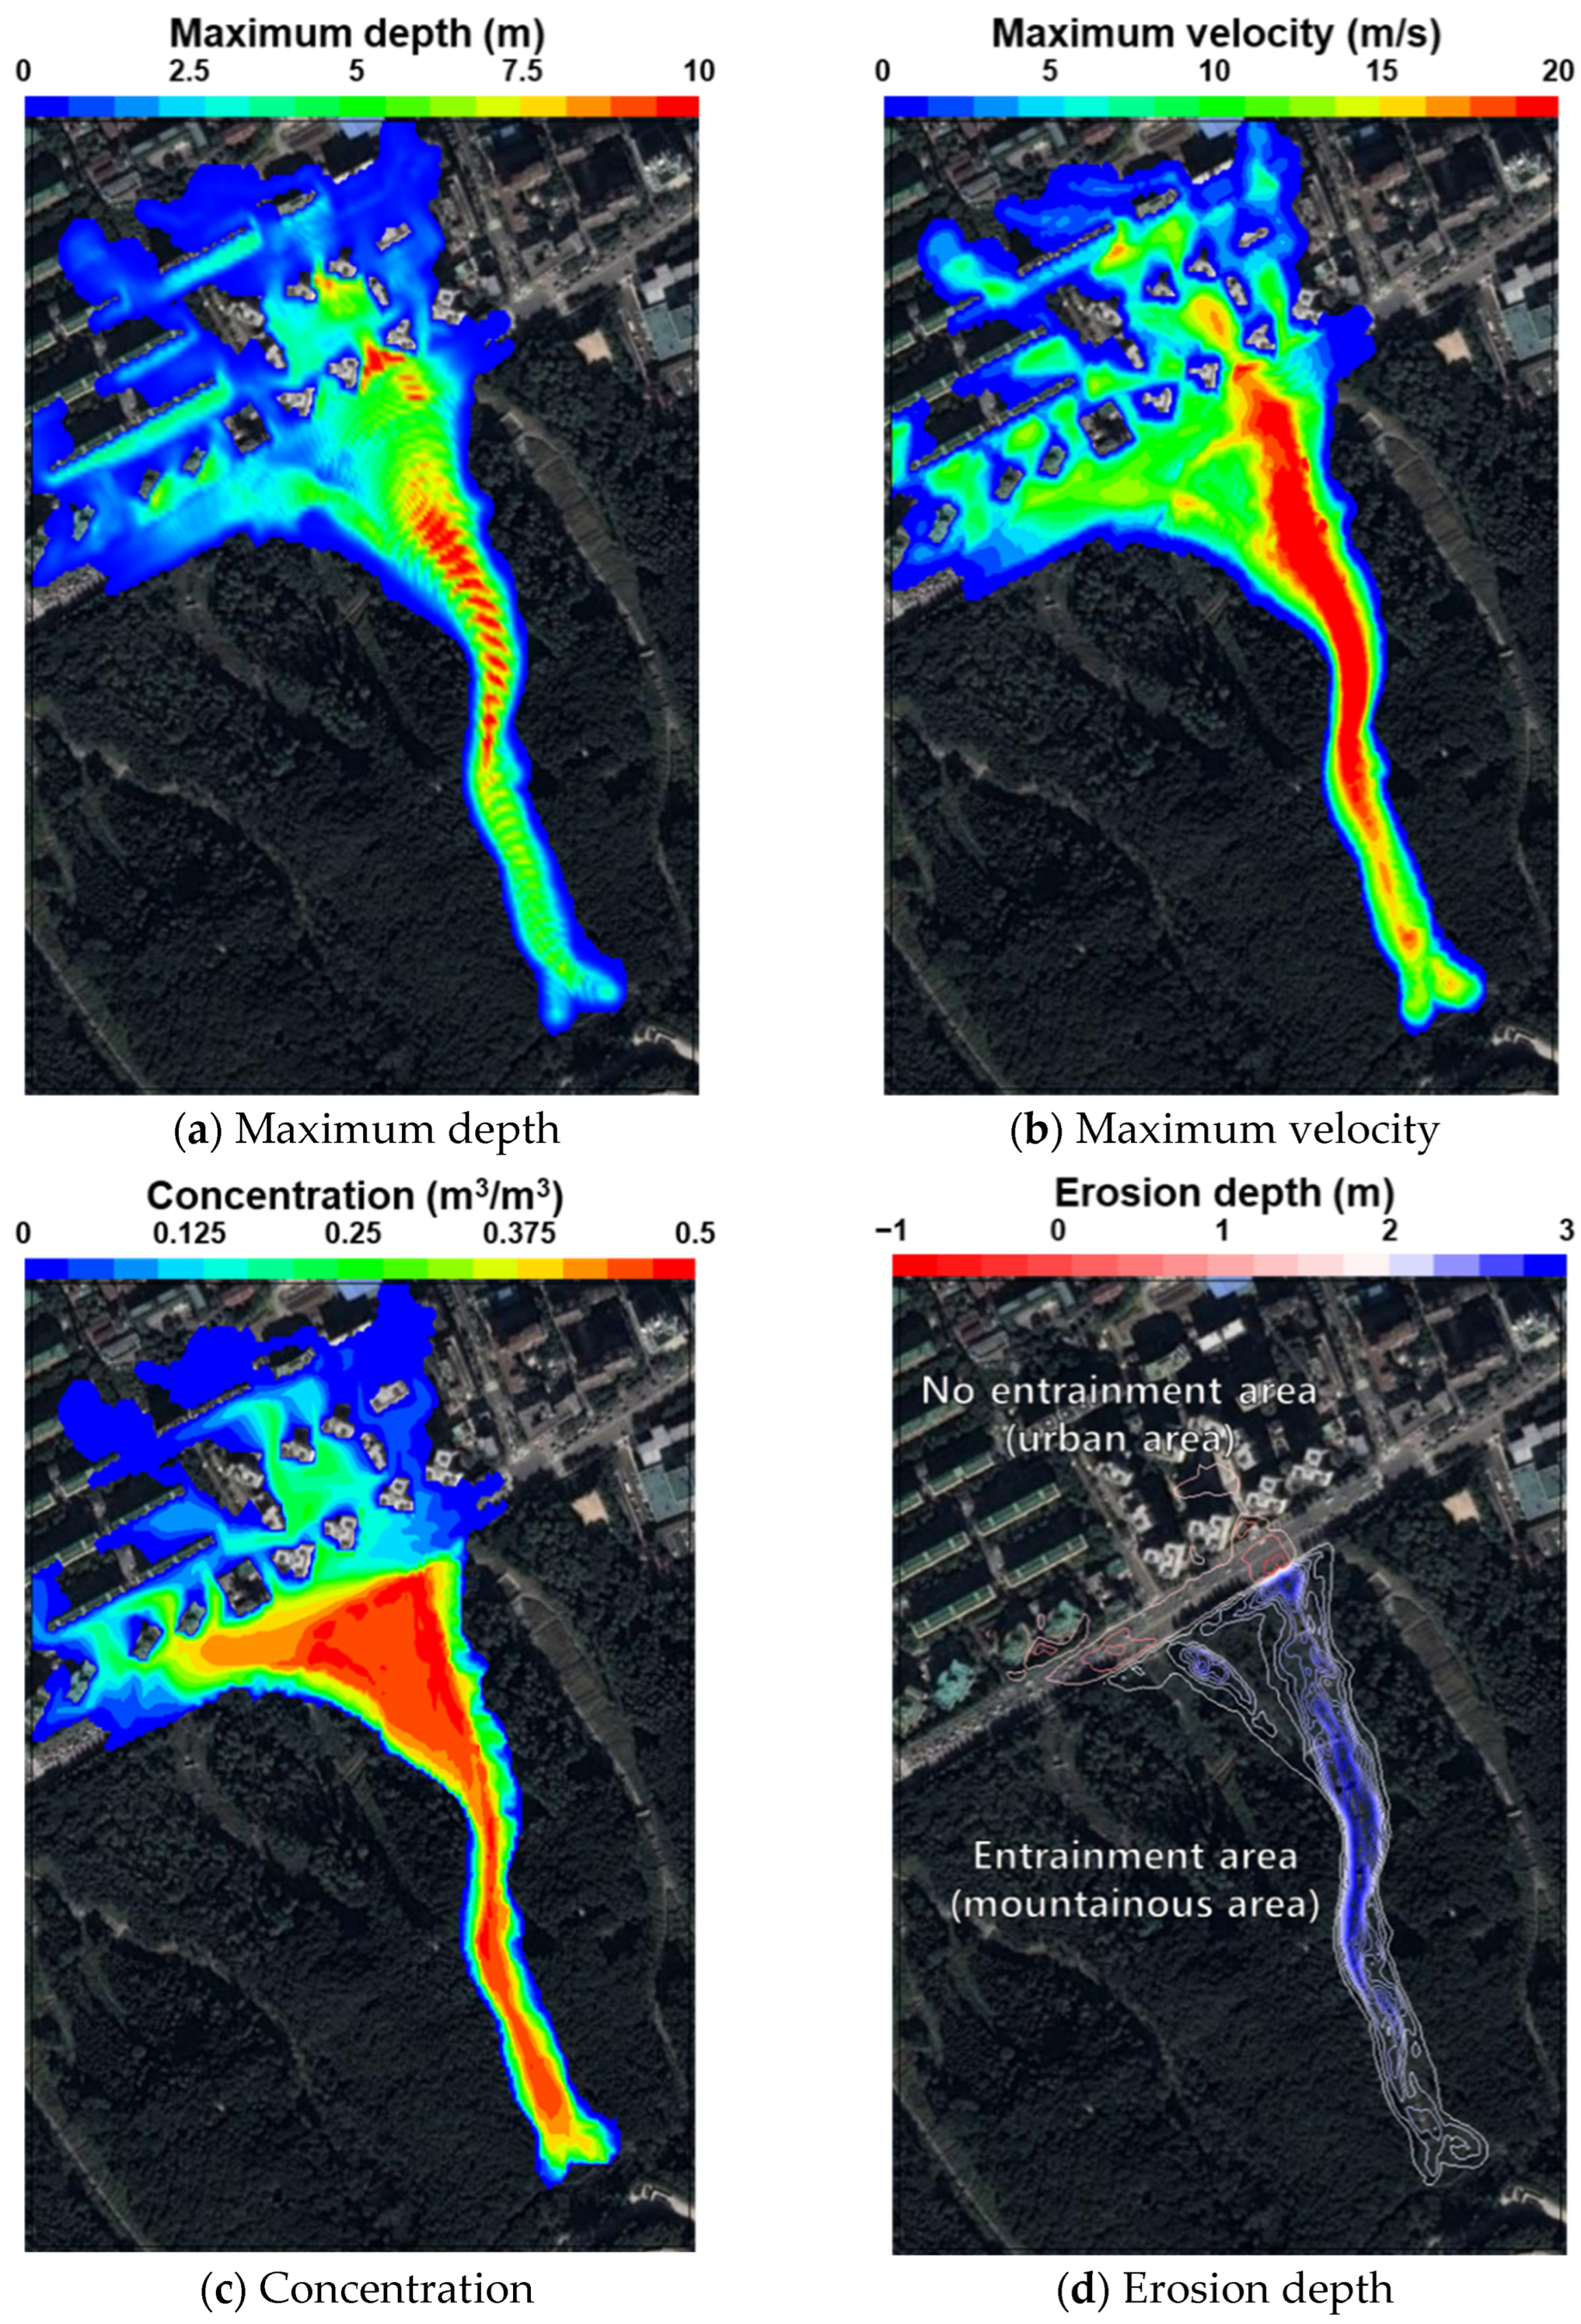
Figure 5 shows the final result (120 s) of the debris flow in Run2. The maximum flooded height is large (approximately 12 m) just before the inflow to the Raemian APT, and the flooded height is also high (approximately 12 m) in the impact area of the Raemian APT (target area 1) (Figure 5a). The maximum flow velocity is large (approximately 28 m/s) in the mountainous area just before the inflow to the Raemian APT (Figure 5b), and the final concentration of the sediment–water mixture is within the range 0.4–0.5 in the mountainous area, and 0.375 or less in the urban area (Figure 5c). The entrainment erosion depth is more than 3 m in the mountainous area where the maximum flow velocity occurred, and the maximum deposition is 0.9 m in the urban area (Figure 5d). In the numerical simulation, the urban area was set as the no-entrainment area, because it was paved hard ground of impervious material.
Figure 6 illustrates the time change in the debris flow with driftwood (Run4). At 0 s, trees are formed (red dots) in the mountainous area as cantilever beams, and herein, the stem direction of the trees is the gravitational direction (Figure 6a). At 40 s, the trees are swept away by the debris flow. The yellow bar represents trees that have become driftwood (Figure 6b). At 80 s, the debris flow floods into the surroundings after the impact on the Raemian APT. After the impact, driftwood is deposited around the Raemian APT and nearby roads (Figure 6c). At 120 s, driftwood and debris flow expand into the flooded area. However, some driftwood cannot flow, due to the partially weak drag-force of the debris flow, and remains in the mountainous area (Figure 6d).

3.3. Final Patterns of Entrainment Erosion

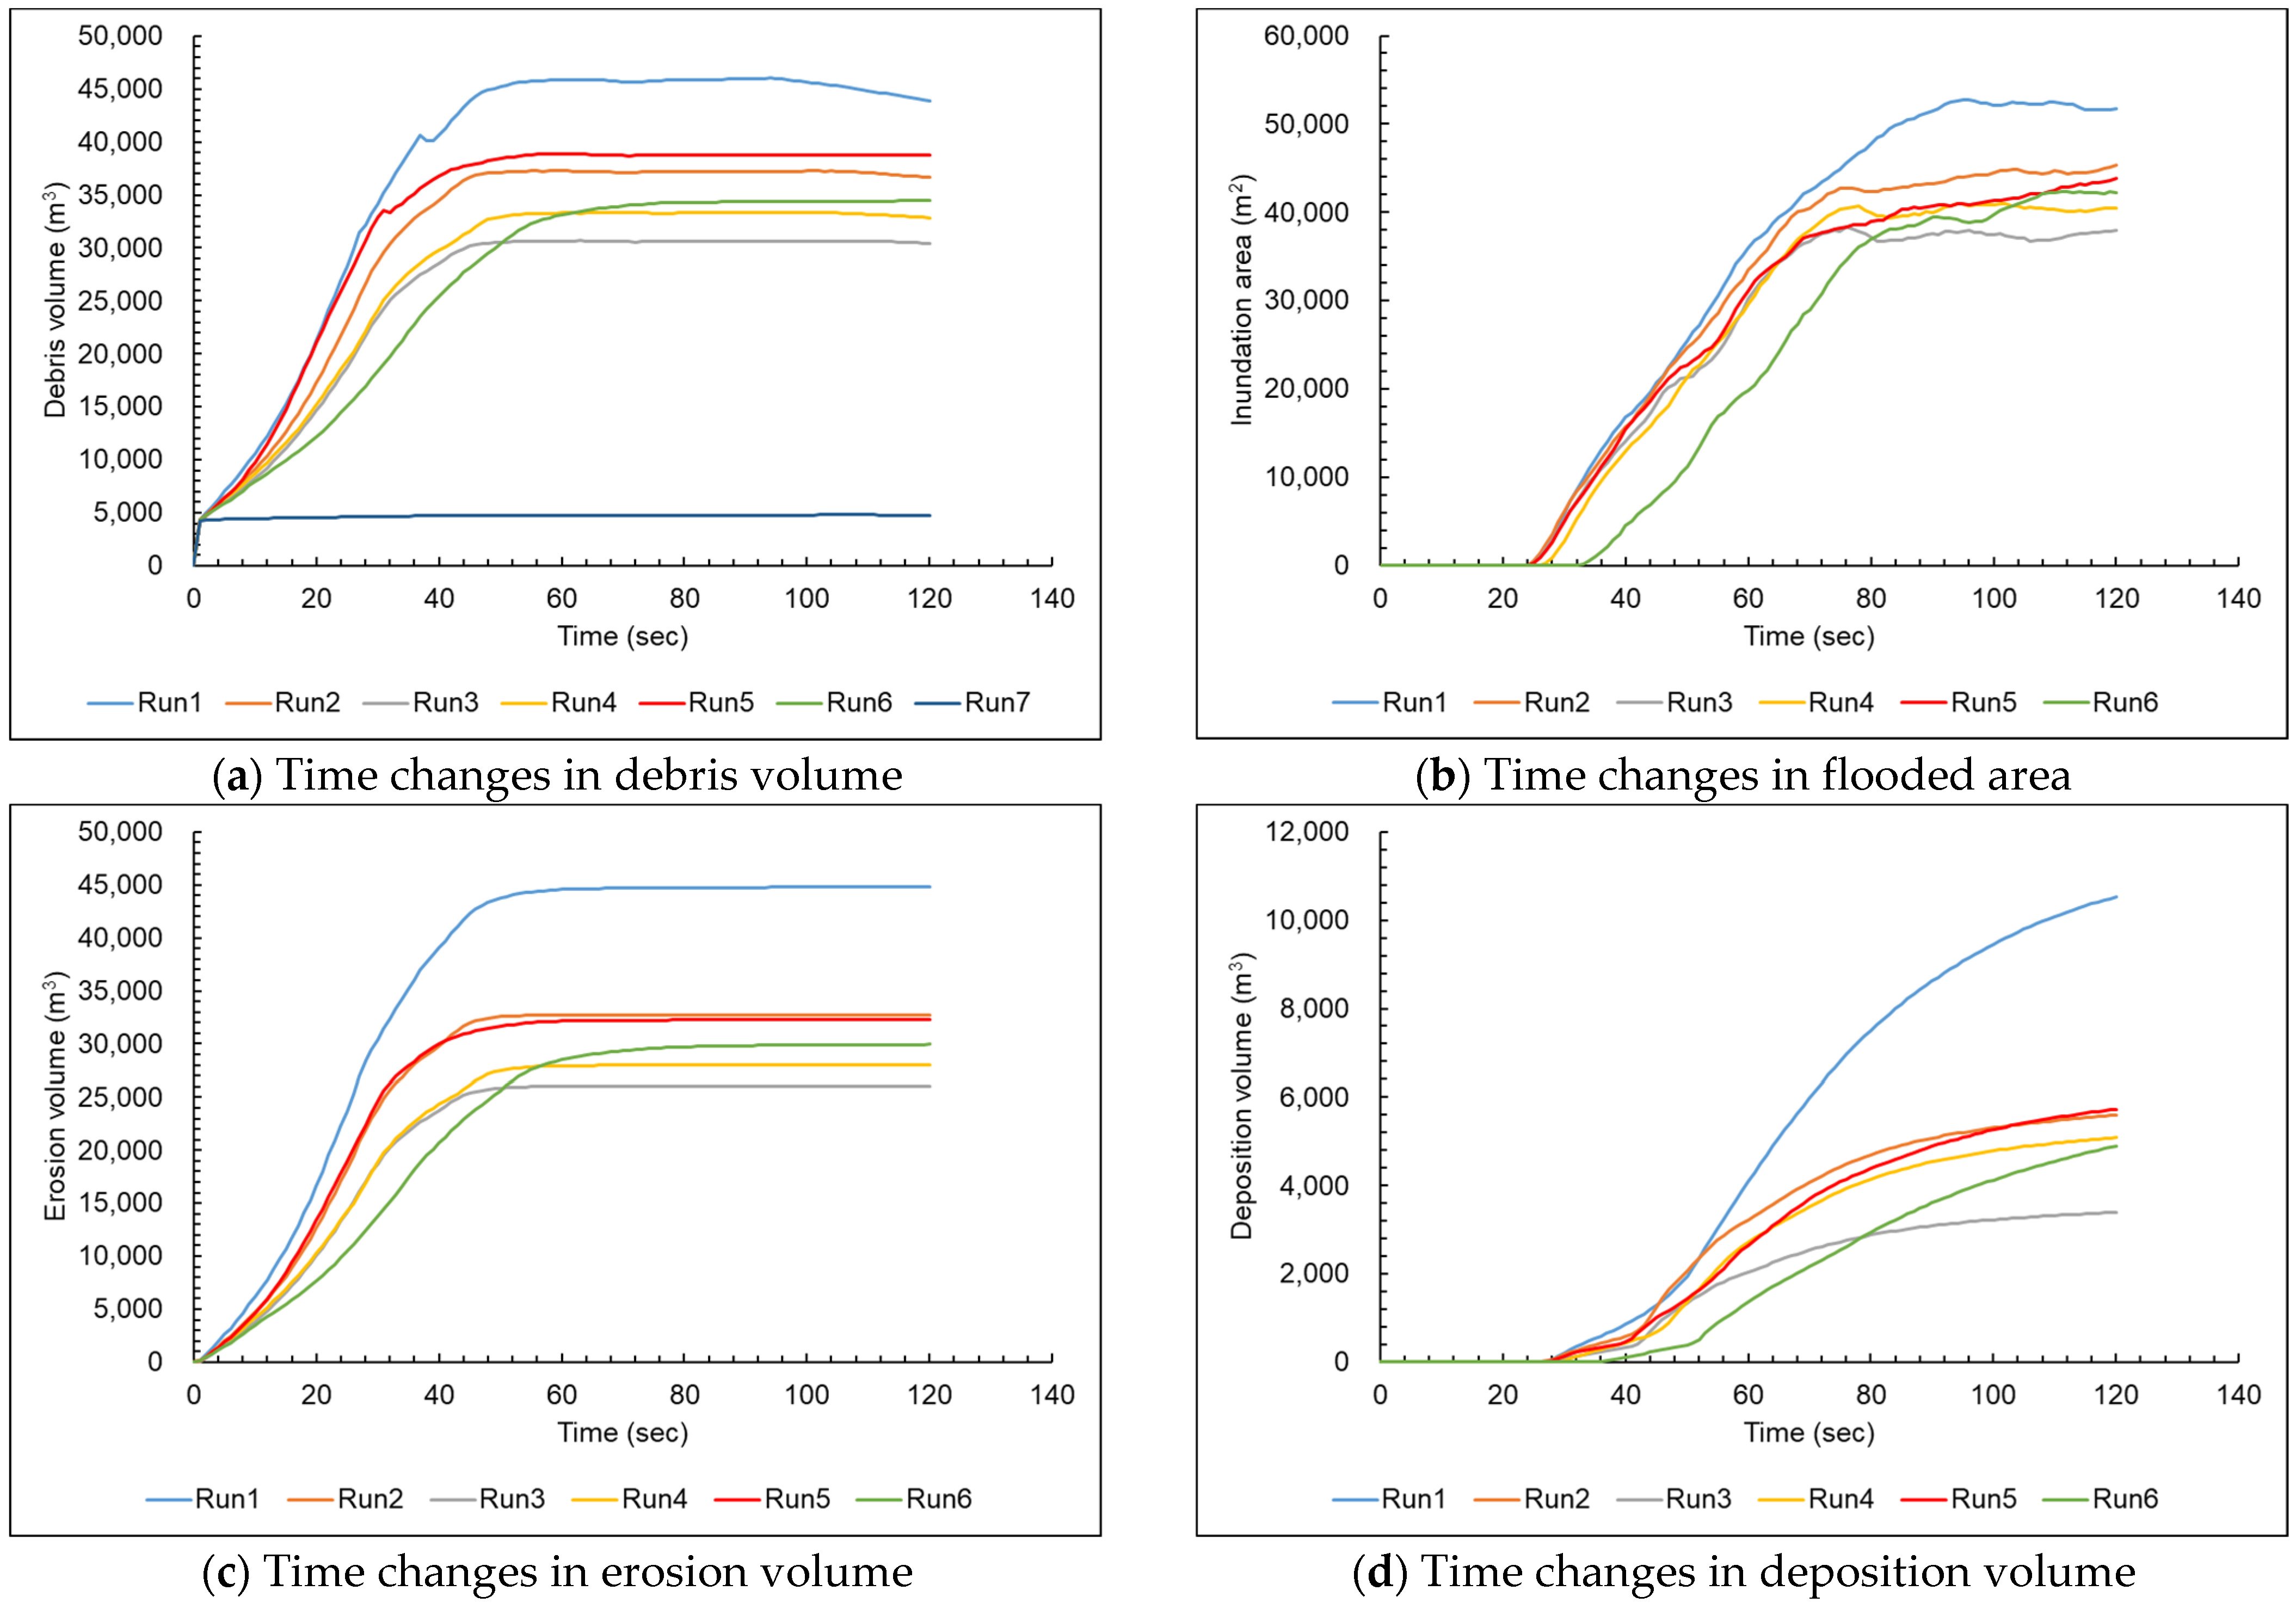
To quantitatively compare the entrainment, Figure 7 shows the final volume and area of entrainment phenomena such as erosion, deposition, and debris flow. Notably, in the present study, the deposition area in urban areas is different from the inundation area or flooded area by water flow. In other words, deposition area means the final disaster area by debris flow. On the other hand, the inundation area or flooded area means the spreading area by water flow after the impact of debris flow, to the Raemian APT in the present study. The debris volume is also not a summation of erosion and deposition in the present study; it refers to the water-flow volume with sediment–water mixture. The volumes of erosion and deposition are pure sediment volumes, as a result of the entrainment of sediment.
Figure 8 shows the final spatial pattern of entrainment erosion in all the simulations (Runs1–6) except for Run7, which is not an entrainment case. The erosion depth ranges from 1 to 3 m. Herein, the minus value indicates deposition and the plus value erosion. The erosion depth shown in Figure 7 means strictly the bed change by entrainment erosion. Thus, this figure indicates erosion and deposition due to the debris flow. In addition, the deposition areas in urban areas imply a partial amount of sediment–water mixture in debris flow transported from mountainous areas.
Figure 8a is the result of Run1, exhibiting the largest area of erosion (43,808 m2) and deposition (25,538 m2). In addition, the debris volume is 43,892 m2, which is the largest value among all the simulations (Figure 7). In the case of flow with driftwood, Run4 shows the largest erosion (39,668 m2) and deposition (19,807 m2) areas (Figure 8d), and Run5 shows the largest erosion (32,264 m3) and deposition (5732 m3) volumes (Figure 8e). Run3 (Figure 8c) indicates the smallest values among the flow-without-driftwood cases (Run1–3), in terms of the values of areas and volumes. As Run7 is not an entrainment erosion case, no volume or area were observed on the erosion and deposition (Figure 7).
In Figure 8, all the simulations show the large thalweg (the erosion depth is 3 m) in the middle of the erosion area, in the mountainous area. In particular, when the mean particle diameter of the sediment–water mixture is small, the cross-sectional width becomes wide. In the cases of driftwood (Run4–6), when the forest density or tree diameter is large, the thalweg becomes narrow, as shown in Figure 8d,e.
In particular, Run6 (Figure 8e) shows the height deposition (1.3 m) at the boundary between the urban and mountainous areas in front of the impact area. This height differs from those of Runs4 (0.8 m) and 5 (0.88 m). Moreover, the thread-channel areas sharply develop in the upper side of the deposition checkpoint, as shown in Figure 8e.

4. Discussion

4.1. Patterns of Entrainment Erosion with Forest

Figure 9a shows the time change in the volume of the debris flow for each scenario. Run1 has the smallest particle in the sediment–water mixture (0.75 mm), and the volume of the debris flow is large, as the particle of the sediment–water mixture is small. In Run3, the particle size of the sediment–water mixture is 1.25 mm, and the volume of the debris flow is the smallest among the without-driftwood cases (Runs 1–3). This is because entrainment erosion decreases the critical shear stress of small sediment. In the cases of Runs2 and 4, the volume of debris flow due to driftwood is reduced (Run2 > Run4), as the driftwood causes flow resistance that reduces the flow velocity, decreasing the bottom shear-stress. Run5 shows an increase in local scouring around trees after the passage of the debris flow through the forest area, which has a large density because of the large amount of driftwood generation (>Run2). Run6 shows that an increase in the runoff duration-time due to the reduction in the flow velocity caused by large trees increases the local scour-duration and debris-flow volume, compared with Run4.
The results of the time change in the simulation result of the flooded area are shown in Figure 9b. When the sediment size decreases and the volume of the debris flow increases, the flooded area increases (Run1 > Run2 > Run3). The flooded areas are reduced by the volume of the debris flow (Run2 > Run4–6), as the driftwood increases the flow resistance, decreasing the flow velocity and bottom shear-stress.
In Run5, the time change in the flooded area is smaller than that of Run4, owing to a decrease in the flow velocity (forest effect), and the flooded area increases, owing to an increase in the runoff duration (>Run4). Run6 indicates a reduction in the time of arrival in urban areas, due to a reduction in the flow velocity caused by forests having large-diameter trees.
As for the time change in the simulation result of the erosion volume, similar to the debris-flow volume, when the sediment size is smaller, the erosion volume becomes larger (Run1 > Run2 > Run3), owing to a decrease in the critical shear stress of small sediment (Figure 9c). The driftwood reduces the erosion volume (Run2 > Run4,6) because the driftwood reduces the flow velocity, thus reducing the shear stress in mountainous areas. In Run5, the final erosion amount is larger than that of Run4 because thalwegs are formed in the mountainous areas, owing to the acceleration of local erosion caused by larger-density forests. In Run6, the erosion volume increases rapidly after passing through the erosion zone of the upper basin, where the bottom slope is relatively high (after 30 s).
Figure 9d indicates the time change in the deposition volume caused by driftwood reduction (Run2 > Run4,6). In Run6, the deposition volume in the urban area is continually increased by the delay of the runoff duration-time, owing to the shielding effect of the forest having large-diameter wood which causes large flow-resistance. In particular, this shielding effect caused by woods with large diameters generates thread channels near the overturned trees. The area of the shielding effect reduces if driftwood occurs from wood. However, the drag force of a larger diameter wood is insufficient to break the wood stem using the bending moment. Moreover, this larger diameter wood increases flow resistance. Thus, the flow velocity increases near large-diameter woods, resulting in bottom erosion that causes the development of a flowing channel, whose width is limited within the intervals among trees. These generated thread-channels have large slopes, due to erosion; therefore, the flow velocity accelerates in those channels. Accordingly, Run6 shows a large flow-velocity when the debris flow reaches the urban area. Moreover, the outflow with the sediment–water mixture continually inflows to the urban area through the thread channels, and the deposition volume increases.

4.2. Effect of Characterized Forest and Driftwood on Debris Flow

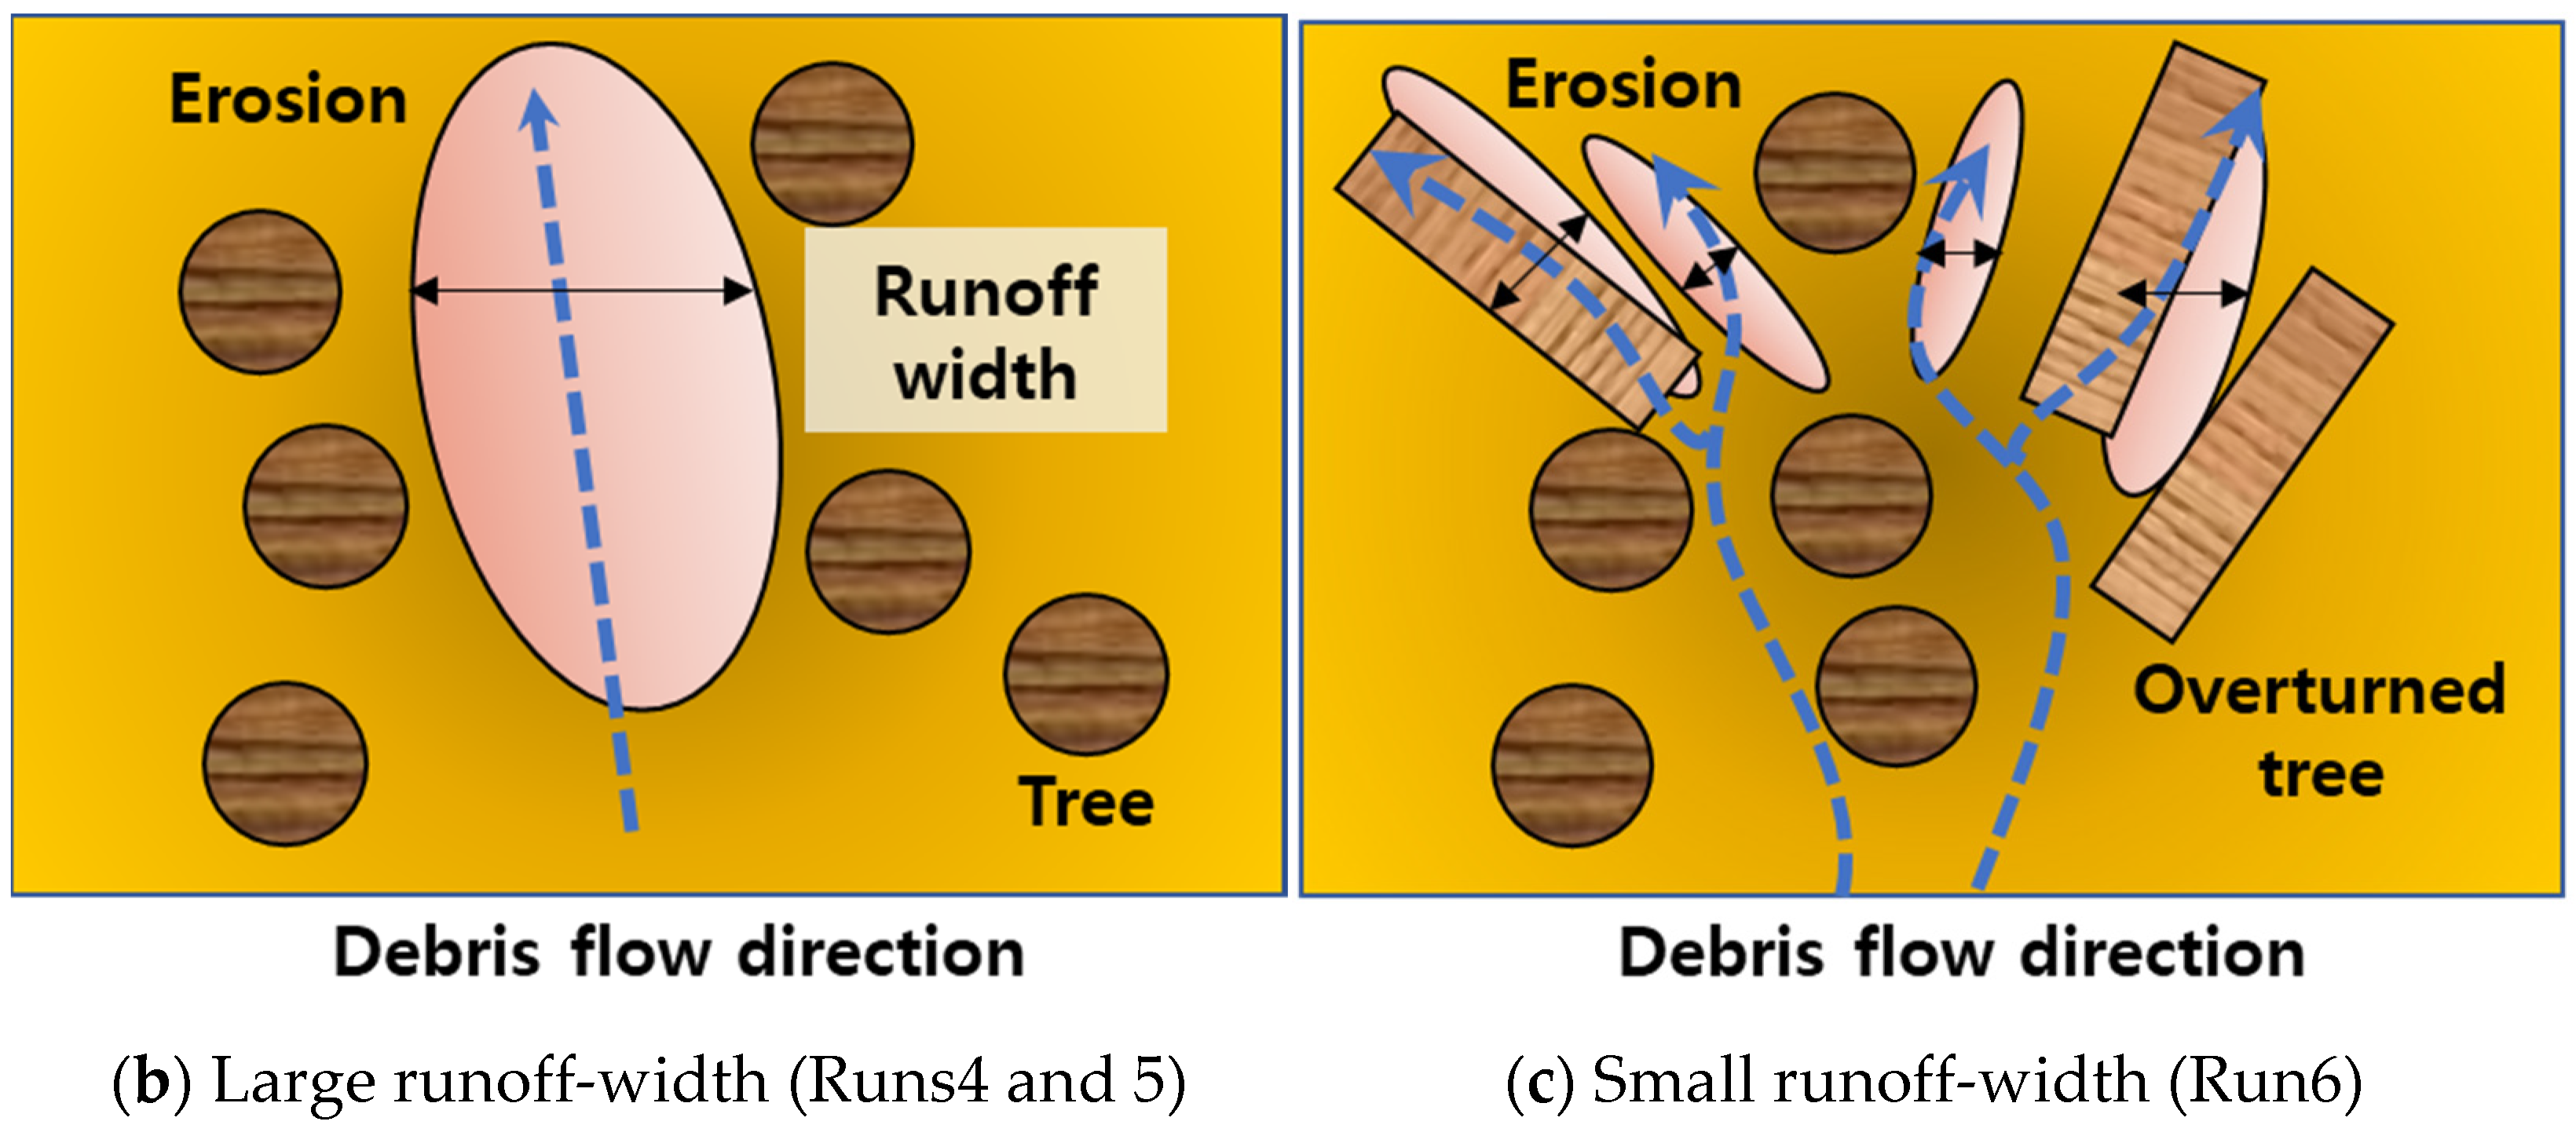
Figure 10a shows the overturned trees by the debris flow, and Figure 10b,c show the process of the shielding effect. As mentioned before, we considered two types of wood treatments in terms of driftwood generation: overturned tree, and completely ruptured wood (driftwood). The overturned wood is specially fixed. It affects the water flow through a larger projection area, inducing a larger drag force than that of normal cantilever trees (Figure 10c). If the larger drag force uproots a tree, the normal cantilever tree is completely ruptured, and changed into driftwood. Runs4 and 5 overall generated significant driftwood and widened the width channel (Figure 10b), but Run6 showed overturned trees only (Figure 10c). This is because as the diameters of the trees increases, the critical rupture-bending moment increases. Meanwhile, the shielding effect occurs in the cases of driftwood (Run4–6). Moreover, if the spatial density or the diameters of the trees increase, this effect increases (Figure 10c), by narrowing the width of the runoff channel.
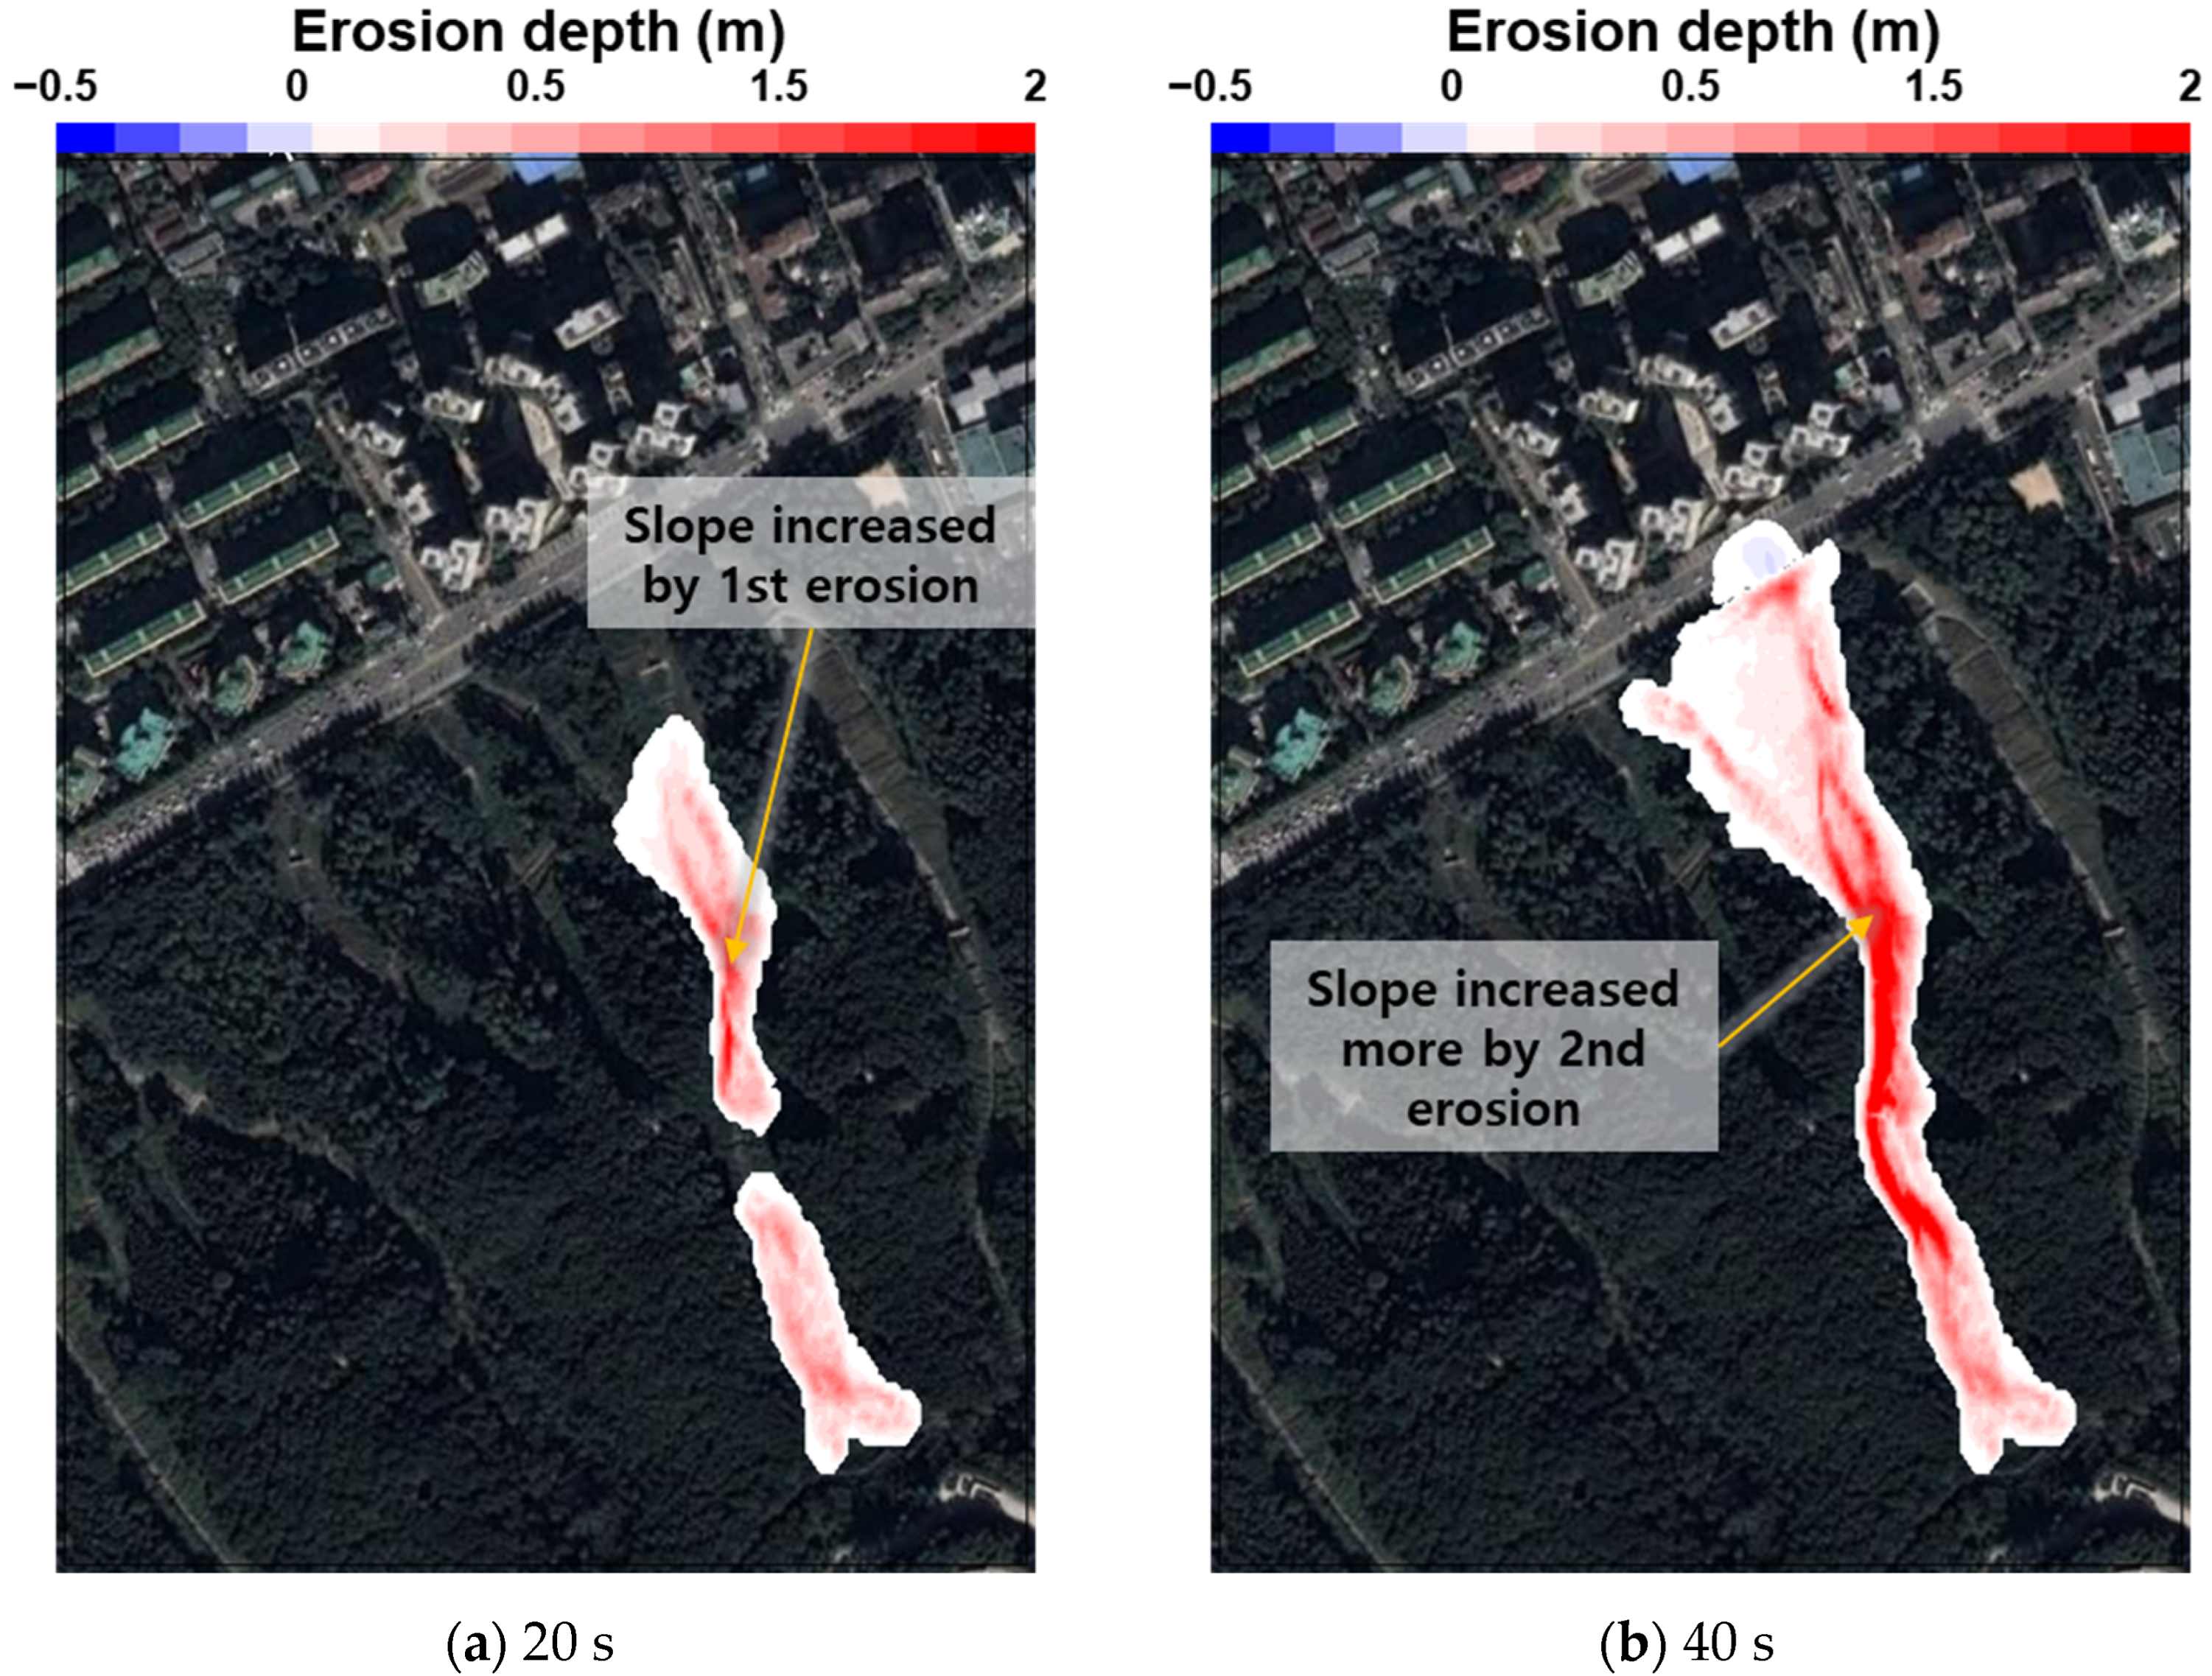
For the time change in the entrainment process of Run6, as we employed the four points of the initial debris-flow, the first erosion is caused by the downside debris-flow. Moreover, the debris flow from the upper side secondarily increases the bottom slope of the same erosion area, as shown in Figure 11a. After the secondary erosion, the debris flow is accelerated by the increased slope, and flows down (Figure 11b). It results in the development of the thalweg and thread channels, along with gaps between the trees on the downside of the mountainous areas Figure 11c.
Generally, an increase in the diameter of wood reduces the flow velocity of the debris flow by increasing the shielding effect (Figure 10c). Notably, it increases both the duration time of runoff and the erosion time of the thread channel. On the other hand, large-diameter trees can reduce the flow width, owing to narrowed spatial intervals among the trees (Figure 10c). If large-diameter woods become driftwood and flow down to the urban areas, the flow width becomes larger and the runoff capacity increases. Consequently, the thread channel does not occur. However, Run6 shows no driftwood generation, because the drag force of the debris flow is insufficient to cause breakage. Thus, around the trees, the thalweg, which can accelerate the flow velocity by increasing the slope, is generated and developed. A decrease in the flow width also increases the flow velocity and duration time of the runoff around the wood, owing to the narrowing flow channel, increasing the final debris-flow volume by activating local scour and increasing erosion time (Figure 11d).

4.3. Vulnerability Analysis by Impulse Stress

In the present study, to predict the potential vulnerability of the debris flow, we calculate the dynamic impulse stress ( F I   = kNm−2 = kPa), which evaluates the magnitude of the impact due to the debris flow, as expressed in Equation (30):
F I = v 2 ρ t ,   ρ t = σ C + 1 C ρ ,
where F I is the impulse stress, v is the impact velocity, ρ t is the density of the sediment–water mixture, C is the concentration of the sediment–water mixture, σ is the sediment density, and ρ is the water density. Herein, the parameters and values are considered for the impact area of the Raemian APT (see target area 1 of Figure 1).
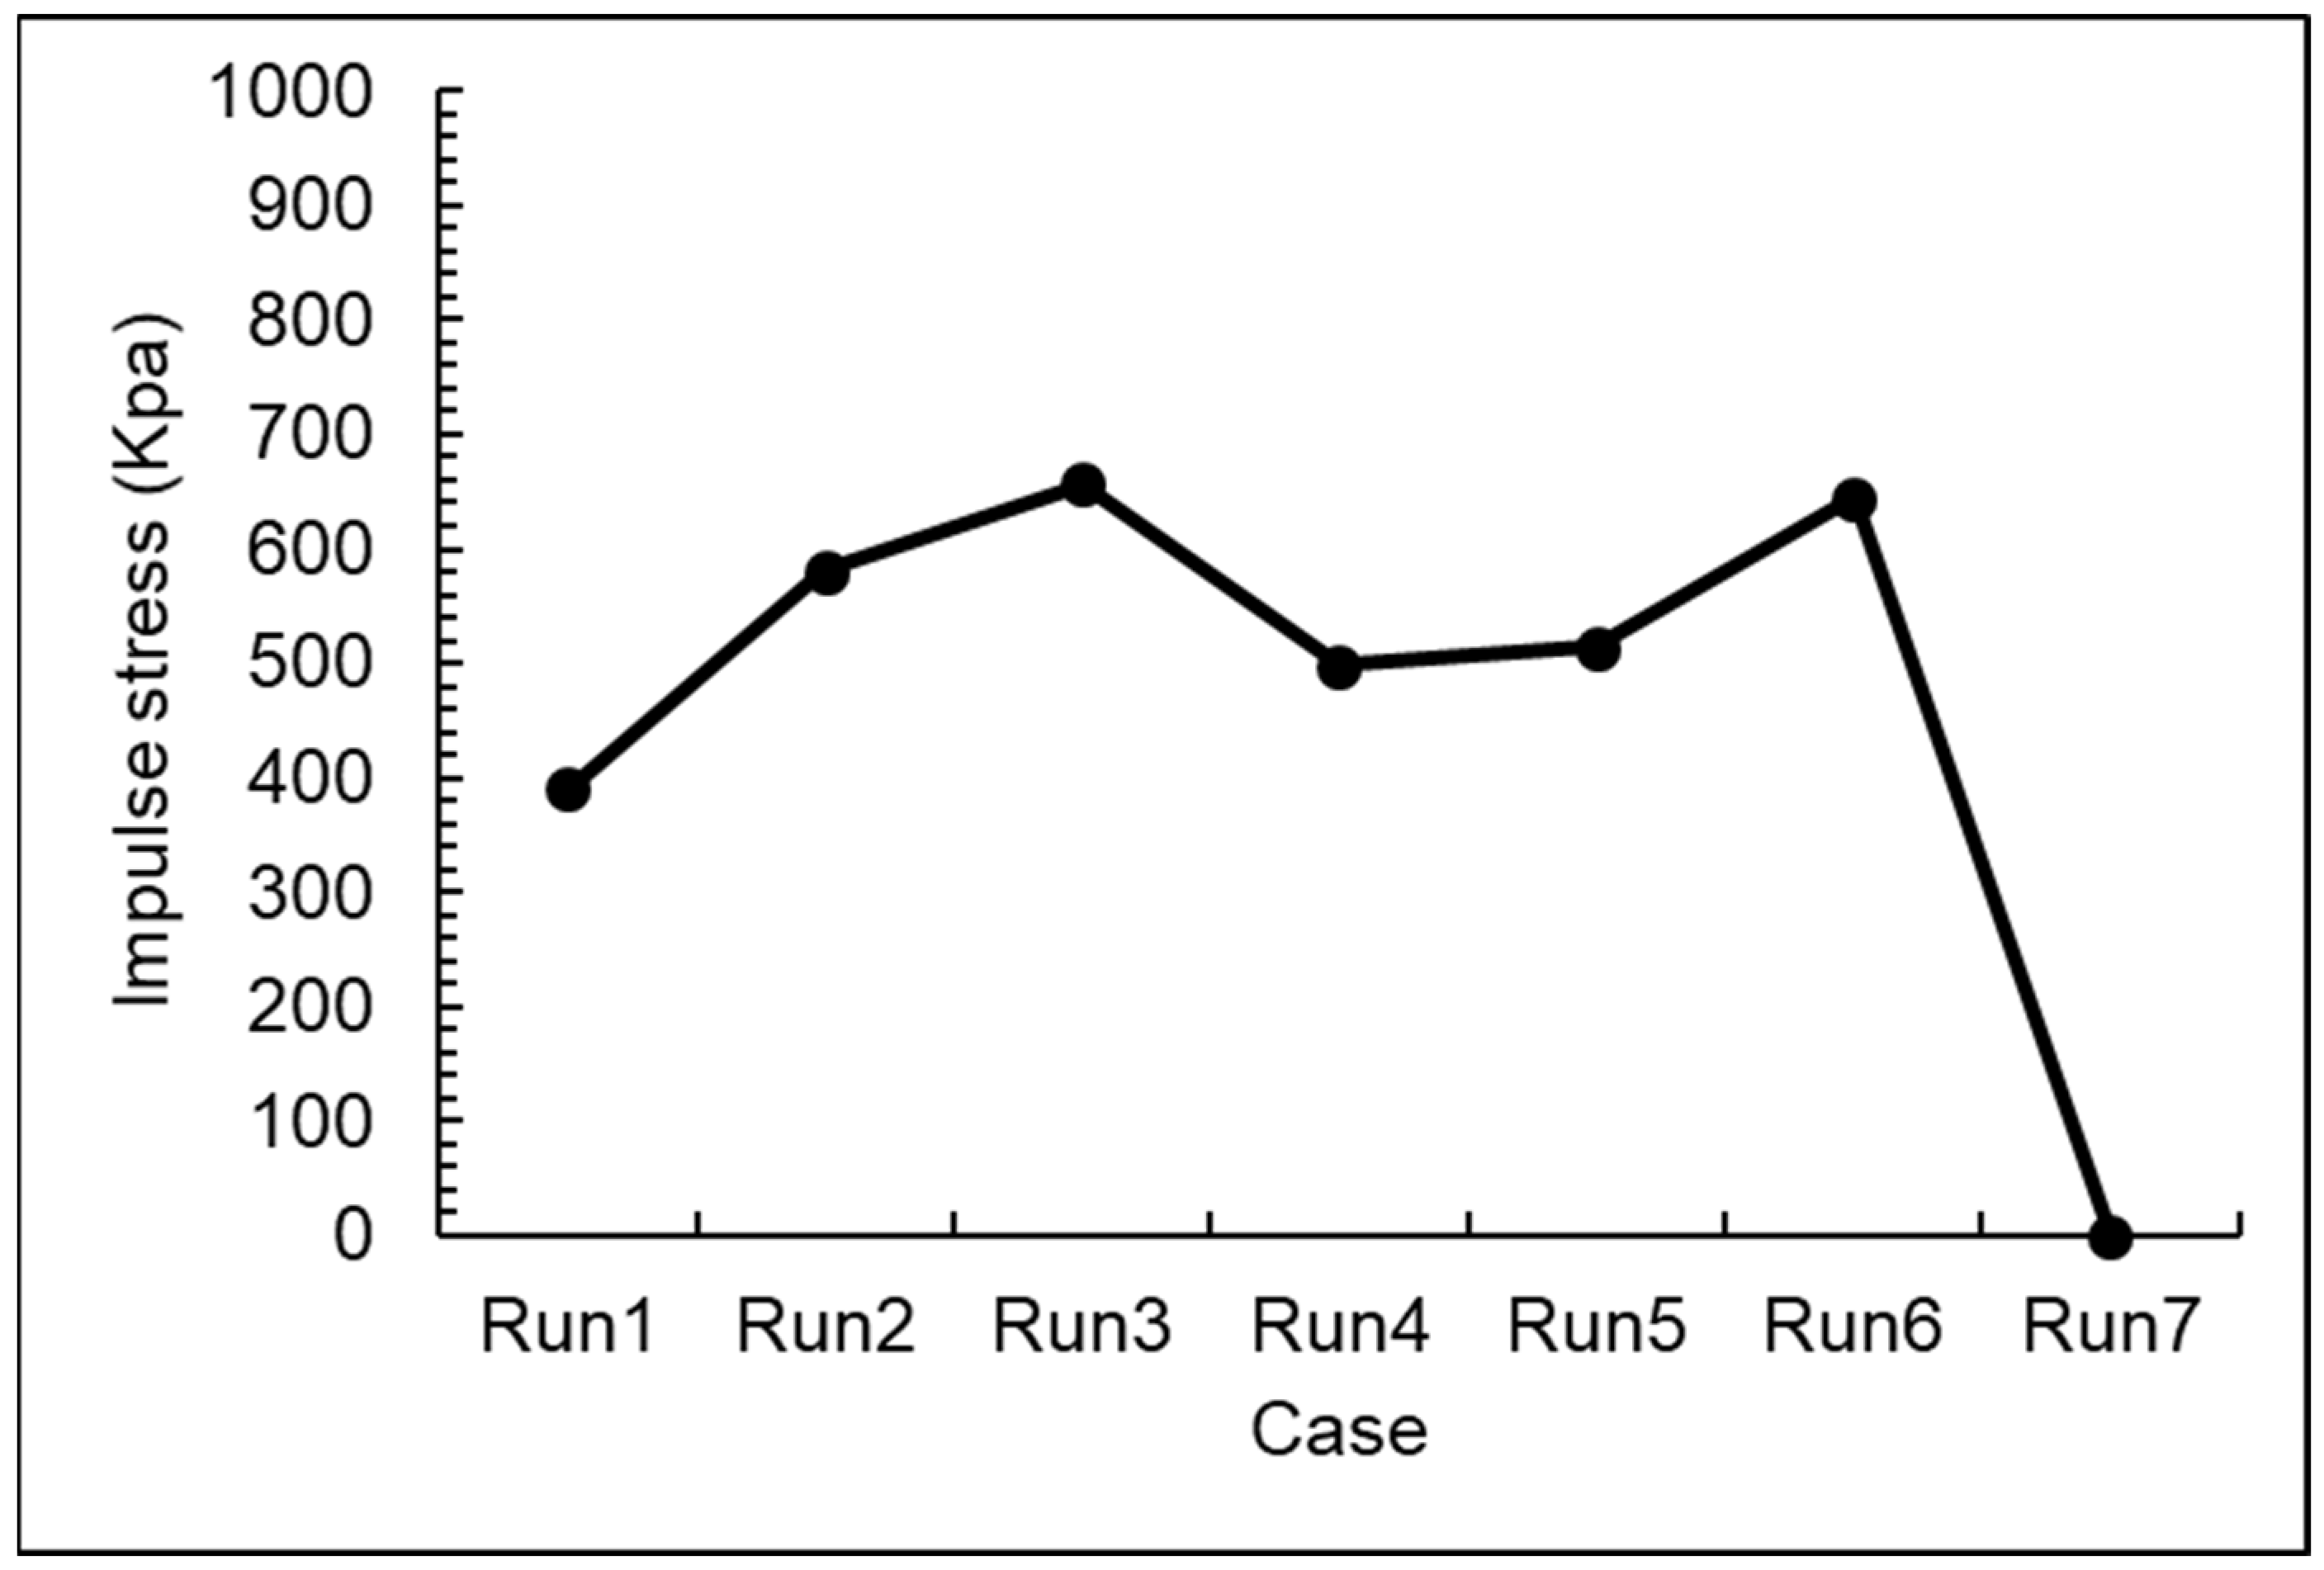
The calculated result is shown in Table 5 and Figure 12. Herein, Run3 exhibits the largest impulse stress (656.3 kPa) because of the largest impact velocity. This is because a larger sediment diameter decreases the critical bottom shear-stress and increases the flow velocity. Run7 shows the result of the no-entrainment effect, and it indicates the smallest value of the impulse stress, because the impact velocity is 0.95 m/s. Therefore, the Raemian APT might be safe from debris flow if the mountainous area has no erosion possibility.
In the cases of Run4 (497.6 kPa) and Run5 (514.2 kPa), the driftwood reduces the impulse stress. This is because the forest and driftwood decrease the flow velocity reaching the urban area. The case of Run6 indicates thread thalwegs that can increase the flow velocity at the downside of the mountain area. However, driftwood has a rigid body, which increases impulse stress. In other words, under the same impulse capacity, the contacting time of the driftwood is shorter than that of the fluid, and it increases the impulse stress. Accordingly, we only considered the loads from the debris flow, which are indeed smaller when driftwood is present. However, the driftwood has the additional potential to apply direct impact loads on the buildings, and this should be considered in future work for the vulnerability-assessment frameworks.
Based on this discussion, Run6 has accordingly the largest vulnerability, because the impulse stress value is the second largest among the cases. Moreover, if driftwood occurs and moves down to the urban area, the impulse stress might be significantly increased. Therefore, in terms of the simulation result, to reduce the impulse stress, the diameter of the sediment–water mixture should be reduced in order to decrease the debris volume. In addition, to prevent the generation of thread channels, the special interval among trees should be increased, which accelerates the flow velocity within a large slope near the trees, by scouring erosion.
In this study, the impulse stress of debris flow, including driftwood motion, was neglected because the impacted mass of driftwood onto the building could not be precisely calculated. This was because of the complexity of temporal changes of driftwood advection. In addition, in previous studies, the final debris volume was estimated, but the sediment and debris from the final volume were neither classified nor estimated. Therefore, the specific mass of driftwood could not be verified. Accordingly, we believe that this estimation can be addressed in future work, which will advance the present study.

4.4. Model Limits

4.4.1. Model Reproducibility

The debris flow, together with the driftwood and forest simulations of the Raemian APT basins, were successfully conducted. In addition, as the deposition caused by the debris flow and sediment–water mixture was considered, the inundated depth and maximum velocity near both APTs were similarly reproduced. However, the implementation of the flow velocity of the debris flow was challenging. In particular, in the Raemian APT basin (target area 2 of Figure 1), the sediment flowed at approximately 22.1 m/s (Run3), which was relatively low compared with the observed value of 28 m/s. Its rapid velocity was because the debris-flow event at Mt. Umyeon in 2011 contained considerably more water than a general debris-flow [15,18,19,62]. This is because heavy rainfall occurred in the basin, increasing the underground runoff by infiltration of surface water on Mt. Umyeon. Consequently, it decreased the concentration of the sediment–water mixture and the viscosity of the water flow, accelerating the velocity of the debris flow. In this study, the proposed model neglected mechanisms such as heavy rainfall, which increases flow discharge, and the runoff interactions between the surface flow and underground. If we consider these mechanisms, the velocity of the debris flow would be increased significantly, as the observation data show.
In addition, we selected representative tree profiles such as the diameter, height, and species, based on observation. However, it is suggested that the diverse tree profiles of the study area be included in future work for more accurate and predictive simulations.

4.4.2. Model Sensitivity by Sediment Size

Table 4 showed that Run3 produced better predictions of the height and velocity than Run2, and for the debris volume the inverse was the case. This is because when the diameter of the sediment is lower, the erosion phenomena are more activated, because the critical shear stress for erosion becomes small. This phenomenon caused an increase in debris volume, although the debris-flow velocity became smaller than that in the case of a larger diameter of sediment. Thus, the selection of representative sediment size is significant for the simulation using the present model.
In this model, a sensitivity analysis was performed, to select the average sediment diameter of the debris flow, and after selecting an appropriate sediment diameter, a prediction simulation was conducted. Concerning the soil and sand in the model condition, because debris flow is considered to be a viscous mixed-fluid, simulated coarse-grained soil should be separated from low-viscosity and fine-grained soil from within a high-viscosity flow, to more accurately reproduce the debris flow. However, this study has the following limitations: the separation behavior of coarse and fine soils was not considered in the simulation, and the numerical simulation was performed by selecting the representative sediment-diameter through sensitivity analysis. Therefore, in future work, the coarse and fine soil (termed the two-phase model) will be properly separated and calculated when calculating the mixed-sediment concentration for the accuracy of the numerical simulation, for entrainment erosion to be improved.
In addition, determining the representative sediment-size may be challenging, because debris flow is a mixture of soil and sand of various viscosities and sizes. Therefore, the application of the shear stress term of the Voellmy model (see [18]), which does not require a representative diameter of sediment–water mixture, might be another useable solution to reproduce debris flow with entrainment erosion. Through such a verified model, more accurate prediction simulations can be performed.

4.4.3. Applicability of Empirical Parameters

This model is applied to calculate the water-level flow-rate according to the advection and diffusion of mixed concentrations. Herein, the concentration and entrainment erosion/deposition coefficients were numerically simulated, using empirical values obtained through experiments and observations. Hence, an accurate numerical simulation-verification is necessary, to use the measured and analyzed coefficients after conducting a field observation of the study area in advance.
We employed a spatially uniform Manning-roughness-coefficient for this study area, based on related studies [62]. However, the characteristic of the bottom area is significantly irregular, depending on either the local slope or tree distribution, and it may cause diverse flow patterns. Thus, the model sensitivity to changes in the spatial Manning-coefficient should be analyzed in future work, to further verify the model reproducibility.

4.4.4. Two-Dimensional Plane Structured Flow of the Model

We developed a driftwood-generation model to trigger the generation of driftwood from initially planted trees and to investigate the effect of the forest. In addition, the driftwood-generation model only considered a depth-wise uniform load by drag force in a 2D depth-averaged flow for simplicity. However, the debris flow demonstrates the 3D-structured transient-flow of water around buildings, and the distribution of the horizontal pressures is more complicated [68]. In addition, high-magnitude short-duration impulsive forces [32,33,34] are able to be up to 6–10 times larger than the drag forces [33] and damming loads around the trees, and this affect the forces and moments on the structure or tree [37]. Therefore, such 3D hydrodynamics should be considered, to physically advance the driftwood-generation model in future work.
Although the model in the present study considered 2D plane flow, and the debris flow was characterized by a partially 3D flow-structure, which exhibited the behavior of a viscosity lump of sediment–water mixture, the deposition process in the simulation was reproduced well by the developed module, which calculated the erosion and entrainment processes. This implies that the deposition of the debris flow plays an important role in the analysis of the debris flows, as well as erosion and entrainment. Therefore, in the future, studies that explore deposition should make better predictions of debris flows and should be refined by verifying the model using field-observation data. In addition, the collapse point is essential for the analysis of the debris flows in order to reproduce and predict debris disasters. Therefore, the analysis of slope stability must initially be implemented in unmeasured areas and potential areas with a high possibility of landslides and debris flows.

4.4.5. Wood Collision

With regard to numerical methods for analyzing collision motion, we neglected the effects of collisions such as driftwood–tree and driftwood–driftwood collisions. The hook effect caused by a branch and root wad was also neglected. Therefore, the wood motion was reproduced within advection by floating, sliding, rolling, and rotation in the 2D plane-view. Many studies have indicated that such collision motion together with the hook effect results in a change in flow characteristics. Furthermore, it can increase the impulse stress and improve the physical reproduction of the debris flow [40,66]. Thus, the abovementioned neglected phenomena should be considered in future work to more accurately reproduce the debris flow.
Moreover, further studies should be conducted on numerical modeling of the physical motion of the tree branches and the effect on motions such as those owing to large overall masses. In such studies, to additionally reproduce the interaction between driftwood and trees, a calculation of impinging force is important, in which case linear or nonlinear dashpot-damper modeling is required [40,41,66]. Such physical modelling can be addressed in future work.

5. Conclusions

In this study, we developed a 2D numerical model to reproduce the debris flow with entrainment erosion, together with driftwood dynamics, which was able to simulate all the stages of debris flow (initiation, transportation, and deposition stages), based on the interacting combination of the Eulerian expression of the debris flow. Then, we verified the numerical model by comparing the reproducibility of simulating the debris-flow characteristics and entrainment erosion, together with driftwood behaviors. In particular, we presented a more numerically refined treatment for the modeling of driftwood-generation, which enabled the generation of driftwood from the forest by considering flow dynamics and the mechanical behavior of the wood. Consequently, these numerical treatments could extend the understanding of the predictive methodology of disasters caused by debris and driftwood, in more depth. The detailed results are as follows:
(1) Reproducibility
The debris flow with driftwood simulations for the Raemian APT basins was successfully conducted. In addition, as the deposition caused by the debris flow and sediment–water mixture was considered, the inundated depth and maximum velocity near both APTs were similarly reproduced. However, the flow velocity of the debris flow could not be implemented easily, and in particular, in the Raemian APT basin (target area 2 of Figure 1), the sediment flowed at approximately 22.1 m/s (Run3), which was relatively low compared with the observed value of 28 m/s. This is because heavy rainfall occurred in the basin, increasing underground runoff by the infiltration of surface water on Mt. Umyeon. Consequently, the concentration of the sediment–water mixture and the viscosity of the water flow were decreased, causing the velocity of the debris flow to accelerate. In future work, it might be necessary to consider how mechanisms such as heavy rainfall increases the flow discharge and the runoff interactions between surface flow and underground. If we consider these mechanisms, the velocity of the debris flow would be increased significantly, as in the observation data.
(2) Forest and driftwood effect
Large-diameter wood could reduce the flow width, owing to the narrowed spatial intervals among the trees. If large-diameter wood becomes driftwood and flows down to the urban area, the flow width and runoff capacity increase. Thus, thread channels would not occur. However, Run6 showed no driftwood generation, because the drag force of the debris flow was insufficient to cause breakage. Thus, around the trees, thalwegs, which can accelerate the flow velocity by increasing the slope, were generated and developed. A decrease in the flow width also increased the flow velocity and duration time of the runoff around the wood, owing to the narrowing flow channel, resulting in an increase in the final debris-flow volume by activating the local scour and increasing the erosion time.
(3) Entrainment erosion
In the present study, entrainment erosion is significantly important for predicting all the stages of debris flow (initiation, transportation, and deposition). Under the same condition, the reproducibility of the simulation result would be significantly different from the observation data if entrainment erosion were not employed in terms of flow characteristics and bed changes such as depth, velocity, and flooded area.

Author Contributions

Conceptualization, T.K.; methodology, T.K.; software, T.K. and I.K.; validation, I.K., and T.K.; investigation, T.K.; writing—original draft preparation, T.K.; writing—review and editing, T.K., C.-L.J., I.K. and N.L.; visualization, T.K. All authors have read and agreed to the published version of the manuscript.

Funding

This work was supported by the Korea Environmental Industry & Technology Institute (KEITI) through the Aquatic Ecosystem Conservation Research Program, funded by the Korea Ministry of Environment (MOE)(2020003050002).

Data Availability Statement

Not applicable.

Conflicts of Interest

The authors declare no conflict of interest.

References

  1. Korea Institute of Geoscience And Mineral Resources (KIGAM). Development of QRA system and damage mitigation technology of landslides. Research report, Office for Government Policy Coordination. KIGAM 2006, TRKO200500002717, 1–360. (In Korean) [Google Scholar]
  2. The Donga Ilbo. 2022. Available online: https://www.donga.com (accessed on 1 September 2022). (In Korean).
  3. Lee, M.; Kim, Y. Movement and deposition characteristics of debris flow according to rheological factors. J. Korean Soc. Agric. Eng. 2013, 29, 19–27. (In Korean) [Google Scholar]
  4. O’Brien, J.S.; Julien, P.Y. Physical properties and mechanics of hyper-concentrated sediment flows. In Proceedings of the Specialty Conference on Delineation of Landslide, Flash Flood and Debris Flow Hazard in Utah, Logan, UT, USA, 14–15 June 1984; Utah State University: Logan, UT, USA, 1985; pp. 260–279. [Google Scholar]
  5. Iverson, R.M.; Ried, M.E.; LaHusen, R.G. Debris-flow mobilization from landslides. Annu. Rev. Earth Planet. Sci. 1997, 25, 85–138. [Google Scholar] [CrossRef]
  6. Jeong, S. Rheological models for describing fine-laden debris flows: Grain-size effect. J. Korean Geotech. Soc. 2011, 27, 49–61. (In Korean) [Google Scholar] [CrossRef] [Green Version]
  7. Iverson, R.M. The debris-flow rheology myth. In Debris Flow Hazards Mitigation: Mechanics, Prediction and Assessment; Rickenmann, R., Chen, C.L., Eds.; Millpress: Bethlehem, PA, USA, 2003; pp. 303–314. [Google Scholar]
  8. O’Brien, J.S.; Julien, P.Y.; Fullerton, W.T. Two dimensional water flood and mudflow simulation. J. Hydraul. Engrg. ASCE 1993, 119, 244–261. [Google Scholar] [CrossRef]
  9. Beguería, S.; Van Asch, T.W.J.; Malet, J.-P.; Gröndahl, S. A GIS-based numerical model for simulating the kinematics of mud and debris flows over complex terrain. Nat. Hazards Earth Syst. Sci. 2009, 9, 1897–1909. [Google Scholar] [CrossRef] [Green Version]
  10. Blanc, T.; Pastor, M. Numerical simulation of debris flows with the 2D–SPH depth integrated model. In Proceedings of the EGU General Assembly Conference Abstracts, Vienna, Austria, 19–24 April 2009; p. 1978. [Google Scholar]
  11. Mergili, M.; Fellin, W.; Moreiras, S.M.; Stötter, J. Simulation of debris flows in the Central Andes based on open source GIS: Possibilities, limitations, and parameter sensitivity. Nat. Hazards 2012, 61, 1051–1081. [Google Scholar] [CrossRef] [Green Version]
  12. Imran, J.; Parker, G.; Locat, J.; Lee, H. 1D numerical model of muddy subaqueous and subaerial debris flows. J. Hydraul. Eng. ASCE 2000, 127, 959–968. [Google Scholar] [CrossRef]
  13. Shrestha, B.B.; Nakagawa, H.; Kawaike, K.; Baba, Y. Numerical simulation on debris-flow deposition and erosion processes upstream of a check dam with experimental verification. Annu. Disaster Prev. Res. Inst. 2008, 51, 613–624. [Google Scholar]
  14. D’Aniello, A.; Cozzolino, L.; Cimorelli, L.; Morte, R.D.; Pianese, D. A numerical model for the simulation of debris flow triggering, propagation and arrest. Nat. Hazards 2015, 75, 1403–1433. [Google Scholar] [CrossRef]
  15. Kim, S.; Paik, J.; Kim, K. Run-out modeling of debris flows in Mt. Umyeon using FLO-2D. J. Korean Soc. Civ. Eng. 2013, 33, 965–974. (In Korean) [Google Scholar]
  16. Hsu, S.M.; Chiou, L.B.; Lin, G.F.; Chao, C.H.; Wen, H.Y.; Ku, C.Y. Applications of simulation technique on debris-flow hazard zone delineation: A case study in Hualien County, Taiwan. Nat. Hazards Earth Syst. Sci. 2010, 10, 535–545. [Google Scholar] [CrossRef] [Green Version]
  17. Hussin, H.Y.; Quan Luna, B.; van Westen, C.J.; Christen, M.; Malet, J.-P.; van Asch, T.W.J. Parameterization of a numerical 2-D debris flow model with entrainment: A case study of the Faucon catchment, Southern French Alps. Nat. Hazards Earth Syst. Sci. 2012, 12, 3075–3090. [Google Scholar] [CrossRef] [Green Version]
  18. An, H.; Kim, M.; Lee, G.; Kim, Y.; Lim, H. Estimation of the area of sediment deposition by debris flow using a physical-based modeling approach. Quat. Int. 2019, 503, 59–69. [Google Scholar] [CrossRef]
  19. Lee, S.; An, H.; Kim, M.; Lim, H.; Kim, Y. A Simple Deposition Model for Debris Flow Simulation Considering the Erosion–Entrainment–Deposition Process. Remote Sens. 2022, 14, 1904. [Google Scholar] [CrossRef]
  20. Takahashi, T.; Nakagawa, H.; Harada, T.; Yamashiki, Y. Routing debris flows with particle segregation. J. Hydraul. Eng. ASCE 1992, 118, 1490–1507. [Google Scholar] [CrossRef]
  21. Shieh, C.L.; Jan, C.D.; Tsai, Y.F. A numerical simulation of debris flow and its application. Nat. Hazards 1996, 13, 39–54. [Google Scholar] [CrossRef]
  22. Ghilardi, P.; Natale, L.; Savi, F. Modeling debris flow propagation and deposition. Phys. Chem. Earth 2001, 26, 651–656. [Google Scholar] [CrossRef]
  23. Mambretti, S.; Larcan, E.; Wrachien, D.D. Theoretical and experimental analysis of debris flow: Rheology and two-phase modeling. Irrig. Drain. 2008, 57, 555–570. [Google Scholar] [CrossRef]
  24. Brufau, P.; Garcia-Navarro, P.; Ghilardi, P.; Natale, L.; Savi, F. 1D mathematical modelling of debris flow. J. Hydraul. Res. 2000, 38, 435–446. [Google Scholar] [CrossRef]
  25. Jan, C.D. A study on the numerical modeling of debris flow. In Proceedings of the 1997 1st International Conference on Debris-Flow Hazards Mitigation: Mechanics, Prediction, and Assessment, San Francisco, CA, USA, 7–9 August 1997; pp. 717–726. [Google Scholar]
  26. Jin, M.; Fread, D.L. 1D routing of mud/debris flow using NWS FLDWAV model. In Proceedings of the First Conference on Debris-Flow Hazards Mitigation: Mechanics, Prediction, and Assessment, San Francisco, CA, USA, 7–9 August 1997; pp. 687–696. [Google Scholar]
  27. Laigle, D.; Coussot, P. Numerical modeling of mudflows. J. Hydraul. Eng. 1997, 123, 617–623. [Google Scholar] [CrossRef]
  28. Locat, J. Normalized rheological behavior of fine muds and their flow properties in a pseudoplastic regime. In Proceedings of the First Conference on Debris-Flow Hazards Mitigation: Mechanics, Prediction, and Assessment, San Francisco, CA, USA, 7–9 August 1997; pp. 260–269. [Google Scholar]
  29. Takahashi, T. Debris Flow. Monograph Series of IAHR; Routledge & CRC Press Balkema: New York, NY, USA, 1991; pp. 1–165. [Google Scholar]
  30. Remaître, A.; Malet, J.-P.; Maquaire, O.; Ancey, C.; Locat, J. Flow behaviour and runout modelling of a complex debris flow in a clay-shale basin. Earth Surf. Process. Landf. 2005, 30, 479–488. [Google Scholar] [CrossRef]
  31. Shrestha, B.; Nakagawa, H.; Kawaike, K.; Baba, Y.; Zhang, H. Driftwood deposition from debris flows at slit-check dams and fans. Nat. Hazards 2012, 61, 577–602. [Google Scholar] [CrossRef]
  32. Hasanpour, A.; Istrati, D.; Bukcle, I. Coupled SPH–FEM modeling of tsunami-borne large debris flow and impact on coastal structures. J. Mar. Sci. 2021, 9, 1068. [Google Scholar] [CrossRef]
  33. Istrati, D.; Hasanpour, A. Advanced numerical modelling of large debris impact on piers during extreme flood events. In Proceedings of the 7th IAHR Europe Congress, Athens, Greece, 7–9 September 2022. [Google Scholar]
  34. Haehnel, R.B.; Daly, S.F. Maximum impact force of woody debris on floodplain structures. J. Hydraul. Eng. 2004, 130, 112–120. [Google Scholar] [CrossRef]
  35. Hasanpour, A.; Istrati, D.; Bukcle, I. Multi-physics modeling of tsunami debris impact on bridge decks. In Proceedings of the 3rd International Conference on Natural Hazards & Infrastructure, Athens, Greece, 5–7 July 2022. [Google Scholar]
  36. Oudenbroek, K.; Naderi, N.; Bricker, J.D.; Yang, Y.; Van der Veen, C.; Uijttewaal, W.; Moriguchi, S.; Jonkman, S.N. Hydrodynamic and debris-damming failure of bridge decks and piers in steady flow. Geosciences 2018, 8, 409. [Google Scholar] [CrossRef] [Green Version]
  37. Istrati, D.; Hasanpour, A.; Buckle, I. Numerical investigation of tsunami-borne debris damming loads on a coastal bridge. In Proceedings of the 17 World Conference on Earthquake Engineering, Sendai, Japan, 13–18 September 2020. [Google Scholar]
  38. Ruiz-Villanueva, V.; Bladé, E.; Sánchez-Juny, M.; Marti-Cardona, B.; Díez-Herrero, A.; Bodoque, J.M. Two-dimensional numerical modeling of wood transport. J. Hydroinform. 2014, 16, 1077–1096. [Google Scholar] [CrossRef]
  39. Ruiz-Villanueva, V.; Gamberini, C.; Bladé, E.; Stoffel, M.; Bertoldi, W. Numerical Modeling of Instream Wood Transport, Deposition, and Accumulation in Braided Morphologies Under Unsteady Conditions: Sensitivity and High-Resolution Quantitative Model Validation. Water Resour. Res. 2020, 56, e2019WR026221. [Google Scholar] [CrossRef]
  40. Kang, T.; Kimura, I.; Shimizu, Y. Numerical simulation of large wood deposition patterns and responses of bed morphology in a braided river using large wood dynamics model. Earth Surf. Process. Landf. 2020, 45, 962–977. [Google Scholar] [CrossRef]
  41. Kang, T.; Kimura, I.; Onda, S. Application of Computational Modeling for Large Wood Dynamics with Collisions on Moveable Channel Beds. Adv. Water Resour. 2021, 152, 103912. [Google Scholar] [CrossRef]
  42. Persi, E.; Petaccia, G.; Sibilla, S.; Brufau, P.; García-Navarro, P. Calibration of a dynamic Eulerian-lagrangian model for the computation of wood cylinders transport in shallow water flow. J. Hydroinf. 2019, 21, 164–179. [Google Scholar] [CrossRef]
  43. Leonardi, A. Numerical simulation of debris flow and interaction between flow and obstacle via DEM. Doctoral Dissertation, ETH Zurich, Zürich, Switzerland, 2015. [Google Scholar]
  44. Nakagawa, H.; Takahashi, T.; Ikeguchi, M. Driftwood behavior by overland flood flows. J. Hydrosci. Hydraul. Eng. JSCE 1994, 12, 31–39. (In Japanese) [Google Scholar]
  45. Nakagawa, H.; Inoue, K.; Ikeguchi, M.; Tsubono, T. Behavior of driftwood and the process of its damming up. J. Hydrosci. Hydraul. Eng. JSCE 1995, 13, 55–67. (In Japanese) [Google Scholar]
  46. Gotoh, H.; Sakai, T.; Hayashi, M. Lagrangian model of drift-timbers induced flood by using moving particle semi-implicit model. J. Hydrosci. Hydraul. Eng. JSCE 2002, 20, 95–102. [Google Scholar]
  47. Ikari, H.; Gotoh, H.; Sumi, T. Computational mechanics of a blocking of gateless bottom outlet by drift woods. Annu. J. Hydraul. Eng. JSCE 2006, 50, 793–798, (In Japanese with English abstract). [Google Scholar] [CrossRef]
  48. Shimizu, Y.; Osada, K. Numerical simulation on the driftwood behavior in open-channel flows by using distinct element method. In Proceedings of the 8th International Conference on Hydro-Science and Engineering (ICHE-8), Nagoya, Japan, 9–11 September 2008. [Google Scholar]
  49. Eggertsson, O. Mackenzie river driftwood—A dendrochronological study. Arctic 1994, 47, 128–136. [Google Scholar] [CrossRef] [Green Version]
  50. Braudrick, C.A.; Grant, G.E.; Ishikawa, Y.; Ikeda, H. Dynamics of wood transport in streams: A flume experiment. Earth Surf. Process. Landf. 1997, 22, 669–683. [Google Scholar] [CrossRef]
  51. Abbe, T.B.; Montgomery, D.R. Patterns and processes of wood debris accumulation in the Queets river basin, Washington. Geomorphology 2003, 51, 81–107. [Google Scholar] [CrossRef]
  52. Comiti, F.; Andreoli, A.; Lenzi, M.A.; Mao, L. Spatial density and characteristics of woody debris in five mountain rivers of the Dolamites (Italian Alps). Geomorphology 2006, 78, 44–63. [Google Scholar] [CrossRef]
  53. Bochhiola, D.; Rulli, M.C.; Rosso, R. Transport of large woody debris in the presence of obstacles. Geomorphology 2006, 76, 166–178. [Google Scholar] [CrossRef]
  54. Rickenmann, D.; Laigle, D.; McArdell, B.W.; Hübl, J. Comparison of 2D debris-flow simulation models with field events. Comput. Geosci. 2006, 10, 241–264. [Google Scholar] [CrossRef] [Green Version]
  55. Crosta, G.B.; Imposimato, S.; Roddeman, D. Numerical modelling of entrainment/ deposition in rock and debris-avalanches. Eng. Geol. Mech. Veloc. Large Landslides 2009, 109, 135–145. [Google Scholar] [CrossRef]
  56. D’Ambrosio, D.; Di Gregorio, S.; Iovine, G. Simulating debris flows through a hexagonal cellular automata model: SCIDDICA S3–hex. Nat. Hazards Earth Syst. Sci. 2003, 3, 545–559. [Google Scholar] [CrossRef] [Green Version]
  57. Medina, V.; Hürlimann, M.; Bateman, A. Application of FLATModel, a 2D finite volume code, to debris flows in the northeastern part of the Iberian Peninsula. Landslides 2008, 5, 127–142. [Google Scholar] [CrossRef]
  58. Hungr, O.; McDougall, S. Two numerical models for landslide dynamic analysis. Comput. Geosci. 2009, 35, 978–992. [Google Scholar] [CrossRef]
  59. Pastor, M.; Haddad, B.; Sorbino, G.; Cuomo, S.; Drempetic, V. A depth-integrated, coupled SPH model for flow-like landslides and related phenomena. Int. J. Numer. Anal. Methods Geomech. 2009, 33, 143–172. [Google Scholar] [CrossRef]
  60. Shimizu, Y.; Suzuki, E.; Kawamura, S.; Inoue, T.; Iwasaki, T.; Hamaki, M.; Omura, K.; Kakegawa, E. Nays2D Flood solver manual. Int. River Interface Coop. 2015. [Google Scholar]
  61. International River Interface Cooperative (iRIC). 2022. Available online: http://i-ric.org/en (accessed on 1 September 2022).
  62. Seoul City. Research contract report: Addition and Complement causes survey of Mt, vol.2011 Woomyeon landslide. Res. Rep. 2014, 51-6110000-000649-01, 1–46. (In Korean) [Google Scholar]
  63. Yonhapnews. 2011. Available online: https://www.yna.co.kr (accessed on 1 September 2022). (In Korean).
  64. Sisain. 2011. Available online: https://www.sisain.co.kr (accessed on 1 September 2022). (In Korean).
  65. Kang, T.; Kimura, I. Computational modeling for large wood dynamics with root wad and anisotropic bed friction in shallow flows. Adv. Water Resour. 2018, 121, 419–431. [Google Scholar] [CrossRef]
  66. Kimura, I.; Kitanozo, K. Effects of the driftwood Richardson number and applicability of a 3D-2D model to heavy wood jamming around obstacles. Environ. Fluid Mech. 2020, 20, 503–525. [Google Scholar] [CrossRef]
  67. Hasanpour, A.; Istrati, D. Reducing extreme flooding loads on essential facilities via elevated structures. In Proceedings of the ASCE Lifelines Conference, Los Angeles, CA, USA, 31 January–4 February 2022. [Google Scholar]
  68. United States Department of Agriculture. Wood Handbook; Department of Agriculture: Washington, DC, USA, 2010. [Google Scholar]
  69. National Geographic Information Institute (NGII). Mt. Umyon Digital Topographical Map 2022. Available online: https://www.ngii.go.kr (accessed on 1 September 2022). (In Korean)
Figure 2. Driftwood generation model ( M s is critical moment of perpendicularly cantilevered wood; M w is moment acting on the stem of the wood body).
Water 14 03673 g002
Figure 3. Flow chart of calculation procedure.
Water 14 03673 g003
Figure 4. Time changes in simulation result of debris-flow depth (Run2).
Water 14 03673 g004
Figure 5. Final simulation result (Run2).
Water 14 03673 g005
Figure 6. Time changes in simulation result of debris-flow depth (Run4).
Water 14 03673 g006
Figure 7. Final results of entrainment phenomena in all the simulations.
Water 14 03673 g007
Figure 8. Final spatial pattern of entrainment erosion in all the simulations.
Water 14 03673 g008aWater 14 03673 g008b
Figure 9. Time changes in simulation result from entrainment phenomena.
Water 14 03673 g009
Figure 10. Spatial patterns of trees and driftwood (note that in the case of the overturned and fixed trees, the debris will be able to flow above the tree after the height of the debris flow exceeds the diameter of the fallen tree).
Water 14 03673 g010aWater 14 03673 g010b
Figure 11. Time changes in entrainment erosion process of simulation (Run6).
Water 14 03673 g011aWater 14 03673 g011b
Figure 12. Impulse stress at the target area 1 (see Figure 1).
Water 14 03673 g012
Table 1. Parameters of computational model and simulation cases.
ParameterValue (Unit)ParameterValue (Unit)
Initial debris flow volume4250 (m3)Critical bending stress of wood breaking45 (MPa)
Advection of concentrationUpwindCritical bending stress of wood deformation8 (MPa)
Turbulence modelZero equationAdvection of flowTVD-MUSCL
Computational domain0.6 (width) × 0.8 (length) (km2)Uniform grid size3 × 3 (m2)
Resolution of topography1 × 1 (m2)Manning roughness coefficient0.04 (s/m1/3)
Angle of repose25 (degree)Simulation time120 (s)
Density of water1000 (kg/m3)Density of forest of study area6000 (0.06 m2)
Density of tree800 (kg/m3)Mean stem-length of wood10.3 (m)
Static-friction coefficient of driftwood0.9Mean stem-diameter of wood0.28 (m)
Rolling friction coefficient of driftwood0.4Kinematic friction coefficient of driftwood0.6
Concentration of sediment–water mixture0.4Max. concentration0.55
Limitative concentration0.5Density of sediment2000 (kg/m3)
Time step0.01 (s)Max. erosion depth3 (m)
Erosion ratio0.001Deposition ratio0.01
Table 2. Parameters of various factors for the simulation cases.
No.Sediment Size
(mm)
Wood Diameter
of Forest (m)
Driftwood GenerationDensity of Forest
(Tree Number/m2)
Remarks
Run10.75-N-Small diameter
Run21-N-Standard
Run31.25-N-Large diameter
Run410.231Y0.06Run2 with driftwood
Run510.231Y0.3Forest density × 5
Run611.155Y0.06Stem diameter × 5
Run71-N-No-entrainment erosion
Table 3. Final result of simulation.
CaseImpact Height (1)
(m)
Inflowing Velocity (2)
(m/s)
Final Debris Volume (3)
(m3)
Driftwood Volume
(m3)
Observation12.028.042,500-
Run15.316.543,892-
Run212.920.436,653-
Run312.422.130,403-
Run411.920.532,843
(32,041, without driftwood)
802
Run510.119.238,775
(35,591, without driftwood)
3814
Run68.520.134,4410
Run70.814.34775-
Note: (1) Measured at the target area 1 of Figure 1 [64]. (2) Measured at the target area 2 of Figure 1 [18,19]. (3) Reported by Seoul City [62].
Table 4. Simulation reproducibility (Acc.: accuracy, Vol.: volume).
No.Height Acc. (-)Velocity Acc. (-)Debris Vol. Acc. (-)Mean Acc. Value (-)
Run10.44 0.59 0.97 0.67
Run20.93 0.73 0.86 0.84
Run30.97 0.79 0.72 0.82
Run40.99 0.73 0.77 0.83
Run50.84 0.69 0.91 0.81
Run60.71 0.72 0.81 0.75
Run70.07 0.51 0.11 0.23
Table 5. Parameters of impulse stress at the target area 1.
No.Concentration of Sediment–Water Mixture (m3/m3)Impact Velocity at Target Area 1
(m/s)
Water Density
(kg/m3)
Sediment Density (kg/m3)Impulse Stress
(kPa)
Run10.4516.410002000389.9
Run20.4819.810002000580.2
Run30.4221.510002000656.3
Run40.4718.410002000497.6
Run50.3919.210002000514.2
Run60.4920.810002000644.6
Run700.95100020000.9
Publisher’s Note: MDPI stays neutral with regard to jurisdictional claims in published maps and institutional affiliations.