Article

Copepod Assemblages at the Base of Mangrove Food Webs during a Severe Drought

by
Carolina Coelho Campos
1,*,
Hortência de Sousa Barroso
1,
Genuario Belmonte
2,
Sergio Rossi
1,2,
Marcelo Oliveira Soares
1,3 and
Tatiane Martins Garcia
1
1
Instituto de Ciências do Mar (LABOMAR), Universidade Federal do Ceará. Av. da Abolição, 3207, Meireles, Fortaleza 60165-081, CE, Brazil
2
Dipartimento di Scienze e Tecnologie Biologiche e Ambientali (DISTEBA), Università del Salento, Unnamed Road, 73100 Lecce, Italy
3
Leibniz Center for Tropical Marine Research (ZMT), Fahrenheitstraße 6, 28359 Bremen, Germany
*
Author to whom correspondence should be addressed.
Water 2022, 14(22), 3648; https://doi.org/10.3390/w14223648
Submission received: 4 October 2022 / Revised: 26 October 2022 / Accepted: 4 November 2022 / Published: 12 November 2022

Abstract

:
The effect of severe drought on the functional groups that sustain the base of the mangrove food webs in semi-arid areas is largely unknown. We therefore analyzed the intra-annual variation in the assemblages and functional groups of copepods in a shallow, low-inflow estuary of the Brazilian semi-arid coast when the most severe drought ever occurred. The lowest density was found in April (upstream region) and the highest in August (downstream region). Three main functional groups were identified, sorted by spawning strategy, and further subdivided according to feeding strategy, trophic regime, and diel vertical migration behavior. The community was significantly influenced by the extreme drought period, presenting a temporal homogenization in terms of composition, and an expressive and unexpected increase in density in the dry period, possibly due to phytoplankton blooms resistant to hypersalinity and the occurrence of copepod species adapted to stressful conditions. The few stress-tolerant species sustaining the food webs with seasonal variations were observed simplifying the trophic variability. The results indicate that hypersalinity can induce changes in the zooplankton community, increasing copepod mortality risk and, so, promoting alteration in the trophic estuarine dynamic.

1. Introduction

Copepods are an essential component of zooplankton in most of the water-based ecosystems and also in estuarine habitats, because of their abundance and biomass [1]. These small crustaceans prey on microorganisms such as phytoplankton and ciliates. They are considered a key group at the base of trophic pyramids, linking primary producers with higher trophic levels [2]. Describing their functional traits and the associated ecosystem biodiversity can aid in the understanding of their ecological roles [3].
Functional traits are phenotypic characteristics that indirectly affect the growth, reproduction, or survival of an organism, and consequently have a relevant role on the effects of ecosystem properties [4]. Copepod assemblages are taxonomically and functionally diverse [5], and their feeding type and reproduction strategies may vary depending on the environmental constraints [6,7,8]. Thus, studying species based on their functional characteristics can increase our knowledge of how ecosystems function more realistically than the taxonomic groupings alone [8,9].
Copepod assemblages have a temporally heterogeneous composition that changes based on intra-annual environmental modifications between the rainy and dry periods in tropical estuaries [10,11]. An understanding of this intra-annual variation is important in order to describe and quantify the different estuarine communities [12] that alternate between seasons, and how each community survives unfavorable periods [13]. Precipitation has been recognized as a critical factor that causes seasonal variations in copepod communities in subtropical environments, and these freshwater/turbid inputs restrict their spatial distribution along the estuary [14]. The intensity and level of freshwater discharge can influence features such as salinity, temperature, nutrients, primary productivity and water residence time, affecting the temporal dynamics of estuarine assemblages [12].
A hypersaline regime can occur in estuaries where the hydrological deficit exceeds the evaporation rates from rainfall and river flow inputs. The resulting salinity exceeds that of coastal waters and increases further from the coastline [15]. This regime is common in semi-arid and arid estuarine regions [16,17]; however, hypersalinity is a phenomenon that has been intensifying worldwide. This phenomenon is caused by the combination of local human impacts, such as dams, weirs, irrigation [18], and climate change impacts, such as increasing sea surface temperature, sea-level rise, drought, and annual precipitation reduction [19]. This hypersalinity influences the spatial and temporal variation of estuarine organisms [20] and the functional groups at the base of estuarine food webs [2,14].
Copepod assemblage studies in tropical estuaries with large river flow revealed the highest abundance in the rainy season and the highest diversity during the dry season [21,22]. However, information on intra-annual dynamics in hypersaline mangrove ecosystems and the potential consequences for the food webs are scarce. Global climatic changes create more severe and prolonged droughts, especially in arid and semi-arid coastal regions [23,24]. The effect of drought on functional groups that sustain the base of mangrove food webs is unknown. Thus, the present study aimed to carry out a baseline study, evaluating the intra-annual distribution of assemblages and functional groups of copepods in a tropical low-inflow estuary in response to hypersalinity over one year (2015) considered the worst drought ever recorded in the Southwestern Atlantic (Brazil) [23]. Our hypothesis is that extremely high values of salinity can reduce the number of copepod species, over the course of a year, with few species sustaining the food webs.

2. Materials and Methods
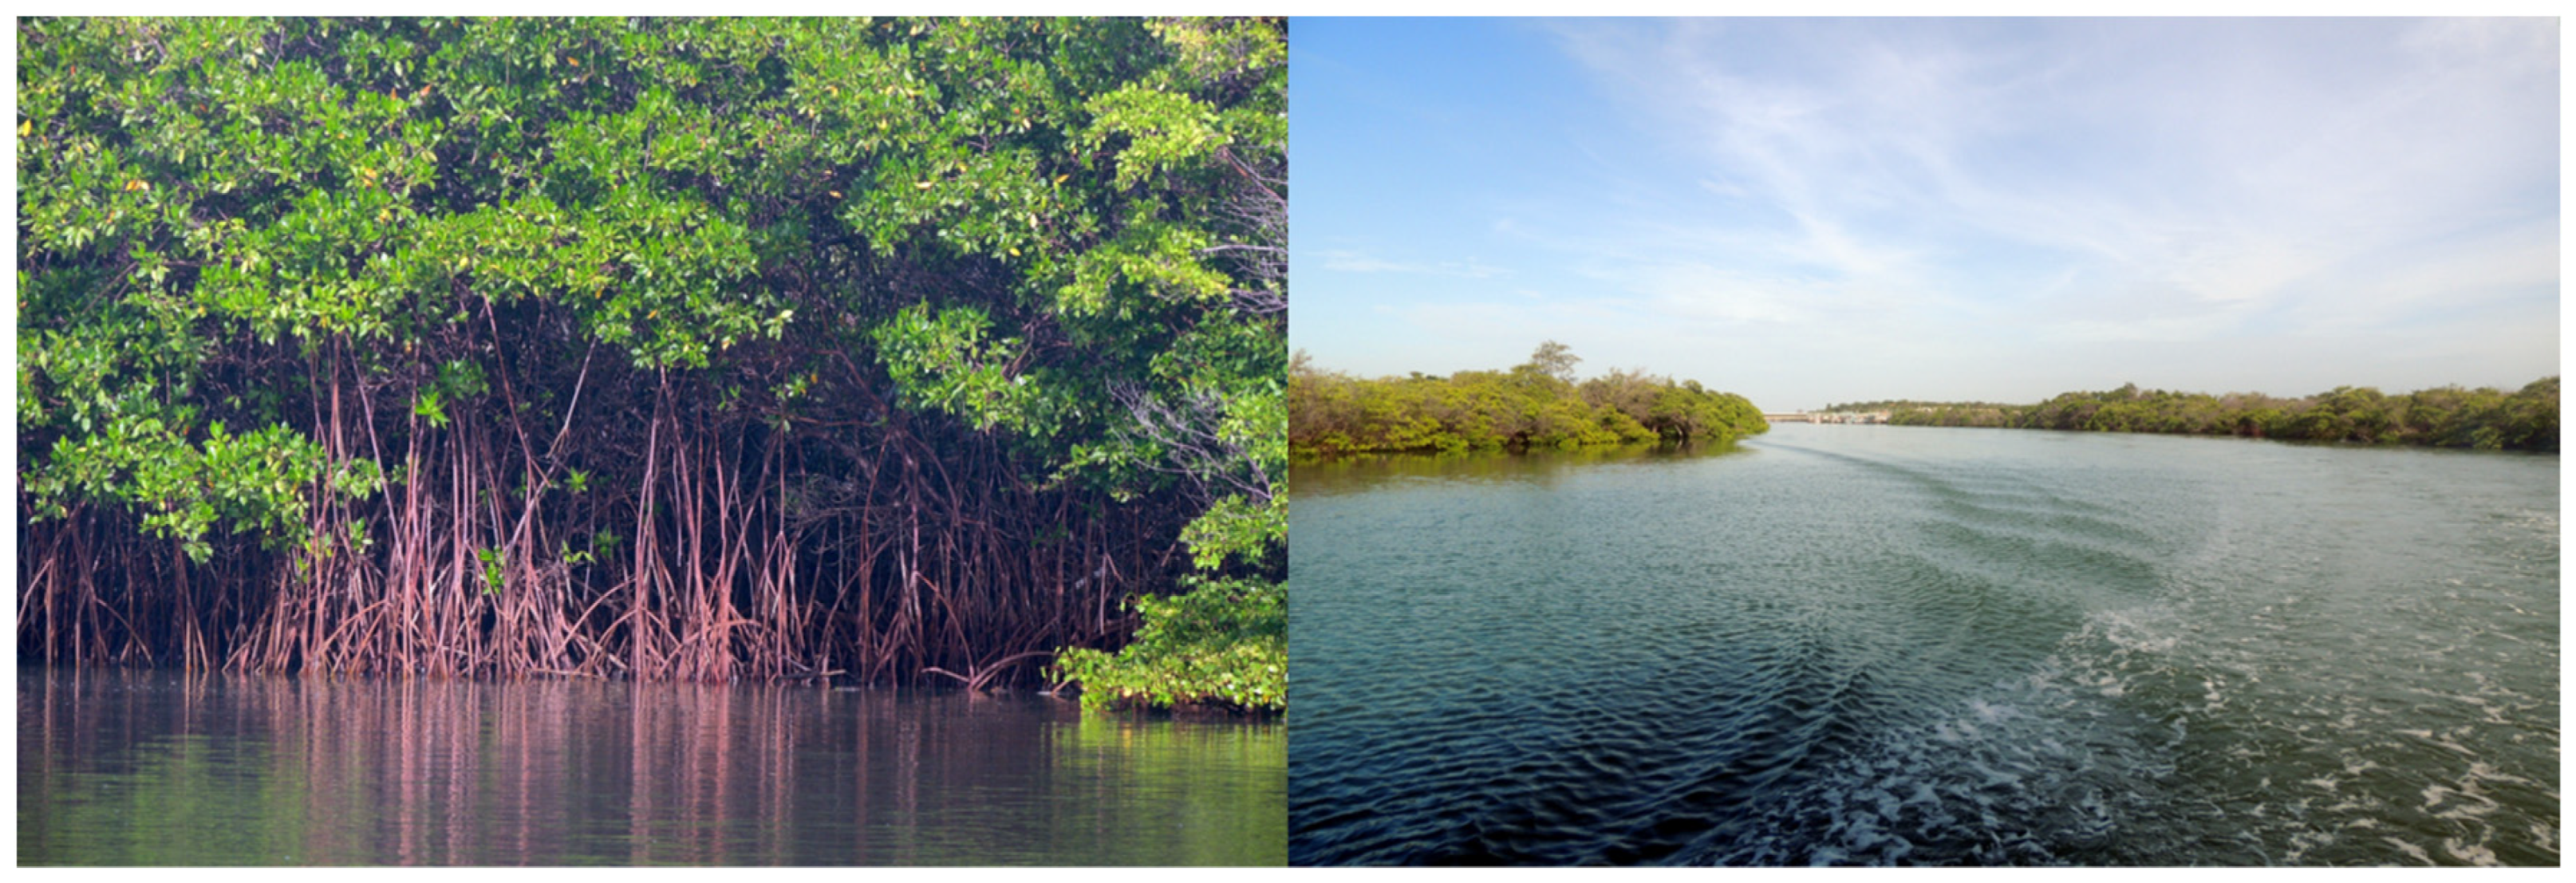
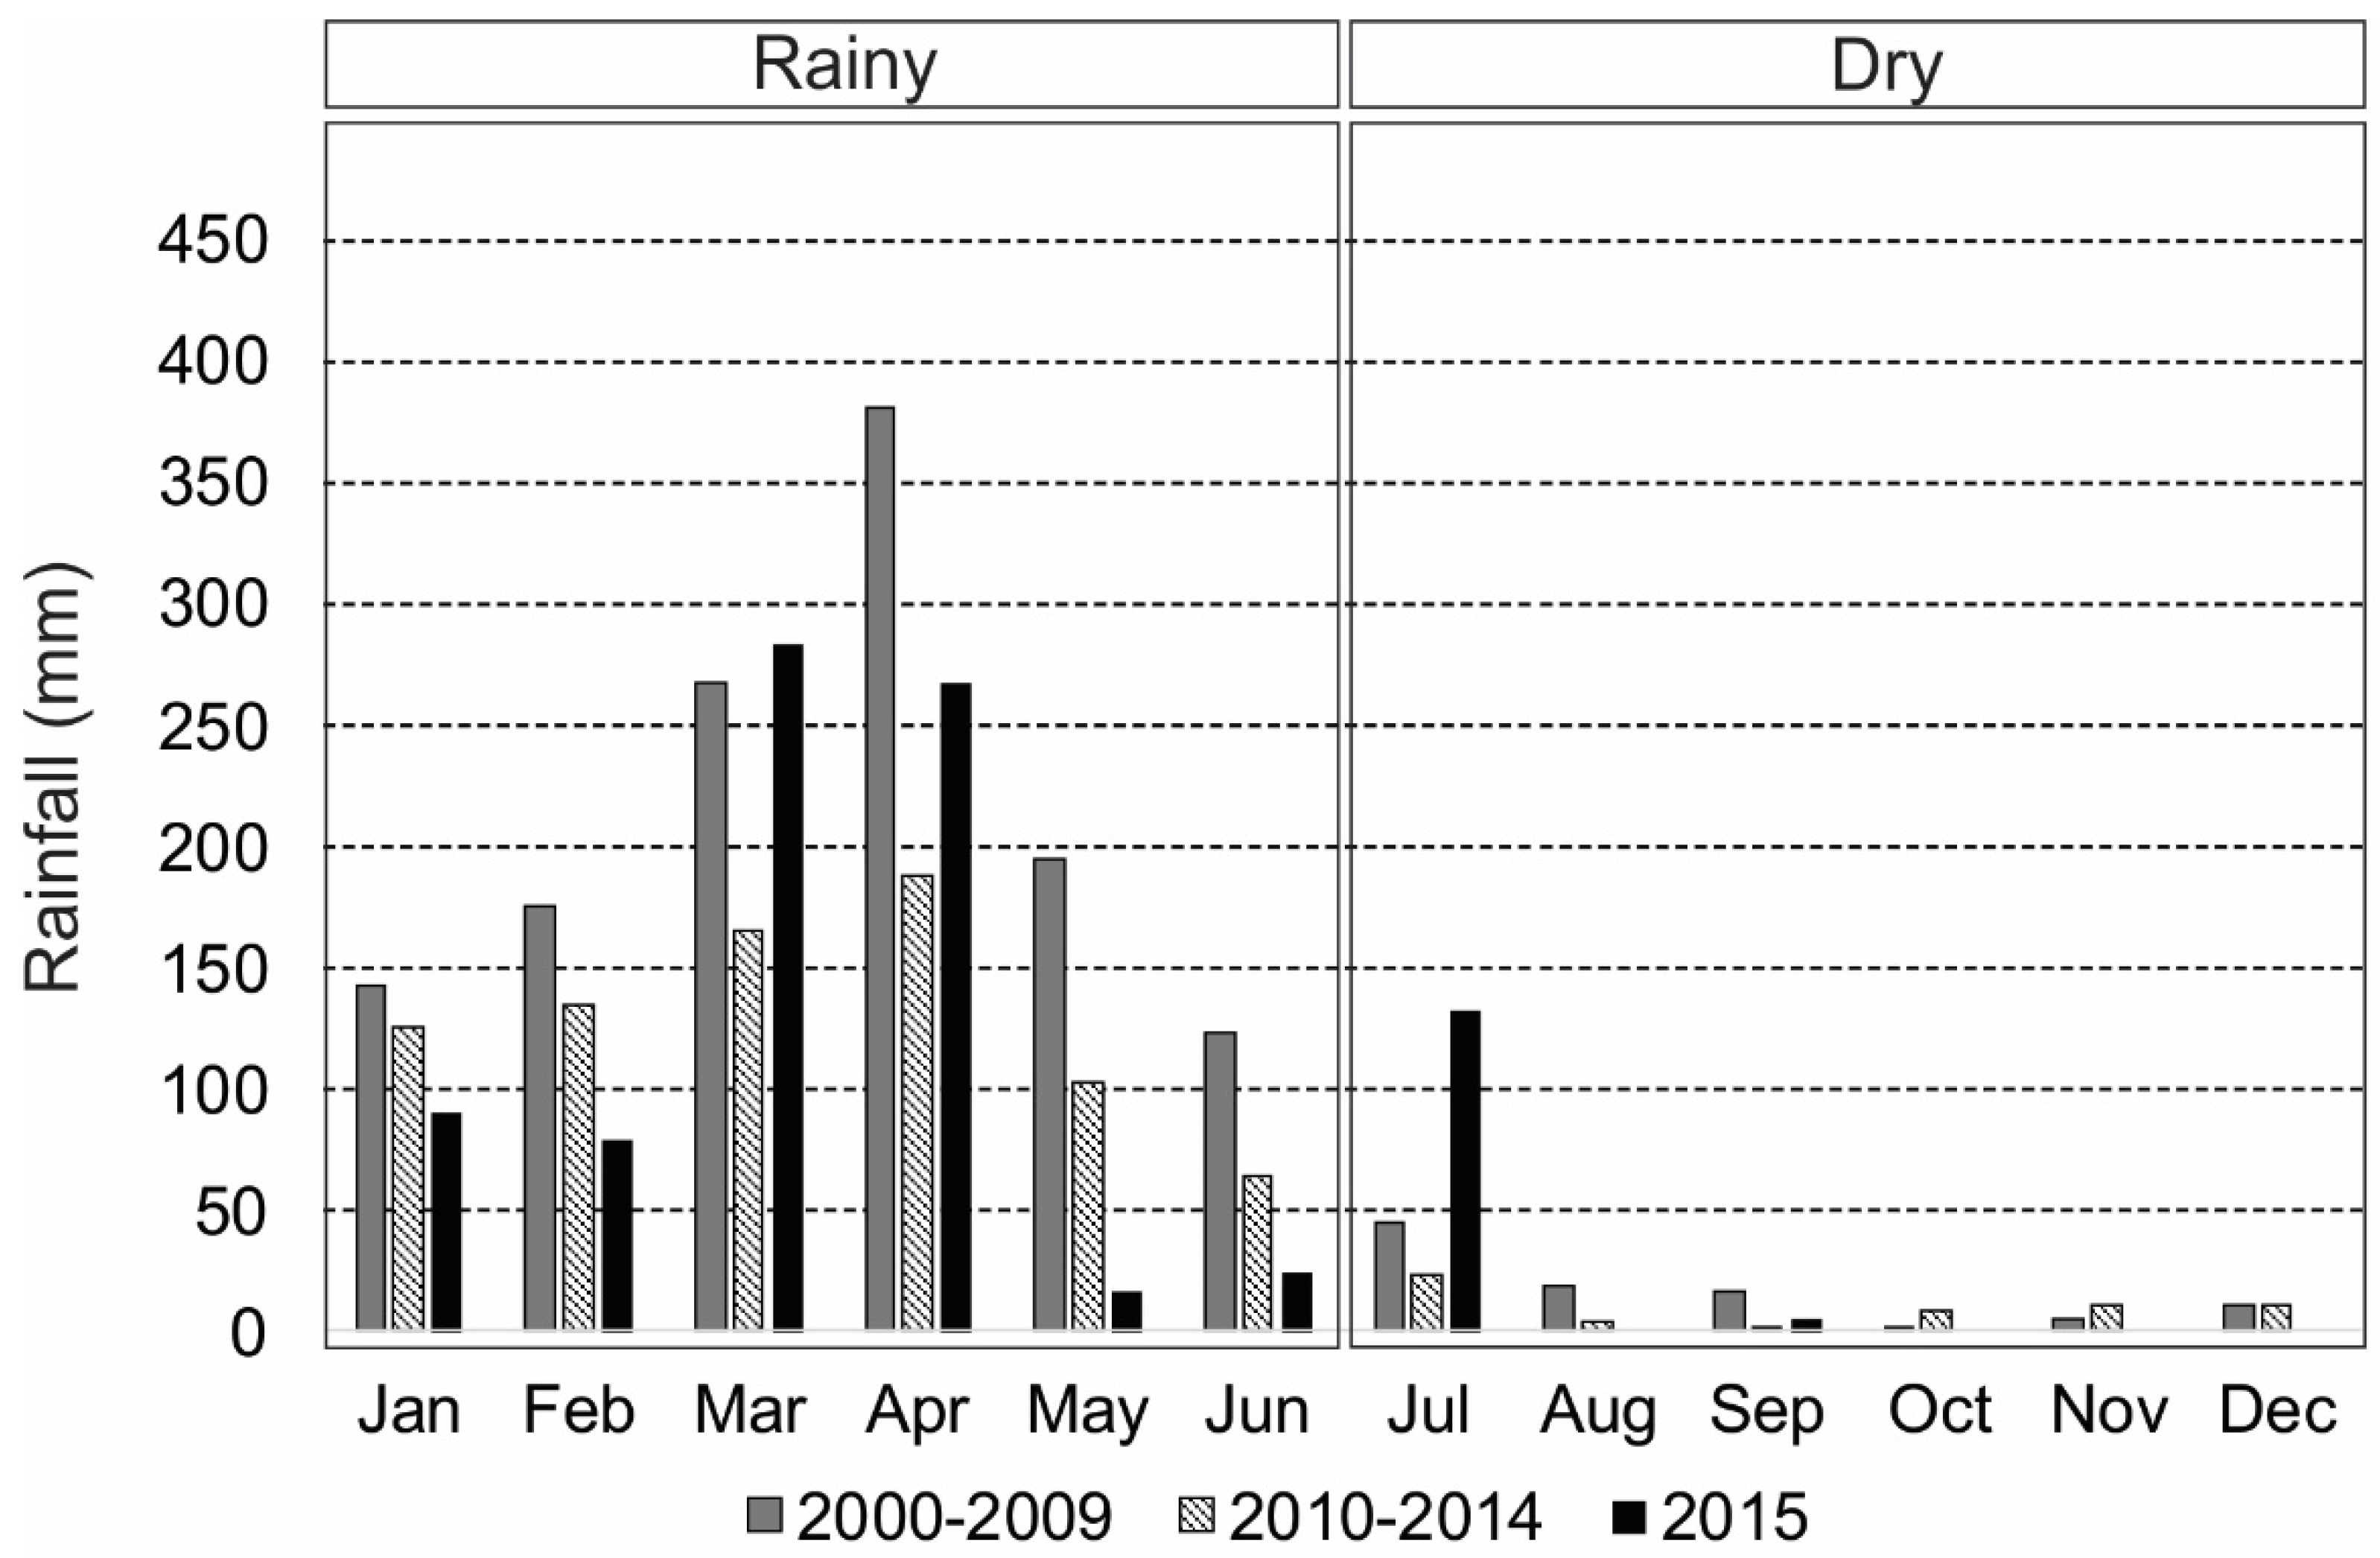
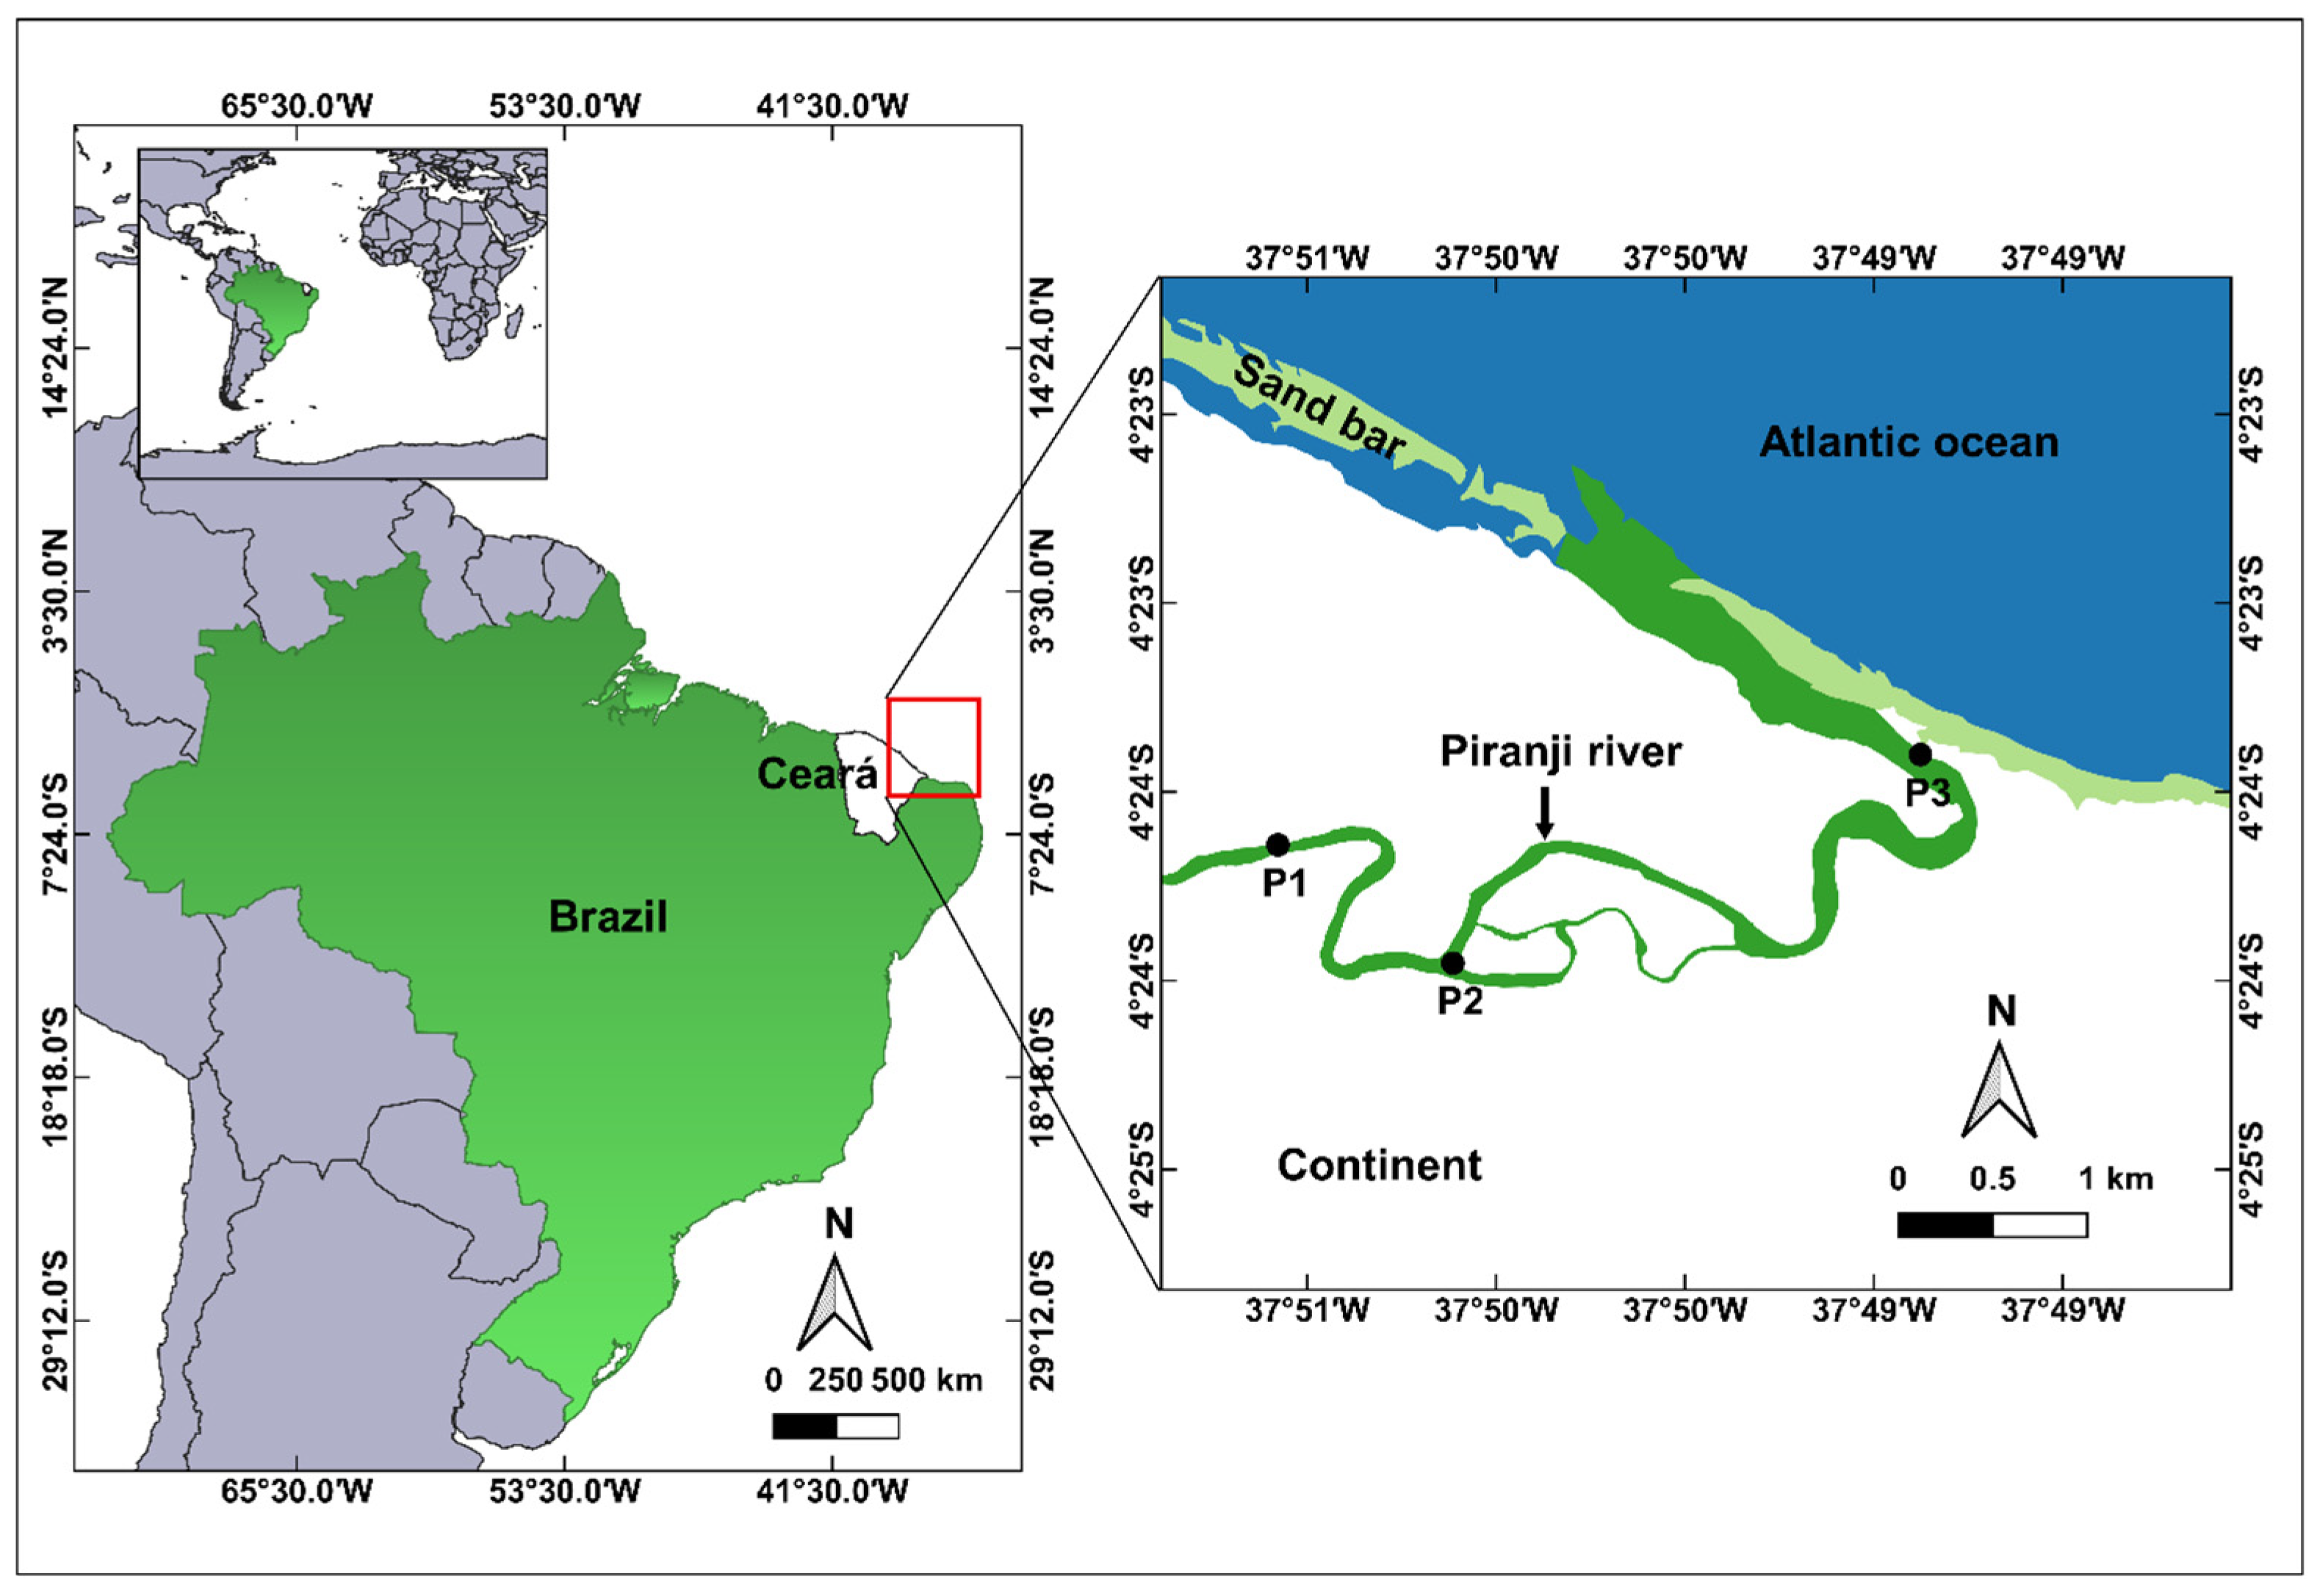
2.1. Study Area

The Piranji Estuary is a mesotidal, semi-diurnal coastal system [25] located in the equatorial southwestern Atlantic (Northeast Brazil). It is a short (~20 km long) and shallow (~3 m) system where hypersalinity occurs naturally, making it an excellent model to evaluate the effects of hypersalinity on copepod assemblages (Figure 1); the salinity levels inside the estuary exceed the values generally found near the coastal ocean (sal. 34.5–36) [26]. The Piranji River is formed by tidal channels, extensive intertidal flats, shallow navigation channels, and low freshwater inflow [27,28]. Absence of salinity stratification in the water column is a feature of this low-inflow estuary [29]. There is a sandbar (spit type) at the river mouth parallel to the coastline, approximately 3.2 km long and 230 m wide [30]. The regional coastal climate is classified as a hot, semi-arid climate (BSh) according to the Köppen climate classification, and it is mainly influenced by the region’s position in the intertropical convergence zone (ITCZ), which causes two distinct seasonal periods of precipitation. The rainy season runs from January to June, and the dry season runs from July to December (Figure 2).
Hypersaline conditions are related to several factors, such as climate (semi-arid region), the presence of multiple dams along the river basin [28], high evaporation rate and surface runoff [31] and shallow depth (mean 2.44 m) [27]. The Piranji Estuary also displays hyperthermal conditions (estuary water temperature approximately 2 °C above the coastal water temperature) [29] and decreasing fluvial discharge, related to intense droughts [27] and to the last drought cycle (2012–2016) in this location [23]. Intra-annual sampling was conducted in 2015 during this severe drought. The historical rainfall data (1988–2011) and data for the last drought cycle (including the sampling year, 2015) and the most recent years (2017–2020) are presented in Figure 3.

2.2. Intra-Annual and Spatial Sampling and Analysis

Intra-annual and spatial samplings were performed at three stations (P1, P2, and P3) along the river basin (P1, P2, and P3) to determine the spatial distribution of copepod assemblages. P1 was located upstream, P2 in an intermediate zone, and P3 was closest to the estuarine mouth in the downstream region (Figure 1). Six ebb tide campaigns were conducted in 2015; three in the rainy season (February, April, and June) and three in the dry season (August, October, and December).
The zooplankton samples were collected by horizontal trawls in the subsurface estuarine water layer with plankton netting (120 µm mesh) and equipped with a general oceanic flowmeter. Immediately after collection, samples were preserved in buffered formalin (10%) [33]. Samples were first analyzed under a stereomicroscope to identify copepods to the lowest possible taxonomic level using appropriate identification keys [5,34,35]. The samples were further sub-sampled (from 1/32 to 1/1024) using a Motoda splitter [33], and taxa were then counted. The abundance of copepod species was expressed as the number of individuals per cubic meter of filtered water (ind.m−3).

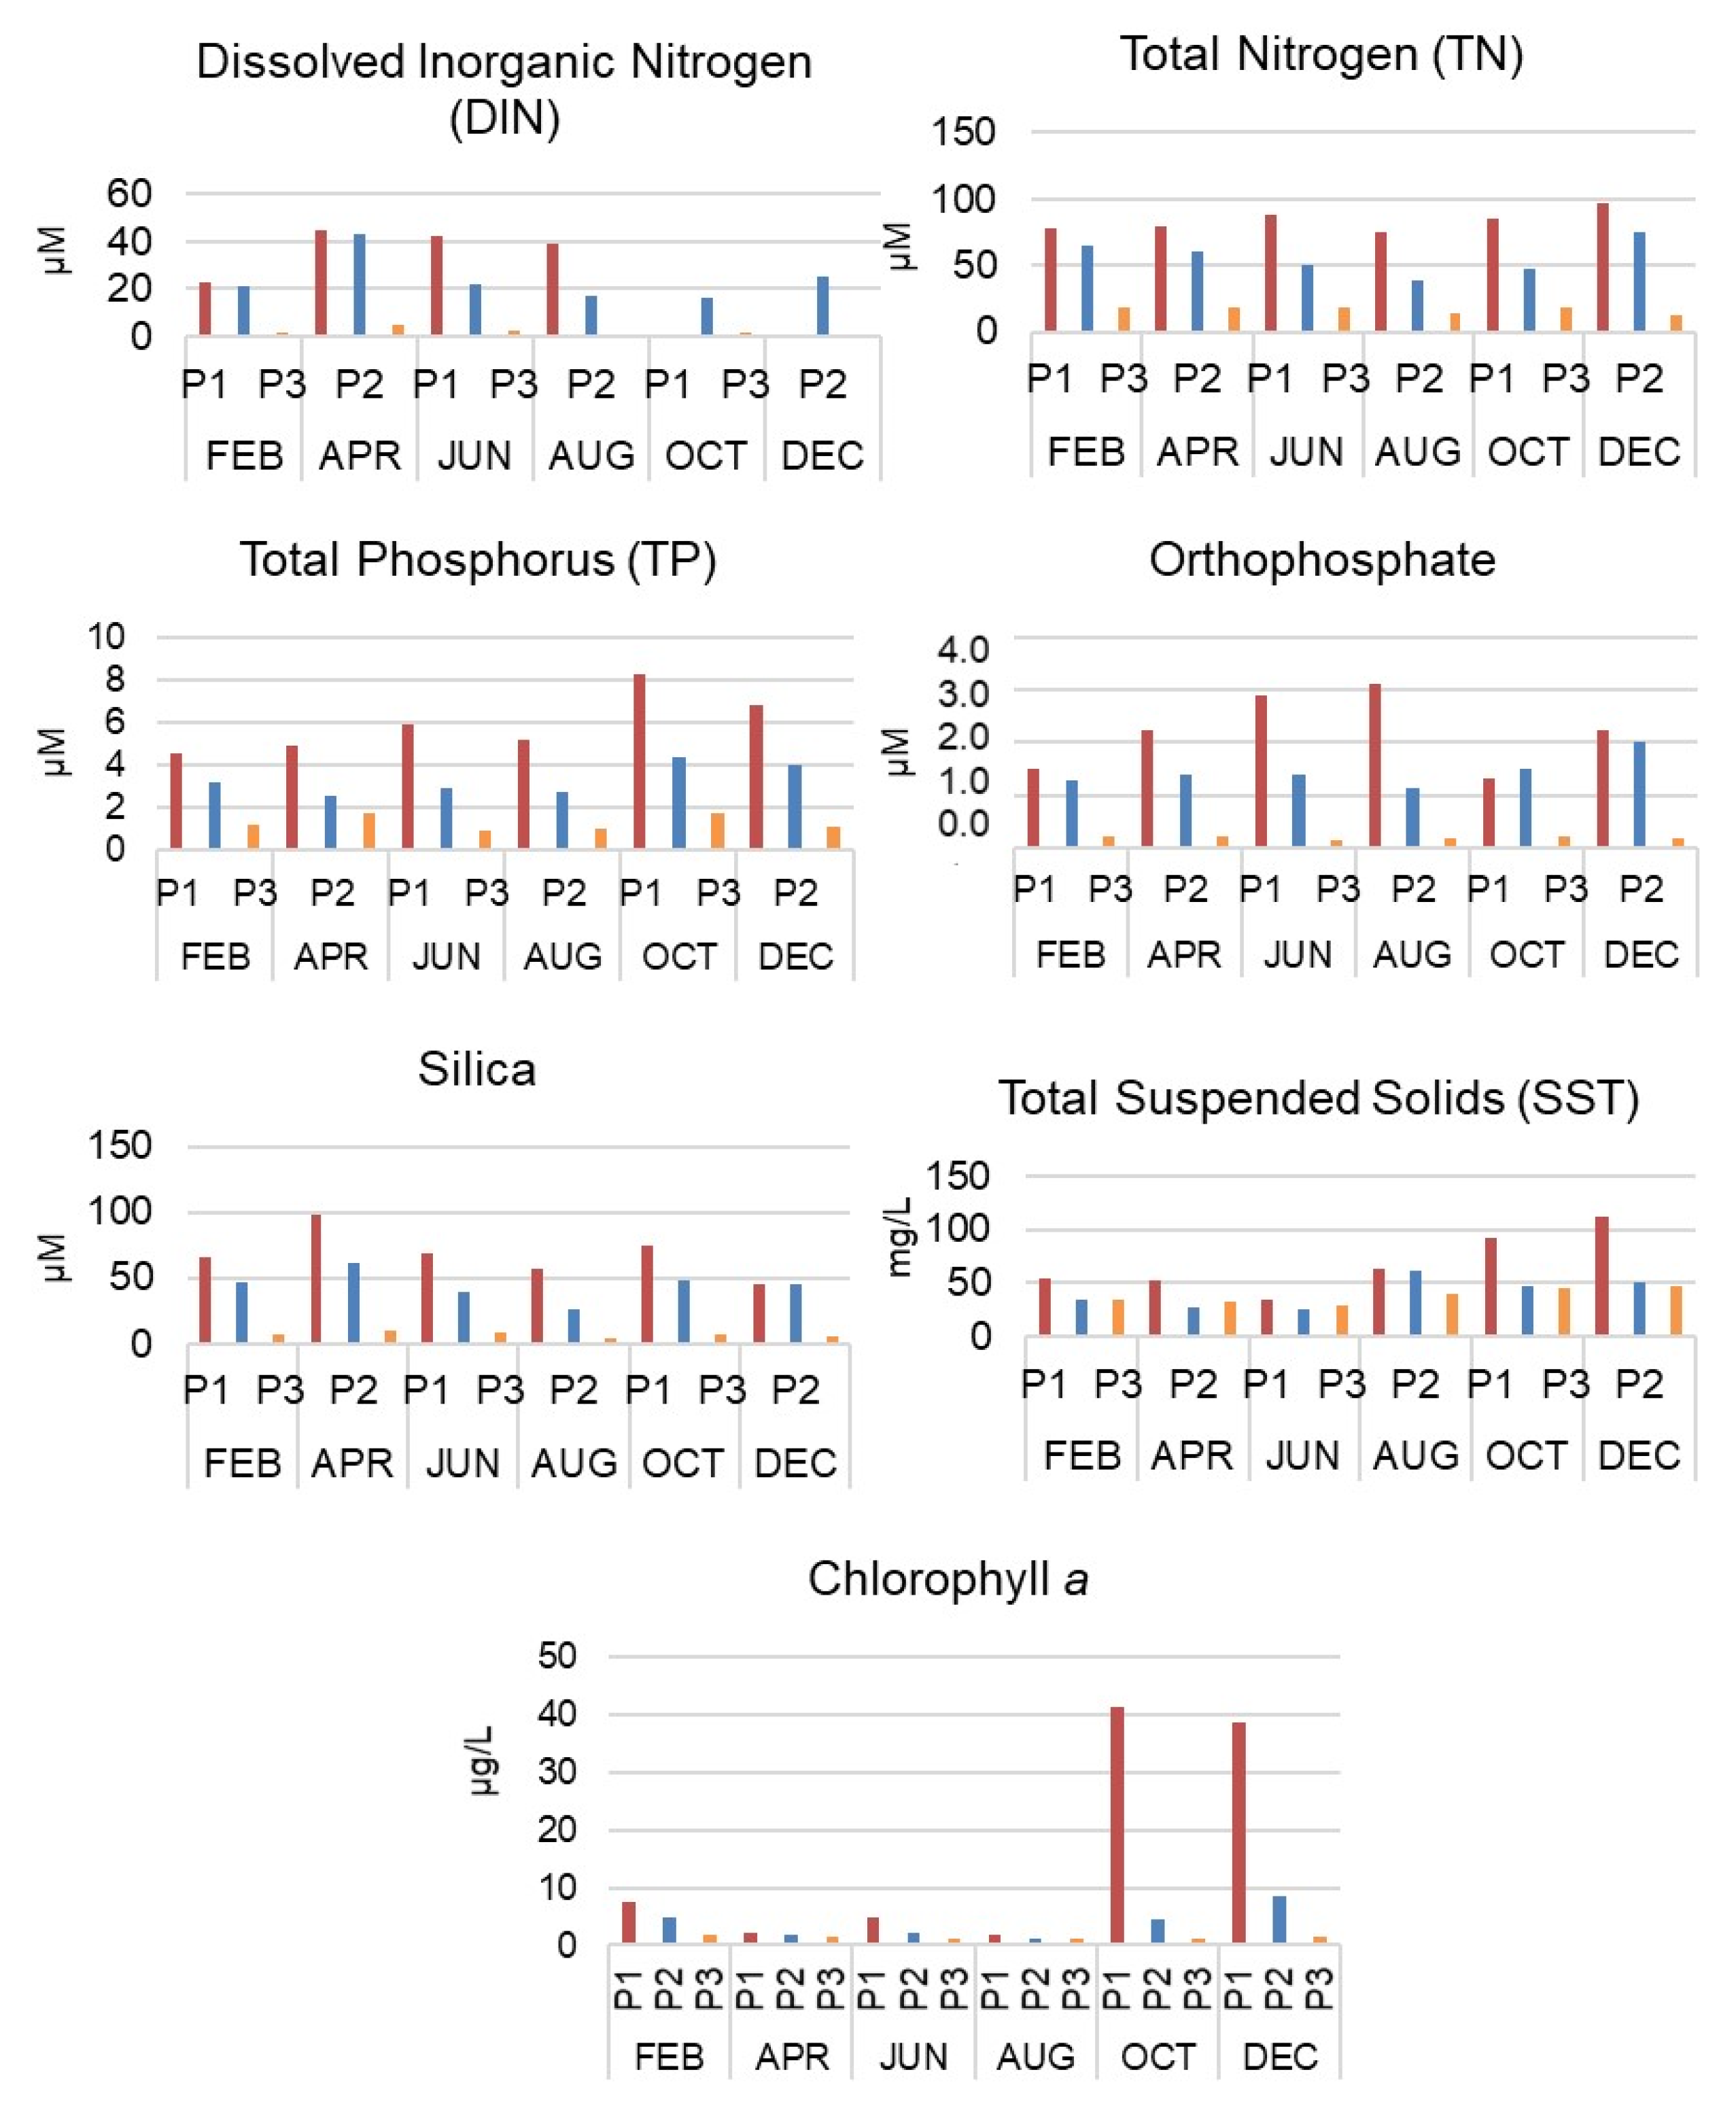
2.3. Intra-Annual Environmental Analysis: Physicochemical Factors and Phytoplankton Pigments

Environmental variables (temperature, salinity, pH, dissolved oxygen, and depth) were measured in situ using a multi-parametric probe (YSI 6660). To determine chlorophyll a, aliquots of water were collected from the subsurface with a Van Dorn bottle and were filtered through 0.7 µm pore size glass-fiber filters (47 mm in diameter, type GF-3, Macherey-Nagel, Düren, Germany) in triplicate. After filtration, the filters were kept frozen for subsequent spectrophotometric determination of chlorophyll a and pheophytin a using extraction in 90% acetone (method 10200H) [36].
To determine dissolved nutrients, samples were filtered in triplicate through 0.7 μm pore size glass-fiber filters (47 mm diameter, type GF-3, Macherey-Nagel, Düren, Germany). Some samples were excluded for determining silica and were filtered through membranes of mixed cellulose esters with a porosity of 0.45 µm (47 mm diameter, HATF, Millipore, Billerica, MA, USA). The analysis of dissolved nutrients (ammoniacal N, nitrite, nitrate, phosphate, and silicate) was carried out according to the spectrophotometric methods described by [37] for marine and estuarine waters. Nitrite, nitrate and phosphate samples were kept refrigerated at 4 °C and analyzed within 48 h after the collection, ammoniacal N within 24 h and silicate samples were frozen to −20 °C and analyzed within a few weeks. The samples used to determine total nitrogen (TN) and total phosphorus (TP) were not filtered before analyzing using spectrophotometric methods [38]. For TN and TP, the unfiltered samples were previously oxidized after collection [38] and analyzed within a few weeks. After filtering the samples for nutrient determination, filtrations were also carried out with fiberglass filters with 1.2 µm porosity (Millipore APFC) that were previously dried in an oven at 105 °C and calcined in a muffle furnace at 480 °C, to determine total suspended solids (TSS) using gravimetry according to the 2540 D method [36].

2.4. Data Analysis

The abundance (ind.m−3) of all copepod species was calculated at the sampled stations. Cluster analysis was used in conjunction with the Bray–Curtis similarity index to compare copepod assemblages during the sampling months. The data were log(x + 1) transformed. The cluster analysis was performed using the unweighted pair group method with arithmetic mean (UPGMA) based on the Bray–Curtis similarity index. The differences between cluster groups were tested using similarity profile analysis (SIMPROF) using PRIMER version 6. The species that contributed to each group were evidenced by similarity percentage (SIMPER) analysis. BEST (BIO-ENV stepwise) analysis was performed to determine the importance of environmental variables on intra-annual copepod assemblages under extreme drought conditions in 2015.
Finally, a literature review on copepod functional traits was performed (Supplementary Material SI). The functional traits were compiled into a matrix that included feeding type (active ambush feeding, passive ambush feeding, filter-feeding, cruise feeding, or mixed feeding), trophic group (herbivore, carnivore, omnivore, detritivore, herbivore-omnivore, omnivore-carnivore, or detritivore-carnivore), reproduction method (broadcast spawner or sac spawner), and diel vertical migration (DVM) activity. Six species (Harpacticoida sp1, Harpacticoida sp2, Harpacticoida sp3, Parvocalanus cf. scotti, Pseudodiaptomus marshi and Pseudodiaptomus trihamatus) were not included in this analysis because there were no data regarding their functional traits. Therefore, fourteen species were used to analyze the functional groups. These groups were based on the Euclidean distances assessed using the SIMPROF test at 5% significance.

3. Results

3.1. Intra-Annual and Spatial Variation: Environmental Data

The estuary showed a low depth (3.4 ± 1.1 m) throughout the 2015 year, with stable values for temperature (27.5 ± 0.9 °C), pH (8.0 ± 0.4) and dissolved oxygen (5.6 ± 0.5 mg/L) (Table 1). An increasing gradient of nutrients was observed throughout the year from the downstream station (P3) to the upstream station (P1) (Figure 1). The downstream site (P3) was more stable and had low nutrient concentrations dominated by oligotrophic marine waters (Figure 4). Chlorophyll a varied spatially, with values decreasing from the point furthest upstream of the river (P1) to the point closest to the mouth (P3). A clear spatial variation during the year was observed at points 1 and 2, where chlorophyll a was initially very low, but then increased significantly in the driest months of October (P1 = 41.31 µg/L) and December (P1 = 38.60 µg/L) (Figure 4).
The values of salinity varied from 9.0 to 63.0 (Table 2). The hypersalinity condition increased toward the upstream station (P1) and occurred in most assessed months (February, June, August, October, and December) except April. The highest (62.2) and lowest (9.4) salinity values were obtained from the upstream station (P1) in December and April, respectively. A classic estuary, where salinity increases towards the downstream station (P1 < P2 < P3), was only observed in April. In other months, salinity values increased upstream (P1 > P2 > P3) (Figure 5), and the hypersaline estuary was classified as inverse during most parts of the year (Table 2).

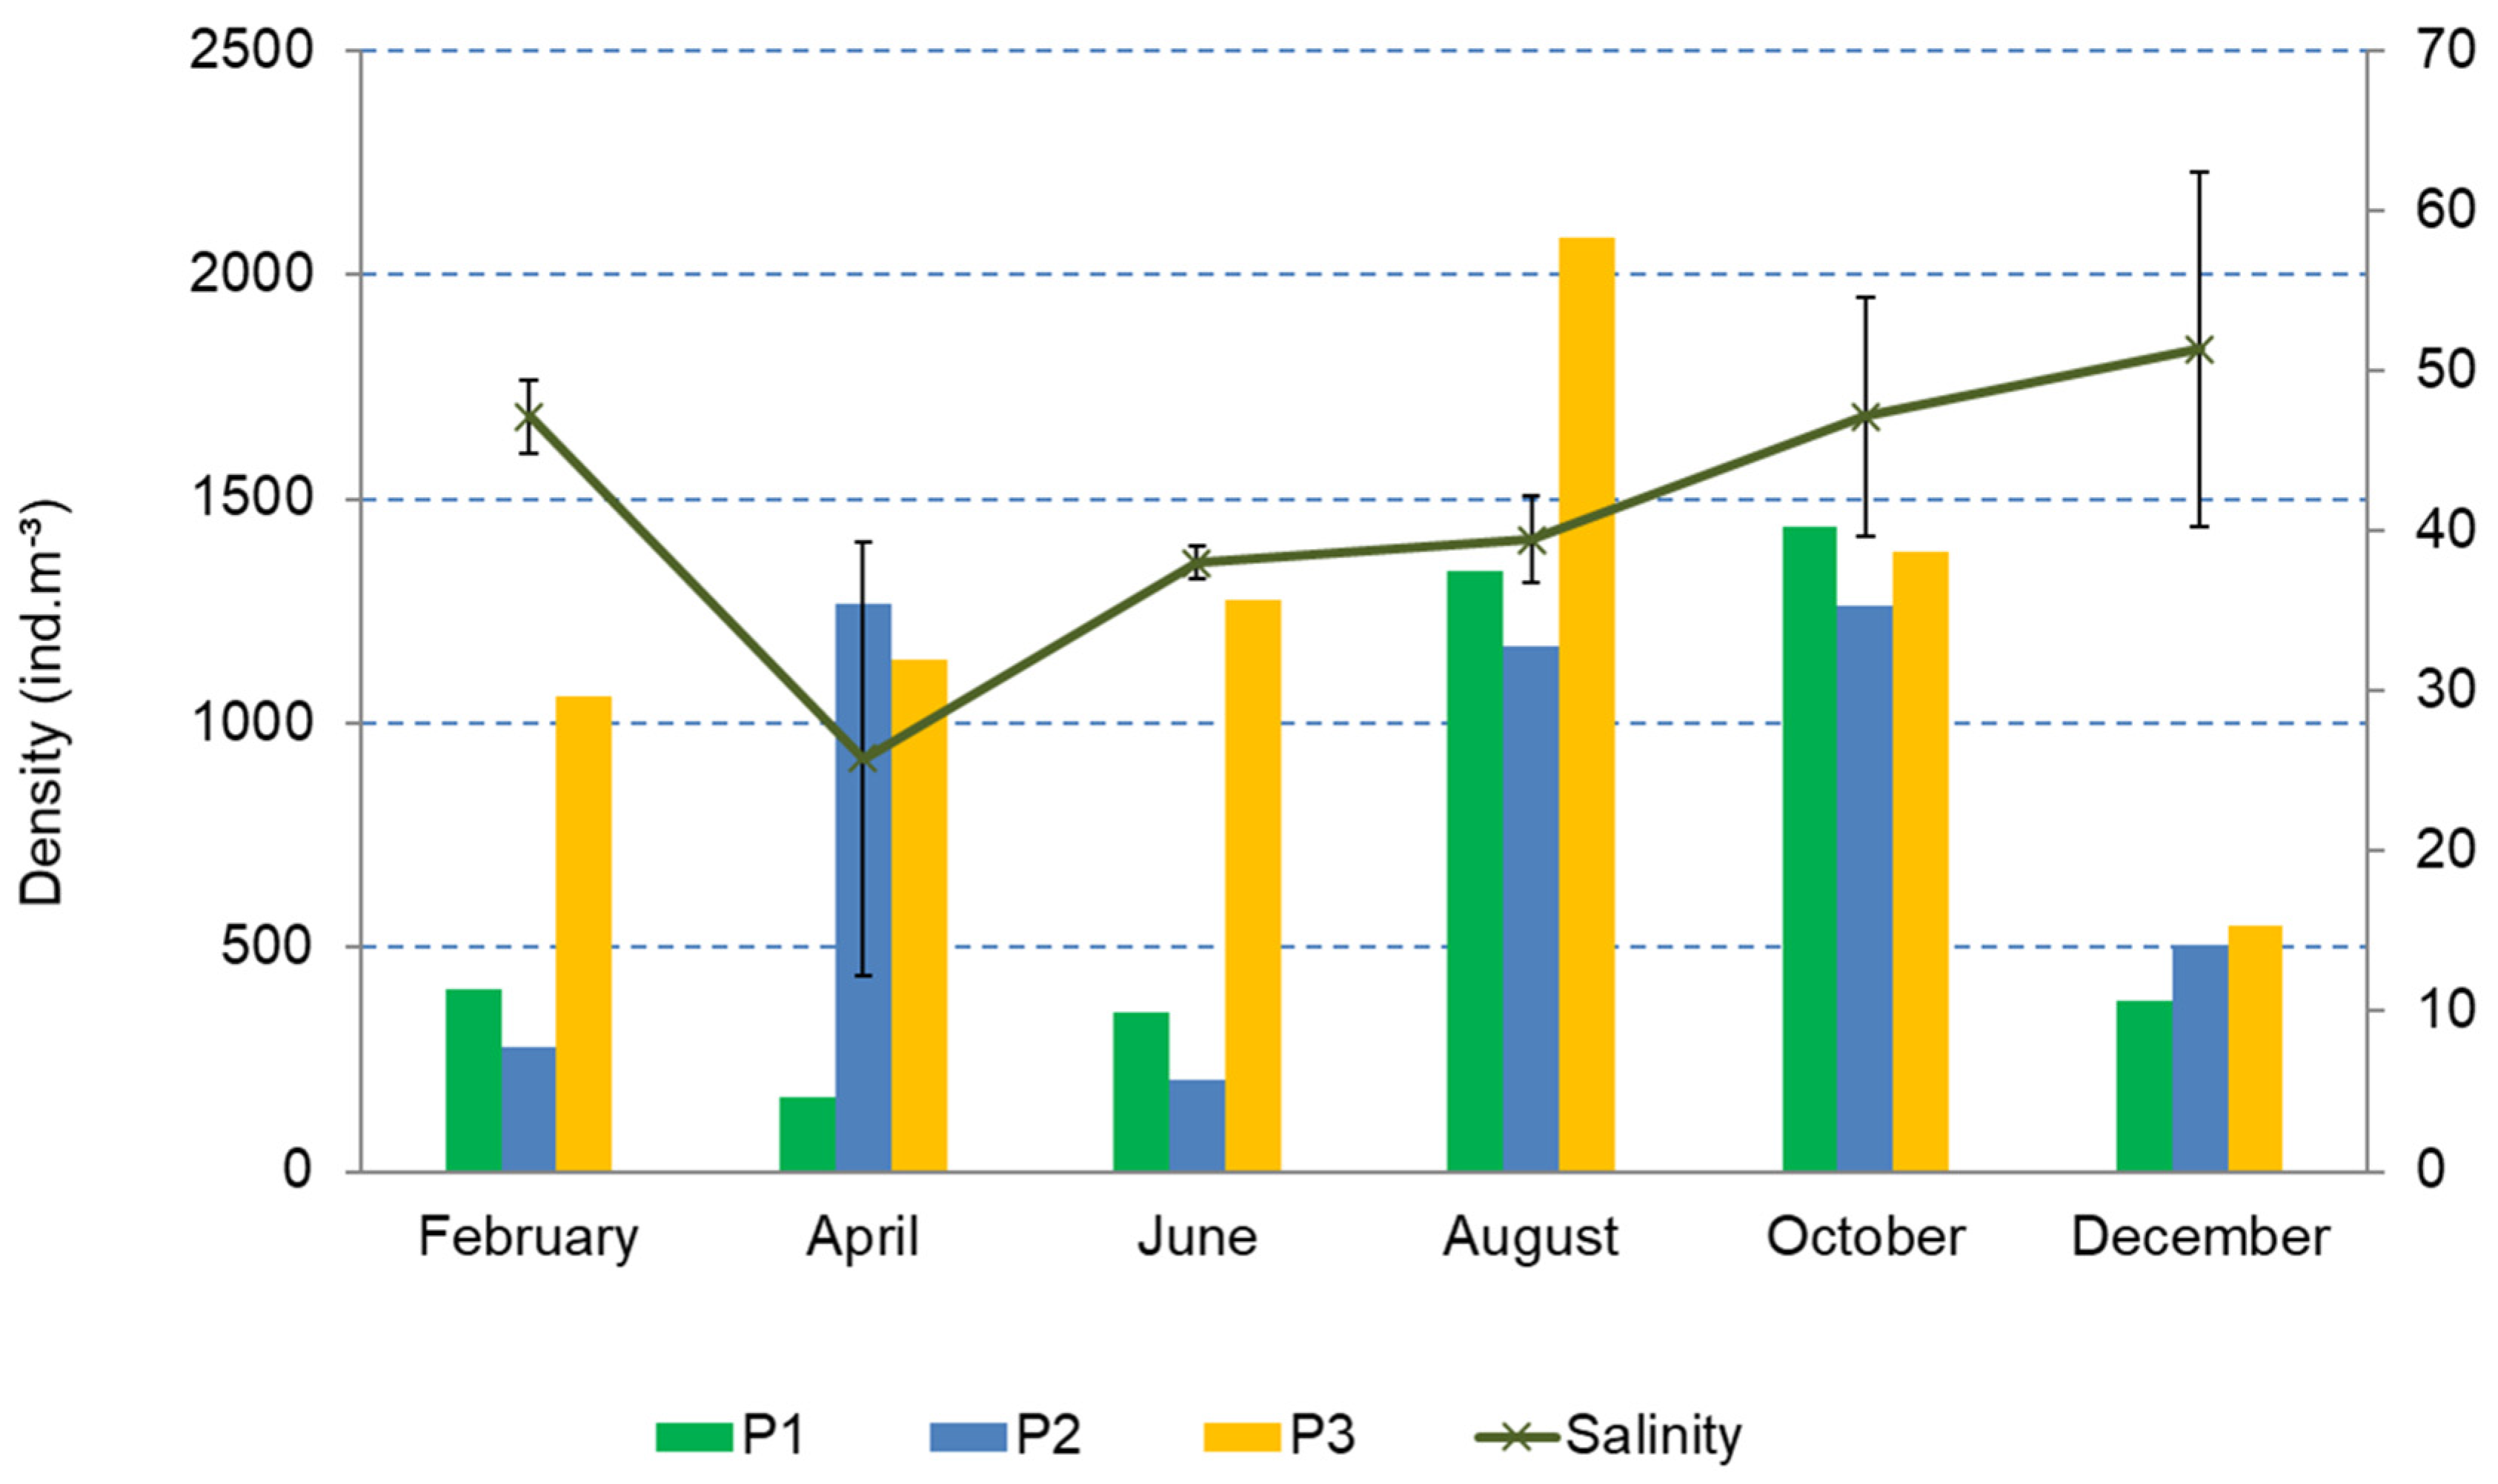
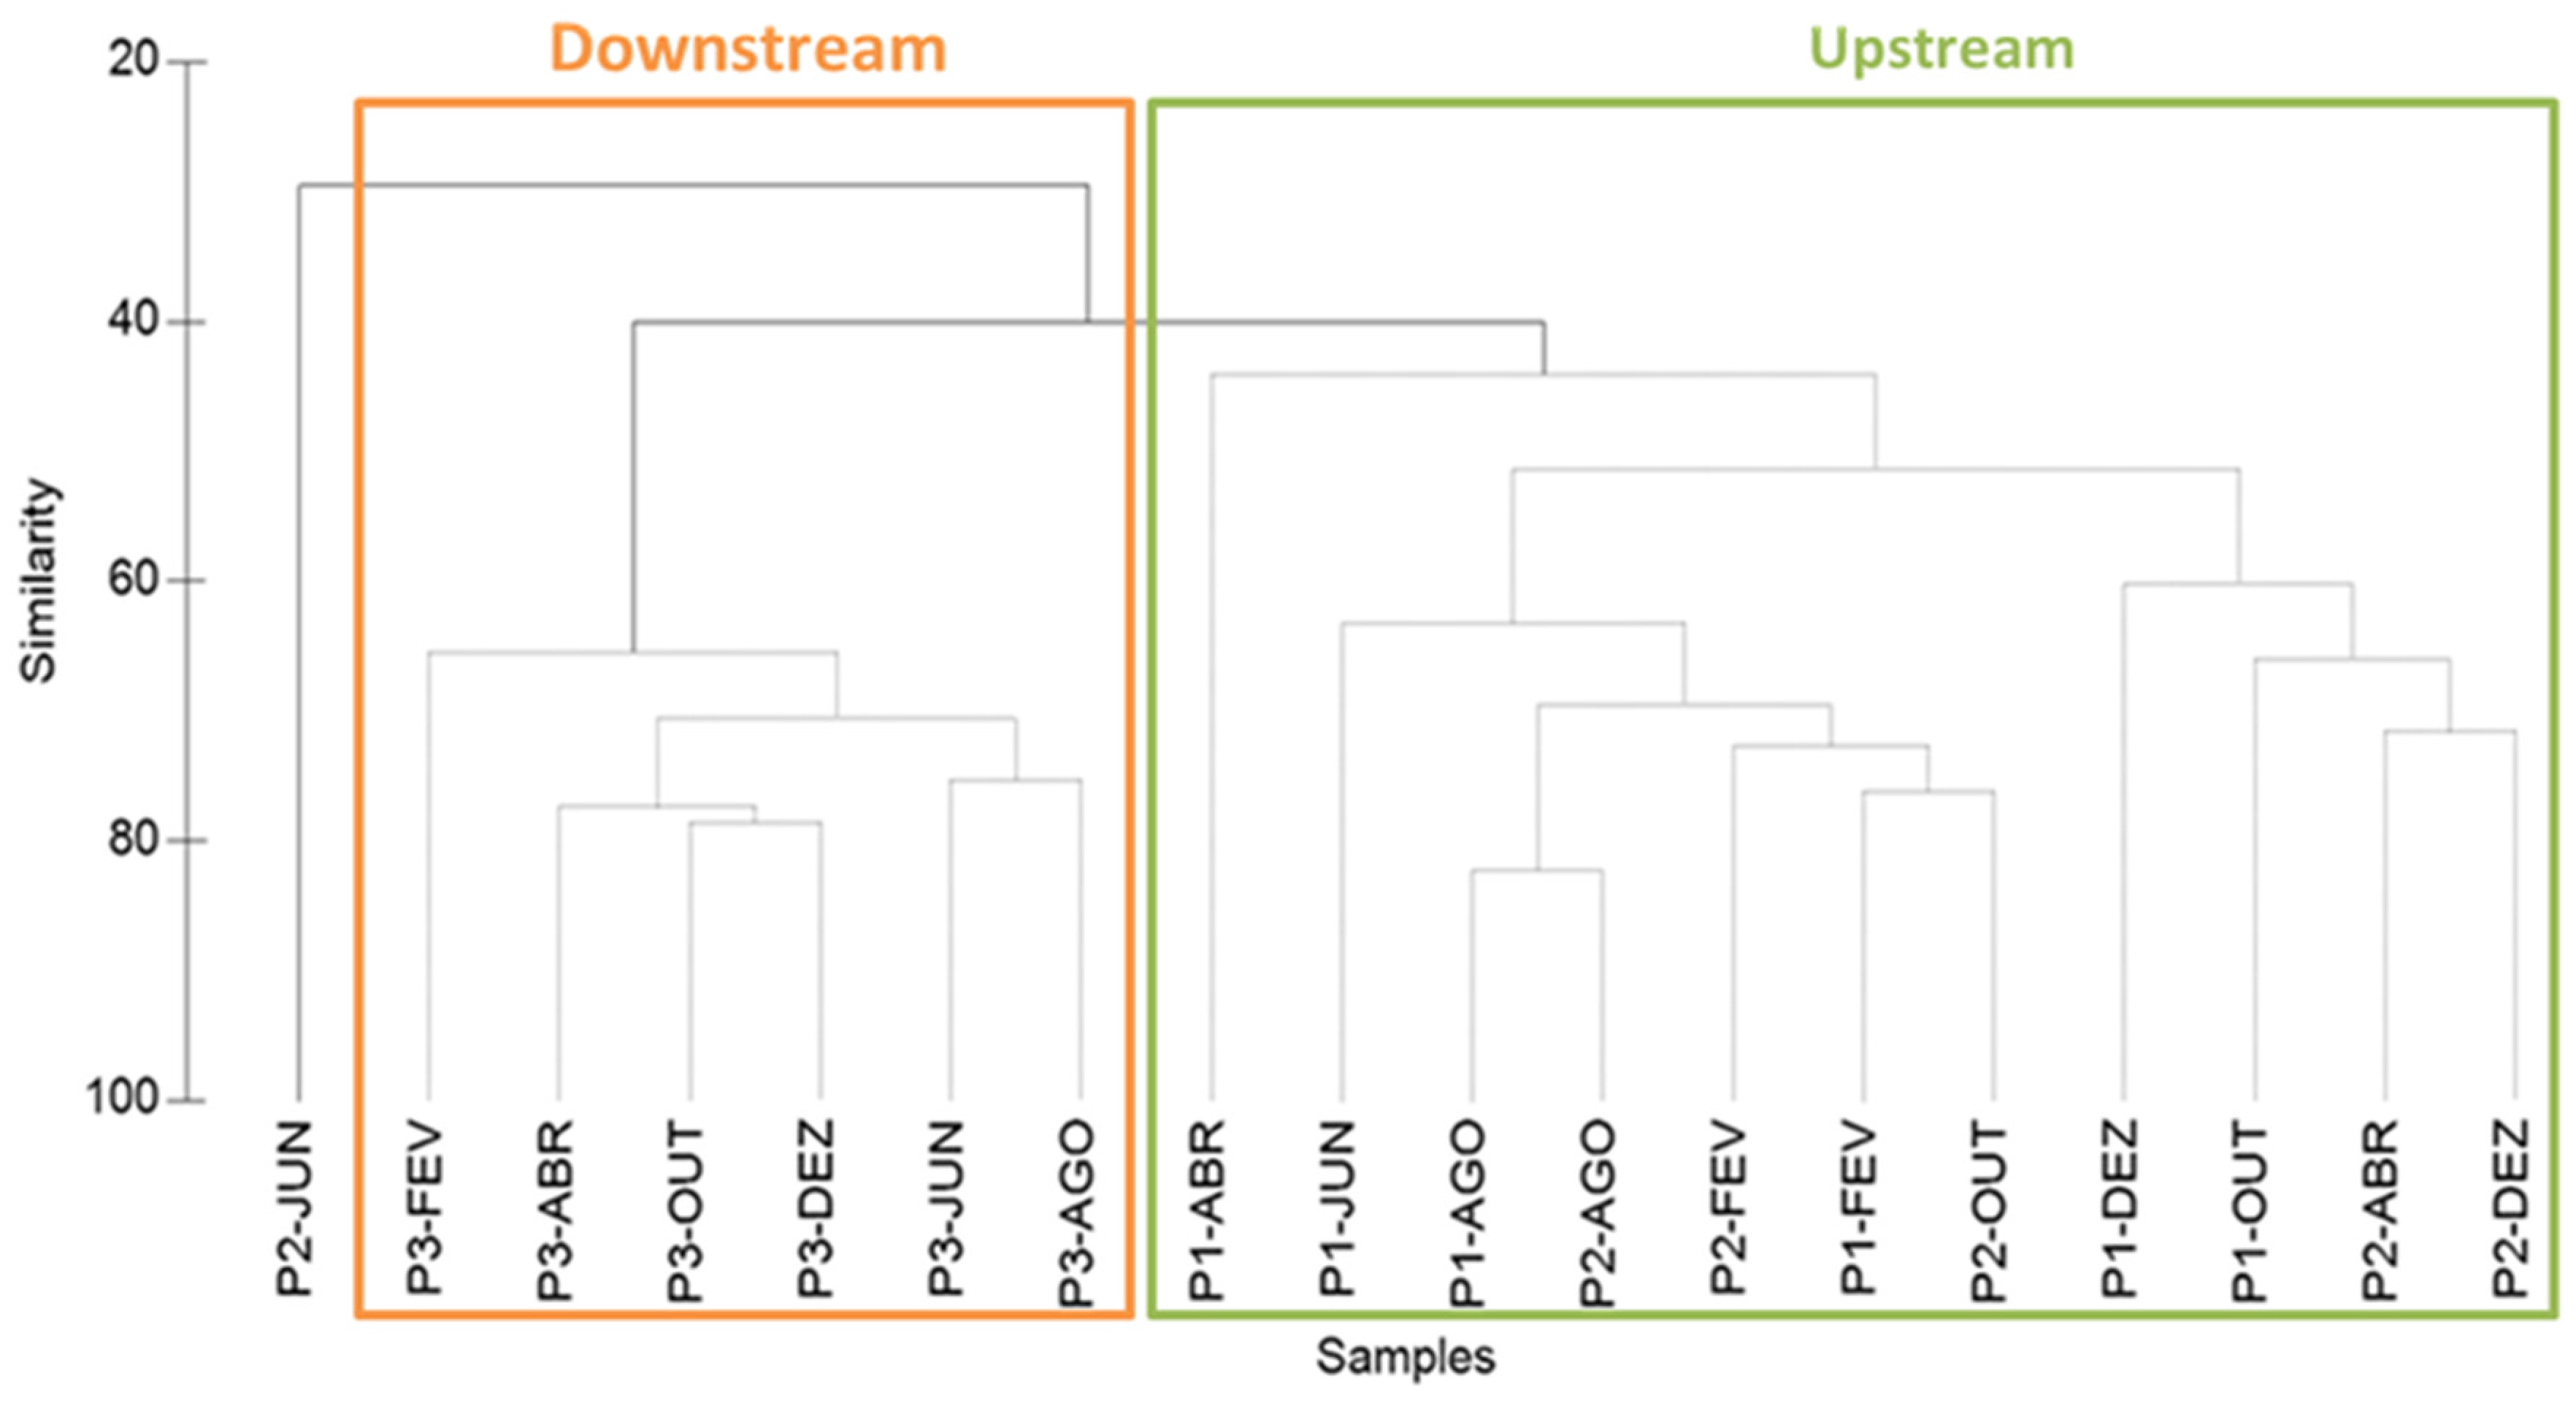
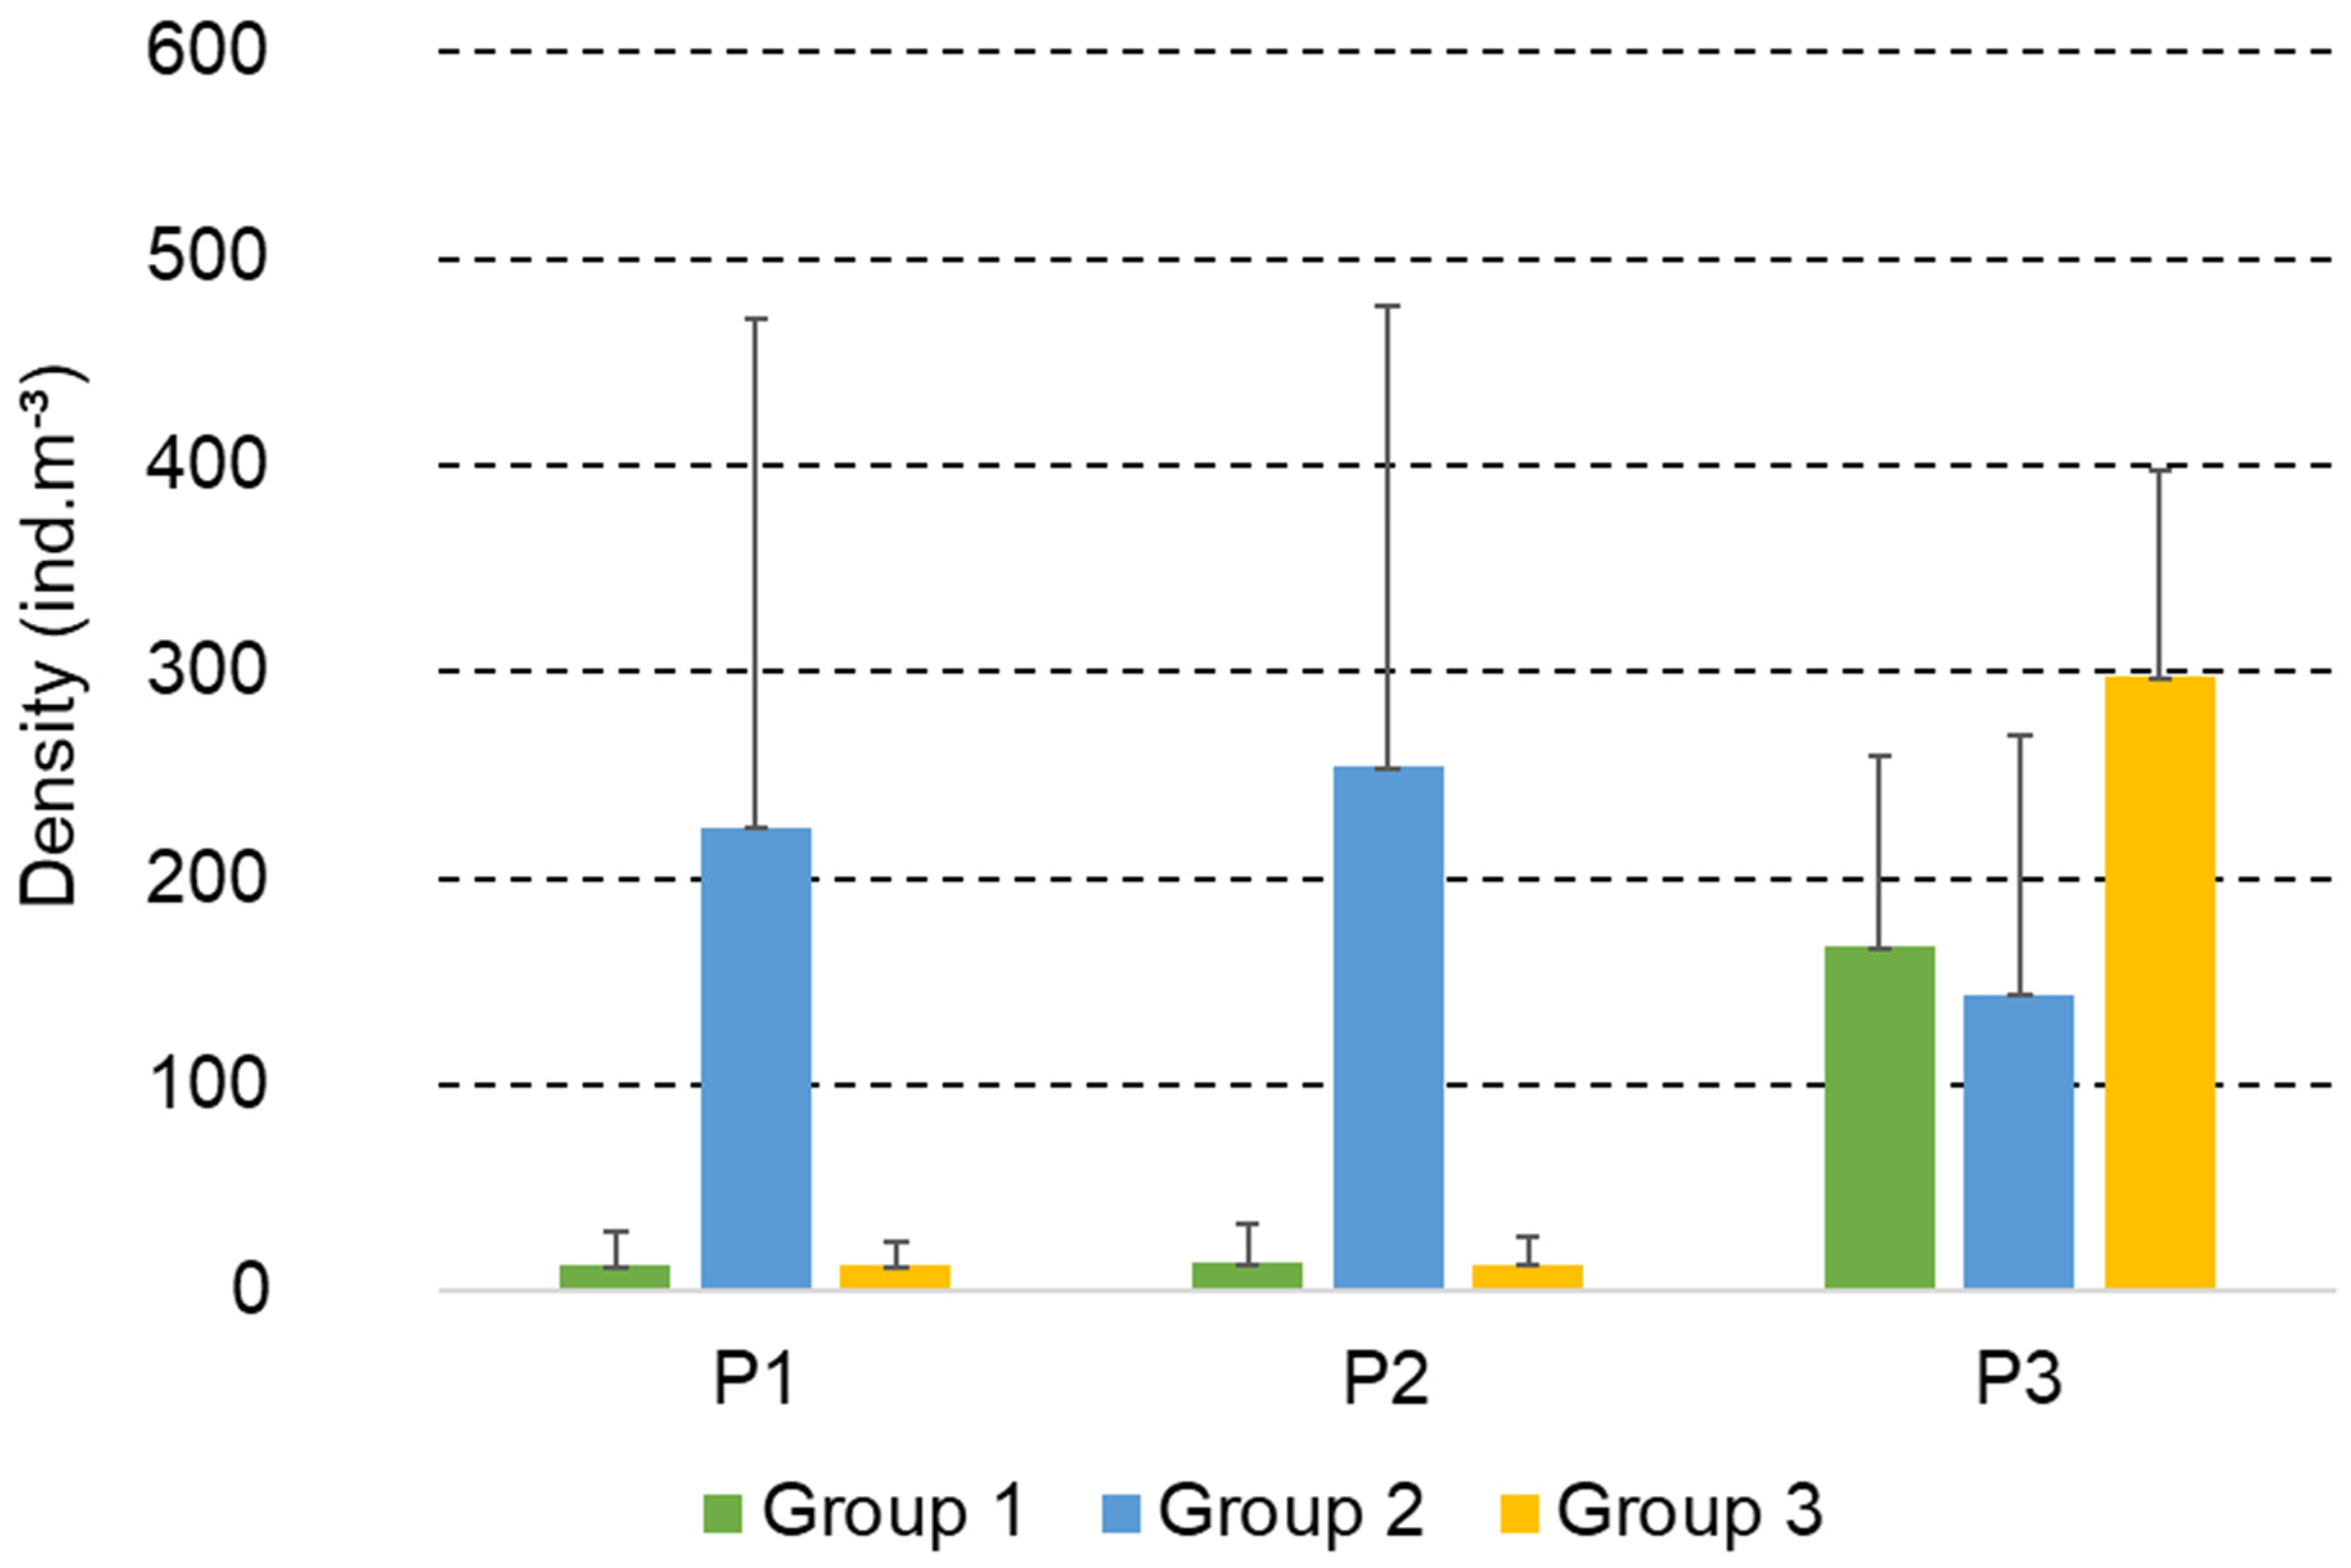
3.2. Structure and Composition of the Copepod Assemblage

The estuarine assemblage consisted of 20 copepod species classified into three orders. The orders Calanoida, Harpacticoida, and Cyclopoida, were represented by ten, six, and four species, respectively. Species belonging to the Oithonidae family (juvenile copepodite): Parvocalanus cf. scotti, Parvocalanus crassirostris, Oithona hebes, and Oithona oswaldocruzi, had the highest abundances throughout the year (Supplementary Material SI).
The lowest density (166.34 ind.m−3) was found in April (at P1) and the highest (2084.61 ind.m−3) in August (at P3) (Figure 5). In general, at the P1 and P2 upstream points, copepod density increased when salinity values increased; however, there was a reduction in density when the highest salinity levels occurred (Figure 5). Changes in abundance at P3 were observed only at the highest salinity level (Figure 5).
Cluster multivariate analysis revealed the formation of two groups (Figure 6). The first group clustered downstream samples from P3 (closest to the estuarine mouth), and the second group clustered samples from P1 and P2 (upstream region of the estuary). SIMPER analysis showed the contribution of copepod species to both groups. In the group downstream, the species that contributed the most were Parvocalanus crassirostris (26.65%), Parvocalanus cf. scotti (21.31%), and Oithona hebes (14.49%). In the group upstream, Oithona oswaldocruzi (51.71%), Parvocalanus crassirostris (10.28%), and Oithona hebes (10.17%) contributed the most.

3.3. Copepod Assemblage and Environmental Factors

The BEST analysis showed that salinity, total nitrogen, silica, and chlorophyll a were the set of environmental factors that explained most of the variation in the copepod assemblages (ρ = 0.58; p < 0.01) (Table 3).

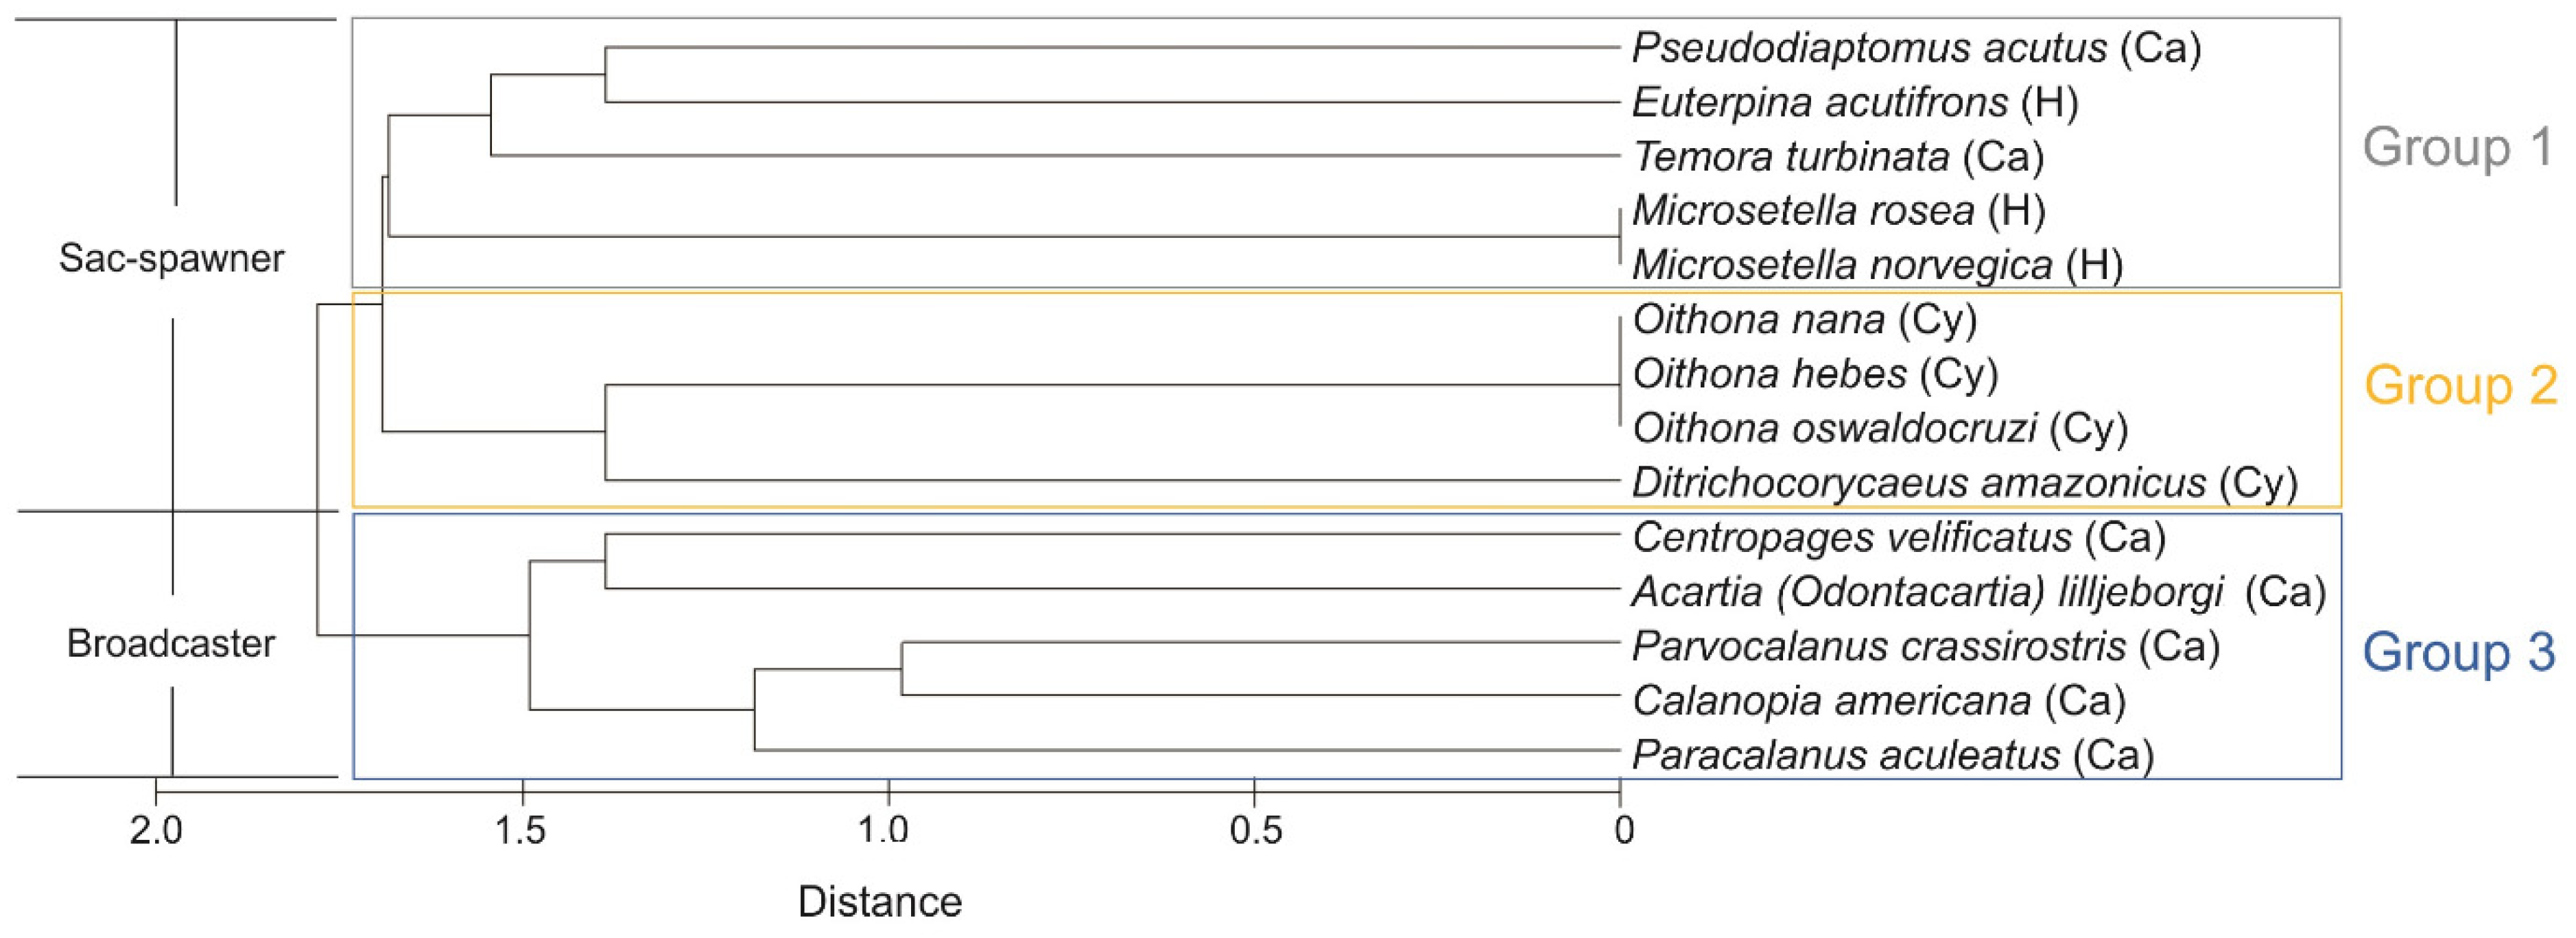
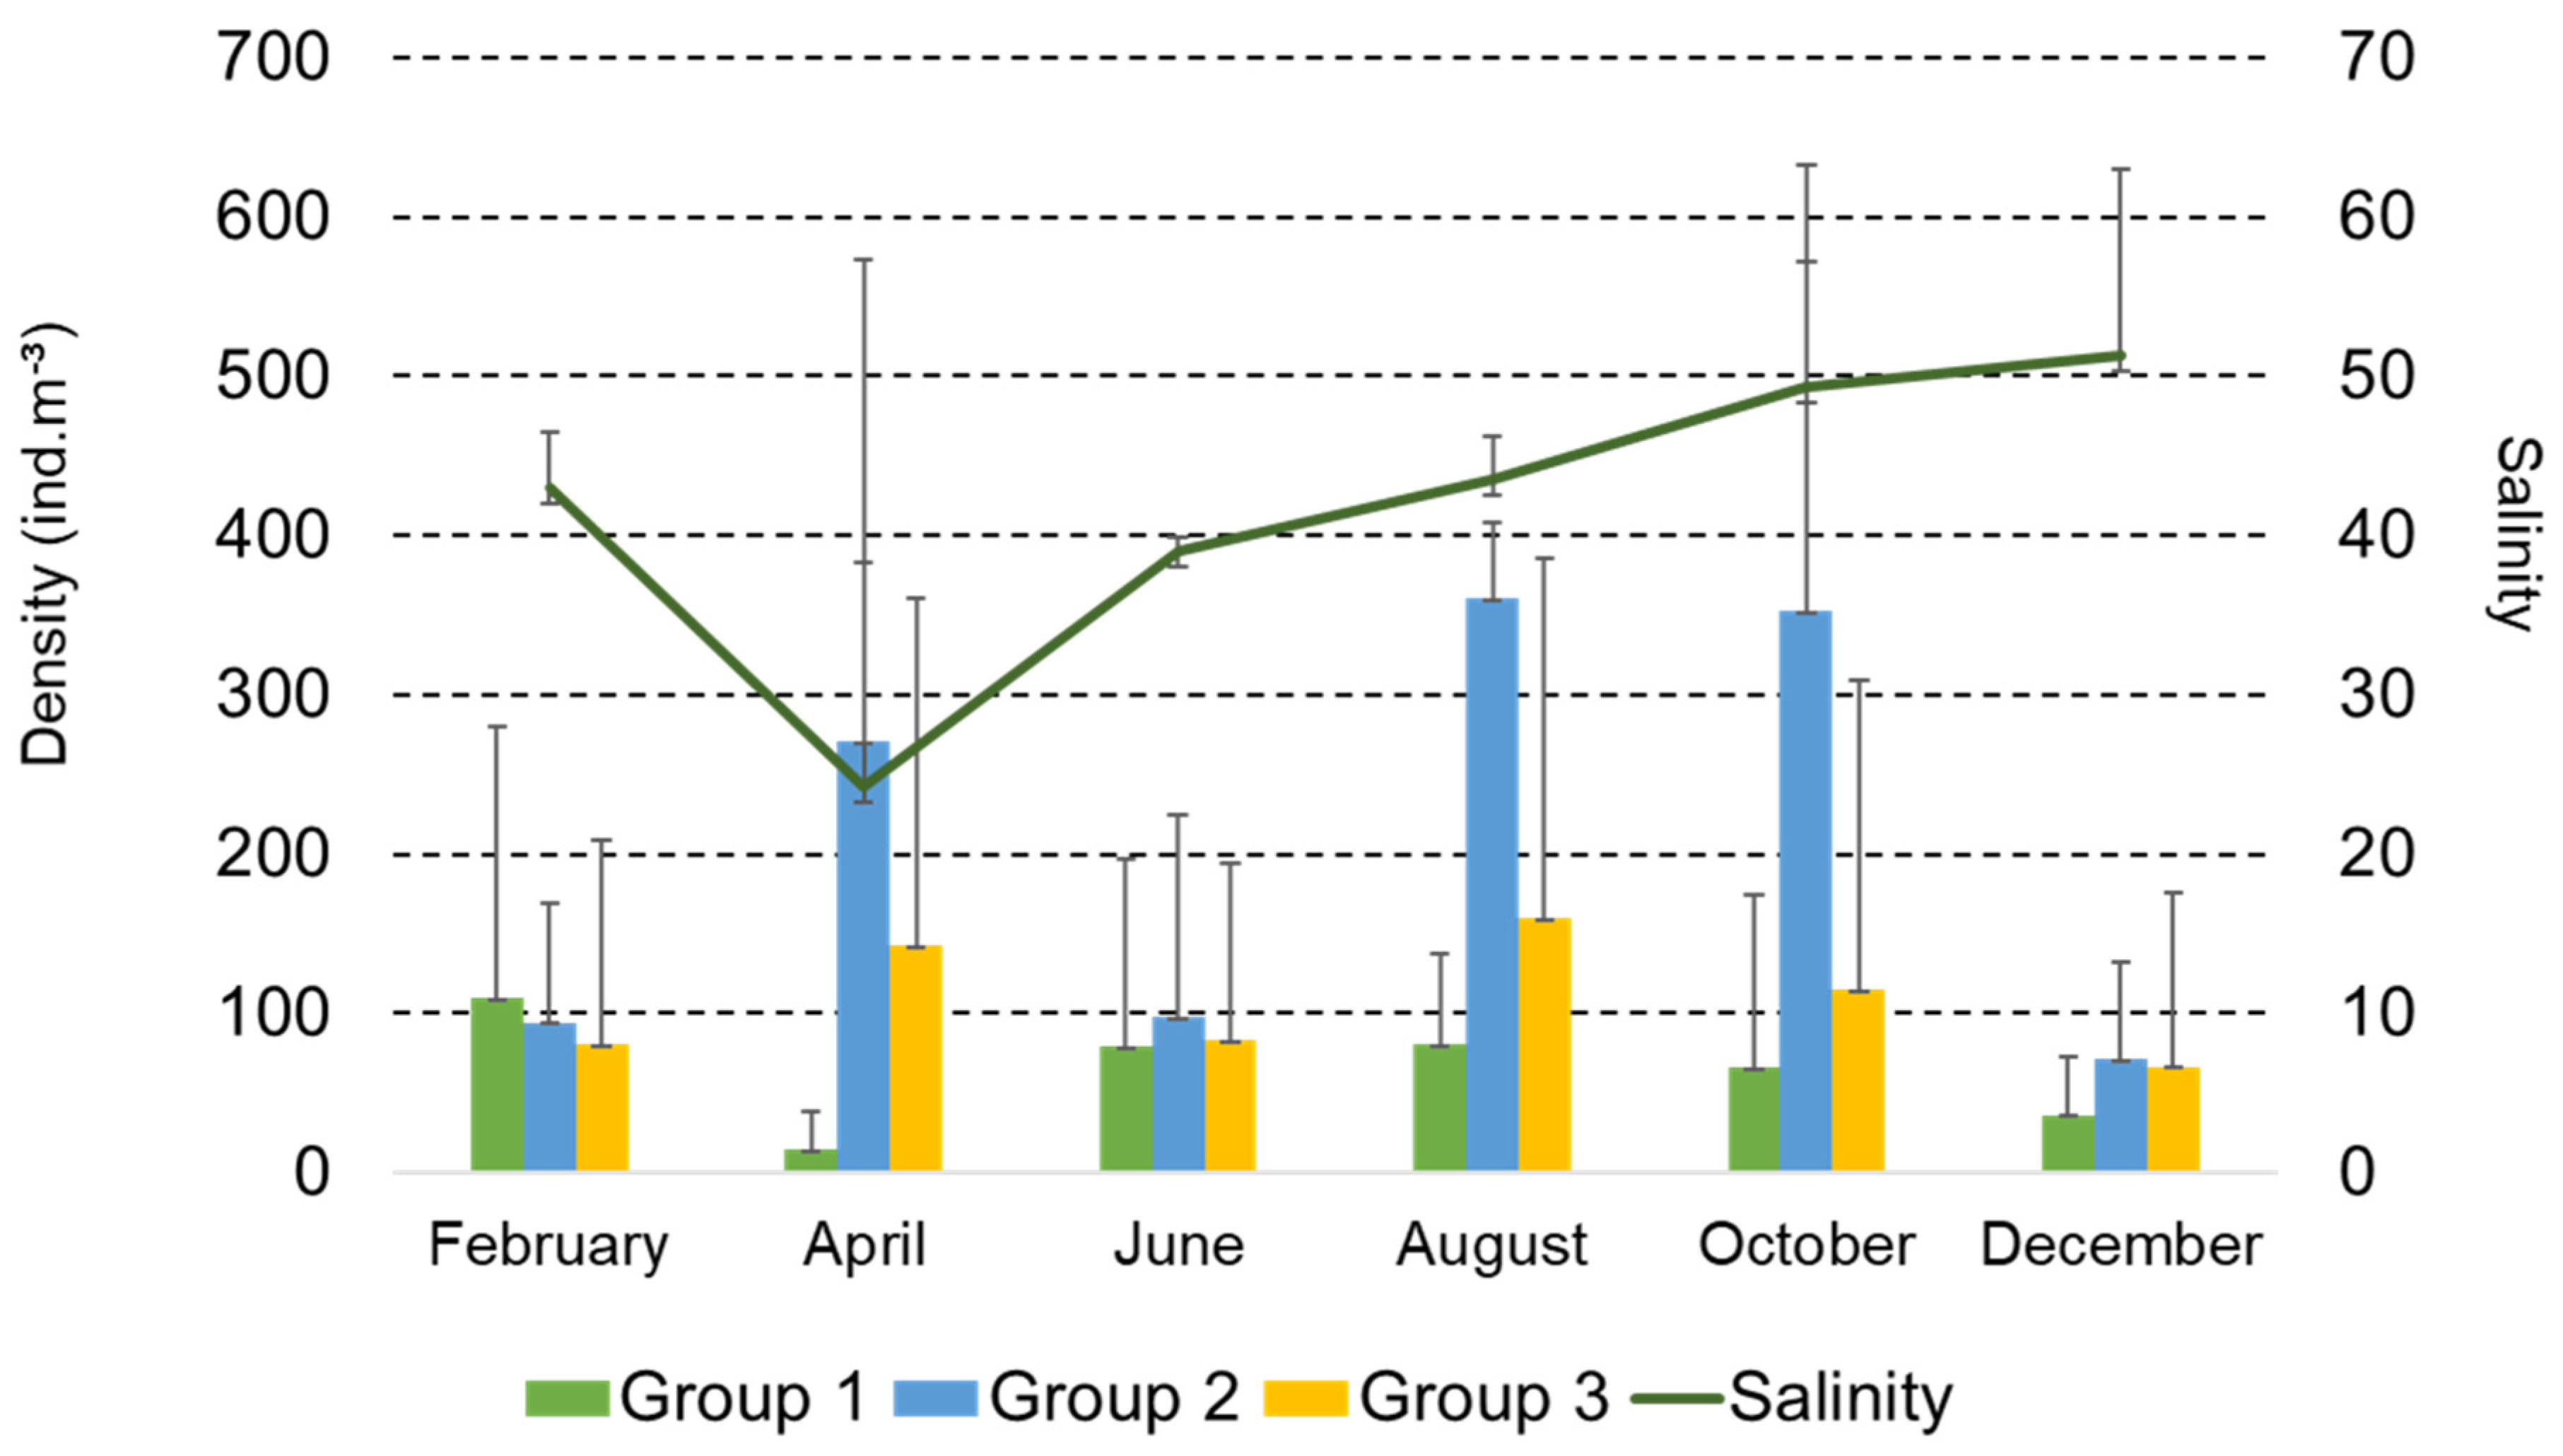
3.4. Functional Groups of Copepods

Two primary characteristics based on the spawning strategy (sac spawner and broadcaster) were identified and sorted (Figure 7). According to the feeding strategy, followed by the trophic regime and diel vertical migration behavior (Supplementary Material SI), three functional groups were recognized (Figure 7).
The mean abundance of groups ranged from 14.6 ± 23.6 ind.m−3 (Group 1—April) to 359.9 ± 48.5 ind.m−3 (Group 2). Group 1 consisted mainly of Euterpina acutifrons and Group 3 of Parvocalanus crassirostris. Group 2, characterized by the presence of stress-tolerant Oithona oswaldocruzi and O. hebes, had the highest abundance (Figure 8) throughout the year. The closer to the estuarine mouth, the greater the abundance of Groups 1 and 3 (P1 < P2 < P3). By contrast, the abundance of Group 2 was higher at the upstream stations (P2 > P1 > P3) (Figure 9).

4. Discussion

The present study evaluated the spatial and intra-annual distribution of copepod assemblages in a well-mixed shallow-water estuary under the influence of hypersalinity during a period that was considered the worst drought on record in the tropical SW Atlantic (Brazil). The main factor affecting the estuarine conditions was salinity. In general, copepod abundance was low during the extreme salinity levels (lowest and highest levels). The estuary was markedly influenced by precipitation in an anomalous drought year, where rainfall (lower than the historical mean) was concentrated over three months, and nine months of the year had no precipitation. The precipitation brought a short-term regime of hyposalinity in April and was responsible for the acute salinity reduction in the upstream stations. In the following month, the precipitation reduced and then stopped, and hypersalinity returned to the estuarine system and reached a higher level in December.
A reduction in rainfall is a major problem in semi-arid regions, where phenomena such as El Niño can result in prolonged periods of drought. The El Niño event in 2015 and 2016 was one of the most severe since the first recorded event that occurred in 1950 [39], and it is forecast that the frequency of El Niño and La Niña events will increase and induce changes in the rainfall patterns of tropical semi-arid coasts, including Northeast Brazil [23,40]. The South Atlantic Ocean Dipole is another factor affecting precipitation values on a regional scale, including the semi-arid coast of Brazil [41]. Among the more recent droughts (1992, 1998, 2002, 2010, and 2012–2015), only droughts in 1998, 2002, and 2015 occurred during El Niño–Southern Oscillation (ENSO) years [40].
Although copepods occurred in reduced abundance under extreme salinity conditions, some species, such as Oithonidae, could survive actively, while others rest in periods of prolonged and/or extreme drought in the study area. It is known that salinity levels can influence various metabolic processes in copepods and the variation in the dominance of euryhaline species in estuaries depends on the selection of adapted individuals [42,43]. For this reason, salinity is recognized as an important key factor that regulates the structure of mangrove communities, although they have seldom been studied in hypersaline tropical estuaries [14,44,45,46]. Other environmental components such as nitrogen, silica, and chlorophyll a concentrations also directly or indirectly cause variations in estuarine copepod populations. Regarding the spatial variations in the nutrient content, we highlight that the total suspended solids, chlorophyll a, and pheophytin a, increased toward upstream stations far removed (~5 km) from the twice daily influence of tidal marine oligotrophic waters.
The taxa with the highest densities (Parvocalanus cf. scotti, Parvocalanus crassirostris, Oithona hebes, Oithona oswaldocruzi, and juveniles of Oithonidae) are commonly found in estuarine environments with similar salinity characteristics [21,47,48]. The occurrence of several juvenile copepodite stages suggests that these species can reproduce under higher salinity conditions (38–50), indicating the resistance of estuarine populations because an essential component of the density and secondary production is supported by copepodites [21,49,50].
In addition, a spatial pattern was observed in this well-mixed semi-arid estuary. Parvocalanus crassirostris and Parvocalanus cf. scotti had their highest densities near the mouth of the estuary and showed adaptation to the most marinized environment. They occur in coastal waters and open oceans, where they are concentrated mainly in waters close to the surface and may be dominant in plankton epipelagic communities [51]. Oithona oswaldocruzi and Oithona hebes were common in the upstream estuarine stations. O. hebes common in estuarine waters, is an indicative of mangrove areas, and is usually associated with O. oswaldocruzi [35]. The distinctive structures of the upstream and downstream assemblages also resulted from marine intrusion, and the increased residence time in the upper portions of the estuary [29] resulted in changes in phytoplankton productivity (P1 = 16.0 µgL−1; P2 = 3.8 µgL−1; P3 = 1.4 µgL−1) [24]. In a simultaneous study conducted in the Piranji Estuary, phytoplankton biomass peaked in the middle and late dry seasons, when salinity reached maximum levels and water residence time was longer [24].
A particular feature of this tropical drought-prone estuary is the low number of species (n = 20) when compared to other estuaries in Brazil ([52] (n = 49); [53] (n = 30); [54] (n = 37)) and elsewhere in the world ([55] (n > 100); [56] (n = 47), [57] (n = 32)). Increased salinity can modify the structure and dynamics of planktonic communities through the selection of predominantly stress-tolerant marine species [58] and consequent simplification of planktonic communities, as observed in hypersaline estuaries, which have low numbers of species with high densities [14,59]. The lack of regular flow-through dams observed on this tropical coast induce an increase in hypersalinity in the mangrove estuarine ecosystem already affected by the drought effects [29] and may cause direct repercussions on species composition. Therefore, copepod assemblages were oversimplified in estuaries because of the low number of highly abundant species [14,60,61]. In this regard, hypersalinity and its effects can contribute to a less diverse and more stressed ecosystem [39].
It is important to highlight that the community under discussion in the Piranji Estuary is the active one. So, we did not consider resting eggs although some copepod genera such as Pseudodiaptomus, Acartia, Centropages, are well known for the production of resting stages which accumulate on the bottom during periods unfavorable for active swimming specimens. This aspect was not analyzed, but it should be explored in future research since the resting community, in the sediment of a hypersaline coastal lake, has the double species numbers of the sample collection in the water column [62,63].
In the multivariate analysis of the functional groups, we found a spatial distribution pattern of Groups 1 and 3 dominating the downstream and nearshore regions. These groups consisted of coastal and marine species, such as Euterpina acutifrons (Group 1) and Parvocalanus crassirostris (Group 3), which characterized the intrusion of marine and tolerant species into the mangrove ecosystem. Functional Group 2, consisting of stress-tolerant Oithonidae species, was clearly associated with estuarine waters (the upstream regions). Species of this family have biological strategies that contribute to their successful colonization, such as, for example, the feeding strategy. Oithona have low respiration rates and spend much of their time waiting to capture their prey through a quick jump [6,64]. Such a strategy allows the investment of more energy in reproduction [6]. Efficient feeding on small particles, including nanophytoplankton and cells > 50 m, can also favor their dominance in eutrophic conditions [65]. Oithona oswaldocruzi and Oithona hebes were the dominant species in this group. This genus has been recognized as a colonizer of extreme environments, such as hypersaline areas in the upstream stations (P1 and P2), which may become more prevalent with ongoing climate change [18,20].
Two primary traits based on spawning strategy defined these functional groups, sac spawner (Group 1 and 2) and broadcaster (Group 3). The author of [66] mentioned that most pelagic copepods (mainly Calanoida) release their eggs freely into the sea or carry eggs in ovisacs attached to the genital segment, as is the case with other Copepoda orders. The latter method can be considered an adaptive advantage over co-occurring broadcast species [67,68]. This results in a sac spawner with comparatively low fecundity that is balanced by a higher abundance of specimens [69,69]. Female sac-spawner copepods have potentially higher mortality rates due to the presence of the ballast derived from their ovigerous sacs, which not only slows their movement but also acts as attractants for visual predators [70].
When comparing Cyclopoida and Calanoida Orders, the success of cyclopoids in extreme environments is related to the increased efficiency of some activities, for example, weight-specific respiration rates [64], low metabolic rates [71], feeding/swimming behavior [72], microbial food web exploitation [73,74], feeding strategies [65] and egg movement during embryo development [68]. These traits save energy that can be channeled into other essential functions, such as reproduction in stressful hypersaline environments [6,74]. Although Cyclopoids and Calanoids are common in estuarine water [35], the higher salinity levels (~50–60) in the upstream mangrove region create a more extreme and stressful environment that may not be suitable for certain groups or species. At the upstream station (P1), Group 2 (formed by only cyclopoids) may have benefited from the increase in salinity, although there are limits where they can no longer survive. Few copepod species could tolerate salinities > 100 [18], which could result in mass mortality and oversimplify the estuarine community and mangrove food webs in the coming decades. The occurrence and the density of species in hypersaline estuarine systems may thus change markedly in response to increased salinity levels.

5. Conclusions

In conclusion, one of the main results that we would like to highlight was that hypersalinity drives changes on copepod assemblages at the base of the mangrove food webs. The community was significantly influenced by the extreme drought period, presenting a temporal homogenization in terms of composition, and an expressive and unexpected increase in density in the dry period, possibly due to phytoplankton blooms resistant to hypersalinity and the occurrence of copepod species adapted to stressful conditions. These extreme salinity values can lead to few copepod species occurring across the year. The few stress-tolerant species sustaining the food webs with seasonal variations were observed simplifying the trophic variability. The results indicate that hypersalinity can induce changes in the zooplankton community, increasing copepod mortality risk and, so, promoting alteration in the trophic estuarine dynamic.
Long-term sampling over several years (interannual series) would be needed in further studies to verify the recovery of these copepod densities, since salinity decreases during years when precipitation is normal, and to specify if the recovery is fueled by germination of in situ resting stages or by a side supply of immigrating specimens from the sea. Increased siltation due to deforestation and dam construction, increased evaporation and global temperatures, sea-level rise, and reduced rainfall tend to amplify the occurrence of hypersaline waters in many regions of the world [75,76].

Supplementary Materials

The following supporting information can be downloaded at: https://www.mdpi.com/article/10.3390/w14223648/s1, Table S1: Supplementary Material Table S1 [5,51,64,66,77,78,79,80,81,82,83,84,85,86,87,88,89,90,91,92,93,94,95,96,97,98,99,100,101,102,103,104,105,106,107].

Author Contributions

Conceptualization, C.C.C., H.d.S.B., G.B., S.R., M.O.S. and T.M.G.; methodology, C.C.C., H.d.S.B., M.O.S. and T.M.G.; software, C.C.C., M.O.S. and T.M.G.; validation, C.C.C., H.d.S.B., G.B., S.R., M.O.S. and T.M.G.; formal analysis, C.C.C., H.d.S.B., M.O.S. and T.M.G.; investigation, C.C.C., H.d.S.B., G.B., S.R., M.O.S. and T.M.G.; resources, C.C.C., H.d.S.B., G.B., S.R., M.O.S. and T.M.G.; data curation, C.C.C., M.O.S. and T.M.G.; writing—original draft preparation, C.C.C., M.O.S. and T.M.G.; writing—review and editing, C.C.C., H.d.S.B., G.B., S.R., M.O.S. and T.M.G.; visualization, C.C.C., H.d.S.B., G.B., S.R., M.O.S. and T.M.G.; supervision, M.O.S. and T.M.G.; project administration, M.O.S. and T.M.G.; funding acquisition, G.B., S.R., M.O.S. and T.M.G. All authors have read and agreed to the published version of the manuscript.

Funding

This research was funded by Conselho Nacional de Desenvolvimento Científico e Tecnológico—CNPq (404290/2016-7; 233808/2014-0 and Research Productivity Fellowship No. 313518/2020-3), PELD Costa Semiárida do Brasil-CSB (FUNCAP No PEL-00177-00005.01.00/21; CNPq No. 442337/2020-5), CAPES-PRINT, CAPES-PNPD (HSB Fellowship), CAPES-Alexander Von Humboldt Foundation, and Fundação Cearense de Apoio ao Desenvolvimento Científico e Tecnológico (Chief Scientist Program) for their financial support. The APC was 0 (zero) CHF.

Acknowledgments

T.M.G. and M.O.S. are grateful for the financial support provided by the Conselho Nacional de Desenvolvimento Científico e Tecnológico—CNPq (404290/2016-7; 233808/2014-0). We thank the Conselho Nacional de Desenvolvimento Científico e Tecnológico (Research Productivity Fellowship Nos. 313518/2020-3), PELD Costa Semiárida do Brasil-CSB (FUNCAP No PEL-00177-00005.01.00/21; CNPq No. 442337/2020-5), CAPES-PRINT, CAPES-PNPD (HSB Fellowship), CAPES-Alexander Von Humboldt Foundation and Fundação Cearense de Apoio ao Desenvolvimento Científico e Tecnológico (Chief Scientist Program) for their financial support. This is a PELD-CSB contribution. We also thank the Laboratório de Efluentes e Qualidade de Água (EQUAL/LABOMAR/UFC) for support in nutrient analysis.

Conflicts of Interest

The authors declare no conflict of interest.

References

  1. Ara, K. Temporal variability and production of the planktonic copepod community in the Cananéia Lagoon estuarine system, São Paulo, Brazil. Zool. Stud. 2004, 43, 179–186. [Google Scholar]
  2. Hemraj, D.A.; Hossain, M.A.; Ye, Q.; Qin, J.G.; Leterme, S.C. Plankton bioindicators of environmental conditions in coastal lagoons. Estuar. Coast. Shelf Sci. 2017, 184, 102–114. [Google Scholar] [CrossRef]
  3. Gismervik, I. Top-down impact by copepods on ciliate numbers and persistence depends on copepod and ciliate species composition. J. Plankton Res. 2006, 28, 499–507. [Google Scholar] [CrossRef] [Green Version]
  4. Violle, C.; Navas, M.L.; Vile, D.; Kazakou, E.; Fortunel, C.; Hummel, I.; Garnier, E. Let the concept of trait be functional! Oikos 2007, 116, 882–892. [Google Scholar] [CrossRef]
  5. Bradford-Grieve, J.M. Copepoda. In South Atlantic Zooplankton; Boltovskoy, D., Ed.; Backhuys Publishers: Leiden, The Netherlands, 1999; Volume 2, pp. 869–1098. [Google Scholar]
  6. Turner, J.T. The importance of small planktonic copepods and their roles in pelagic marine food webs. Zool. Stud. 2004, 43, 255–266. [Google Scholar]
  7. Calbet, A. The trophic roles of microzooplankton in marine systems. ICES J. Mar. Sci. 2008, 65, 325–331. [Google Scholar] [CrossRef] [Green Version]
  8. Brun, P.; Payne, M.R.; Kiørboe, T. A trait database for marine copepods. Earth Syst. Sci. Data 2017, 9, 99–113. [Google Scholar] [CrossRef] [Green Version]
  9. Benedetti, F.; Vogt, M.; Righetti, D.; Guilhaumon, F.; Ayata, S.D. Do functional groups of planktonic copepods differ in their ecological niches? J. Biogeogr. 2018, 45, 604–616. [Google Scholar] [CrossRef]
  10. Nagarathinam, A.; Retnamma, J.; Loganathan, J.; Singaram, P.; Arayillath, A.; Jose, A.K. Impact of human-altered hydrographical setting on the Copepod community structure in an extensive tropical estuary along the southwest coast of India. Oceanologia 2021, 63, 115–132. [Google Scholar] [CrossRef]
  11. Paul, S.; Karan, S.; Bhattacharya, B.D. Daily variability of copepods after successive tropical cyclones in the Ganges River estuary of India. Estuar. Coast. Shelf Sci. 2020, 246, 107048. [Google Scholar] [CrossRef]
  12. Breckenridge, J.K.; Bollens, S.M.; Rollwagen-Bollens, G.; Roegner, G.C. Plankton assemblage variability in a river-dominated temperate estuary during late spring (high-flow) and late summer (low-flow) periods. Estuaries Coast. 2015, 38, 93–103. [Google Scholar] [CrossRef]
  13. Belmonte, G.; Rubino, F. Cysts and resting eggs from marine zooplankton: Dimension of the phenomenon, physiology of rest, and ecological and biogeographic implications. In Dormancy in Aquatic Organisms. Theory, Human Use and Modeling; Springer: Cham, Switzerland, 2019; pp. 71–94. [Google Scholar] [CrossRef]
  14. Carrasco, N.K.; Perissinotto, R. Development of a halotolerant community in the St. Lucia Estuary (South Africa) during a hypersaline phase. PLoS ONE 2012, 7, e29927. [Google Scholar] [CrossRef]
  15. Largier, J. Low-inflow estuaries: Hypersaline, inverse and thermal scenarios. In Contemporary Issues in Estuarine Physics; Cambridge University Press: Cambridge, UK, 2010; pp. 247–272. [Google Scholar] [CrossRef]
  16. Abril, G.; Libardoni, B.G.; Brandini, N.; Cotovicz, L.C., Jr.; Medeiros, P.R.; Cavalcante, G.H.; Knoppers, B.A. Thermodynamic uptake of atmospheric CO2 in the oligotrophic and semiarid São Francisco estuary (NE Brazil). Mar. Chem. 2021, 233, 103983. [Google Scholar] [CrossRef]
  17. Ezhilarasan, P.; Basuri, C.K.; Gera, A.; Kumaraswami, M.; Rao, V.R.; Murthy, M.R. Mesozooplankton distribution in relation to the salinity gradient in a tropical hypersaline lake. J. Sea Res. 2021, 178, 102138. [Google Scholar] [CrossRef]
  18. Tweedley, J.R.; Dittmann, S.R.; Whitfield, A.K.; Withers, K.; Hoeksema, S.D.; Potter, I.C. Hypersalinity: Global distribution, causes, and present and future effects on the biota of estuaries and lagoons. In Coasts and Estuaries; Elsevier: Amsterdam, The Netherlands, 2019; pp. 523–546. [Google Scholar] [CrossRef]
  19. Stocker, T.; Plattner, G.; Dahe, Q. IPCC climate change 2013: The physical science basis-findings and lessons learned. In Proceedings of the EGU General Assembly Conference Abstracts 2014, Vienna, Austria, 27 April–2 May 2014; p. 17003. [Google Scholar]
  20. Soares, M.D.O.; Campos, C.C.; Carneiro, P.B.M.; Barroso, H.S.; Marins, R.V.; Teixeira, C.E.P.; Menezes, M.O.B.; Pinheiro, L.D.S.; Viana, M.B.; Feitosa, C.V.; et al. Challenges and perspectives for the Brazilian semi-arid coast under global environmental changes. Perspect. Ecol. Conserv. 2021, 19, 267–278. [Google Scholar] [CrossRef]
  21. Andrade, M.P.; Magalhães, A.; Pereira, L.C.; Flores-Montes, M.J.; Pardal, E.C.; Andrade, T.P.; Costa, R.M. Effects of a La Niña event on hydrological patterns and copepod community structure in a shallow tropical estuary (Taperaçu, Northern Brazil). J. Mar. Syst. 2016, 164, 128–143. [Google Scholar] [CrossRef]
  22. Atique, P.; da Costa, K.G.; Monteiro, M.C.; Pereira, L.C.; da Costa, R.M. Copepod assemblages in a highly dynamic equatorial estuary on the Brazilian Amazon Coast. Mar. Ecol. 2017, 38, e12385. [Google Scholar] [CrossRef]
  23. Marengo, J.A.; Torres, R.R.; Alves, L.M. Drought in Northeast Brazil—Past, present, and future. Theor. Appl. Climatol. 2016, 129, 1189–1200. [Google Scholar] [CrossRef]
  24. de Sousa Barroso, H.; Tavares, T.C.L.; de Oliveira Soares, M.; Garcia, T.M.; Rozendo, B.; Vieira, A.S.C.; Viana, P.B.; Pontes, T.M.; Ferreira, T.J.T.; Pereira Filho, J.; et al. Intra-annual variability of phytoplankton biomass and nutrients in a tropical estuary during a severe drought. Estuarine Coastal Shelf Sci. 2018, 213, 283–293. [Google Scholar] [CrossRef]
  25. Signorini, S.R.; De Miranda, L.B. Tidal and low-frequency currents near the shelf-break: Northeastern coast of Brazil. J. Phys. Oceanogr. 1983, 13, 2107–2115. [Google Scholar] [CrossRef]
  26. Dias, C.O.; Bonecker, S.L.C. The copepod assemblage (Copepoda: Crustacea) on the inner continental shelf adjacent to Camamu Bay, northeast Brazil. Zoologia 2009, 26, 629–640. [Google Scholar] [CrossRef] [Green Version]
  27. Campos, J.N.B.; Morais, J.O. Avaliação do Uso Potencial de Áreas Estuarinas a Partir da Identificação e Caracterização do Comportamento de Variáveis Hidro-Climáticas, Oceanográficas e Ambientais—Estudo de Caso: Rio Piranji-CE; FUNCEME: Fortaleza, Brazil, 2007; p. 219. [Google Scholar]
  28. Paula, D.P.; Pinheiro, L.S.; Morais, J.O.; Dias, C.B. A hidrodinâmica do estuário do rio Piranji, Ceará-Brasil: Implicações para o Manejo e Uso Sustentável. In XI Congresso da ABEQUA; Universidade Federal do Pará: Belém, Brazil; Volume 6, pp. 1–3.
  29. Schettini, C.A.; Valle-Levinson, A.; Truccolo, E.C. Circulation and transport in short, low-inflow estuaries under anthropogenic stresses. Reg. Stud. Mar. Sci. 2017, 10, 52–64. [Google Scholar] [CrossRef]
  30. Silva, J.M.O.; da Silva, E.V. Análise Geoambiental do baixo curso da Bacia Hidrográfica do Rio Pirangi–CE. Rev. Geonorte 2012, 3, 593–605. [Google Scholar]
  31. Savenije, H.H.; Pagès, J. Hypersalinity: A dramatic change in the hydrology of Sahelian estuaries. J. Hydrol. 1992, 135, 157–174. [Google Scholar] [CrossRef]
  32. Funceme. Available online: https://funceme.br/app/calendario/produto/municipios/maxima/2016 (accessed on 13 February 2016).
  33. Omori, M.; Ikeda, T. Methods in Marine Zooplankton Ecology; John Wiley & Sons: New York, NY, USA, 1984; Volume 332. [Google Scholar]
  34. Tregouboff, G.; Rose, M. Manuel de Planctonologia Méditerraneénne; C.N.R.S.: Paris, France, 1957. [Google Scholar]
  35. Bjönberg, T.K.S. Copepoda. In Atlas del Zooplancton del Atlántico Sudoccidental y Métodos de Trabajos con el Zooplancton Marino; Boltovskoy, D., Ed.; INIDEP: Mar del Plata, Argentina, 1981; pp. 587–679. [Google Scholar]
  36. Rice, E.W.; Baird, R.B.; Eaton, A.D.; Clesceri, L.S. Standard Methods for the Examination of Water and Wastewater, 22nd ed.; American Public Health Association, American Water Works Association, Water Environment Federation: Washington, DC, USA, 2012. [Google Scholar]
  37. Baumgarten, M.G.Z.; De Barros Rocha, J.M.; Niencheski, L.F.H. Manual de Análises em Oceanografia Química; Furg: Rio Grande, Brazil, 1996; p. 132. [Google Scholar]
  38. UNESCO. Chemical Methods for Use in Marine Environment Monitoring; Intergovernmental Oceanographic Commission: Paris, France, 1983; Volume 56. [Google Scholar]
  39. Rossi, S.; Soares, M.D.O. Effects of El Niño on the coastal ecosystems and their related services. Mercator 2017, 16, e16030. [Google Scholar] [CrossRef] [Green Version]
  40. Marengo, J.A.; Alves, L.M.; Alvala, R.; Cunha, A.P.; Brito, S.; Moraes, O.L. Climatic characteristics of the 2010-2016 drought in the semiarid Northeast Brazil region. Anais da Academia Brasileira de Ciências 2017, 90, 1973–1985. [Google Scholar] [CrossRef]
  41. Campos, J.N.B.; Alves, J.M.B.; Servain, J. Relationship between ocean climatic variability and rain-fed agriculture in northeast Brazil. Clim. Res. 2009, 38, 225–236. [Google Scholar]
  42. Lawrence, D.; Valiela, I.; Tomasky, G. Estuarine calanoid copepod abundance in relation to season, salinity, and land-derived nitrogen loading, Waquoit Bay, MA. Estuar. Coast. Shelf Sci. 2004, 61, 547–557. [Google Scholar] [CrossRef]
  43. Matias-Peralta, H.; Yusoff, F.M.; Shariff, M.; Arshad, A. Effects of some environmental parameters on the reproduction and development of a tropical marine harpacticoid copepod Nitocra affinis f. californica Lang. Mar. Pollut. Bull. 2005, 51, 722–728. [Google Scholar] [CrossRef]
  44. Lance, J. The salinity tolerance of some estuarine planktonic copepods. Limnol. Oceanogr. 1963, 8, 440–449. [Google Scholar] [CrossRef]
  45. Rippingale, R.J.; Hodgkin, E.P. Food availability and salinity tolerance in a brackish water copepod. Mar. Freshwater Res. 1977, 28, 1–7. [Google Scholar] [CrossRef]
  46. Froneman, P.W. Seasonal changes in zooplankton biomass and grazing in a temperate estuary, South Africa. Estuar. Coast. Shelf Sci. 2001, 52, 543–553. [Google Scholar] [CrossRef]
  47. Costa, K.G.; Pereira, L.C.C.; Costa, R.M. Short and long-term temporal variation of the zooplankton in a tropical estuary (Amazon region, Brazil). Bol. Mus. Emílio Goeldi Ciências Nat. 2008, 3, 127–141. [Google Scholar] [CrossRef]
  48. Champalbert, G.; Pagano, M.; Arfi, R.; Chevalier, C. Effects of the sandbar breaching on hydrobiological parameters and zooplankton communities in the Senegal River Estuary (West Africa). Mar. Pollut. Bull. 2014, 82, 86–100. [Google Scholar] [CrossRef]
  49. Blanda, E.; Drillet, G.; Huang, C.C.; Hwang, J.S.; Højgaard, J.K.; Jakobsen, H.H.; Rayner, T.A.; Su, H.M.; Hansen, B.W. An analysis of how to improve production of copepods as live feed from tropical Taiwanese outdoor aquaculture ponds. Aquaculture 2017, 479, 432–441. [Google Scholar] [CrossRef]
  50. Campos, C.C.; Garcia, T.M.; Neumann-Leitão, S.; Soares, M.O. Ecological indicators and functional groups of copepod assemblages. Ecol. Indic. 2017, 83, 416–426. [Google Scholar] [CrossRef]
  51. Boxshall, G.A.; Halsey, S.H. An Introduction to Copepod Diversity; Ray Society: London, UK, 2004. [Google Scholar]
  52. Sterza, J.M.; Fernandes, L.L. Zooplankton community of the Vitória Bay estuarine system (Southeastern Brazil): Characterization during a three-year study. Braz. J. Oceanogr. 2006, 54, 95–105. [Google Scholar] [CrossRef] [Green Version]
  53. Magalhães, A.; Leite, N.D.R.; Silva, J.G.; Pereira, L.C.; Costa, R.M.D. Seasonal variation in the copepod community structure from a tropical Amazon estuary, Northern Brazil. An. Acad. Bras.Ciências 2009, 81, 187–197. [Google Scholar] [CrossRef] [Green Version]
  54. da Conceicao, L.R.; Demoner, L.E.; Pereira, J.B.; Perassoli, F.; Ghisolfi, R.D.; Bastos, A.C.; Junior, C.D.; Lázaro, G.C.S.; do Nascimento Lemos, K.; Fernandes, L.F.L. Copepod community structure after a mining dam disaster in the Southwestern Atlantic Ocean. Estuar. Coast. Shelf Sci. 2021, 254, 107325. [Google Scholar] [CrossRef]
  55. Truong, T.; Nguyen, C.; Lam, N.N.; Jensen, K. Seasonal and spatial distribution of mesozooplankton in a tropical estuary, Nha Phu, South Central Viet Nam. Biologia 2014, 69, 80–91. [Google Scholar] [CrossRef]
  56. Tseng, L.C.; Hsiao, S.H.; Sarkar, S.K.; Bhattacharya, B.D.; Chen, Q.C.; Hwang, J.S. Influence of Kuroshio water on the annual copepod community structure in an estuary in the northwest Pacific Ocean. Cont. Shelf Res. 2016, 118, 165–176. [Google Scholar] [CrossRef]
  57. Rahman, M.M. Factors influencing the vertical distribution of copepods in a tropical oligotrophic estuary, South China sea. Estuar. Coast. Shelf Sci. 2021, 250, 107165. [Google Scholar] [CrossRef]
  58. Sloterdijk, H.; Brehmer, P.; Sadio, O.; Müller, H.; Döring, J.; Ekau, W. Composition and structure of the larval fish community related to environmental parameters in a tropical estuary impacted by climate change. Estuar. Coast. Shelf Sci. 2017, 197, 10–26. [Google Scholar] [CrossRef]
  59. Rosa, J.D.C.L.D.; Batista, L.L.; Monteiro-Ribas, W.M. Tracking of spatial changes in the structure of the zooplankton community according to multiple abiotic factors along a hypersaline lagoon. Nauplius 2020, 28. [Google Scholar] [CrossRef]
  60. Toumi, N.; Ayadi, H.; Abid, O.; Carrias, J.F.; Sime-Ngando, T.; Boukhris, M.; Bouain, A. Zooplankton distribution in four ponds of different salinity: A seasonal study in the solar salterns of Sfax (Tunisia). Hydrobiologia 2005, 534, 1–9. [Google Scholar] [CrossRef]
  61. Cyrus, D.; Jerling, H.; MacKay, F.; Vivier, L. Lake St Lucia, Africa’s largest estuarine lake in crisis: Combined effects of mouth closure, low levels and hypersalinity. S. Afr. J. Sci. 2011, 107, 1–13. [Google Scholar] [CrossRef]
  62. Moscatello, S.; Belmonte, G. Egg banks in hypersaline lakes of the South-East Europe. Saline Syst. 2009, 5, 3. [Google Scholar] [CrossRef] [Green Version]
  63. Moscatello, S.; Rubino, F.; Saracino, O.D.; Fanelli, G.; Belmonte, G.; Boero, F. Plankton biodiversity around the Salento Peninsula (South East Italy): An integrated water/sediment approach. Sci. Mar. 2004, 68, 85–102. [Google Scholar] [CrossRef] [Green Version]
  64. Nakamura, Y.; Turner, J.T. Predation and respiration by the small cyclopoid copepod Oithona similisr: How important is feeding on ciliates and heterotrophic flagellates? J. Plankton Res. 1997, 74, 1275–1288. [Google Scholar] [CrossRef] [Green Version]
  65. Calbet, A.; Landry, M.R.; Scheinberg, R.D. Copepod grazing in a subtropical bay: Species-specific responses to a midsummer increase in nanoplankton standing stock. Mar. Ecol. Prog. Ser. 2000, 193, 75–84. [Google Scholar] [CrossRef]
  66. Mauchline, J. The Biology of Calanoid Copepods. Advances in Marine Biology; Elsevier: Amsterdam, The Netherlands, 1998; Volume 33. [Google Scholar]
  67. Satapoomin, S.; Nielsen, T.G.; Hansen, P.J. Andaman Sea copepods: Spatio-temporal variations in biomass and production, and role in the pelagic food web. Mar. Ecol. Prog. Ser. 2004, 274, 99–122. [Google Scholar] [CrossRef]
  68. Belmonte, G. The Suspected Contradictory Role of Parental Care in the Adaption of Planktonic Calanoida to Temporary Freshwater. Water 2021, 13, 100. [Google Scholar] [CrossRef]
  69. Hirst, A.G.; Kiørboe, T. Mortality of marine planktonic copepods: Global rates and patterns. Mar. Ecol. Prog. Ser. 2002, 230, 195–209. [Google Scholar] [CrossRef] [Green Version]
  70. Webb, D.G.; Weaver, A.J. Predation and the evolution of free spawning in marine calanoid copepods. Oikos 1988, 51, 189–192. [Google Scholar] [CrossRef]
  71. Castellani, C.; Irigoien, X.; Harris, R.P.; Lampitt, R.S. Feeding and egg production of Oithona similis in the North Atlantic. Mar. Ecol. Prog. Ser. 2005, 288, 173–182. [Google Scholar] [CrossRef]
  72. Almeda, R.; Augustin, C.B.; Alcaraz, M.; Calbet, A.; Saiz, E. Feeding rates and gross growth efficiencies of larval developmental stages of Oithona davisae (Copepoda, Cyclopoida). J. Exp. Mar. Biol. Ecol. 2010, 387, 24–35. [Google Scholar] [CrossRef]
  73. Nielsen, T.G.; Sabatini, M. Role of cyclopoid copepods Oithona spp. in North Sea plankton communities. Mar. Ecol. Prog. Ser. 1996, 139, 79–93. [Google Scholar] [CrossRef] [Green Version]
  74. Zamora-Terol, S.; Mckinnon, A.D.; Saiz, E. Feeding and egg production of Oithona spp. in tropical waters of North Queensland, Australia. J. Plankton Res. 2014, 36, 1047–1059. [Google Scholar] [CrossRef] [Green Version]
  75. Statham, P.J. Nutrients in estuaries—An overview and the potential impacts of climate change. Sci. Total Environ. 2012, 434, 213–227. [Google Scholar] [CrossRef] [PubMed]
  76. Robins, P.E.; Skov, M.W.; Lewis, M.J.; Giménez, L.; Davies, A.G.; Malham, S.K.; Neill, S.P.; McDonald, J.E.; Whitton, T.A.; Jackson, S.E.; et al. Impact of climate change on UK estuaries: A review of past trends and potential projections. Estuar. Coast. Shelf Sci. 2016, 169, 119–135. [Google Scholar] [CrossRef] [Green Version]
  77. Andersen, V.; Gubanova, A.; Nival, P.; Ruellet, T. Zooplankton community during the transition from spring bloom to oligotrophy in the open NW Mediterranean and effects of wind events. 2. Vertical distributions and migrations. J. Plankton Res. 2001, 23, 243–261. [Google Scholar] [CrossRef]
  78. Barton, A.D.; Pershing, A.J.; Litchman, E.; Record, N.R.; Edwards, K.F.; Finkel, Z.V.; Ward, B.A. The biogeography of marine plankton traits. Ecol. Lett. 2013, 16, 522–534. [Google Scholar] [CrossRef] [PubMed]
  79. Björnberg, T.K. Developmental Stages of Some Tropical and Subtropical Planktonic Marine Copepods. Studies on the Fauna of Curacao and Other Caribbean Islands. Available online: https://repository.naturalis.nl/pub/506033 (accessed on 1 October 2022).
  80. Björnberg, T.K.S.; Wilbur, K.M. Copepod phototaxis and vertical migration influenced by xanthene dyes. Biol. Bull. 1968, 134, 398–410. [Google Scholar] [CrossRef]
  81. Böttger-Schnack, R. Community structure and vertical distribution of cyclopoid copepods in the Red Sea. Mar. Biol. 1990, 106, 473–485. [Google Scholar] [CrossRef]
  82. Böttger-Schnack, R. Vertical structure of small metazoan plankton, especially noncalanoid copepods. I. Deep Arabian Sea. J. Plankton Res. 1996, 18, 1073–1101. [Google Scholar] [CrossRef]
  83. Bottger-Schnack, R. Vertical structure of small metazoan plankton, especially non-calanoid copepods. 2. Deep Eastern Mediterranean (Levantine sea). Oceanol. Acta. 1997, 20, 399–419. Available online: https://archimer.ifremer.fr/doc/00093/20405/ (accessed on 1 October 2022).
  84. Broglio, E.; Saiz, E.; Calbet, A.; Trepat, I.; Alcaraz, M. Trophic impact and prey selection by crustacean zooplankton on the microbial communities of an oligotrophic coastal area (NW Mediterranean Sea). Aquat. Microb. Ecol. 2004, 35, 65–78. [Google Scholar] [CrossRef] [Green Version]
  85. Bunker, A.J.; Hirst, A.G. Fecundity of marine planktonic copepods: Global rates and patterns in relation to chlorophyll a, temperature and body weight. Mar. Ecol. Prog. Ser. 2004, 279, 161–181. [Google Scholar] [CrossRef]
  86. Calbet, A.; Carlotti, F.; Gaudy, R. The feeding ecology of the copepod Centropages typicus (Kröyer). Prog. Oceanogr. 2007, 72, 137–150. [Google Scholar] [CrossRef]
  87. Chakraborty, S.; Mukherjee, A.; Mondal, S.; Das, S.; De, M.; De, T.K. A Case Study to Understand the Feeding Strategy of Some Selected Estuarine Copepods in Response to Mixed Phytoplankton Diet. IJRASET 2016, 4, 43–54. [Google Scholar] [CrossRef]
  88. Chen, M.; Liu, H.; Li, H. Effect of mesozooplankton feeding selectivity on the dynamics of algae in the presence of intermediate grazers a laboratory simulation. Mar. Ecol. Prog. Ser. 2013, 486, 47–58. [Google Scholar] [CrossRef] [Green Version]
  89. Di Carlo, B.S.; Ianora, A.; Fresi, E.; Hure, J. Vertical zonation patterns for Mediterranean copepods from the surface to 3000 m at a fixed station in the Tyrrhenian Sea. J. Plankton Res. 1984, 6, 1031–1056. [Google Scholar] [CrossRef]
  90. Gonzalez, H.E.; Smetacek, V. The possible role of the cyclopoid copepod Oithona in retarding vertical flux of zooplankton faecal material. Mar. Ecol. Prog. Ser. Oldendorf 1994, 113, 233–246. [Google Scholar] [CrossRef]
  91. Kiørboe, T. How zooplankton feed: Mechanisms, traits and tradeoffs. Biol. Rev. 2011, 86, 311–339. [Google Scholar] [CrossRef]
  92. Kiørboe, T.; Sabatini, M. Reproductive and life cycle strategies in egg-carrying cyclopoid and free-spawning calanoid copepods. J. Plankton Res. 1994, 16, 1353–1366. [Google Scholar] [CrossRef]
  93. Kiørboe, T.; Andersen, A.; Langlois, V.J.; Jakobsen, H.H.; Bohr, T. Mechanisms and feasibility of prey capture in ambush-feeding zooplankton. Proc. Natl. Acad. Sci. USA 2009, 106, 12394–12399. [Google Scholar] [CrossRef] [Green Version]
  94. Maar, M.; Visser, A.W.; Nielsen, T.G.; Stips, A.; Saito, H. Turbulence and feeding behaviour affect the vertical distributions of Oithona similis and Microsetella norwegica. Mar. Ecol. Prog. Ser. 2006, 313, 157–172. [Google Scholar] [CrossRef] [Green Version]
  95. Melo-Júnior, M. Produção Secundária e Aspectos Reprodutivos de Copépodes Pelágicos ao largo de Ubatuba (SP, Brasil). Doctoral Thesis, Instituto Oceanográfico, Universidade de São Paulo, São Paulo, Brazil, 2009. [Google Scholar]
  96. Ohtsuka, S.; Onbé, T. Relationship between mouthpart structures and in situ feeding habits of species of the family Pontellidae (Copepoda: Calanoida). Mar. Biol. 1991, 111, 213–225. [Google Scholar] [CrossRef]
  97. Paffenhöfer, G.A. On the ecology of marine cyclopoid copepods (Crustacea, Copepoda). J. Plankton Res. 1993, 15, 37–55. [Google Scholar] [CrossRef]
  98. Paffenhöfer, G.A. On the relation of structure, perception and activity in marine planktonic copepods. J. Mar. Syst. 1998, 15, 457–473. [Google Scholar] [CrossRef]
  99. Paffenhöfer, G.A.; Mazzocchi, M.G. On some aspects of the behaviour of Oithona plumifera (Copepoda: Cyclopoida). J. Plankton Res. 2002, 24, 129–135. [Google Scholar] [CrossRef] [Green Version]
  100. Razouls, C.; Desreumaux, N.; Kouwenberg, J.; de Bovée, F. Biodiversity of Marine Planktonic Copepods (Morphology, Geographical Distribution and Biological Data). Available online: http://copepodes.obs-banyuls.fr/en (accessed on 15 April 2022).
  101. Sautour, B.; Castel, J. Feeding behaviour of the coastal copepod Euterpina acutifrons on small particles. Cah. Biol. Mar. 1993, 34, 239–251. [Google Scholar]
  102. Steinberg, D.K.; Silver, M.W.; Pilskaln, C.H.; Coale, S.L.; Paduan, J.B. Midwater zooplankton communities on pelagic detritus (giant larvacean houses) in Monterey Bay, California. Limnol. Oceanogr. 1994, 39, 1606–1620. [Google Scholar] [CrossRef]
  103. Turner, J.T. Zooplankton feeding ecology: Contents of fecal pellets of the cyclopoid copepods Oncaea venusta, Corycaeus amazonicus, Oithona plumifera, and O. simplex from the northern Gulf of Mexico. Mar. Ecol. 1986, 7, 289–302. [Google Scholar] [CrossRef]
  104. Turner, J.T. The Feeding Ecology of Some Zooplankters that Are Important Prey Items of Larval Fish. Available online: https://aquadocs.org/bitstream/handle/1834/20603/tr7opt.pdf?sequence=1&isAllowed=y (accessed on 15 April 2022).
  105. VanderLugt, K.; Lenz, P.H. Handbook for the Cultivation of Two Hawaiian Paracalanid Copepods. Available online: https://www.researchgate.net/publication/267237260_Handbook_for_the_Cultivation_of_two_Hawaiian_Paracalanid_Copepods (accessed on 15 April 2022).
  106. Visser, A.W.; Stips, A. Turbulence and zooplankton production: Insights from PROVESS. J. Sea Res. 2002, 47, 317–329. [Google Scholar] [CrossRef]
  107. Vives, F. Distribución de la población de copépodos en el Mediterráneo Occidental. Available online: https://digital.csic.es/handle/10261/154639 (accessed on 15 April 2022).
Figure 1. Piranji Estuary (equatorial Southwestern Atlantic, Brazil), and location of the P1–P3 sampling sites along the mangrove estuarine ecosystem during an intense drought period.
Water 14 03648 g001
Figure 2. Piranji Estuary (equatorial Southwestern Atlantic, Brazil) with mangrove forests (left side) and the well-mixed shallow estuarine environment (right side).
Water 14 03648 g002
Figure 3. Mean precipitation (mm) of annual rainfall data (2000–2009), last drought cycle (2010–2014) [23] and collection date (2015) in Piranji Estuary (equatorial Southwestern Atlantic, Brazil) [32].
Water 14 03648 g003
Figure 4. Nutrients in the Piranji Estuary (equatorial Southwestern Atlantic, Brazil, 2015). Point upstream of the river (P1) to the point closest to the estuarine mouth (P3).
Water 14 03648 g004
Figure 5. Copepod abundance (ind.m−3) and salinity (mean with standard deviation) throughout the studied months in Piranji Estuary (equatorial Southwestern Atlantic, Brazil, year 2015). Point upstream of the river (P1) to the point closest to the estuarine mouth (P3).
Water 14 03648 g005
Figure 6. Copepod similarity analysis in Piranji Estuary (equatorial Southwestern Atlantic, Brazil, year 2015).
Water 14 03648 g006
Figure 7. Identification of the functional groups of copepods in Piranji Estuary (equatorial Southwestern Atlantic, Brazil) during an intense drought period (year 2015). Groups 1 and 2: sac spawners. Group 3: broadcasters. Ca: Calanoida. Cy: Cyclopoida. H: Harpacticoida.
Water 14 03648 g007
Figure 8. Copepod functional groups (ind.m−3) and salinity (mean and standard deviation) throughout the studied months in Piranji Estuary (equatorial Southwestern Atlantic, Brazil, 2015).
Water 14 03648 g008
Figure 9. Spatial variation in abundance (ind.m−3) of copepod functional groups in Piranji Estuary (equatorial Southwestern Atlantic, Brazil, 2015).
Water 14 03648 g009
Table 1. Intra-annual and spatial environmental variables in the Piranji Estuary (equatorial Southwestern Atlantic, Brazil, 2015). (T) temperature, pH, (DO) dissolved oxygen and (D) depth. Point upstream of the river (P1) to the point closest to the estuarine mouth (P3).
MonthStationT (°C)pHDO (mg/L)D (m)
FebruaryP129.15 ± 0.098.83 ± 0.023.79 ± 0.511.95 ± 0.63
P229.06 ± 0.428.76 ± 0.493.84 ± 0.731.47 ± 0.47
P328.07 ± 0.258.75 ± 0.095.55 ± 0.332.79 ± 1.40
AprilP128.19 ± 0.067.30 ± 0.014.18 ± 0.592.87 ± 1.12
P228.12 ± 0.037.62 ± 0.014.71 ± 0.112.28 ± 0.38
P327.94 ± 0.017.81 ± 0.045.68 ± 0.063.08 ± 1.72
JuneP128.42 ± 0.018.05 ± 0.014.77 ± 0.022.02 ± 0.44
P228.07 ± 0.038.07 ± 0.014.58 ± 0.812.56 ± 0.73
P327.15 ± 0.018.03 ± 0.075.48 ± 0.043.35 ± 1.06
AugustP127.02 ± 0.017.92 ± 0.014.64 ± 0.041.59 ± 0.27
P225.89 ± 0.018.18 ± 0.015.13 ± 0.101.65 ± 0.65
P325.60 ± 0.018.13 ± 0.015.94 ± 0.033.30 ± 0.90
OctoberP127.58 ± 0.017.89 ± 0.016.01 ± 0.051.78 ± 0.45
P227.02 ± 0.027.73 ± 0.014,65 ± 0.652.82 ± 1.07
P326.15 ± 0.017.66 ± 0.015,73 ± 0.102.86 ± 0.93
DecemberP128.28 ± 0.028.60 ± 0.055.77 ± 0.801.82 ± 0.82
P227.64 ± 0.208.48 ± 0.015.00 ± 0.941.59 ± 0.41
P326.83 ± 0.058.47 ± 0.036.04 ± 0.012.81 ± 0.78
Table 2. Salinity at the three sampling points (P1, P2, and P3) in Piranji Estuary (equatorial Southwestern Atlantic, Brazil, 2015). Point upstream of the river (P1) to the point closest to the estuarine mouth (P3).
FEBAPRJUNAUGOCTDEC
P145936425563
P2452637394652
P3393738373939
Table 3. BEST (BIO-ENV stepwise) test results in Piranji Estuary (equatorial Southwestern Atlantic, Brazil, 2015). Sal: salinity; P: depth; Ammoniacal N; total nitrogen: NT; total phosphorus: PT; total suspended solids: TSS; chlorophyll a: Chl a.
CorrelationNumber of FactorsFactors
0.5764Sal, NT, silica e Chl-a
0.5645Sal, Ammoniacal N, NT, silica and Chl-a
0.5635P, Sal, NT, silica and Chl-a
0.5613Sal, silica and Chl-a
0.5597P, Sal, Ammoniacal N, NT, PT, silica and Chl-a
0.5596P, Sal, Ammoniacal N, NT, silica and Chl-a
0.5587P, Sal, Ammoniacal N, NT, silica, SST and Chl-a
0.5585Sal, NT, silica, Chl-a and Feofitina-a
0.5575Sal, NT, PT, silica and Chl-a
0.5556Sal, Ammoniacal N, NT, silica, SST and Chl-a
Publisher’s Note: MDPI stays neutral with regard to jurisdictional claims in published maps and institutional affiliations.

