Article

Farmers’ Perceptions on an Irrigation Advisory Service: Evidence from Tunisia

1
Institut National Agronomique de Tunisie (INAT), Université de Carthage (UC), 1082 Tunis, Tunisia
2
International Center for Agricultural Research in the Dry Areas (ICARADA), 1082 Tunis, Tunisia
3
Institute for Technology and Resources Management in the Tropics and Subtropics (ITT), TH Köln—University of Applied Sciences (THK), 50679 Cologne, Germany
*
Author to whom correspondence should be addressed.
Water 2022, 14(22), 3638; https://doi.org/10.3390/w14223638
Submission received: 29 September 2022 / Revised: 4 November 2022 / Accepted: 8 November 2022 / Published: 11 November 2022
(This article belongs to the Section Water, Agriculture and Aquaculture)

Abstract

:
Decisions on irrigation water management are usually made at different levels, including farms, water user associations (WUAs), and regional water planning agencies. The latter generally have good access to information and decision tools regarding water resources management. However, these remain out of reach to the final water users, namely the farmers. The study, conducted in the irrigated district of Cherfech, north Tunisia, had the main objective of investigating farmer’s perceptions of, and acceptance for, the use of an irrigation advisory service (IAS) to be implemented by their WUA. The suggested IAS provides the following information: (1) reference evapotranspiration (ETo) and rainfall; (2) crop water requirement (CWR) of the most cultivated crops; (3) irrigation water requirement (IWR) of the farmer’s crop; and (4) crop monitoring and real-time estimation of IWR of crops settled, using soil moisture sensors. Such services and information would be available at the WUA level and provided in a timely manner to farmers for more effective decision making at the plot level. Prior to the acceptance study, we launched a technical study to determine the required tools and equipment required for the implementation of the IAS, followed by a farmer survey to assess their respective perceptions and acceptance towards this IAS. Results showed that only 54% of the farmers are satisfied by WUAs work, but that 77% of them accepted using the suggested IAS. Farmers are also willing to pay for most of the IAS packages suggested. The financial profitability of investing in the IAS at the WUA level shows the venture is financially viable, with a benefit cost ratio (BCR) of 1.018. The project will be even more profitable if we add the social benefits, which may result in water savings at the WUA level.

1. Introduction

The development of water-saving agricultural practices and advanced irrigation management tools are key to improving water use efficiency at different operating levels (plot, farm, and landscape). In developing countries, different information and decision-making approaches for supporting irrigation managers have been developed, tested, and validated, and demonstrated for their effectiveness at the piloting stage [1]. However, due to various technical, economic, and social constraints, the access, use, and large-scale dissemination of these irrigation management approaches remains very low in most developing countries.
The definition of scientific irrigation scheduling refers to when and how much to irrigate, based on physical measurements that estimate crop-water use and the soil-water status. However, scheduling methods need to be simplified to match the time constraints, training level, and financial capacities of potential users [2].
As such, many IAS have been successfully developed and implemented in multiple areas of the world to assist with irrigation scheduling at different levels. IASs are being developed as effective tools for improving irrigation water management, using the irrigation district as an action framework [3].
One of the best-known IAS is the California Irrigation Management Information System (CIMIS) [4]. In Spain, a local IAS has also been successfully implemented in Castilla-La Mancha, which has played an important role in improving irrigation water management [3] in that water basin.
Several studies have been conducted to analyze the feasibility of IAS implementation at different levels, and through the use of different technologies and approaches such as decision support systems [5,6,7,8]. Moreover, devices such as tensiometers, gypsum blocks, and infra-red thermometers have been introduced in different parts of the world to assist farmers in determining when and how to irrigate [9].
However, adoption of these technologies is often limited, as a result of facing various challenges. The authors of [10] identified the main challenges as being varied: from poor infrastructure and lack of information and communications technology (ICT) knowledge to lack of appropriate policies and inefficiencies in agriculture institutions. Moreover, the adoption and use of these innovations has always been restricted to some of the larger commercial farms [9,11,12], as they are not yet attractive enough to smaller farmers. This, in turn, has impeded the uptake and adoption of such innovations [13].
Several studies have assessed farmers’ perceptions and willingness to adopt technologies and innovations [14]. Some of these [15,16,17] underlined the lack of access to information about how these new technologies work as a key constraint to farmers in scaling and adoption. The authors of [18] highlighted that these technologies require financial investment in learning and/or hiring external services from farmers, which can also prove limiting. Other studies show that while farmers rate agricultural information as very relevant, information specifically related to the adequacy and availability of new and existing technologies remains a very important factor for adoption [19].
Despite difficulties being identified in relation to the integration of an IAS in some contexts (such as the technical limitations or performance of the IAS), these services were shown to be a relevant support for the improvement and assessment of the agricultural water management [20]. The authors of [21] showed that, in the irrigated district of Baixo Acaraú in Brazil, the implemented IAS improved water irrigation management in most areas when farmers followed the advised crop irrigation requirements. The authors of [22] observed an increase in the use of ICT for irrigation management at the WUA level in the Valencian community of Spain, particularly in large, irrigated districts mainly driven by the scarcity of the water resources. Regarding the use of ICT in Tunisia, the agricultural sector presents the biggest potential in terms of development and could largely benefit from its usage [23]. Agricultural extension services are well developed in the country, but mainly focus on crops, fertilizers, pesticides, and equipment, rather than water use issues [24].
Irrigation decision support services can also be implemented and managed by existing WUAs. The WUA level is appropriate, because ICT adoption increases when farmers are members of a farmers’ association [25]; plus, it would be easier to advise a group of farmers rather than doing so separately [9]. Furthermore, WUAs have become one of the most acknowledged forms of local organizations for irrigation management and play an important role in increasing public participation in local irrigation management. They also significantly contribute to the improvement of participatory water governance and implementation of integrated water resource management. Finally, WUAs represent famers locally, and thus are the best organization to reflect farmers’ concerns and requirements in relation to irrigation.
Based on this review and given that the development of an IAS has been evolving rapidly in Tunisia, the objective of this study is to contribute to the specialized literature by investigating the technical and economic feasibility and farmers’ acceptance of different forms of IAS locally developed and tailored to the Tunisian context. The developed IAS prototype was suggested and demonstrated to farmers in Cherfech, north Tunisia. Following this, a survey based on questions regarding willingness to adopt, among others, was conducted to better understand opportunities and bottlenecks pertaining to IAS uptake.

2. Materials and Methods

2.1. Proposed IAS Configurations and Levels of Deliverable Information

In this study, four IAS configurations (as described in the sections below) were proposed to farmers with each choosing one depending on the level of technology they require and the level of the deliverable information available. The IAS would be managed by a trained technician within the WUA office and he would be responsible for monitoring, calculating, and distributing information to farmers.
The configurations were proposed at two levels: regional (first and second configurations) and plot (third and fourth configurations).

2.1.1. Information of Reference Evapotranspiration and Rainfall

The first service would provide information of daily ETo and rainfall. This would be displayed at the WUA office every day, and shared weekly through SMS or phone calls to the farmer. The main advantages are the rapidity of access to the information. However, because this information remains somewhat broad, the farmer requires good additional knowledge of the crop water requirement and the water balance for this configuration to be effective in guiding their irrigation operations.

2.1.2. Information on Crop Water Requirement of the Main Crops in the Study Site

The second service is based on the calculation of the crop water requirement (CWR) of the main crops of the irrigation site with a fixed sowing date, cutting dates, and average crop cycle, in addition to average soil characteristic of the region. The advantage of this service is that it can give a general idea of the CWR at the level of the irrigated district calculated with real-time climatic data. The main constraints are that, within the same irrigation scheme, the planting date of the same crop is spread over a long period (as per the farmer’s individual practices). This can vary from two to four weeks and does not take into consideration the specificity of each farmer (ability to buy the water, water availability at the farm level, and following of his own practices). The irrigation schedule is then estimated weekly using the average data, and information will be available at the WUA office and distributed to the farmer in tabular form or displayed on a board.

2.1.3. Information on Water Irrigation Requirement of the Farmer’s Crops

The third service is more personalized and provides the WIR of the crops, taking into consideration each farmer’s specific practices (variety of crops, sowing dates, crop cycles, cutting date, irrigation system efficiencies, and soil characteristics of the plots).
In order to make the water balance estimations as precise as possible, this service requires the farmer’s direct participation. For example, they must provide actual data of their crop irrigation management, along with other personal agronomic information and practices (such as actual irrigation practiced, sowing date, cutting dates, the average budget for irrigation to provide to the crops throughout the cycle, etc.). This would help the WUA’s management staff calculate and provide optimum water supply to the plot. The information—regarding when and how much water should be applied to each plot in real time—will be available at the WUA, sent by SMS or through a phone call, or given to the farmer in-person. The advantage of this service is that the information provided will be based on a real water balance model of the plots, thus ensuing greater accuracy and reliability.

2.1.4. Crop Monitoring and Real-Time Estimation of Water Irrigation Requirement of Crops Settled Using Soil Moisture Sensors

The last service could be considered the best technological package that can be provided and combines water balance modeling with the use of soil moisture content sensors. It includes the installation of soil water content sensors at the plot level, so water content can be monitored at different soil depths and depending on the crop. It will also allow farmers to apply the exact amount of water required for the crop. The service would be provided directly to the farmer by SMS or through phone calls.

2.2. Equipment and Tools Required for the Suggested IAS Packages

The proposed services are based on the water balance approach, which estimates the soil water content in the root zone by accounting for all water additions and subtractions in this area. Necessary equipment is then related to the climatic parameters and soil moisture measurement. To be affordable to farmers, the service should be based on low-cost equipment with minimum investment required.
To obtain precise information for modeling the IWR, an automatic weather station (to obtain climatic data) would need to be installed within the irrigated district and close to the WUA office. Soil water content sensors with data-loggers would also need to be installed at the farmer’s fields.
To estimate the crop IWR, the MABIA decision support software [7,26,27] would be used to compute the irrigation requirement, based on the dual crop coefficient (Kc) method proposed by the Food and Agriculture Organization’s (FAO) Irrigation and Drainage Paper No. 56 (FAO-56). The MABIA approach has been largely used for water irrigation evaluation and management [28,29,30], as well as for assessment studies on the impact of climate change on water resources [31,32,33]. Figure 1 shows the organization chart of the proposed services, according to the required equipment.

2.3. Main Characteristics of the Study Area

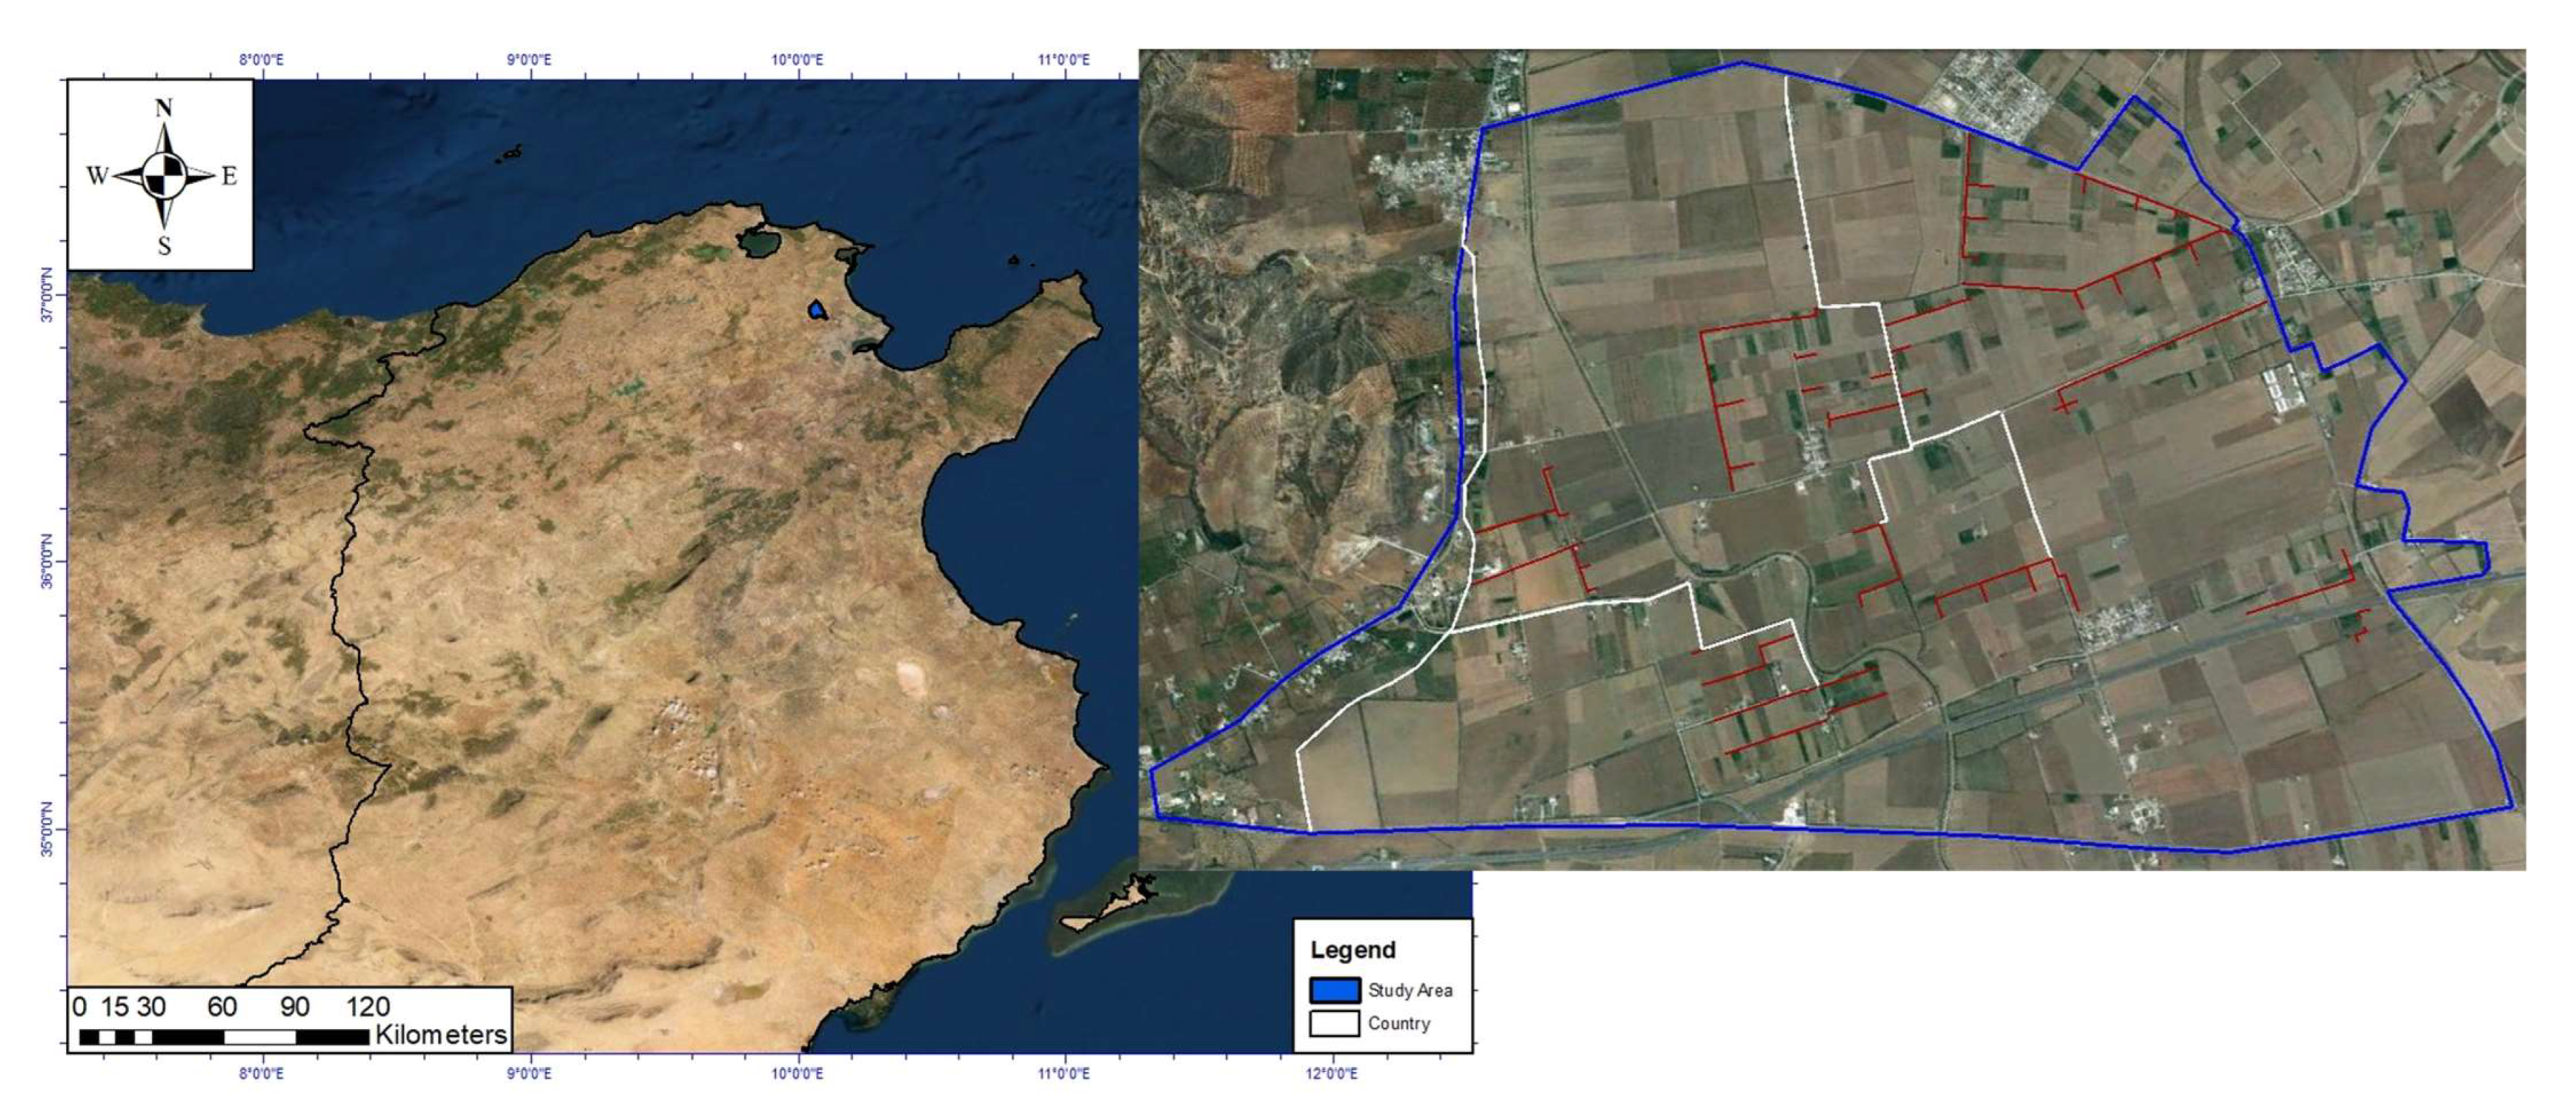
Cherfech, an irrigated district located within the Basse Vallee de Medjerda, near the town of Cherfech (Lat. 36°57′ N, Lon. 10°02′ E, and elevation 8 m) in the north of Tunisia, was chosen as the focus of this research (Figure 2). This area was selected for the establishment of an IAS due to the diversity of its crops cultivated, including cereals, forages, winter vegetables, and fruit trees. The area also includes different irrigation systems such as surface, drip, and sprinkler. This irrigated district covers 2022 ha and is subdivided into 22 hydraulic sectors serving 127 farms of variable sizes. The irrigated district of Cherfech belongs to the upper semi-arid zone and is characterized by an average precipitation of 509 mm/year, which is unevenly distributed over time with peaks in winter and spring. The annual ETo is about 1552 mm, with the highest monthly value of the ETo reached during July (177 mm) and the lowest value (29 mm) obtained in December.
The source of irrigation water is the Medjerda-Capbon canal. The irrigation network in the Cherfech district is based on open-flow channel systems of different sizes. At the level of the irrigated district, water distribution is conducted through a system of secondary and tertiary channels. The network was designed to perform according to the principle of the water turn among beneficiary farmers (meaning water is distributed on a turn-by-turn basis; farmers cannot irrigate simultaneously). However, since 2009, distribution has alternated between water turn during summer and on-demand water distribution during winter. The water turn principle is only applied when a conflict arises between farmers of the same sector or from different hydraulic sectors.
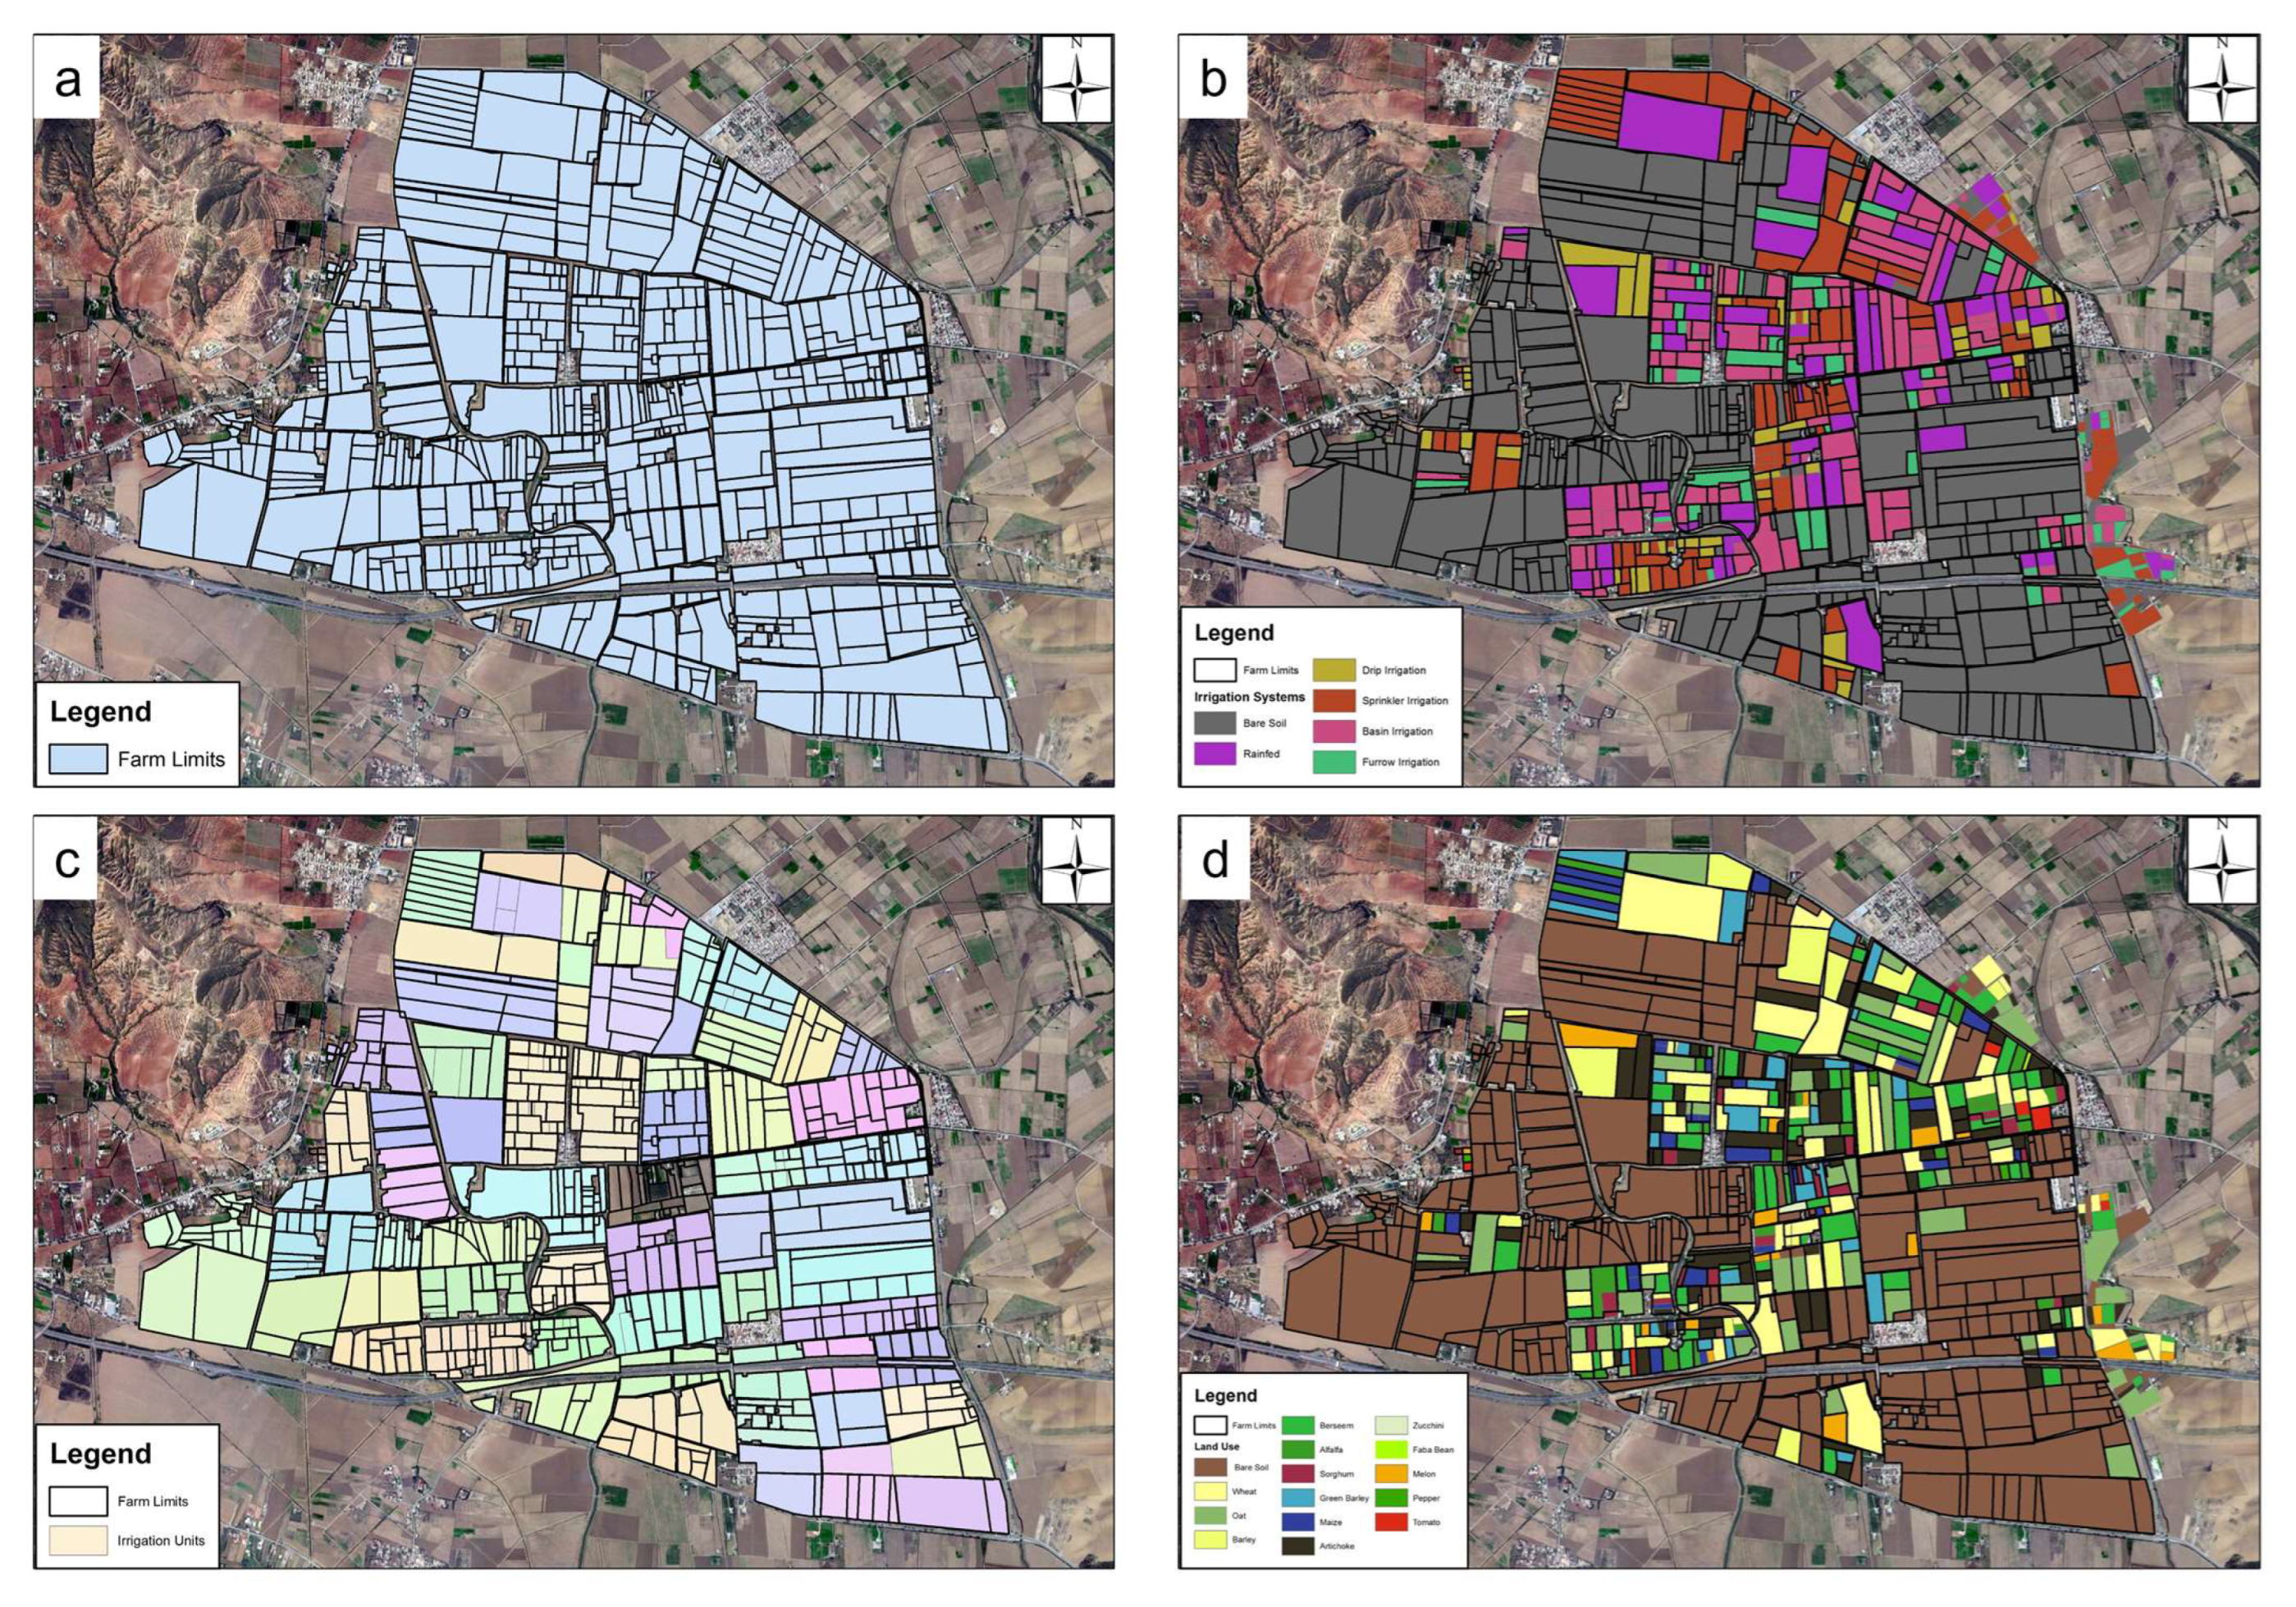
To adequately depict the irrigation district of Cherfech at the WUA level and facilitate information transfer, a geographic information system (GIS) database was created to collect data concerning the irrigated districts’ limits, farm and plot limits, water network transfer, land use, and irrigation systems. This information comes from different sources and formats (maps, plans, and tables in paper and digitized format) and is composed of varying layers that can be integrated and used for the creation of thematic maps. As a result, thematic maps of farm and plot limits, land use during the 2019/2020 growing season, and used irrigation systems were created. Figure 3 represents four thematic maps of the irrigated district of Cherfech: (a) the farm limits; (b) the irrigation system used; (c) the limits of the irrigation units; and (d) the land used during the growing season.

2.4. Data Collection

Surveys were conducted to collect farmers’ data and learn their acceptance of the suggested IAS. Farmers were randomly selected using accidental sampling (a non-probability random sampling method) and interviewed individually (to avoid influence from other farmers) within the irrigated districts. The duration of each farmer interview was about 40 min, during which the suggested IAS service packages were first introduced and described to farmers, and then related perception questions were asked.
The questionnaire was structured in five sections (across 20 questions), designed based on the literature review, and developed and validated with the help of local experts working in the administration and extension sector.
  • The aim of the first section of the questionnaire was to understand and profile the farmers. The questions asked regarded the age of the farmer, their educational level, the total area of labor, and their cropping pattern during the 2019/2020 cropping season.
  • The second section of the questionnaire comprised two open questions, developed to understand how farmers determine when to irrigate and how much water to apply.
  • The third section concerned farmers’ perceptions of the WUA by the farmers: understanding how farmers view their WUA’s performances and the quality of its services, along with what their expectations are for the WUA’s enhanced services.
  • The fourth section asked farmers about their knowledge of different decision support technologies and irrigation models, as well as their acceptance for the implementation of an IAS at the WUA level. Four services were proposed and individually described, after which farmers were asked which suited them the most. Following this, the price of each service was shared with farmers, who then provided their final decision based on the pricing information.
  • The final part of the questionnaire concerned the willingness of farmers to pay for different IAS packages.

3. Results

Twenty-seven farmers (from a total of 127 farmers in the region) were selected using the accidental sampling method and then interviewed. This figure represents 20% of the farmers in the irrigated district. Farms owned by the sampled farmers cover a total of 385 ha (20% of the total area of the irrigated district of Cherfech). Statistical methods such as Pearson correlation, Mann–Whitney U test, and the X2 test were used for the data analysis. The Pearson correlation was used to analyze the correlation between the farmers’ profiling variables. The Mann–Whitney test was used to analyze the influence of the farmers’ profiling variables on the acceptance of the IAS. The X2 test was used to check the statistical significance between the price selection of the service and the farmers’ profiling variables. These statistical tests are commonly used in farmers’ profiling and studies that deal with farmers’ perceptions towards agricultural services, practices, adaptation, or impacts [34,35,36,37,38].

3.1. Farmer Profiling

From the data analysis of the survey conducted on 27 farmers, six typifying variables were considered regarding the farmer’s features, the farm characteristics, the agricultural cropping pattern, and the irrigation systems (Table 1).
The results of the study show a certain heterogeneity of the sample interviewed, which is representative of the irrigation district. The age of interviewed farmers ranged from 29 to 75 years old, with about 33% of those questioned aged between 50 and 60. Older farmers (>60 years) represented 37% of the sampled group, with 18.5% aged between 60 and 70 years and 18.5% of farmers older than 70 years. Finally, younger farmers (<50 years old) represented 30% of the interviewed sample.
Education. Five levels of education were identified among participants: illiterate, quranic, primary, secondary, and university. Illiterate farmers represented 15% of the sample, while 4% went to quranic school and 37% of farmers had received primary school education. Twenty-two percent of the farmers had been to high school and twenty-two percent held a university degree. In 2000, [39] found out 80% of farmers from the one irrigated district only had a primary education, meaning our results show an evolution of farmers’ education levels over the last decade. This may be explained by the fact that farmers’ sons are taking over the farm responsibilities and receive longer educations.
Farm size. The majority of interviewed farmers (78%) possessed a farm size lower than 15 ha: About 33% of farms were 10–15 ha in size, while 29% were 5–10 ha, and 16% were less than 5 ha. Farms larger than 15 ha represented 22 % of the sample and were distributed between farms sized between 15 and 20 ha (8%) and between 20 and 25 ha (3%). Only 11% of farms had a total area higher than 25 ha.
Plots. For the 2019/2020 growing season, the survey identified the number of plots per farm. The results were then divided into six groups, depending on the number of plots. A total of 7.4% of farms had a single plot, 11% had two plots, and 18.5% had three plots. A total of four plots was the highest number among farmers and represented 30% of those interviewed. Finally, 14.8% of the farmers had five plots and 18.5% had more than this amount. Similar numbers were recorded by [7] during the 2010–2011 growing season.
Irrigation systems. Farmers were divided into two groups: those using pressurized irrigation systems (PI) and those using surface irrigation systems (SI). Interview results revealed that 63% of the farmers use pressurized irrigations systems, such as sprinkler and drip irrigation, while 37% still use surface irrigation systems, such as furrow and basin irrigation. Compared to [40], we noted an increase of the adoption of pressurized systems in the same area (51% in 2011 against 63% in 2013).
Cropping patterns. Ten groups of cropping patterns were identified as being conducted by farmers. Around 18.5% of interviewed farmers have a single cropping pattern, with 3.7% cultivating cereals (C), 3.7% cultivating forage crops (F), 7.4% cultivating vegetables (V), and 3.7% cultivating fruit trees (T). The remaining 81.5% cultivate more than one crop, with a combination of: cereals and forages (CF = 29.6%); cereals and vegetables (CV = 7.4%); cereals, forages, and vegetables (CFV = 29.7%); cereals, forages, and fruit trees (CFT = 7.4%); cereals, vegetables, and fruit trees (CVT = 3.7%); and crop, cereals, forages, vegetables, and fruit trees (CFVT = 3.7%). The fact that the main cropping patterns used are the CF and CVT confirms findings from studies conducted by [7,39], which shows that the dominant crop rotation is the triennial type (CFV). The same studies showed that around 20% of farmers applied a biennial crop rotation (CF or CV).
Following the farmers’ profiling assessment, a correlation analysis was conducted, including six demographic and technical (irrigation-related) variables. The results are presented in Table 2.
Table 2 shows a significant correlation, at the level of 5%, between farmers’ age and education level (−0.472), demonstrating that the older the farmer, the lower his level of education. A significant correlation at the level of 5% is found between the age of farmers and the cropping pattern (0.456). The older the farmer, the more likely they are to diversify their crops. A significant correlation, again at the level of 5%, was also found between education and the number of plots (−0.442), indicating that the more educated the farmer, the more likely they are to reduce their number of plots. Table 1 also shows that the older the farmer, the more likely they are to have a higher number of plots (significant correlation at the 1% level and a value of 0.502). A significant correlation at a level of 1% is also found between the cropping pattern and the number of plots (0.637). The more complex the cropping pattern, the higher the number of plots per farm.

3.1.1. Farmer’s Irrigation Decision Criteria and Knowledge and Use of Irrigation Decision Tools

In order to better understand farmers’ irrigation decision making processes, two questions were asked: “How do you know when to irrigate?” and “How do you determine the amount of water to apply?”
Forty-one percent of farmers answered that they rely on the soil and crop condition to decide when to irrigate, while eleven percent base their decision on a combination of the climate, the soil, and the crop. Meanwhile, 15% stated they base their frequency of irrigation on a fixed CWR calendar. Finally, 7% of farmers declared relying on established practices: Irrigation frequency is fixed depending on the crop type. For example, during spring, alfalfa should be irrigated once every two weeks, while artichokes should be irrigated every two to three days in August.
When deciding how much water to apply, results show that 30% of farmers irrigate until the soil saturation is reached. Meanwhile, 15% of farmers use information about the amount of water required by the crop, 11% irrigate according to water availability at the farm level, and 19% stated the amount of water applied depends on water availability and the soil water content. Finally, 7% declared the amount of water they apply aligns with a fixed crop calendar, and 18% relied on previous knowledge and experience.
When asked if they were aware of technologies that assist with irrigation decision making, only 22% responded yes, compared to 78% who did not know about the existence of such technologies. None of the interviewed farmers declared using technologies, such as sensors or real time irrigation scheduling, although 15% revealed they use fixed irrigation scheduling.

3.1.2. Perception of the WUA among Farmers

A question was asked to gauge farmers’ perceptions around the role of WUAs. Fifty-nine percent of farmers answered that the role of the WUA is water distribution and the billing process, while only fifteen percent knew that WUAs are responsible for the distribution, billing, and maintenance of the network. Meanwhile, 11% believed that the role of WUAs is the distribution of water among farmers. Regarding perceptions of WUA work, 54% of farmers feel the WUA is doing a good job and are satisfied by their work, but 34% were unsatisfied. A total of 4% judged the work as ‘passable’, expressing that with the means available to WUAs, farmers cannot expect better. The remaining 8% did not provide an opinion on the subject.

3.2. Acceptance of an IAS at WUA Level

The interview results show that 77% of farmers responded positively to the idea of implementing an IAS at the WUA level. Despite 54% of farmers being satisfied with the WUA’s current work, they support the idea that the WUA would provide—in addition to the existing service of providing, billing, and maintenance of the network—an advisory service for irrigation scheduling.
To study the acceptance of an implementation of an IAS, a Mann–Whitney U test was conducted to examine the relation between the acceptance of the service and the different parameters of the farmers’ profiles. The Mann–Whitney test was conducted to determine whether farmers’ variables were statistically significant in the acceptance of the IAS. Table 3 shows no significance between the farmers’ variables and acceptance of the IAS.
The acceptance of the service does not depend on the farmers’ variables. As such, the farmers’ profiles cannot be considered as significant parameters in explaining the acceptance among them for the suggested IAS.

3.2.1. Choice between Proposed Services and Interactions with the Prices

In order to ascertain the effect of price differentials on the farmers, they were asked to select the same four services at two stages: first, before they knew of the cost, and again once they had been informed of prices (Table 4).
It should be noted that, after the disclosure of prices, 7.4% of the farmers decided not to select any of the suggested services. Before prices were revealed, 15.8% of the farmers selected the first service, 47.4% selected the third service, and 36.8% selected the fourth service. No farmers selected the second service. After the disclosure of the prices, the number of farmers who selected the fourth service dropped to 11.8%. The first service received 27.2 % of votes and the third service was selected by more than half of the farmers (54.4 %). Even after the disclosure of prices, the second service was not selected. This can be explained by the fact that this service provides an estimation for irrigation based on a specific agricultural practice (fixed date of cropping, fixed soil characteristics, fixed date of cutting, etc.), but the farmers want a level of specificity and independence towards the date of crop installation and the practice of the irrigation.
A Pearson chi-square test was also conducted for the selection of the service before and after the price disclosure, in relation to the six profiling farmers’ variables. The chi-square test showed that the choice of service and each of the variables were statistically independent (Table 5).

3.2.2. Perception of the Service Prices

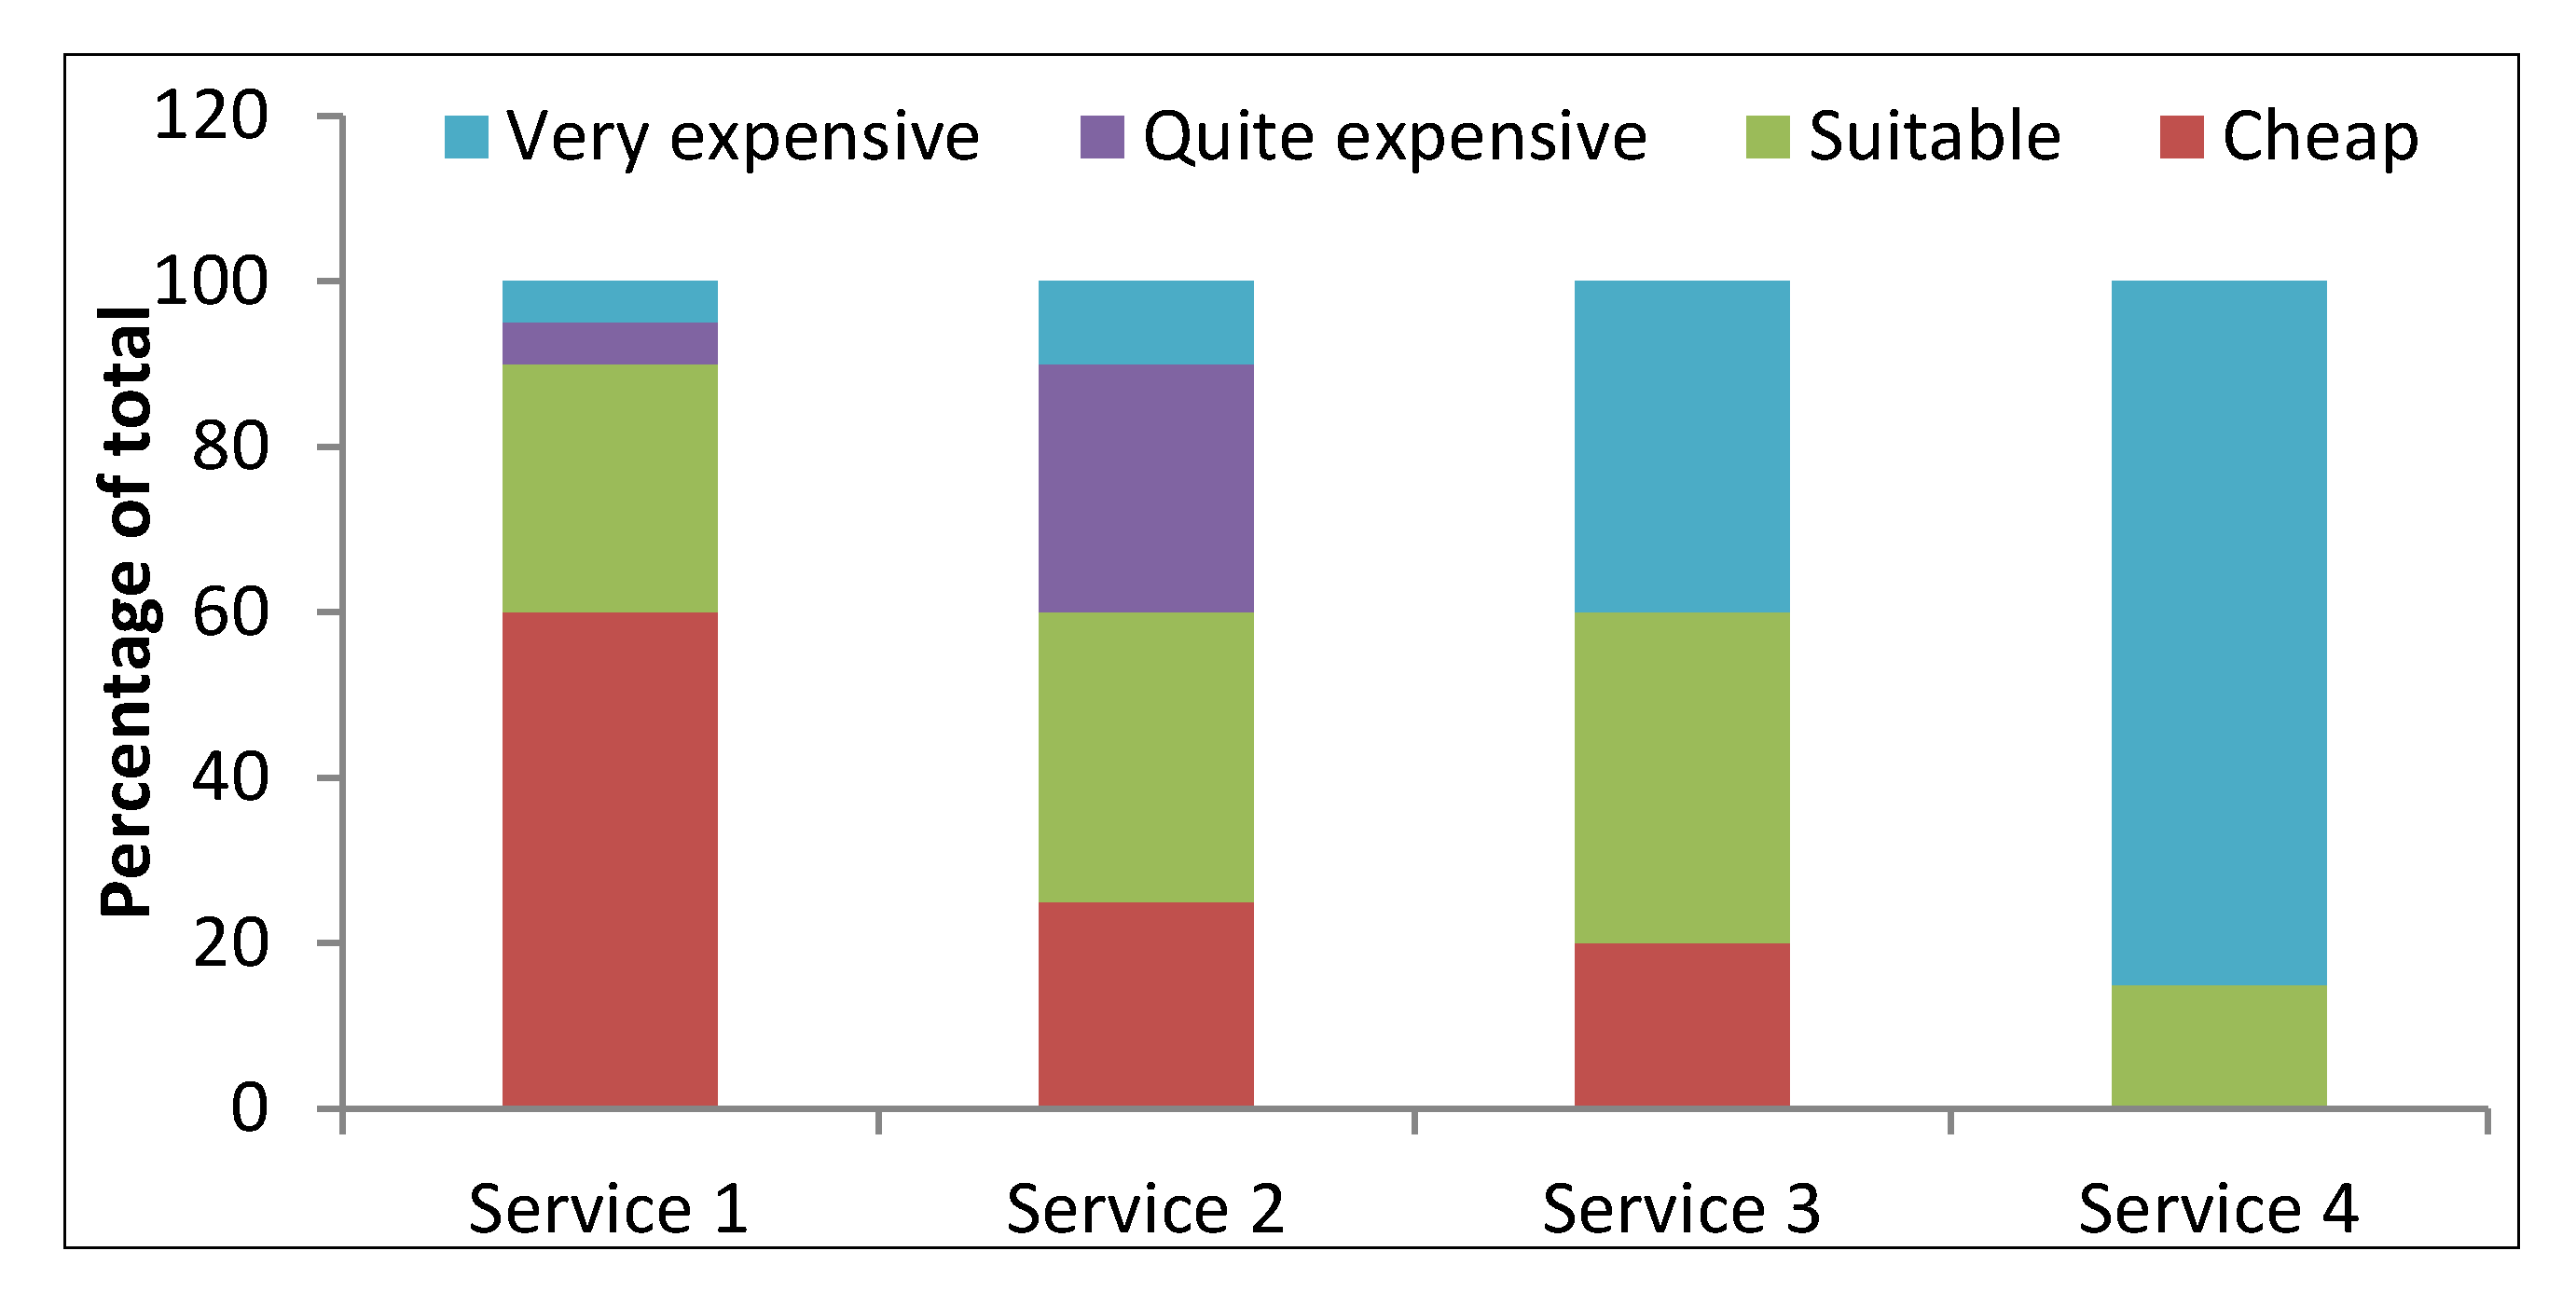
The price for each service (detailed in the Methodology section) was presented to the farmers, in order to understand whether they perceived it to be good value. The proposed monthly prices were 5 Tunisian dinar (TND) for service 1, 8 TND for service 2, 18 TND for service 3, and 40 TND for service 4, all as a monthly rate. For each price, the farmers had to choose between four possible answers: cheap, suitable, quite expensive, and very expensive. The price range for each service was then determined following farmers’ feedback. Figure 4 shows the different services, their prices, and perceptions of these among farmers. The highest service price (for service 4) was perceived by farmers as very expensive.
Regarding service 1, 60% of farmers found its price of 5 TND to be very cheap, while 30% considered it suitable. Five percent of farmers believed the price for service 1 was quite expensive, and the same amount felt it was very expensive. For service 2, 25% of the farmers said the service was cheap, while 35% found it suitable. Thirty percent of farmers said the price was quite expensive and ten percent said it was very expensive. Concerning service 3, only 20% of farmers considered the price to be cheap, while 40% found the price was suitable and 40% believed it was very expensive. Finally, for service 4, 85% of farmers stated the service was very expensive and only 15% said the price was suitable.

3.3. Financial Feasibility of Payment for an IAS

To analyze the viability of the (paid) IAS technology and to ascertain a price range for the different services the WUA would offer, a feasibility study was then created based on the results obtained from the survey taking into consideration the preferences of the farmers following the disclosure of prices. A sensitivity analysis (results in Section 3.3.4) was then conducted to determine the resilience of the project by increasing the total costs (investment, operating, and labor costs) and applying a decrease to the price of the services.

3.3.1. Investment and Operating Costs

The investment costs of the IAS at the WUA level are represented in Table 6. The total investment costs per year are 18,400 TND. The depreciation rate is fixed for four years, which represents a depreciation rate of 25% per year.
Concerning operating and labor costs, Table 7 shows the office operating costs, the mobile unit costs, and labor costs, totaling 17,220 TND annually. In order to operate the IAS, one laborer would be required to operate the service.

3.3.2. Benefits

For the first year, the total number of customers (obtained from the survey) was projected to be 77% of the 127 farmers in the irrigated district (98 farmers). For the first service, the number of users was hypothesized as 29, the second service as 0, the third service as 58, and 12 for the fourth service.
During the second year, the number of customers projected is (once again) 98 farmers in the irrigated district and 15 farmers located around this area. The total numbers of users would then be 113: 33 for the first service, 0 for the second service, 66 for the third service, and 13 for the fourth service.
With regards to the third year, an increase of 10% (compared to the second year) in the number of the customers would be anticipated, representing a total of 125 farmers with 37 selecting the first service, 74 selecting the third service, and 15 selecting the fourth service. The number of the total customers would then stabilize for the following years of the project.
Concerning the prices of the different services, the survey shows that farmers judged them to be suitable and cheap. The farmers’ opinions were considered when building the price for each service.
During the first year, the total benefits would be 20,028 TND, 22,476 TND in the second year, and 25,404 TND in the third year.

3.3.3. Benefit/Cost Ratio and Internal Return Rate

The benefit/cost (B/C) ratio for a 15-year project duration was calculated by taking the value of benefits and dividing by the value of costs. The life span of 15 years was selected because beyond this period the obtained value of the cash flow is negligible. Moreover, based on an exhaustive review done by [41], the life span of water saving irrigation technologies varied from 10 to 20 years. From this, the B/C ratio obtained was 1.018 and, since this exceeds the value of 1, the project can be considered feasible.
An internal rate return (IRR) was also calculated for 21 years. The IRR was 19%, which shows the feasibility of the project, and is above the opportunity costs of 12%, which means the project has the potential to be highly successful. The selected discount rate for the implementation of the IAS is in the range that has been considered to represent the overall average for the appropriate discount rate varying commonly from 6 to 15% in developing countries [42,43]. As such, the WUA of the studied irrigated area can generate profit from this project and use the money to provide farmers with micro credits.

3.3.4. Sensitivity Analysis

To determine the resilience of the base project, a sensitivity analysis was applied. The first scenario of the sensitivity analysis saw total costs increased by 10%. Based on a discount rate of 12%, the results show that the B/C ratio obtained was 0.97. Concerning IRR, the value was 9%. The second scenario saw the price decreased by 10%, along with the total benefits. Concerning the B/C ratio, the value obtained was 0.96. Concerning IRR, the value found was 7%.
The sensitivity analysis shows that the project may not generate a lot of benefits, but would at least cover its investment costs. Since the IAS would play a significant social role in helping farmers in their irrigation decisions, the social and environmental sustainability of the project should also be considered as feasible.
The results show that implementing an IAS at the WUA level is a feasible project and can be economically sustainable.

4. Discussion

This study used technical, social, and economical analysis to examine the implementation of an IAS at the level of an irrigated district in Tunisia. Depending on the required level of technology and the level of the deliverable information available, four services were selected. These four services are comparable to different irrigation advisory entities already functioning in Spain, France, Greece, South Africa, and Italy [44,45,46,47,48] and showed a significant improvement in water use and water productivity.
Besides the IAS acceptance process, the analysis is also conducted in conjunction with the concept of technological additivity to examine the acceptance and rejection of new technologies in agricultural practices. In fact, the survey results showed that the acceptance of the service does not depend on the farmers’ variables. Additionally, in the actual context of climate change and water resource shortage, survey results implicitly show that technological additivity allows the addition of new values which makes the adaptation of new practices and the reception of new technologies more applicable. This confirms the results of [49], where they pointed out that changing mindsets are difficult and can only be achieved by repeating and continuously squeezing out inappropriate values and absorb new ones that fit or complement the context better (mindsponge mechanism).
Moreover, selecting the WUA level as the implementer of the IAS was built based on farmers’ trust toward the WUA (77% of farmers responded positively to the IAS at the level of their association). These results are supported by the mindsponge theory where on a collective level, generalized trust closely goes with social connectedness [50]. This positive trust would act as a ‘priority pass’ and thus helps shift the perceived value of related information to be more beneficial [51]. Additionally, regarding the information value delivered by the IAS, the obtained results reveal that 92.6% of farmers judged that the perceived benefits are greater than its perceived costs and the proposed information’s value is deemed positive and the acceptance of the information can move into the mindset and become a new trusted value [51].
On the perception of the services price, service 3 was the most selected one before and after the price submissions. The finding here is personalized and provides the WIR of the crops, taking into consideration each farmer’s specific practices (variety of crops, sowing dates, crop cycles, cutting date, irrigation system efficiencies, and soil characteristics of the plot) that the farmer’s willing to pay for a suitable and personalized service at the plot level, taking into consideration their specificities regardless the price factor.

5. Conclusions

This study explored the concept of an IAS adapted to the specific conditions of farmers in an irrigated district of north Tunisia. The area is characterized by the non-existence of such a service, whether private or public. The farmers have limited knowledge about water irrigation requirements and scheduling, limited financial resources to take counsel from private consultants, and low means of information. The only organization founded on and utilizing farmers’ participation is the WUA, whose role is primarily water distribution, maintenance, and billing.
The proposed solution is the implementation of an IAS at the WUA level. This service would be managed by a technician who will be in direct contact with the farmers. In order to understand potential constraints, a study was conducted whereby four types of services were offered to farmers. The first service would provide daily information of ETo through SMS or phone call. The second provides weekly CWR of the main crops of the region, with the information available in printed table format displayed at the advisory service office or delivered to the farm. The third service provides the IWR of the crops in alignment with the specific cultural practices of the farmer, with information provided by a direct phone call or visit to the farm. The fourth service couples the water balance model with the use of soil moisture content sensors, and information is shared directly to the farm. These four services depend on precision of information that could be used in irrigation advisory. Once the type of services was determined, the tools and equipment required by the service were selected: an automatic weather station, water soil content sensors, and a decision support software tool (MABIA©, which is based on the dual Kc of the FAO-56 approach). These tools were selected mainly due to their low cost and reliability.
To gauge acceptance of this IAS, a survey was conducted with farmers in the irrigated district of Cherfech in Tunisia. The survey confirmed that implementation of the service at the WUA level was possible. Even though only 54% of the farmers were satisfied with the WUA’s work, 77% of farmers were interested in the implementation of IAS at the WUA level, with no statistical significance depending on the farmers’ profiles. This is proof that farmers are looking for easily accessible information, in spite of their age, level of education, or irrigation system they use. Moreover, 92.6% of the farmers judge that the information’s value provided by the services is deemed positive as farmers judged that the perceived benefits are greater than its perceived costs. Relating to the services, 58.8% of farmers selected service 3, because it takes into consideration specific details of each farm and offers excellent accuracy.
Finally, to study the viability of implementing the IAS, a feasibility study was conducted, based on the B/C ratio and the IRR. Coupled with a sensitivity analysis, the results show that implementing an IAS can be technically and financially feasible.

Author Contributions

Conceptualization, M.A., L.R. and A.S.; methodology, M.A., A.S. and L.R.; software, A.S.; validation, A.S. and A.F.; formal analysis, R.N.; investigation, M.A. and R.N.; data curation, R.N.; writing—original draft preparation, M.A.; writing—review and editing, A.S., L.R. and A.F.; visualization, R.N.; supervision, A.S. and L.R.; project administration, A.S. and A.F. All authors have read and agreed to the published version of the manuscript.

Funding

The Study was funded by the project “Cellule d’Alerte à l’irrigation” financed by the Institution of Agricultural Research and Higher Education (IRESA) and partially supported by the project “ICT4Irrigation” financed by the GIZ and conducted by the International Center for Agricultural Research in the Dry Areas (ICARDA) and the Institut National Agronomique de Tunisie (INAT).

Institutional Review Board Statement

Not applicable.

Informed Consent Statement

Not applicable.

Data Availability Statement

Not applicable.

Acknowledgments

The authors thank Linda Fattal and Betty Abrillian from ICARDA for their support in the proofreading process as well as their valuable inputs to the paper. The authors also thank Mokhtar Thebti from the extension service of the ministry of Agriculture for his support during the field surveys.

Conflicts of Interest

The authors declare no conflict of interest.

References

  1. Ara, I.; Turner, L.; Harrison, T.H.; Monjardino, M.; DeVoil, P.; Rodriguez, D. Application, adoption and opportunities for improving decision support systems in irrigated agriculture: A review. Agric. Water Manag. 2021, 257, 107161. [Google Scholar] [CrossRef]
  2. Leib, B.G.; Hattendorf, M.; Elliott, T.; Matthews, G. Adoption and adaptation of scientific irrigation scheduling: Trends from Washington, USA as of 1998. Agric. Water Manag. 2002, 55, 105–120. [Google Scholar] [CrossRef]
  3. Lorite, I.J.; García-Vila, M.; Carmona, M.A.; Santos, C.; Soriano, M.A. Assessment of the Irrigation Advisory Services’ recommendations and farmers’ irrigation management: A case of study in southern Spain. Water Resour. Manag. 2012, 26, 2397–2419. [Google Scholar] [CrossRef]
  4. English, M. Irrigation advisory services for optimum use of limited water. In Proceedings of the FAO/ICID International Workshop on Irrigation Advisory Services and Participatory Extension Management, Montreal, QC, Canada, 24 July 2002. [Google Scholar]
  5. Zema, D.A.; Nicotra, A.; Zimbone, S.M. Improving management scenarios of water delivery service in collective irrigation systems: A case study in Southern Italy. Irrig. Sci. 2019, 37, 79–94. [Google Scholar] [CrossRef]
  6. Thysen, I.; Detlefsen, N.K. Online decision support for irrigation for farmers. Agric. Water Manag. 2006, 86, 269–276. [Google Scholar] [CrossRef]
  7. Allani, M.; Jabloun, M.; Sahli, A.; Hennings, V.; Massmann, J.; Muller, H.W. Enhancing on farm and regional irrigation management using MABIA-Region tool. In Proceedings of the 2012 IEEE 4th International Symposium on Plant Growth Modeling, Simulation, Visualization and Applications, Shanghai, China, 31 October–3 November 2012; pp. 18–21. [Google Scholar]
  8. Mannini, P.; Genovesi, R.; Letterio, T. IRRINET: Large Scale DSS Application for On-farm Irrigation Scheduling. Procedia Environ. Sci. 2013, 19, 823–829. [Google Scholar] [CrossRef] [Green Version]
  9. Smith, M.; Muñoz, G. Irrigation advisory services for effective water use: A review of experiences. In Proceedings of the FAO/ICID International workshop on Irrigation Advisory Services and Participatory Extension Management, Montreal, QC, Canada, 24 July 2002. [Google Scholar]
  10. Ayim, C.; Kassahun, A.; Addison, C.; Tekinerdogan, B. Adoption of ICT innovations in the agriculture sector in Africa: A review of the literature. Agric. Food Secur. 2022, 11, 22. [Google Scholar] [CrossRef]
  11. Haworth, B.T.; Biggs, E.; Duncan, J.; Wales, N.; Boruff, B.; Bruce, E. Geographic information and communication technologies for supporting smallholder agriculture and climate resilience. Climate 2018, 6, 97. [Google Scholar] [CrossRef] [Green Version]
  12. Mariano, M.J.; Villano, R.; Fleming, E. Factors influencing farmers’ adoption of modern rice technologies and good management practices in the Philippines. Agric. Syst. 2012, 110, 41–53. [Google Scholar] [CrossRef]
  13. Giannakis, E.; Bruggeman, A.; Djuma, H.; Kozyra, J.; Hammer, J. Water pricing and irrigation across Europe: Opportunities and constraints for adopting irrigation scheduling decision support systems. Water Sci. Technol. Water Supply 2016, 16, 245–252. [Google Scholar] [CrossRef]
  14. D’Antoni, J.M.; Mishra, A.K.; Joo, H. Farmers’ perception of precision technology: The case of autosteer adoption by cotton farmers. Comput. Electron. Agric. 2012, 87, 121–128. [Google Scholar] [CrossRef] [Green Version]
  15. Nzonzo, D.; Ba, M.A.; Mogambi, H. An Analysis of Communication and Information Communication Technologies Adoption in Irrigated Rice Production in Kenya. Int. J. Educ. Res. 2016, 4, 295–316. [Google Scholar]
  16. Alary, V.; Nefzaoui, A.; Ben Jemaa, M. Promoting the adoption of natural resource management technology in arid and semi-arid areas: Modelling the impact of spineless cactus in alley cropping in Central Tunisia. Agric. Syst. 2007, 94, 573–585. [Google Scholar] [CrossRef]
  17. Llewellyn, R.S. Information quality and effectiveness for more rapid adoption decisions by farmers. Field Crops Res. 2007, 104, 148–156. [Google Scholar] [CrossRef]
  18. Fernández García, I.; Lecina, S.; Ruiz-Sánchez, M.C.; Vera, J.; Conejero, W.; Conesa, M.R.; Domínguez, A.; Pardo, J.J.; Léllis, B.C.; Montesinos, P. Trends and Challenges in Irrigation Scheduling in the Semi-Arid Area of Spain. Water 2020, 12, 785. [Google Scholar] [CrossRef] [Green Version]
  19. Buadi, D.K.; Anaman, K.A.; Kwarteng, J.A. Farmers’ perceptions of the quality of extension services provided by non-governmental organisations in two municipalities in the Central Region of Ghana. Agric. Syst. 2013, 120, 20–26. [Google Scholar] [CrossRef]
  20. Baroni, G.; Drastig, K.; Lichtenfeld, A.U.; Jost, L.; Claas, P. Assessment of Irrigation Scheduling Systems in Germany: Survey of the Users and Comparative Study. Irrig. Drain. 2019, 68, 520–530. [Google Scholar] [CrossRef]
  21. Corcoles, J.I.; Frizzone, J.A.; Lima, S.C.R.V.; Mateos, L.; Neale, C.M.U.; Snyder, R.L.; Souza, F. Irrigation Advisory Service and Performance Indicators in Baixo Acaraú Irrigation District, Brazil. Irrig. Drain. 2016, 65, 61–72. [Google Scholar] [CrossRef]
  22. González-Pavón, C.; Arviza-Valverde, J.; Balbastre-Peralta, I.; Sierra, J.M.C.; Palau-Salvador, G. Are water user associations prepared for a second-generation modernization? The case of the valencian community (Spain). Water 2020, 12, 2136. [Google Scholar] [CrossRef]
  23. Dahmani, M.; Mabrouki, M.; Ben Youssef, A. ICT, trade openness and economic growth in Tunisia: What is going wrong? Econ. Chang. Restruct. 2022, 55, 2317–2336. [Google Scholar] [CrossRef]
  24. Melaouhia, M.; El Bilali, H.; Driouech, N.; Berjan, S.; Bodiroga, R. Agricultural extension and advisory services in Tunisia. In Proceedings of the Sixth International Scientific Agricultural Symposium Agrosym 2015, Jahorina, Bosnia and Herzegovina, 15–18 October 2015. [Google Scholar]
  25. Dhraief, M.Z.; Bedhiaf-Romdhania, S.; Dhehibib, B.; Oueslati-Zlaouia, M.; Jebali, O.; Ben Youssef, S. Factors Affecting the Adoption of Innovative Technologies by Livestock Farmers in Arid Area of Tunisia. FARA Res. Rep. 2018, 3, 22. [Google Scholar]
  26. Abdallah, W.; Allani, M.; Mezzi, R.; Jlassi, R.; Romdhane, A.; Faidi, F.; Daouthi, Z.; Amara, A.; Selmi, H.; Zouabi, A.; et al. A Contribution to an Advisory Plan for Integrated Irrigation Water Management at Sidi Saad Dam System (Central Tunisia): From Research to Operational Support. In Embedding Space in African Society: The United Nations Sustainable Development Goals 2030 Supported by Space Applications, 1st ed.; Froehlich, A., Ed.; Springer: Cham, Switzerland, 2019; Volume 1, pp. 65–79. [Google Scholar] [CrossRef]
  27. Jabloun, M.; Sahli, A.; Mougou, A. MABIA-REGION: A Regional irrigation evaluation and scheduling tool based on the Dual Crop Coefficient Method with Extensions to the original FAO-56 procedure. In Proceedings of the Second WEAP Regional conference Applying a Decision Support System as a Tool for Integrated Water Resources Management and Climate Change Adaptation, Amman, Jordan, 3–4 May 2011. [Google Scholar]
  28. Najm, A.B.; Al-bayati, I.; Sulaiman, S. Improving the Cultivated Area for the Ramadi Irrigation Project By Using Water Evaluation and Planning Model (WEAP). Al-Rafidain Eng. J. 2021, 26, 105–114. [Google Scholar] [CrossRef]
  29. Forni, L.; Bresney, S.; Espinoza, S.; Lavado, A.; Mautner, M.R.L.; Han, J.Y.C.; Nguyen, H.; Sreyphea, C.; Uniacke, P.; Villarroel, L.; et al. Social hydrological analysis for poverty reduction in community-managed water resources systems in Cambodia. Water 2021, 13, 1848. [Google Scholar] [CrossRef]
  30. Ramirez, C.; Joyce, B.; Huber-lee, A. An assessment of strategies for sustainability priority challenges in Jordan using a Water-Energy-Food Nexus approach. Discov. Sustain. 2022, 3, 23. [Google Scholar] [CrossRef]
  31. Bresney, S.R.; Forni, L.; Mautner, M.R.L.; Huber-Lee, A.; Shrestha, M.; Moncada, A.M.; Ghosh, E.; Sopharith, T. Investigating tradeoffs between agricultural development and environmental flows under climate change in the stung Chinit watershed, Cambodia. Hydrology 2020, 7, 95. [Google Scholar] [CrossRef]
  32. Musie, M.; Momblanch, A.; Sen, S. Exploring future global change-induced water imbalances in the Central Rift Valley Basin, Ethiopia. Clim. Chang. 2021, 164, 47. [Google Scholar] [CrossRef]
  33. Olabanji, M.F.; Ndarana, T.; Davis, N. Impact of climate change on crop production and potential adaptive measures in the olifants catchment, South Africa. Climate 2021, 9, 6. [Google Scholar] [CrossRef]
  34. Spykman, O.; Gabriel, A.; Ptacek, M.; Gandorfer, M. Farmers’ perspectives on field crop robots–Evidence from Bavaria, Germany. Comput. Electron. Agric. 2021, 186, 106176. [Google Scholar] [CrossRef]
  35. Lasram, A.; Dellagi, H.; Dessalegn, B.; Dhehibi, B.; Ben Mechlia, N. Farmers’ willingness to adapt to climate change for sustainable water resources management: A case study of Tunisia. J. Water Clim. 2018, 9, 598–610. [Google Scholar] [CrossRef]
  36. Conrad, S.A.; Rutherford, M.B.; Haider, W. Profiling Farmers’ Preferences about Drought Response Policies Using a Choice Experiment in the Okanagan Basin, Canada. Water Resour. Manag. 2017, 31, 2837–2851. [Google Scholar] [CrossRef]
  37. Hashemi, S.M.; Damalas, C.A. Farmers’ Perceptions of Pesticide Efficacy: Reflections on the Importance of Pest Management Practices Adoption. J. Sustain. Agric. 2010, 35, 69–85. [Google Scholar] [CrossRef]
  38. Zubair, M.; Garforth, C. Farm Level Tree Planting in Pakistan: The Role of Farmers’ Perceptions and Attitudes. Agroforest. Syst. 2006, 66, 217–229. [Google Scholar] [CrossRef]
  39. Zairi, A.; Slatni, A.; Mailhol, J.C.; Boubaker, R.; El Amami, H.; Ben Ayed, M.; Rebai, M. Analyse diagnostic de l’irrigation de surface dans les PPI de la basse vallée de la Medjerda. In Proceedings of the Economie de l’eau en irrigation, Hammamet, Tunisia, 14–16 November 2000. [Google Scholar]
  40. Sahli, A.; Allani, M.; Jabloun, M. Ministerial Report: Développement D’outil D’aide à L’irrigation; Ministry of Agriculture: Tunis, Tunisia, 2011. [Google Scholar]
  41. Zou, X.; Cremades, R.; Gao, Q.; Wan, Y.; Qin, X. Cost-effectiveness analysis of water-saving irrigation technologies based on climate change response: A case study of China. Agric. Water Manag. 2013, 129, 9–20. [Google Scholar] [CrossRef] [Green Version]
  42. Cubbage, F.; Davis, R.; Frey, G.; Behr, D.C. Financial and Economic Evaluation Guidelines for Community Forestry Projects in Latin America; Program on Forests (PROFOR) and the World Bank, Latin America and the Caribbean Region: Washington, DC, USA, 2013. [Google Scholar]
  43. Dhaliwal, I.; Duflo, E.; Glennerster, R.; Tulloch, C. Comparative cost-effectiveness analysis to inform policy in developing countries: A general framework with applications for education. In Education Policy in Developing Countries; Glewwe, P., Ed.; University of Chicago Press: Chicago, IL, USA, 2013; Volume 17, pp. 285–338. [Google Scholar]
  44. Altobelli, F.; Marta, A.D.; Heinen, M.; Jacobs, C.; Giampietri, E.; Mancini, M.; Cimino, O.; Trestini, S.; Kranendonk, R.; Chanzy, A.; et al. Irrigation Advisory Services: Farmers preferences and willingness to pay for innovation. Outlook Agric. 2021, 50, 277–285. [Google Scholar] [CrossRef]
  45. Altobelli, F.; Lall, U.; Dalla Marta, A.; Caracciolo, F.; Cicia, G.; D’Urso, G.; Del Giudice, T. Willingness of farmers to pay for satellite-based irrigation advisory services: A southern Italy experience. J. Agric. Sci. 2018, 156, 723–730. [Google Scholar] [CrossRef]
  46. Urso, G.D.; Michele, C.D.; Bolognesi, S.F. IRRISAT: The Italian On-line Satellite Irrigation Advisory Service. In Proceedings of the EFITA-WCCA-CIGR Conference “Sustainable Agriculture through ICT Innovation”, Turin, Italy, 24–27 June 2013. [Google Scholar] [CrossRef]
  47. Chartzoulakis, K.; Psarras, G.; Kasapakis, I.; Bertaki, M. Development and validation of an irrigation scheduling tool for olives to improve water use efficiency at farm level. In Proceedings of the 5th International Conference for Olive Tree and Oil Production (OLIVEBIOTEQ 2014), Amman, Jordan, 3–6 November 2014. [Google Scholar]
  48. Bonfante, A.; Monaco, E.; Manna, P.; De Mascellis, R.; Basile, A.; Buonanno, M.; Cantilena, G.; Esposito, A.; Tedeschi, A.; De Michele, C.; et al. LCIS DSS—An irrigation supporting system for water use efficiency improvement in precision agriculture: A maize case study. Agric. Syst. 2019, 176, 102646. [Google Scholar] [CrossRef]
  49. Vuong, Q.H.; Napier, N.K. Acculturation and Global Mindsponge: An Emerging Market Perspective. Int. J. Intercult. 2015, 49, 354–367. [Google Scholar] [CrossRef]
  50. Sturgis, P.; Patulny, R.; Allum, N.; Buscha, F. Social connectedness and generalized trust: A longitudinal perspective. In Handbook of Research Methods and Applications in Social Capital; Li, Y., Ed.; Edward Elgar Publishing Limited: London, UK, 2015; pp. 76–90. [Google Scholar]
  51. Vuong, Q.H. Mindsponge Theory. 2022. Available online: https://books.google.com/books?id=OSiGEAAAQBAJ (accessed on 28 September 2022).
Figure 1. Organization chart of the considered IAS packages, according to equipment.
Water 14 03638 g001
Figure 2. Localization of the Cherfech irrigated district.
Water 14 03638 g002
Figure 3. Thematic maps of the Cherfech irrigated district (a) farm limits; (b) used irrigation system; (c) hydraulic units; and (d) land use during the growing season.
Water 14 03638 g003
Figure 4. Perception of the prices of the services.
Water 14 03638 g004
Table 1. Variables and descriptive statistic data of the farmers’ features.
VariableDescriptionMinMaxAverageStandard DeviationVariation Coefficient
AGEAge of the Farmer297555.613.624%
LEVELLevel of Education: (1) Illiterate; (2) Koranic School; (3) Primary school; (4) High school; (5) University233**
AREATotal Area of the farm17414.214.3100%
NUM. PLOTSNumber of plots per farm173.91.640%
IRRIG. SYSTIrrigation system used: (1) Surface Irrigation systems; (2) Pressurized Irrigation systems122**
CROP. PATTCropping pattern: Monoculture (1) C, Cereals; (2) F, Forage crops; (3) V, Vegetables; (4) T, Fruit trees; Multi cropping (5) CF; (6) CV; (7) CFV; (8) CFT; (9) CVT; (10) CFVT577**
Note: (*) No data are given since these are qualitative variables.
Table 2. Correlation of the main variables of farmer profiling.
AGELEVELAREANUM PLOTSIRRIG. SYSTCROP. PATT
AGEPearson Correlation1
Sig. (2-tailed)-
N27
LEVELPearson Correlation−0.472 *1
Sig. (2-tailed)0.013-
N2727
AREAPearson Correlation0.2760.2591
Sig. (2-tailed)0.1640.192-
N272727
NUM. PLOTSPearson Correlation0.502 **−0.440 *0.3231
Sig. (2-tailed)0.0080.0220.101-
N27272727
IRRIG. SYSTPearson Correlation0.0630.3810.2550.2121
Sig. (2-tailed)0.7550.0500.1990.287-
N2727272727
CROP. PATTPearson Correlation0.456 *−0.1860.3280.637 **0.2191
Sig. (2-tailed)0.0170.3520.0950.0000.273-
N272727272727
* Correlation is significant at the 0.05 level (2-tailed). ** Correlation is significant at the 0.01 level (2-tailed).
Table 3. Relation between acceptance of the IAS and farmers’ profile parameters.
Level of EducationAgeArea of Farm in haNumber of PlotsCropping PatternIrrigation System
Mann–Whitney U50.00051.50056.00054.50045.00046.500
Asymp. Sig. (2-tailed)0.4310.5020.6830.6130.2620.250
Table 4. Choice of service before and after disclosure of respective prices to farmers.
Service 1 (%)Service 2 (%)Service 3 (%)Service 4 (%)Did not Select Service (%)
Before submission of the prices15.80.047.436.80
After the submission of the prices27.20.054.410.97.4
Table 5. Pearson chi-square test results for each farmer profiling variable.
VariableX2p-Value
Farmer age27.0630.779
Level of education8.8250.357
Farm area37.3130.752
Number of plots10.9310.535
Irrigation system27.0630.941
Cropping pattern4.8410.564
Table 6. Investment costs of the IAS.
MachineryQuantityAsset Value (TND)
Motorcycle13000
Laptop11000
Printer1100
Weather station1500
Data logger155700
Soil water content sensors458100
Total18,400
Table 7. Operating and labor costs.
DescriptionCosts/Month (TND)Costs/Year (TND)
OfficeRent1001200
Office supplies50600
Telecommunications1702040
Mobile unitInsurance15180
Maintenance1001200
Energy2503000
Labor17509000
Total Costs17,220
Publisher’s Note: MDPI stays neutral with regard to jurisdictional claims in published maps and institutional affiliations.